Embed Size (px)
Citation preview
Marine Structures 56 (2017) 237e259
Contents lists available at ScienceDirect
Marine Structures
journal homepage: www.elsevier .com/locate/marstruc
A framework to assess structural integrity of ageing offshorejacket structures for life extension
Ashish Aeran*, Sudath C. Siriwardane, Ove Mikkelsen, Ivar LangenDepartment of Mechanical and Structural Engineering and Materials Science, University of Stavanger, P.O. Box 8600 Forus, N-4036,Stavanger, Norway
a r t i c l e i n f o
Article history:Received 16 December 2016Received in revised form 23 June 2017Accepted 15 August 2017
Keywords:Structural degradationLife extensionOffshore jacketFatigueCorrosion
* Corresponding author.E-mail addresses: [email protected] (A. Aeran)
(I. Langen).
http://dx.doi.org/10.1016/j.marstruc.2017.08.0020951-8339/© 2017 Elsevier Ltd. All rights reserved.
a b s t r a c t
The structural integrity assessment of ageing structures for possible life extension has beenidentified as a growing challenge in the oil and gas industry worldwide. Although theavailable guidelines provide a general assessment process, it is necessary to have moredetailed guidelines. This can be achieved by adding relevant theories and models whichcan capture time-dependent structural degradation more precisely. To address this, a newframework for possible life extension is proposed in this paper. The proposed frameworkprovides more precise corrosion models, new damage theories and assessment guidelinesto predict the remaining fatigue life and check the structural adequacy in all the limitstates during the whole extended service life. Initially, the paper presents the proposedframework in detail. The framework approach is then applied to an ageing jacket as a casestudy and results are compared with conventional approach. The proposed approach re-sults in a remaining life of ten years as compared to one year using the conventionalapproach. Thus, the jacket structure can be safely operated for an additional nine yearsusing the proposed approach. Recommendations are also made on increasing theremaining fatigue life using life improvement techniques. Finally, the applicability, sig-nificance and validity of the proposed framework are discussed.
© 2017 Elsevier Ltd. All rights reserved.
1. Introduction
A number of offshore platforms worldwide are approaching or have already exceeded their design life [1e8]. More than50% of offshore installations on the Norwegian Continental Shelf (NCS), the United Kingdom Continental Shelf (UKCS) and theGulf of Mexico Shelf are currently operating beyond their original life [3,9e12]. This figure is around 70% for around 800platforms in theMiddle East region [13]. The replacement of all these structures at once presents an operational and technicalchallenge [14,15]. The use of infrastructure from an existing field is sometimes a precondition for the development of a neweroil/gas field [16]. The enhanced production and drilling techniques, falling profit margins due to low oil prices, uneconomicalsmall field discoveries and plenty of remaining oil reserves in existing fields are factors which are also encouraging operatorsto undertake more life extension studies. It is important to use the existing infrastructure efficiently and estimate itsstructural integrity and remaining service life more accurately.
, [email protected] (S.C. Siriwardane), [email protected] (O. Mikkelsen), [email protected]
A. Aeran et al. / Marine Structures 56 (2017) 237e259238
Ageing was recently categorized as functional ageing, technological ageing, knowledge based ageing and organizationalageing [8,17e20]. While the functional ageing includes material degradation issues such as fatigue, corrosion, dents, damagesetc., technological ageing may refer to the old standards and regulations that are no longer considered sufficient for safedesign. Knowledge based ageing may occur in cases where original design documents have become outdated due to avail-ability of new knowledge such as new analysis methods, newmodels, new standards etc. Organizational ageing is the ageingof personnel and insufficient competence. While each of these key issues are important while addressing the problems ofageing, material degradation caused by fatigue and corrosion is a major cause of failures. Fatigue is a major hazard for offshorestructures and in some cases fatigue cracking may reduce the overall structural integrity [21]. Corrosion changes the me-chanical properties (i.e. degrades the strength) of steel with time [22]. Uniform corrosion is the most common form and cancause local structural collapse due to changes in structural stiffness [3,23,24]. Localized corrosion such as pitting and crevicecorrosion is restricted to small areas and can cause local stress concentrations [25]. Corrosion fatigue is the result of cyclicloading in a corrosive environment and may reduce the fatigue strength by more than 60% for various corrosion levels [26]. Acorrosion protection system (CPS) is generally employed to counteract corrosion but has a typical life of only 5e15 years [27].It is ineffective in the splash zone due to the intermittent action of waves and tides [28]. Also, localized corrosion can starteven before CPS loses its effectiveness [29]. The maintenance and repair of CPS for fixed offshore structures are generally verycostly and sometimes impractical [30]. Other degradation mechanisms include erosion, creep, hydrogen related cracking,damage, blockages and accumulated plastic deformation [19,20]. It is reported that more than 60% of leaks on hydrocarbonsystems are caused by ageing processes [18]. These ageing mechanisms can cause serious damage and even lead to majorstructural collapse. Although much research is carried out on ageing processes, failure has occurred and is still occurring inoffshore structures [31]. Also, there are several uncertainties involved in fatigue assessment of ageing structures. Theseuncertainties can exist due to stochastic nature of the wave motion, dispersion in material characteristics of corrodedmembers, scatter in the considered S-N curve for corroded detail, use of empirical relations in determining of stress factorsand others. Such uncertainties together with poor inspection planning increases the risks of failures [32]. It is reported thatthe most severe accidents induced by fatigue were caused by gross errors like the absence of fatigue design check, bad designdetailing and gross fabrication defects [32]. There is a need for detailed design checks using more precise assessmentguidelines and a better understanding of complex ageing mechanisms.
Over the past two decades, a significant amount of research has been carried out to understand ageing and associatedmechanisms. A number of initiatives have been taken in respect of the development of assessment guidelines and aframework for the life extension of aged structures. Also, attention was paid on the development of risk based inspectionguidelines for the planning of inspection for fatigue cracks [33]. The Health and Safety Executive (HSE) has launched severalkey programmes (KP) on the UKCS, including a detailed investigation of ageing installations [34e36]. On the NCS, the Nor-wegian Oil Industry Association (OLF), together with the Petroleum Safety Authority (PSA), is establishing the necessaryassessment guidelines [4,10,37]. The inclusion of the assessment procedures and frameworks for existing structures started inthe mid-1990s with the insertion of a section in API RP 2A [38]. However, both the input and acceptance criteria given are tiedto US waters. Subsequently similar sections were added to ISO 2394 in 1996 [39]. This was followed by ISO 13822 in 2001 [40]and ISO 19900 in 2002 [41]. The last addition to the international standards was an assessment section in ISO 19902 in 2007[42], but it contains only minimal detailed or quantitative information [5]. In the UK, a structural integrity managementframework for jacket structures was issued by the HSE in 2009 but was again based on API and ISO standards [43]. Around thesame time, OLF and PSA initiated a project to establish the necessary standards and guidelines for life extension projects in theNCS region [37]. The outcome was the establishment of a new NORSOK standard N-006 [44] and the issue of recommendedOLF guidelines [45] for the life extension of facilities. In 2014, API released a new standard, API RP 2SIM [46]. In 2015, a newDNV guideline was established on the use of probabilistic methods for planning of inspections for fatigue cracks in offshorestructures [33]. It recommends the modelling of uncertainty variables (such as physical uncertainty, statistical uncertainty,measurement uncertainty) as stochastic variables, each having a defined probability distribution function based on engi-neering judgement, past experiences from similar problems or analytical results [47]. The British Standard BS 7910 is also animportant document for probabilistic inspection planning methods such as RBI [48]. In addition to the above standards, lifeassessment guidelines and frameworks, which describe the overall assessment process, were discussed by researchers in thepast [19,49e51]. These standards and the published literature provide a general assessment process for offshore structuresand some procedures for the fatigue integrity assessment of details which cannot be inspected for fatigue cracks. However, itis advisable to have more detailed guidelines for offshore jackets; this can be achieved by adding relevant theories andmodels, which can capture the time-dependent structural degradation more precisely. Recommendations, which can esti-mate structural degradation in the absence of any corrosion measurement data or in cases where no significant corrosion isobserved, are also necessary. The available guidelines are not sufficient to choose precise fatigue strength curves, whichrepresent the time-dependent localized structural changes such as localized corrosion, dent, cracks, etc. Furthermore,recently proposed fatigue damage theories have not been included for a more accurate estimation of remaining fatigue life.
To overcome the above problems, this paper proposes a new framework for structural integrity assessment for the lifeextension of ageing jacket structures. The proposed framework provides the theories and guidelines necessary to predict theremaining fatigue life and check the structural adequacy in ULS, SLS and ALS during the whole extended service life. Theproposed framework also provides recommendations on various issues such as simulation of time-dependent structuraldegradation, precision of loading history, effect of localized corrosion on stress concentration factors, selection of properfatigue strength curves, determination of stress cycles and planning for mitigation and strengthening. Recently suggested,
A. Aeran et al. / Marine Structures 56 (2017) 237e259 239
more precise fatigue damage theory is also included in the proposed framework. Initially, the paper presents the proposedframework in detail. Then, the significance of ageing is highlighted quantitatively through a case study performed on anageing offshore jacket structure. The structure is assessed using the proposed framework, as well as conventional approaches,and the remaining lives are compared. Finally, conclusions are drawn and recommendations are made on the use of theproposed framework for a more precise structural integrity assessment.
2. Proposed framework for structural integrity assessment and life extension
This section proposes a framework for structural integrity assessment and a more precise estimation of the remaining lifeof an ageing jacket structure. The assessment should be carried out for all limit states, i.e. ULS, SLS, ALS and FLS. The FLS isconsidered themost critical limit state as fatigue is the primary source of failure inwelded structures and the remaining life ismainly governed by fatigue criteria [52,53]. The FLS being the most critical limit state may not always be true, particularly inbenign waters. However, almost 25% of all structural damage requiring repair on offshore installations is classified underfatigue damage [54]. Fatigue in interaction with corrosion results in corrosion fatigue and can reduce the remaining life quitesignificantly. The uncertainty in the input parameters, such as loading history and stress concentration factors, also affects theremaining life predictions. It is important to determine these parameters more precisely for a more accurate prediction of theremaining life. The proposed framework provides precise corrosion models, new damage theories and assessment guidelinesto predict the remaining fatigue life more accurately. The structural adequacy is checked for all other limit states as well.Finally, recommendations are made on strengthening mitigations and inspection/maintenance plans during the extendedlife. It is noted that, for a single structure, the assessment procedure might involve going through all paths of the framework,depending on the different degradation states of the fatigue critical details. Also, the proposed framework can be used forboth deterministic and probabilistic analysis approaches. While the deterministic approach requires the use of design values(mean plus two standard deviation) of the parameters in the proposed framework, the probabilistic approach involves the useof a distribution function for each of these parameters. These distribution functions can be imported in probabilistic finiteelement method employed simulation tools and hence the failure probability of the structure can be determined. The use ofsuch probabilistic tools can be computationally demanding for complex structures.
The framework is divided into five blocks, block A to block E, as shown in Fig. 1. These blocks include several stages of anassessment process from data collection to strengthening mitigations. A brief outline of various fatigue assessment ap-proaches is presentedwith recommendations for selecting a suitable approach in Block A. Recommendations are made on thesimulation of structural degradation and past loadings in the available finite element models in Block B and Block C.Guidelines on the selection of the proper fatigue strength curve for the selected detail are also included, followed by damagecalculations usingMiner's rule and the recently developed damage theories in Block D. Remaining life is estimated at the end,and recommendations are made on possible strengthening mitigations in Block E. The proposed framework is shown in Fig. 1,and a detailed explanation about each block is given in the following sub-sections.
2.1. Data collection, screening and selection of fatigue assessment approach (Block A)
Data and information collection is the first and one of the most important stages in an assessment study. The details of thedata collection, screening and selection of fatigue assessment approaches are shown in Block A of the framework presented inFig. 1. Documentation from the design phase and operational phase, as well as from the expected extended phase, should becollected as explained below.
2.1.1. Documentation during design, fabrication and installation phaseThese include design documents, structural drawings, loading details, structural calculations, available finite element
models, as well as fabrication and installation reports. Any reports of accidents during the lifting, transportation andinstallation phase should be collected. In addition, it is important to collect all the initial codes and standards used during thedesign phase.
2.1.2. Documents during the operational phaseThese include documentation of any accidents and incidents during the service life, damage and modifications to the
structure, risk assessment reports, as well as any modified finite element models of the structure. It is important to collect allinspection and maintenance reports, as well as any material-testing reports, to document the status of the structuraldegradation and any potential fatigue cracks. It is also important to list all the findings and repairs that are carried out duringthe operational phase.
2.1.3. Documents during the extended life phaseThese include expected operational as well as environmental loads. Information regarding any modifications required to
cater for future needs, in terms of both technology and equipment, should be collected. The current set of codes and standardsaddressing the life assessment and life extension also need to be documented.
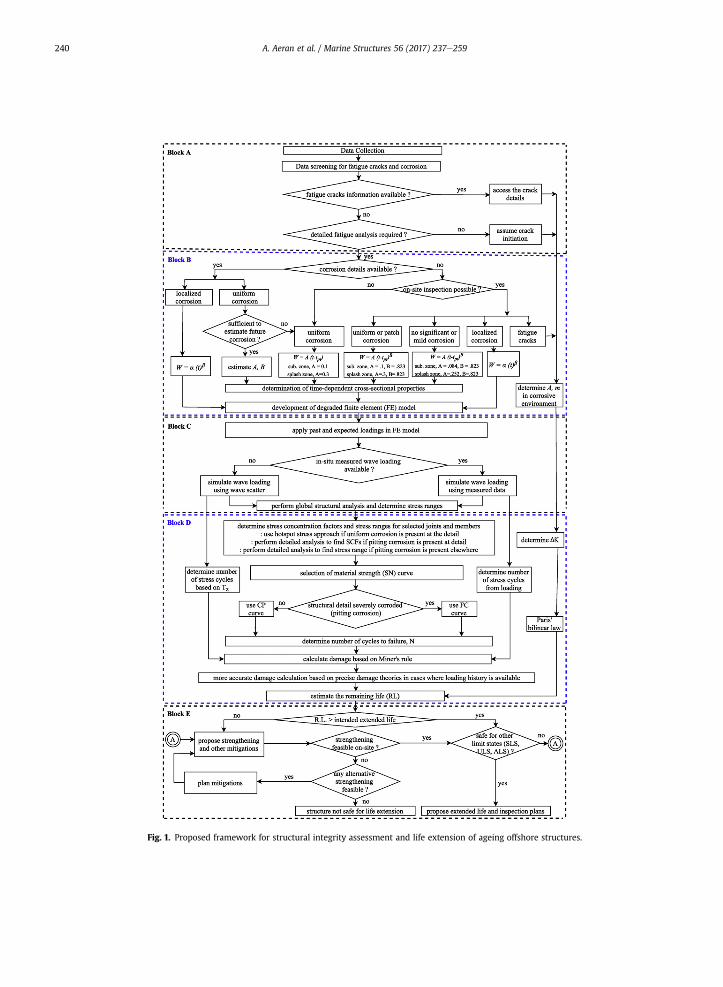
Fig. 1. Proposed framework for structural integrity assessment and life extension of ageing offshore structures.
A. Aeran et al. / Marine Structures 56 (2017) 237e259240
A. Aeran et al. / Marine Structures 56 (2017) 237e259 241
2.1.4. Selection of fatigue assessment approachThe collected data should be screened for all structural degradation information, including extent of structural degra-
dation, member thickness measurements and fatigue cracks. The selection of a suitable fatigue assessment approach is anessential part of any assessment process. For offshore structures, two well-known fatigue life assessment approaches are: (a)the damage tolerance approach and (b) the safe life approach [55,56]. The damage tolerance approach assumes the existenceof a fatigue crack and then estimates the future life, using crack propagation theories, while the safe life approach estimatesthe crack initiation and propagation life, using detailed category-based fatigue strength curves. It is known that the crackinitiation life of a structural element is much higher than the crack propagation life [56]. The industry practice for the fatiguedesign of offshore jacket structures is based on the use of the safe life approach and is also recommended in design standards[57,58]. Moreover, it is recommended that the damage tolerance approach be used where fatigue crack information isavailable, such as in cases of existing ageing structures. In such cases, the safe life approach is no longer applicable after a crackhas initiated. The linear elastic fracture mechanics can describe the probable crack behaviour and its propagation towards thefinal failure.
2.1.4.1. Safe life approach e S-N method. The safe life approach is based on S-N curves of detail category. In this assessmentmethod, a more accurate prediction of remaining life can be made using recently proposed precise damage theories [59e61].For a detailed fatigue assessment of tubular joints in jacket structures, hot spot stress based Tcurve should be carefully chosenbased on the extent of corrosion at the joint [58]. In cases where detailed fatigue assessment is not required, remaining lifecan be predicted by assuming a crack initiation and using the damage tolerance approach based on linear elastic fracturemechanics.
2.1.4.2. Damage tolerance approach - linear elastic fracture mechanics method. This method is based on the crack growth law,which can be represented by several models [48,62e64]. The most frequently used conventional model is Paris' law as givenin Eq. (1) [65].
dadN
¼ AðDKÞm (1)
where da/dN is the crack growth rate,DK is the stress intensity factor range, A andm are the constants that depend onmaterialand the applied conditions, including environment and cyclic frequency. A re-assessment of the available test data for fatiguecrack growth rates was made in 1998 to capture the environmental effect on these constants and recommendations are alsoavailable on the use of more precise two-stage relationships [48,66e68]. The stress intensity range DK can be expressed asshown in Eq. (2).
DK ¼ Kmax � Kmin (2)
where Kmax and Kmin are themaximum andminimum stress intensity factor corresponding to maximum andminimum stressranges. The stress intensity factors for tubular joints can be determined numerically using a finite element or boundaryelement analysis of the joint. Alternatively, analytical solutions are provided by standards, which are deduced from semi-elliptical cracks in plates [48]. The other parameters of the crack propagation curve (A, m) can also be found in standards [48].
2.2. Simulation of degradation and development of degraded FE models (Block B)
The structural degradation should be simulated, and degraded FE models should be developed as per Block B of theframework presented in Fig. 1. The collected data is further screened for all available structural degradation information. Thisincludes all the past inspection reports and thickness measurement records, as well as the current status of degradation in thestructure. It is recommended that the finite element (FE) model of the structure should first be developed using this availableinformation. Any geometrical modifications to the structure during the installation and operational phase should bemodelled. The jacket and the topside should be modelled in finite element software using the beam/frame elements. Inaddition, precise modelling of the foundation should be carried out, using the available soil stiffness information. The finiteelementmodel should be verified against any available structural dynamic responsemeasurement data; modifications shouldthen be performed to account for the effect of time-dependent structural degradation of the structure. This model is namedthe “degraded FE model”, and the simulation of degradation is explained in detail below.
2.2.1. Simulation of uniform corrosionUniform corrosion is the most common form of corrosion and is uniformly distributed on the surface. This results in the
reduction of member thickness and thereby the reduction of the effective cross-sectional properties of the members, such aseffective area, second moment of area, torsional constants and warping constants. This may cause change in the overallstiffness of the structure and the structural response (i.e. stress, displacement and dynamic characteristics). It is essential toaccurately include the time-dependent effect of uniform corrosion in the finite element model, using suitable corrosionwastage models. Several studies have shown that uniform corrosion can be simulated with a good approximation by a
A. Aeran et al. / Marine Structures 56 (2017) 237e259242
nonlinear function [69e75]. The nonlinear corrosion wastage model assumes no degradation in the first phase when theprotection system is effective. This is followed by a nonlinear process of growth over time, as shown in Eq. (3).
WðtÞ ¼ A�t � tpt
�B (3)
whereWðtÞ is the thickness wastage inmillimetres, t is the lifetime and tpt is the corrosion protection time in years. Themodel
has two parameters, A and B, whose values should be precisely determined. The standard deviation of the thickness wastageis given by Eq. (4) [76,77].sWðtÞ ¼ 0:67 WðtÞ (4)
2.2.2. Simulation of localized corrosionPitting is a localized form of corrosion and is regarded as one of the most hazardous types of corrosion for offshore
structures [78,79]. Such localized corrosion is very likely to occur in the splash zone area, where corrosion protection systems(CPS) are ineffective [80]. Also, pitting corrosion may even start before the CPS loses its complete effectiveness [29]. Althoughpitting corrosion has no significant effect on the global stiffness of the structure, it can cause local stress concentrations at thestructural detail and thus reduce the fatigue life [25,81,82]. It is therefore essential to take pitting corrosion into account,while determining stress concentration factors at the corroded structural detail. It is recommended that, in addition to theglobal structural analysis, a local stress analysis be performed near the pits to determine secondary stresses and estimate thefatigue life more precisely. The pit depth has been acknowledged as a critical factor for pitting corrosion and is the keyparameter to describe the pitting rate [78]. The propagation of pit depth is conventionally described by a power-law model[83], analogous to that for uniform corrosion, and is shown in Eq. (5). Moreover, no coating period (tpt) is considered, as pittingcorrosion can start even in the presence of CPS.
WðtÞ ¼ aðt � tiÞb (5)
whereW(t) is the propagation of pit depth, ti is the pit nucleation time and t is the pit propagation time. In practice, the time
for the pit nucleation (ti) is negligible compared to the pit propagation time [84]. Hence the pit growth is usually described byEq. (6).WðtÞ ¼ aðtÞb (6)
The a and b are model parameters and should be determined precisely. Wang et al. [85] also proposed a simple engi-neering model by adopting a two-parameter (m, a) Weibull function to describe the growth of macro-pits in the function ofexposure time, as given in Eq. (7). The corresponding pit growth rate is given by Eq. (8).
WðtÞ ¼ dm�1� exp
�� ½aðt � tiÞ�m��
(7)
W 0ðtÞ ¼ dmmaðt � tiÞm�1exp�� ½aðt � tiÞ�m
�(8)
where m and a are the shape and scale parameters respectively, and dm is the long-term pit depth. For the shape parametergreater than 1, the pit growth rate shows an increasing phase, followed by a maximum and a decreasing phase. The pittingcorrosion rates drop monotonically for m � 1. This new model is only applicable to the growth phase of macro-pits. Moreguidelines on the selection of these parameters can be found in Wang et al. [85].
2.2.3. Time-dependent sectional properties of corroded cross sectionsThe cross-sectional properties of the members or locations where uniform or patch corrosion is observed should be
modified as per the time-dependent thickness reduction, Eq. (3). These modified cross-sectional properties are used todevelop a degraded FE model. Such a change is not required for members where pitting corrosion is observed, as there is nosignificant loss of material and hence no significant reduction in the stiffness.
The effective cross-sectional area of a corroded section is given by
Aeff ðtÞ ¼ A0 �Xn
i¼1
WiðtÞli (9)
where Aeff is the effective area, A0 is the initial cross-sectional area, li is the length of uniform corrosion spread over the crosssection at the ith corroded surface, as shown in Fig. 2(a). The Wi (t) is the average corrosion penetration in mm at the ith
corroded surface of the cross section, and t is the age in years.The reduction in the member cross section shifts the neutral axis by a distance, e(t). This shift can be obtained using Eq.
(10).
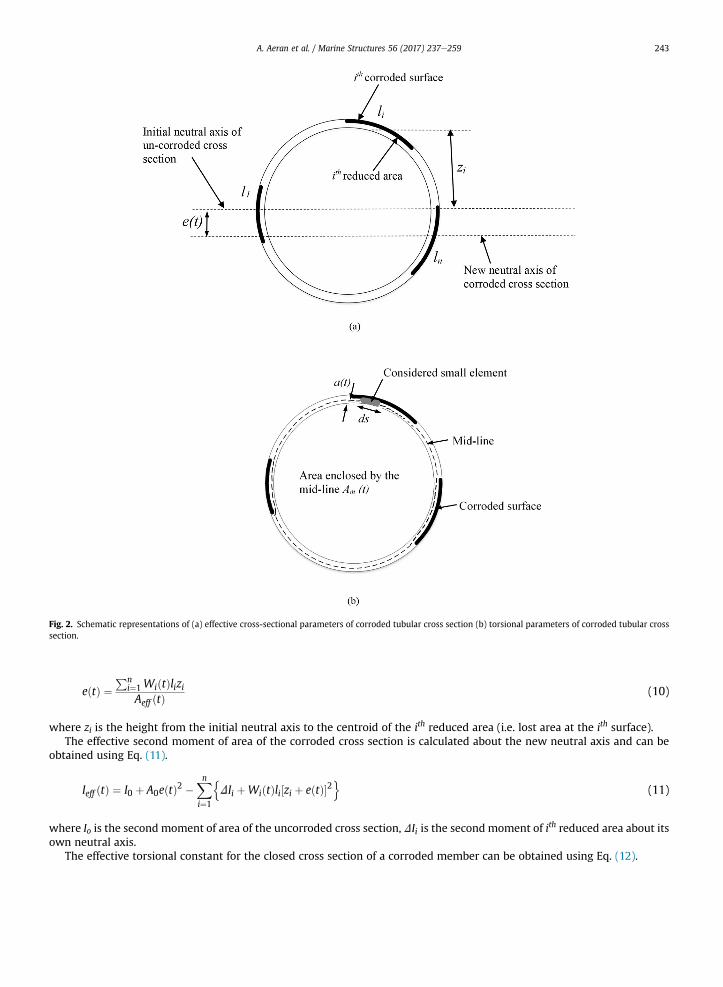
Fig. 2. Schematic representations of (a) effective cross-sectional parameters of corroded tubular cross section (b) torsional parameters of corroded tubular crosssection.
A. Aeran et al. / Marine Structures 56 (2017) 237e259 243
eðtÞ ¼Pn
i¼1 WiðtÞliziAeff ðtÞ
(10)
where zi is the height from the initial neutral axis to the centroid of the ith reduced area (i.e. lost area at the ith surface).The effective second moment of area of the corroded cross section is calculated about the new neutral axis and can be
obtained using Eq. (11).
Ieff ðtÞ ¼ I0 þ A0eðtÞ2 �Xn
i¼1
nDIi þWiðtÞli½zi þ eðtÞ�2
o(11)
where Io is the second moment of area of the uncorroded cross section, DIi is the second moment of ith reduced area about itsown neutral axis.
The effective torsional constant for the closed cross section of a corroded member can be obtained using Eq. (12).
A. Aeran et al. / Marine Structures 56 (2017) 237e259244
IT;eff ðtÞ ¼4AmðtÞ2Hds=aðtÞ
(12)
where Am (t) is the area enclosed by the midline of the cross section as shown Fig. 2(b). The enclosed area Am (t) keeps shiftingwith time due to a continuous shift in the midline as a result of corrosion. The ds is the developed midline length and a(t) isthe thickness of the considered small element of the cross section.
The thickness a(t) of the considered small element of the cross section can be written at a time t using Eq. (13).
aðtÞ ¼ a0 �WðtÞ ; when t > tpt ; aðtÞ ¼ a0 ; when t � tpt (13)
where a0 is the thickness of an uncorroded small element,W (t) is the average corrosion penetration inmm at the consideredlocation and tpt is the corrosion protection time in years.
2.2.4. Parameters of uniform corrosion modelThe average corrosion penetration is the corrosionwastage due to uniform corrosion and can be determined using Eq. (3).
The values of parameters A and B can be determined by fitting previous corrosion measurements with a proposed nonlinearvariation in Eq. (3). However, if the corrosion details are insufficient for the estimation of the above parameters, it is rec-ommended that the values be selected conservatively from Table 1. The values of these parameters can be found in the workof several researchers [27,28,32,76,77]. It is suggested to ignore any remaining potential of sacrificial anodes. This is to havesome conservatism in the estimation of remaining life.
2.2.5. Parameters of localized corrosion modelIn addition to accounting for uniform corrosion in global analysis, it is recommended that a local stress analysis be per-
formed near the pits to determine secondary stresses, if precise fatigue assessment is required. The pits can be simulated asper the corrosion model explained in Eq. (6). The parameters a and b can be taken based on the material type, as per Table 2[86,87].
2.2.6. Parameters of crack growth law in marine environmentThe material parameters, A and m, in Paris' law, are influenced by the surrounding environment and need to be correctly
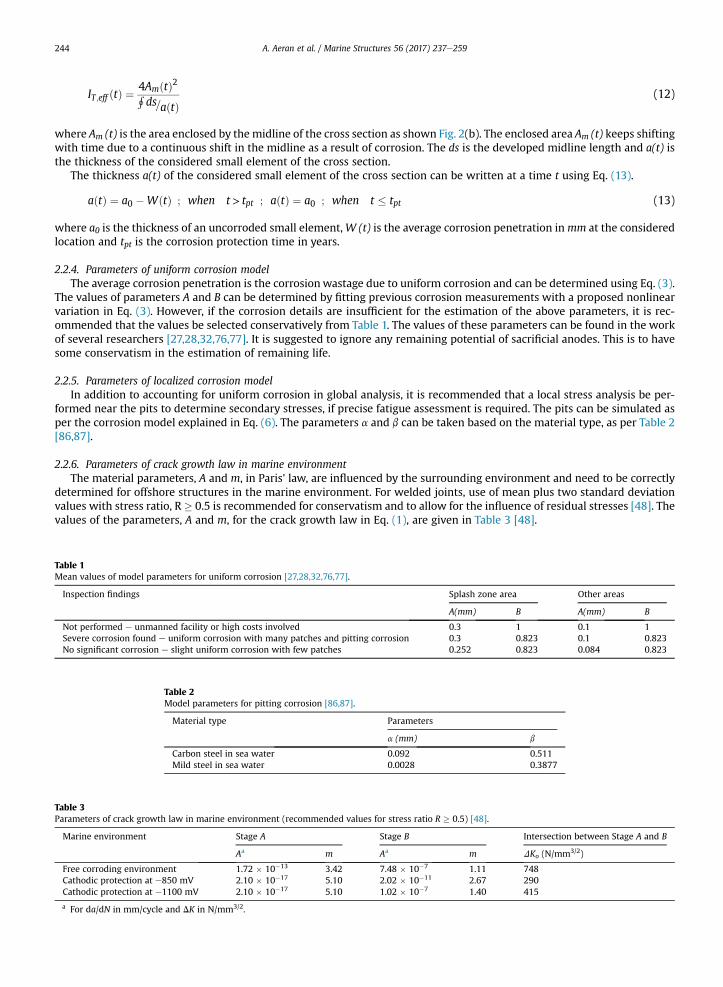
determined for offshore structures in the marine environment. For welded joints, use of mean plus two standard deviationvalues with stress ratio, R � 0.5 is recommended for conservatism and to allow for the influence of residual stresses [48]. Thevalues of the parameters, A and m, for the crack growth law in Eq. (1), are given in Table 3 [48].
Table 1Mean values of model parameters for uniform corrosion [27,28,32,76,77].
Inspection findings Splash zone area Other areas
A(mm) B A(mm) B
Not performed e unmanned facility or high costs involved 0.3 1 0.1 1Severe corrosion found e uniform corrosion with many patches and pitting corrosion 0.3 0.823 0.1 0.823No significant corrosion e slight uniform corrosion with few patches 0.252 0.823 0.084 0.823
Table 3Parameters of crack growth law in marine environment (recommended values for stress ratio R � 0.5) [48].
Marine environment Stage A Stage B Intersection between Stage A and B
Aa m Aa m DKo (N/mm3/2)
Free corroding environment 1.72 � 10�13 3.42 7.48 � 10�7 1.11 748Cathodic protection at e850 mV 2.10 � 10�17 5.10 2.02 � 10�11 2.67 290Cathodic protection at e1100 mV 2.10 � 10�17 5.10 1.02 � 10�7 1.40 415
a For da/dN in mm/cycle and DK in N/mm3/2.
Table 2Model parameters for pitting corrosion [86,87].
Material type Parameters
a (mm) b
Carbon steel in sea water 0.092 0.511Mild steel in sea water 0.0028 0.3877
A. Aeran et al. / Marine Structures 56 (2017) 237e259 245
2.2.7. Feasibility of on-site inspectionsIn cases where degradation/corrosion information is not available, it is recommended to explore the possibilities of on-site
inspections. These inspections can be limited and should contain at least some thickness reductionmeasurements, alongwithphotographs. Several non-destructive monitoring techniques are used in industry for evaluating the corrosion resistance ofmaterials and detecting fatigue cracks without causing damage. A brief description of non-destructive testing (NDT) methodsis presented by past researchers [88e90]. Simpler detection methods like general visual inspection (GVI) and close visualinspection (CVI) cannot be used to detect small fatigue cracks. In such cases, other methods like flooded member detection(FMD), eddy current (EC), magnetic particle inspection (MPI) and alternating current field measurement (ACFM) should beused together with the probability of detection (PoD) curves. Among these, EC method may be preferred for ease of mea-surement and for its provision of a direct measurement of thickness loss, i.e., corrosion rate [91]. The PoD curves representsthe probability of detecting a crack depending on the method used and working conditions such as location of crack withrespect to water level or the visibility conditions at hot spot areas [47,92]. The distribution functions for the PoD curves aredependent on qualification and execution of work but can also be taken from recommended guidelines [47]. While doing theon-site inspections, special attention should be paid to the hot spot areas in the splash zone.
The degraded FE model should be developed based on the on-site inspection findings. The uniform or patch type ofcorrosion can be simulated using themodel parameters given in Table 1. It is advisable to take parameters on the conservativeside if inspections are not performed or if the details are subjected to severe corrosion. Any findings of localized pittingcorrosion should be accounted for precisely to determine the model parameters of Eq. (6) or to check the accuracy of theavailable/determined model parameters of the pitting corrosion wastage model given in Table 2. The stress concentrationfactors should be calculated in cases where pitting corrosion is observed at the fatigue critical details. Localized corrosionfound on the members should be accounted for by modelling them in detail and performing a more detailed local stressanalysis. As discussed above, the modification of cross-sectional properties should not be required for the members/locationswhere pitting corrosion has been recognized, if there is no significant change in the stiffness or stability of the member. It isrecommended that the damage tolerance approach be used in cases where fatigue cracks are found during the on-site in-spections. The parameters of the bilinear law should be determined based on the extent of corrosion at the crack location andas per Table 3.
2.2.8. Corrosion fatigueThe mechanical degradation of material, when the structure is subjected to repetitive cyclic stress in the presence of a
corrosive environment, is corrosion fatigue. This is a failure mechanismwhich is not yet fully understood [93]. However, it canhave a significant impact on the fatigue life, reducing it by more than 60% for various corrosion levels [26]. Although theprecise modelling of this mechanism is a complex task, it is essential to take it into reasonable consideration for life extension.
2.3. Simulation of loading and structural analysis (Block C)
The past and future loading should be applied, and structural analysis should be performed as per Block C of theframework presented in Fig. 1. The collected data should be screened for all past loadings over the design life of the structure.These include operational loads as well as environmental loads. The operational loads should be updated for any changesduring the lifetime of the structure, based on inspection andmaintenance records. In cases where sufficient information is notavailable or data records are missing, it is recommended that operational load values be taken from the design standards[38,42,58,94]. Any additional requirements for higher operational loadings during the extended life should be simulated inthe degraded FEmodel. The environmental loads includemainly thewave and the current loading. It is advisable to use a 100-year return period wave for ultimate limit state assessment and a 10000-year return wave for accidental limit stateassessment. The wave and current parameters for the above-mentioned return periods can be taken from the original designdocuments. In cases where the information is missing, the recommendation is to take these values from the design standards[38,42,58,94]. For the fatigue limit state assessment, the data collected during the operational phase should be screened forany records of real wave measurements. Such available data should be employed for estimating the past and future waveloading on the structure at the specified location. In cases where no wave measurement data is available, the wave envi-ronment can be approximately simulated using the long-term wave scatter diagram for the specified location. The wavescatter diagrams can be either found in the design documents or taken from design standards.
The structure should be analysed for past as well as future loadings. The load cases and load combinations can be made asper the standards for the various limit states. It is recommended to first perform a quasi-static analysis to ascertain the overallintegrity of the structure. A linear elastic analysis should be performed for a preliminary estimation of the overstressedmembers in ultimate limit state. Such a preliminary analysis is required to screen critical locations for a detailed fatigueassessment. In cases where preliminary analysis results are found to be severe with plenty of overstressed locations, per-forming a nonlinear analysis is recommended for more precise analysis. The nonlinear analysis should capture both thegeometrical and thematerial nonlinearities. Based on the ultimate limit state preliminary analysis, critical locations should beidentified for a detailed fatigue assessment. For a detailed fatigue assessment, a suitable fatigue assessmentmethod should beselected depending upon the sensitivity of the structure to dynamic effects.
A. Aeran et al. / Marine Structures 56 (2017) 237e259246
2.3.1. Fatigue assessment methods for jacket structuresTwo different methods are used for the fatigue analysis of jacket structures. These are deterministic discrete wave fatigue
analysis (deterministic fatigue analysis) and frequency response fatigue analysis (frequency domain fatigue analysis, spectralfatigue analysis or stochastic fatigue analysis). The deterministic approach requires calculation of fatigue damage for each seastate in the wave scatter diagram to determine the total fatigue damage. This approach is traditionally preferred for jacketstructures in low to moderate water depths as these are not sensitive to dynamic effects [47,53,58,94]. A stochastic fatigueanalysis is generally performed for structures with significant dynamic response such as deep-water structures and requiresthe determination of hydrodynamic transfer functions [47,53,58,94]. It is recommended to perform a deterministic fatigueanalysis for jacket types structures in low tomoderatewater depths [47,53,58,94]. For deep-water jackets with a fundamentalnatural period exceeding 2.5 s, a deterministic fatigue analysis may still be recommended by determining a dynamicamplification factor using recommended guidelines [47,53].
The fatigue assessment should be performed for the critical locations using the available loading history or wave scatterdiagram. It is advisable to apply wave loading from 0 to 180� at 30-degree spacing. A suitable wave theory should be used,depending upon the water depth at the location as well as the wave parameters [95,96]. The wave loads should be applied,together with permanent and variable loads, to capture the mean stress effects. The load combinations should be as perstandard codes and guidelines. A nonlinear structural analysis is recommended for the determination of stresses in themembers for each sea state of the wave scatter diagram.
2.4. Stress evaluation and estimation of remaining fatigue life (Block D)
Analysis should be performed to determine stress ranges and to estimate the remaining fatigue life as per Block D of theframework presented in Fig. 1.
2.4.1. Evaluation of stress ranges at the critical locationsThe analysis should be performed for each sea state of the wave scatter, and the maximum stress range should be
determined for all the members at the critical joints/locations identified in Section 2.3. The hot spot stress (HSS) approach iswidely used for the fatigue assessment of jacket structures. The presence of uniform corrosion reduces the member thicknessuniformly and hence it is still reasonable to use the HSS approach for such cases. The stress concentration factors (SCFs) can bedetermined as per standard codes and guidelines, and the superposition method can be applied to determine the maximumhot spot stress range [58]. The HSS approach can also be applied at the joint detail if localized corrosion is present at a distanceof more than four times the member thickness [58]. In cases where localized corrosion is present at the detail, a compre-hensive detailed local analysis is recommended. This can be done by making a separate finite element model of the detail,including the pits and amore refinedmesh. The local secondary stress state should be determined, and use of the notch stressapproach is advised for fatigue life assessment. In the presence of localized corrosion away from the joint detail (at a distanceof more than four times the member thickness), a comprehensive detailed local analysis should be performed separately. Themember with pits should be modelled considering required mesh sensitivity, and local stresses should be evaluated toidentify the most critical locations. The maximum stress ranges at this location can then be utilized to determine the fatiguelife, using a suitable S-N curve. Alternatively, the pits can also be assumed to be dents, and the stress concentration factors canbe determined using the formulae for dents provided in the standards or textbooks [97]. The stress ranges are employed forfatigue life estimation, using either the safe life or the damage tolerance approach. Life estimation using the safe life approachis firstly discussed; this is followed by the damage tolerance based linear elastic fracture mechanics method.
2.4.2. Selection of fatigue strength (S-N) curveThe selection of a suitable S-N curve depends on the type of detail category and the method used for stress evaluation. The
current state of degradation at the detail category also influences the selection of S-N curve, as surface roughness andhydrogen embrittlement are the governing factors of fatigue strength. It is recommended to use a free corrosion (FC) curve inthe cases where severe uniform and pitting corrosion are found at the detail. The cathodic protection (CP) S-N curve can beused for corrosion-free details. For tubular joints in jacket structures, hot spot stress based Tcurve can be selected from designstandards and recommended practices [58]. The number of actual stress cycles (n) can be determined using the zero up-crossing time period for the corresponding sea state of the wave scatter diagram [58,98]. The stress cycles can be countedfrom the measured wave loading history, if available.
2.4.3. Calculation of fatigue damageThe yearly fatigue damage for each sea state can be calculated using Miner's rule [56,99]. The yearly fatigue damage
covering all sea states can be calculated using Eq. (14) as per standard codes [100].
DL ¼Xns
i¼1DiPi (14)
where DL is the yearly fatigue damage covering all sea states, ns is the number of discrete sea states in the wave scatter di-agram, Di is yearly fatigue damage for individual sea states and Pi is the sea state probability. A design fatigue factor (DFF)
A. Aeran et al. / Marine Structures 56 (2017) 237e259 247
should be considered in the damage calculations depending upon the consequence of fatigue failure and the probability ofinspection and repair. The DFF can be obtained from the design standards and recommended practices [47,58,94,101]. A highvalue of DFF represents a reduced probability of fatigue cracking and a value of 10 is recommended for areas not accessible forinspection and repair. This value can also be used if it is desired to omit future scheduled inspections during the extended lifeof the structure.
The fatigue damage can be determined using the Miner's rule where loading history is unknown. However, under variableamplitude loading conditions, Miner's rule can lead to unreliable predictions of remaining life, since it did not properly takeinto account the loading sequence effect [56,59,102]. In cases of existing ageing structures where loading history might beknown, it is recommended to use the recently proposed “sequential law” [59,60] to capture the load sequence effect moreprecisely. This paper presents only a summary of the sequential law. It can be explained briefly by assuming a componentsubjected to a certain stress range, si, for ni number of cycles at load level i. This results in a residual life of the component:(Ni�ni) cycles at load level, i. The stress, s(i)eq, which corresponds to the failure life (Ni�ni) is obtained from the S-N curve andis named as ith level damage stress amplitude or stress range. The new damage indicator, Di, can then be written as
Di ¼sðiÞeq � sisu � si
(15)
where su is the intercept of the S-N curve with the ordinate at one quarter of the first fatigue cycle. Assuming that the samedamage is transformed to the next load level iþ1, the damage equivalent stress at level iþ1 can then be calculated. Subse-quently, the corresponding equivalent number of cycles to failure and the residual life at the load level iþ1 can be obtainedusing the S-N curve. The cumulative damage at load level iþ1 can then be defined. The above procedure is followed until thecumulative damage becomes unity and a more precise estimation of remaining fatigue life is obtained. A detailed descriptionof the sequential law, including the damage stress model and the new damage indicator Di, can be found in work by previousresearchers [59,60].
2.4.4. Selection of crack propagation curveIn cases where the linear elastic fracture mechanics method is adopted to estimate remaining life, it is recommended that
a suitable crack propagation curve be selected. The stress intensity factors, DK, should be determined from a detailed finiteelement modelling of the crack, which is computationally demanding. Alternatively, analytical solutions are provided bystandards, which are deduced from semi-elliptical cracks in plates [48]. The crack growth rate can then be determined using asuitable crack propagation curve. The crack propagation curves in the marine environment can be found in design standardsand research articles [48,103e105]. The remaining fatigue life can be estimated based on the critical crack growth size.
2.5. Assessment for other limit states and strengthening/inspection for extended life (Block E)
If the remaining fatigue life is found to be satisfactory, it is advisable to check the structure for other limit states (ULS, SLS,ALS) as per Block E of the framework presented in Fig. 1. While the ULS checks are performed to check the structural strengthagainst ultimate load conditions, the SLS checks requires the deflection of structural members within allowable limits. TheALS checks are performed for accidental situations like ship collisions, dropped objects, fire, explosions and seismic actions.For each of these limit states, the structure should be checked for both its current degradation state and considered degra-dation in the future. These checks should be performed on the same principles as that of the design standards and using theLoad Resistance Factor Design philosophy [92,94,101]. The ULS check should be performed for all the load categories (per-manent load, variable load, environmental load and deformation load) using the load combination factors in design standards[92,94,101]. The combinations of different environmental loads (wind, waves, current, ice) should be as per the recommendedguidelines to obtain ULS combinations with 10�2 annual probability of exceedance [101]. The ALS checks for existingstructures should also be performed using the design criteria and the load factor is 1.0 for all load categories. The accidentalloads and abnormal environmental loads with 10�4 as the annual probability of exceedance should be considered [101]. In theassessment of all these limit states, the material factor should be taken from the design standards [92,94,101]. Under theabove LRFD approach, an acceptable safety margin is achieved by checking the structure based on characteristic values of loadeffects and resistances, and appropriate partial safety factors in each of the above limit states [32]. The characteristic valuescorrespond to a confidence level of 95% and a failure probability of 5%.
If all the limit state checks are satisfactory, for both current and future degradation, the extended life of the structure canbe proposed. It is advisable to propose a proper inspection and maintenance plan for the structure during its extended life, asper the standards [46,47,92,106]. The intervals for condition monitoring should be adjusted to take into account an increasedlikelihood of fatigue cracks due to damage accumulation during the initial design life [92]. The Norsok standard N-005 is animportant document for the condition monitoring of load bearing structures [106] and should be referred for more infor-mation on monitoring intervals, implementation process and selection of inspection methods. However, if the remaining lifeis not found to be satisfactory for any of the limit state checks, suitable mitigations need to be recommended. These miti-gations can consist of possible strengthening, reduction of actions or reduction of operational changes. The strengthening cantake the form of grouting of members and joints, adding extra braces at overstressed locations, or adding stiffeners orbrackets. Several fatigue life improvement techniques related to the weld can also be used. Examples of these are grinding,
A. Aeran et al. / Marine Structures 56 (2017) 237e259248
Tungsten Inert Gas (TIG) dressing and hammer peening [58,107]. It is advisable to refurnish the anodes wherever possible.More information onmitigation and strengthening can be found in the design standards [46,92]. The proposed strengtheningand mitigation should be checked for feasibility at the offshore site location. On-site inspections are recommended to checkthe feasibility of proposed strengthening as well as any other feasible alternatives. Mitigations should be planned in case theproposed strengthening is not feasible and alternatives are found. However, in cases where proposed strengthening is notfeasible and no alternative mitigations are found, the recommendation is that the structure should not be used beyond itsdesignated service lifetime.
3. Case study: Structural integrity assessment of an existing jacket structure for life extension
A case study is performed on an old existing jacket type of platform in the Gulf of Suez, the Red Sea. The jacket is assessedfor its structural integrity, and its remaining life is estimated using the proposed framework. The obtained assessment resultsare compared with conventional assessment approaches. Hence, the significance of the proposed framework is confirmed.
3.1. Data collection, screening and selection of fatigue assessment approach
The data from the initial design, operational as well as expected extended life, was collected. This includes structuraldrawings, material properties, loading details and some of the past inspection reports. The inspection reports were screenedfor all structural degradation information, including the member thickness measurements and fatigue cracks. A suitablefatigue assessment approach was also selected as per the proposed framework. The initial target life of the structure was 25years and a design fatigue factor of three was taken in the initial design calculations. The design life of the structure is nowover and the presented analysis is performed at the end of initial target life.
3.1.1. Structural and material detailsThe platform, which was installed in 1988, is a four-leg jacket structure. The age of the jacket is 28 years and is well suited
for consideration as an aged offshore installation. The jacket has four main legs and is installed in a water depth of 33.5 m.Diagonal braces are present in both the horizontal and vertical planes. All the members have a tubular cross section. Thetopsides have three levels: the cellar deck, the production deck and the helideck. The material type is A36 with a density of7850 kg/m3 and amodulus of elasticity of 200 GPa. The yield strength and ultimate tensile strength are 248MPa and 400MParespectively. An image of the structure at the offshore site is shown in Fig. 3(a).
3.1.2. Selection of fatigue assessment methodThe structural degradation informationwas screened for any fatigue cracks; nonewere found in the inspection records. As
the structure is approaching the end of its design life, a detailed fatigue assessment, including simulation of past and futurestructural degradation, is required for possible life extension. Hence, a safe life approach was used for the fatigue assessment,as described in Block A of the proposed framework presented in Fig. 1.
3.2. Simulation of degradation and development of degraded FE models
The structural degradation information was also screened for any corrosion measurement details. Thickness reductionmeasurements were not found in the inspection reports. However, recent site inspections have revealed the presence of mildcorrosion in the submerged zone and some patch corrosion in the splash zone of the jacket structure, but no significantlocalized corrosion and no fatigue cracks were found. It is recommended that the uniform corrosion model parameters beselected as per Block B of the proposed framework presented in Fig. 1.
3.2.1. Conventional and framework proposed approaches for selecting model parametersConventionally, the degradation is not considered at all in cases of mild corrosion, as the material loss is very low. Also, the
model parameters are conventionally taken as per the design standards for simulating patch corrosion [28,42,92,108]. Theseparameters, as per conventional approach, are shown in Table 4. However, it is advisable not to ignore the degradation effects,even in cases of mild corrosion, and to select the proposed model parameters to represent mild corrosion as per Table 4. It isnoteworthy that the model parameters given in the design standards for patch corrosion are very conservative and can resultin an underestimation of the remaining fatigue life. It is recommended that patch corrosion be simulated in the splash zone,using the proposed model parameters in the framework for the considered jacket structure. These considered parameters forthe proposed approach are shown in Table 4.
3.2.2. Development of degraded finite element modelsA finite element model of the structure was developed in FE software SAP 2000 [109], using frame elements. The finite
element model and global geometry is shown in Fig. 3(b). The jacket members were degraded, using the conventional andproposed framework approaches. Also, separate model parameters were applied to the members in the splash zone and thesubmerged zone, as per values mentioned in Table 4. The time-dependent cross-sectional properties were determined usingEqs. (9)e(12), and degraded FE models were developed for the jacket structure.
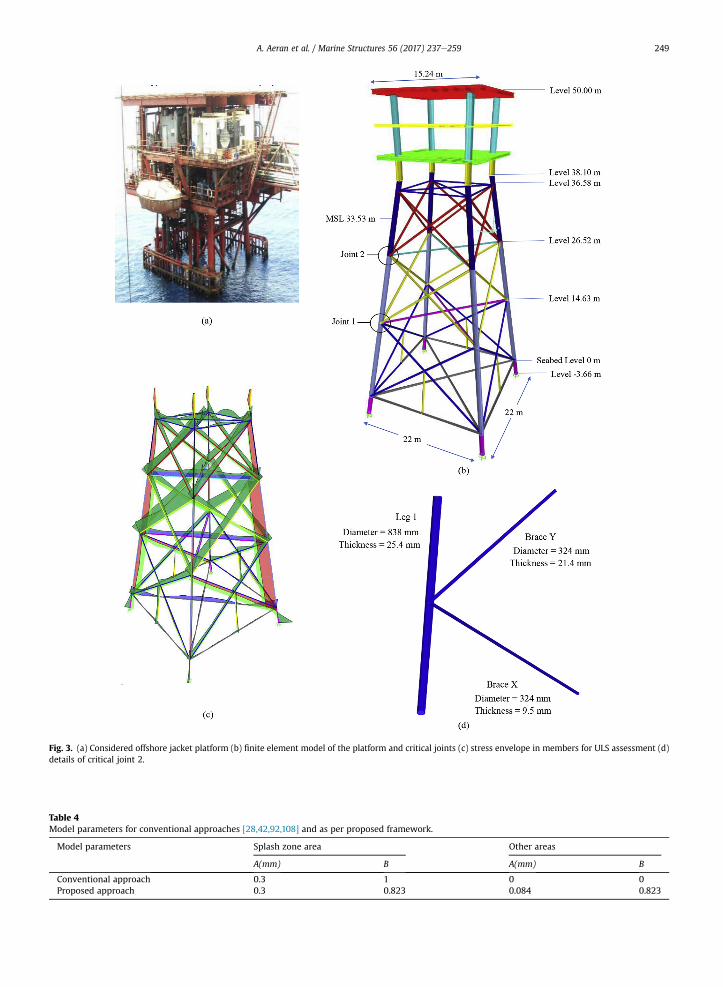
Fig. 3. (a) Considered offshore jacket platform (b) finite element model of the platform and critical joints (c) stress envelope in members for ULS assessment (d)details of critical joint 2.
Table 4Model parameters for conventional approaches [28,42,92,108] and as per proposed framework.
Model parameters Splash zone area Other areas
A(mm) B A(mm) B
Conventional approach 0.3 1 0 0Proposed approach 0.3 0.823 0.084 0.823
A. Aeran et al. / Marine Structures 56 (2017) 237e259 249
A. Aeran et al. / Marine Structures 56 (2017) 237e259250
3.3. Load simulation and structural analysis
The collected data was screened for loadings over the design life of the structure. This included all permanent loads,variable loads and environmental loads. The loadings considered were the dead load, live load, wave load, current and thewind loads. A nonlinear multistep static structural analysis was performed. The nonlinearities considered were thegeometrical nonlinearities in the structure (P-D analysis) and the force nonlinearities in the wave loadings.
3.3.1. Loading details and simulationThe permanent and variable loads were defined. The variable load was applied as uniformly distributed loads on the deck.
An intensity of 2.4 kN/m2 was applied to the helideck, while a 9.6 kN/m2 live load was applied to the cellar and productiondecks. For SLS and ULS checks, a 100-year return period wave, with a wave height of 7.92 m and time period of 8 s, was used.For the FLS check, in the absence of any measured wave heights, the wave loading was simulated using a long-term wavescatter diagram at the installation location, as described in Block C of the proposed framework presented in Fig. 1. Theconsideredwave scatter diagramwas derived from actual measurements taken at the site from the period 1992 to 2014. Thesemeasurements were carried out and provided by a met ocean consultant company [110]. The current and wind loads wereapplied in the same direction as that of the wave.
3.3.2. Load cases and load combinationsThe dead load and live load were defined as individual load cases. The wave load was defined in seven directions, and
sevenwave load cases were defined. Since the structure is symmetrical, the directions were chosen from 0 to 180�, spaced at30� intervals. The wave load was derived using a suitable wave theory as per the applicability criteria of wave theories. Anonlinear 5th order Stoke's wave theory was found to be applicable for the considered jacket. The current and wind loadswere defined, alongwith thewave load. The load cases were combined as per the load combination factors given in the designstandards.
3.3.3. Structural analysisA nonlinear multistep static analysis was performed. For SLS and ULS assessment, a 100-year return period wavewas used
in the analysis, and a preliminary estimation of overstressed joint locations was made. The stress envelope plot for the ul-timate limit state assessment is shown in Fig. 3(c) for the worst load combination. Two critical joint locations were identifiedfrom the stress plot, as shown in Fig. 3(b). Detailed geometry of the joint in splash zone (joint 2) is shown in Fig. 3(d). Adeterministic fatigue assessment was performed for the critical joints, according to the guidelines mentioned in section 2.3.1.The analysis was also performed separately for each of the degraded models.
3.4. Stress evaluation and estimation of remaining life
Hot spot stress (HSS) approach has been used for fatigue life estimation of considered joints as no localized corrosion wasobserved. Hence, a global analysis was performed as alsomentioned in the proposed framework in Block D and also in Section2.4.1. However, in cases where localized corrosion is present at the details, it is recommended to perform a notch stress basedfatigue analysis where secondary stress state should be determined using detailed thin shell FE analysis.
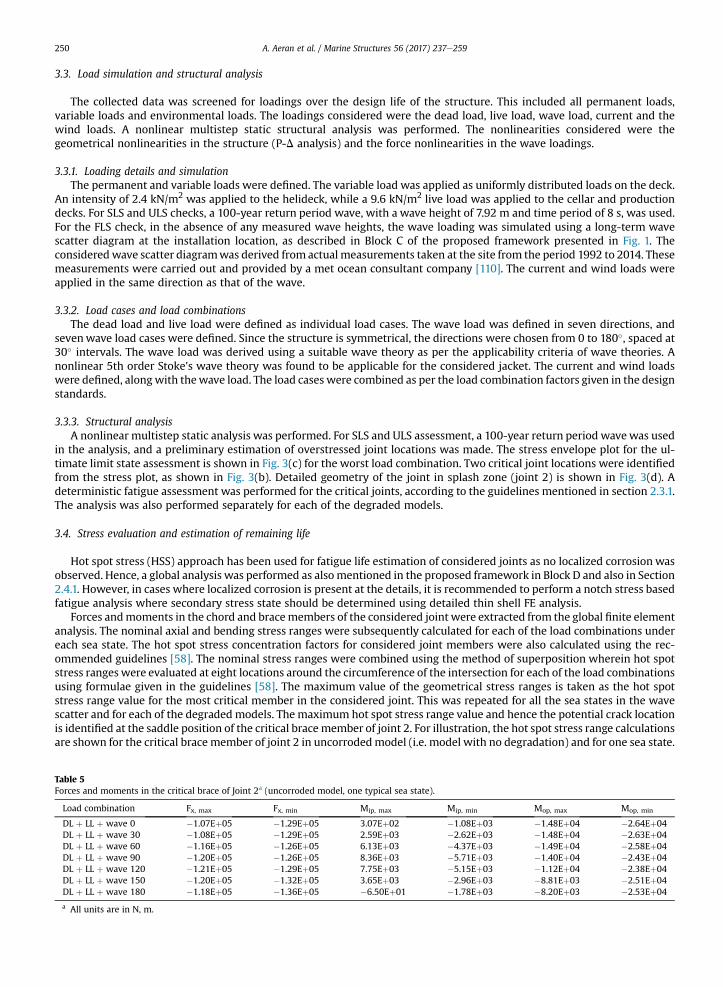
Forces andmoments in the chord and bracemembers of the considered joint were extracted from the global finite elementanalysis. The nominal axial and bending stress ranges were subsequently calculated for each of the load combinations undereach sea state. The hot spot stress concentration factors for considered joint members were also calculated using the rec-ommended guidelines [58]. The nominal stress ranges were combined using the method of superposition wherein hot spotstress ranges were evaluated at eight locations around the circumference of the intersection for each of the load combinationsusing formulae given in the guidelines [58]. The maximum value of the geometrical stress ranges is taken as the hot spotstress range value for the most critical member in the considered joint. This was repeated for all the sea states in the wavescatter and for each of the degraded models. The maximum hot spot stress range value and hence the potential crack locationis identified at the saddle position of the critical brace member of joint 2. For illustration, the hot spot stress range calculationsare shown for the critical brace member of joint 2 in uncorrodedmodel (i.e. model with no degradation) and for one sea state.
Table 5Forces and moments in the critical brace of Joint 2a (uncorroded model, one typical sea state).
Load combination Fx, max Fx, min Mip, max Mip, min Mop, max Mop, min
DL þ LL þ wave 0 �1.07Eþ05 �1.29Eþ05 3.07Eþ02 �1.08Eþ03 �1.48Eþ04 �2.64Eþ04DL þ LL þ wave 30 �1.08Eþ05 �1.29Eþ05 2.59Eþ03 �2.62Eþ03 �1.48Eþ04 �2.63Eþ04DL þ LL þ wave 60 �1.16Eþ05 �1.26Eþ05 6.13Eþ03 �4.37Eþ03 �1.49Eþ04 �2.58Eþ04DL þ LL þ wave 90 �1.20Eþ05 �1.26Eþ05 8.36Eþ03 �5.71Eþ03 �1.40Eþ04 �2.43Eþ04DL þ LL þ wave 120 �1.21Eþ05 �1.29Eþ05 7.75Eþ03 �5.15Eþ03 �1.12Eþ04 �2.38Eþ04DL þ LL þ wave 150 �1.20Eþ05 �1.32Eþ05 3.65Eþ03 �2.96Eþ03 �8.81Eþ03 �2.51Eþ04DL þ LL þ wave 180 �1.18Eþ05 �1.36Eþ05 �6.50Eþ01 �1.78Eþ03 �8.20Eþ03 �2.53Eþ04
a All units are in N, m.
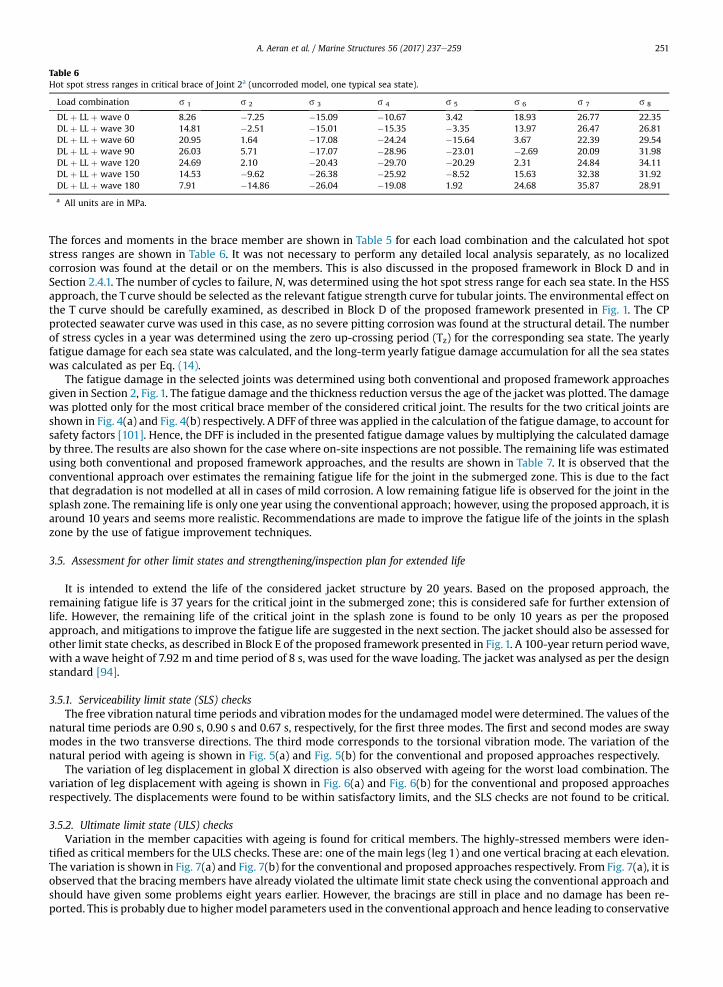
Table 6Hot spot stress ranges in critical brace of Joint 2a (uncorroded model, one typical sea state).
Load combination s 1 s 2 s 3 s 4 s 5 s 6 s 7 s 8
DL þ LL þ wave 0 8.26 �7.25 �15.09 �10.67 3.42 18.93 26.77 22.35DL þ LL þ wave 30 14.81 �2.51 �15.01 �15.35 �3.35 13.97 26.47 26.81DL þ LL þ wave 60 20.95 1.64 �17.08 �24.24 �15.64 3.67 22.39 29.54DL þ LL þ wave 90 26.03 5.71 �17.07 �28.96 �23.01 �2.69 20.09 31.98DL þ LL þ wave 120 24.69 2.10 �20.43 �29.70 �20.29 2.31 24.84 34.11DL þ LL þ wave 150 14.53 �9.62 �26.38 �25.92 �8.52 15.63 32.38 31.92DL þ LL þ wave 180 7.91 �14.86 �26.04 �19.08 1.92 24.68 35.87 28.91
a All units are in MPa.
A. Aeran et al. / Marine Structures 56 (2017) 237e259 251
The forces and moments in the brace member are shown in Table 5 for each load combination and the calculated hot spotstress ranges are shown in Table 6. It was not necessary to perform any detailed local analysis separately, as no localizedcorrosion was found at the detail or on the members. This is also discussed in the proposed framework in Block D and inSection 2.4.1. The number of cycles to failure, N, was determined using the hot spot stress range for each sea state. In the HSSapproach, the T curve should be selected as the relevant fatigue strength curve for tubular joints. The environmental effect onthe T curve should be carefully examined, as described in Block D of the proposed framework presented in Fig. 1. The CPprotected seawater curve was used in this case, as no severe pitting corrosion was found at the structural detail. The numberof stress cycles in a year was determined using the zero up-crossing period (Tz) for the corresponding sea state. The yearlyfatigue damage for each sea state was calculated, and the long-term yearly fatigue damage accumulation for all the sea stateswas calculated as per Eq. (14).
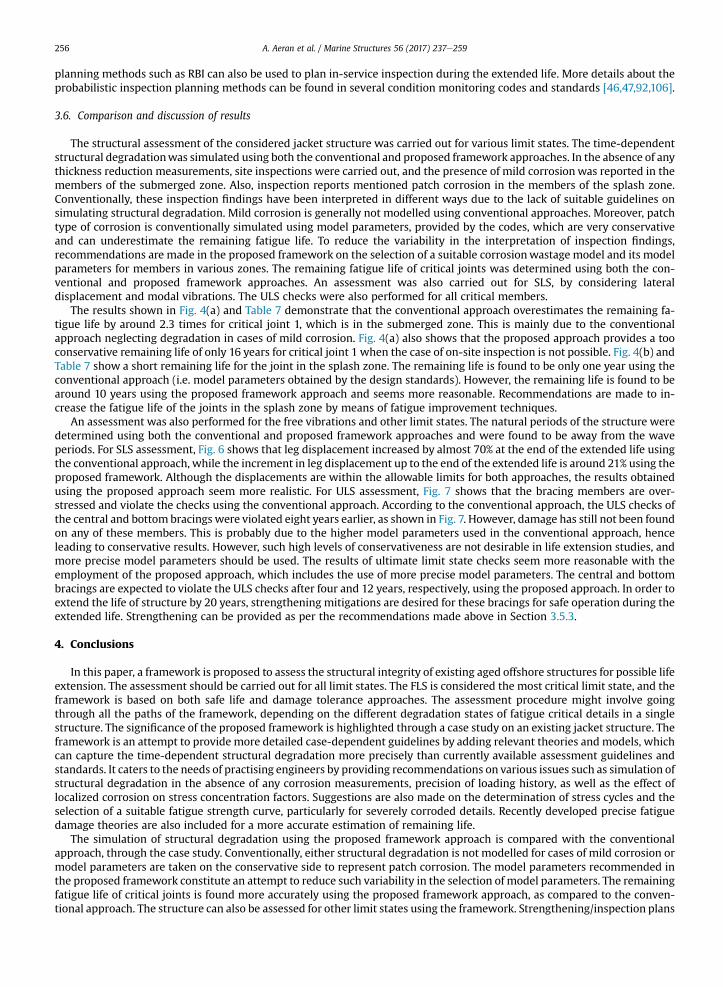
The fatigue damage in the selected joints was determined using both conventional and proposed framework approachesgiven in Section 2, Fig. 1. The fatigue damage and the thickness reduction versus the age of the jacket was plotted. The damagewas plotted only for the most critical brace member of the considered critical joint. The results for the two critical joints areshown in Fig. 4(a) and Fig. 4(b) respectively. A DFF of three was applied in the calculation of the fatigue damage, to account forsafety factors [101]. Hence, the DFF is included in the presented fatigue damage values by multiplying the calculated damageby three. The results are also shown for the case where on-site inspections are not possible. The remaining life was estimatedusing both conventional and proposed framework approaches, and the results are shown in Table 7. It is observed that theconventional approach over estimates the remaining fatigue life for the joint in the submerged zone. This is due to the factthat degradation is not modelled at all in cases of mild corrosion. A low remaining fatigue life is observed for the joint in thesplash zone. The remaining life is only one year using the conventional approach; however, using the proposed approach, it isaround 10 years and seems more realistic. Recommendations are made to improve the fatigue life of the joints in the splashzone by the use of fatigue improvement techniques.
3.5. Assessment for other limit states and strengthening/inspection plan for extended life
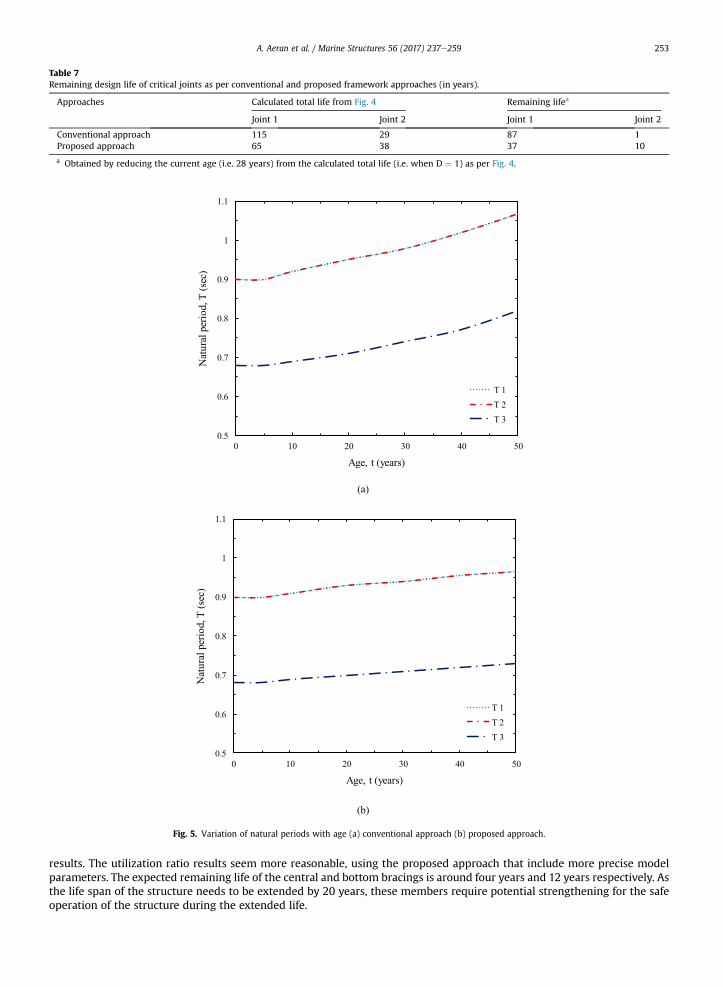
It is intended to extend the life of the considered jacket structure by 20 years. Based on the proposed approach, theremaining fatigue life is 37 years for the critical joint in the submerged zone; this is considered safe for further extension oflife. However, the remaining life of the critical joint in the splash zone is found to be only 10 years as per the proposedapproach, and mitigations to improve the fatigue life are suggested in the next section. The jacket should also be assessed forother limit state checks, as described in Block E of the proposed framework presented in Fig. 1. A 100-year return period wave,with a wave height of 7.92 m and time period of 8 s, was used for the wave loading. The jacket was analysed as per the designstandard [94].
3.5.1. Serviceability limit state (SLS) checksThe free vibration natural time periods and vibrationmodes for the undamagedmodel were determined. The values of the
natural time periods are 0.90 s, 0.90 s and 0.67 s, respectively, for the first three modes. The first and second modes are swaymodes in the two transverse directions. The third mode corresponds to the torsional vibration mode. The variation of thenatural period with ageing is shown in Fig. 5(a) and Fig. 5(b) for the conventional and proposed approaches respectively.
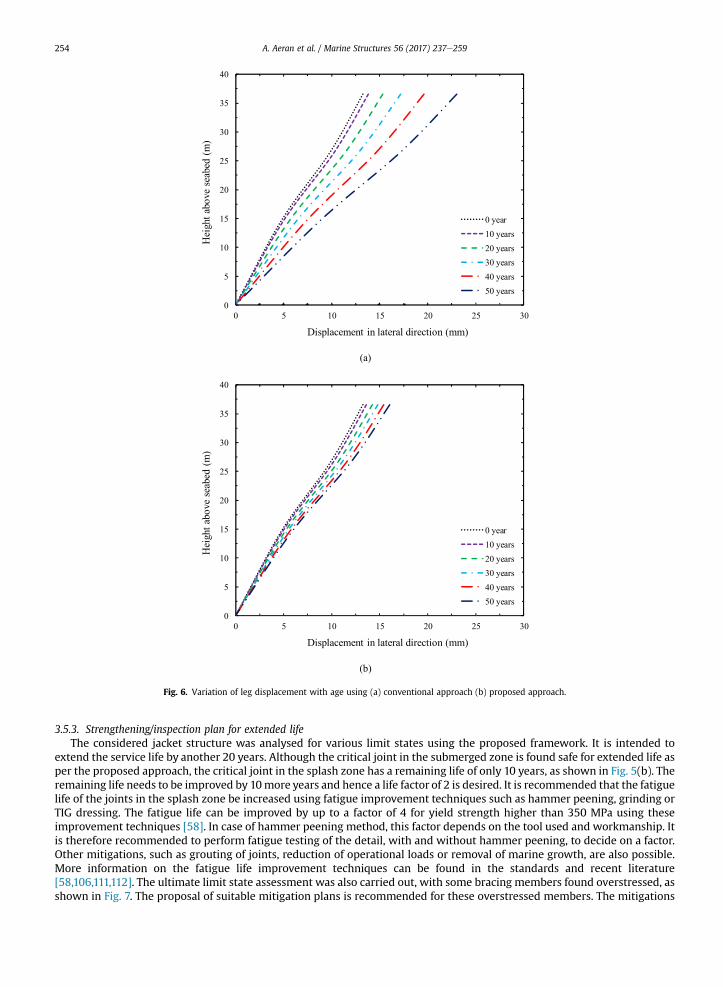
The variation of leg displacement in global X direction is also observed with ageing for the worst load combination. Thevariation of leg displacement with ageing is shown in Fig. 6(a) and Fig. 6(b) for the conventional and proposed approachesrespectively. The displacements were found to be within satisfactory limits, and the SLS checks are not found to be critical.
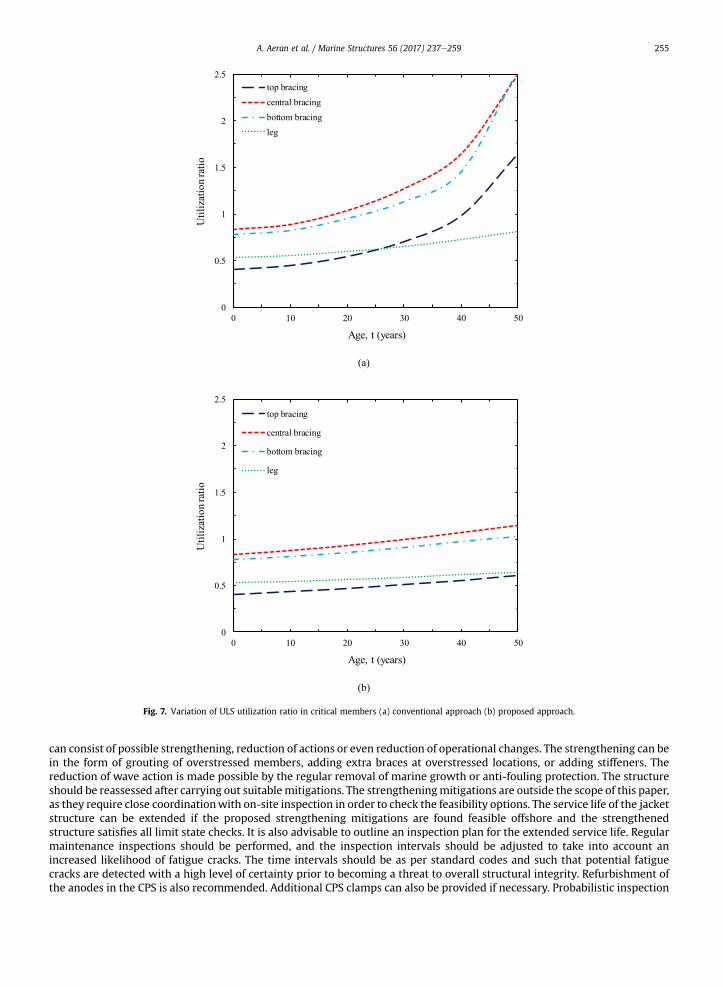
3.5.2. Ultimate limit state (ULS) checksVariation in the member capacities with ageing is found for critical members. The highly-stressed members were iden-
tified as critical members for the ULS checks. These are: one of the main legs (leg 1) and one vertical bracing at each elevation.The variation is shown in Fig. 7(a) and Fig. 7(b) for the conventional and proposed approaches respectively. From Fig. 7(a), it isobserved that the bracing members have already violated the ultimate limit state check using the conventional approach andshould have given some problems eight years earlier. However, the bracings are still in place and no damage has been re-ported. This is probably due to highermodel parameters used in the conventional approach and hence leading to conservative
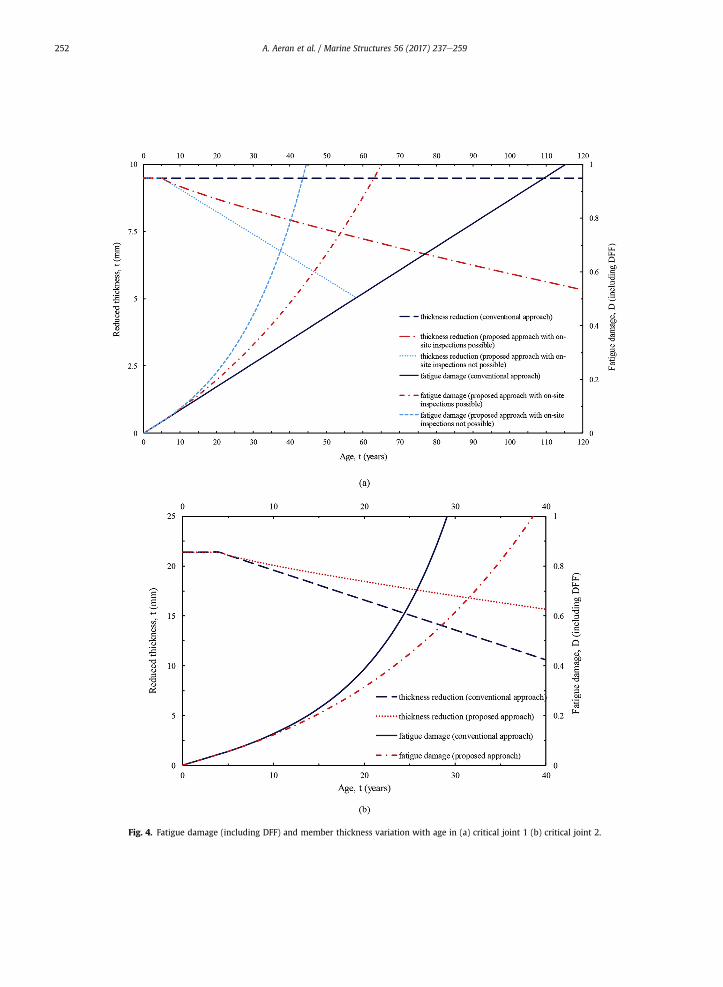
Fig. 4. Fatigue damage (including DFF) and member thickness variation with age in (a) critical joint 1 (b) critical joint 2.
A. Aeran et al. / Marine Structures 56 (2017) 237e259252
(a)
(b)
0.5
0.6
0.7
0.8
0.9
1
1.1
0 10 20 30 40 50
Nat
ural
per
iod,
T (s
ec)
Age, t (years)
T 1T 2T 3
0.5
0.6
0.7
0.8
0.9
1
1.1
0 10 20 30 40 50
Nat
ural
per
iod,
T (s
ec)
Age, t (years)
T 1T 2T 3
Fig. 5. Variation of natural periods with age (a) conventional approach (b) proposed approach.
Table 7Remaining design life of critical joints as per conventional and proposed framework approaches (in years).
Approaches Calculated total life from Fig. 4 Remaining lifea
Joint 1 Joint 2 Joint 1 Joint 2
Conventional approach 115 29 87 1Proposed approach 65 38 37 10
a Obtained by reducing the current age (i.e. 28 years) from the calculated total life (i.e. when D ¼ 1) as per Fig. 4.
A. Aeran et al. / Marine Structures 56 (2017) 237e259 253
results. The utilization ratio results seem more reasonable, using the proposed approach that include more precise modelparameters. The expected remaining life of the central and bottom bracings is around four years and 12 years respectively. Asthe life span of the structure needs to be extended by 20 years, these members require potential strengthening for the safeoperation of the structure during the extended life.
(a)
(b)
0
5
10
15
20
25
30
35
40
0 5 10 15 20 25 30
Hei
ght a
bove
sea
bed
(m)
Displacement in lateral direction (mm)
0 year10 years20 years30 years40 years50 years
0
5
10
15
20
25
30
35
40
0 5 10 15 20 25 30
Hei
ght a
bove
sea
bed
(m)
Displacement in lateral direction (mm)
0 year10 years20 years30 years40 years50 years
Fig. 6. Variation of leg displacement with age using (a) conventional approach (b) proposed approach.
A. Aeran et al. / Marine Structures 56 (2017) 237e259254
3.5.3. Strengthening/inspection plan for extended lifeThe considered jacket structure was analysed for various limit states using the proposed framework. It is intended to
extend the service life by another 20 years. Although the critical joint in the submerged zone is found safe for extended life asper the proposed approach, the critical joint in the splash zone has a remaining life of only 10 years, as shown in Fig. 5(b). Theremaining life needs to be improved by 10more years and hence a life factor of 2 is desired. It is recommended that the fatiguelife of the joints in the splash zone be increased using fatigue improvement techniques such as hammer peening, grinding orTIG dressing. The fatigue life can be improved by up to a factor of 4 for yield strength higher than 350 MPa using theseimprovement techniques [58]. In case of hammer peening method, this factor depends on the tool used and workmanship. Itis therefore recommended to perform fatigue testing of the detail, with and without hammer peening, to decide on a factor.Other mitigations, such as grouting of joints, reduction of operational loads or removal of marine growth, are also possible.More information on the fatigue life improvement techniques can be found in the standards and recent literature[58,106,111,112]. The ultimate limit state assessment was also carried out, with some bracing members found overstressed, asshown in Fig. 7. The proposal of suitable mitigation plans is recommended for these overstressed members. The mitigations
(a)
(b)
0
0.5
1
1.5
2
2.5
0 10 20 30 40 50
Util
izat
ion
ratio
Age, t (years)
top bracingcentral bracingbottom bracingleg
0
0.5
1
1.5
2
2.5
0 10 20 30 40 50
Util
izat
ion
ratio
Age, t (years)
top bracing
central bracing
bottom bracing
leg
Fig. 7. Variation of ULS utilization ratio in critical members (a) conventional approach (b) proposed approach.
A. Aeran et al. / Marine Structures 56 (2017) 237e259 255
can consist of possible strengthening, reduction of actions or even reduction of operational changes. The strengthening can bein the form of grouting of overstressed members, adding extra braces at overstressed locations, or adding stiffeners. Thereduction of wave action is made possible by the regular removal of marine growth or anti-fouling protection. The structureshould be reassessed after carrying out suitablemitigations. The strengtheningmitigations are outside the scope of this paper,as they require close coordinationwith on-site inspection in order to check the feasibility options. The service life of the jacketstructure can be extended if the proposed strengthening mitigations are found feasible offshore and the strengthenedstructure satisfies all limit state checks. It is also advisable to outline an inspection plan for the extended service life. Regularmaintenance inspections should be performed, and the inspection intervals should be adjusted to take into account anincreased likelihood of fatigue cracks. The time intervals should be as per standard codes and such that potential fatiguecracks are detected with a high level of certainty prior to becoming a threat to overall structural integrity. Refurbishment ofthe anodes in the CPS is also recommended. Additional CPS clamps can also be provided if necessary. Probabilistic inspection
A. Aeran et al. / Marine Structures 56 (2017) 237e259256
planning methods such as RBI can also be used to plan in-service inspection during the extended life. More details about theprobabilistic inspection planning methods can be found in several condition monitoring codes and standards [46,47,92,106].
3.6. Comparison and discussion of results
The structural assessment of the considered jacket structure was carried out for various limit states. The time-dependentstructural degradationwas simulated using both the conventional and proposed framework approaches. In the absence of anythickness reduction measurements, site inspections were carried out, and the presence of mild corrosion was reported in themembers of the submerged zone. Also, inspection reports mentioned patch corrosion in the members of the splash zone.Conventionally, these inspection findings have been interpreted in different ways due to the lack of suitable guidelines onsimulating structural degradation. Mild corrosion is generally not modelled using conventional approaches. Moreover, patchtype of corrosion is conventionally simulated using model parameters, provided by the codes, which are very conservativeand can underestimate the remaining fatigue life. To reduce the variability in the interpretation of inspection findings,recommendations are made in the proposed framework on the selection of a suitable corrosionwastage model and its modelparameters for members in various zones. The remaining fatigue life of critical joints was determined using both the con-ventional and proposed framework approaches. An assessment was also carried out for SLS, by considering lateraldisplacement and modal vibrations. The ULS checks were also performed for all critical members.
The results shown in Fig. 4(a) and Table 7 demonstrate that the conventional approach overestimates the remaining fa-tigue life by around 2.3 times for critical joint 1, which is in the submerged zone. This is mainly due to the conventionalapproach neglecting degradation in cases of mild corrosion. Fig. 4(a) also shows that the proposed approach provides a tooconservative remaining life of only 16 years for critical joint 1 when the case of on-site inspection is not possible. Fig. 4(b) andTable 7 show a short remaining life for the joint in the splash zone. The remaining life is found to be only one year using theconventional approach (i.e. model parameters obtained by the design standards). However, the remaining life is found to bearound 10 years using the proposed framework approach and seems more reasonable. Recommendations are made to in-crease the fatigue life of the joints in the splash zone by means of fatigue improvement techniques.
An assessment was also performed for the free vibrations and other limit states. The natural periods of the structure weredetermined using both the conventional and proposed framework approaches and were found to be away from the waveperiods. For SLS assessment, Fig. 6 shows that leg displacement increased by almost 70% at the end of the extended life usingthe conventional approach, while the increment in leg displacement up to the end of the extended life is around 21% using theproposed framework. Although the displacements are within the allowable limits for both approaches, the results obtainedusing the proposed approach seem more realistic. For ULS assessment, Fig. 7 shows that the bracing members are over-stressed and violate the checks using the conventional approach. According to the conventional approach, the ULS checks ofthe central and bottom bracings were violated eight years earlier, as shown in Fig. 7. However, damage has still not been foundon any of these members. This is probably due to the higher model parameters used in the conventional approach, henceleading to conservative results. However, such high levels of conservativeness are not desirable in life extension studies, andmore precise model parameters should be used. The results of ultimate limit state checks seem more reasonable with theemployment of the proposed approach, which includes the use of more precise model parameters. The central and bottombracings are expected to violate the ULS checks after four and 12 years, respectively, using the proposed approach. In order toextend the life of structure by 20 years, strengthening mitigations are desired for these bracings for safe operation during theextended life. Strengthening can be provided as per the recommendations made above in Section 3.5.3.
4. Conclusions
In this paper, a framework is proposed to assess the structural integrity of existing aged offshore structures for possible lifeextension. The assessment should be carried out for all limit states. The FLS is considered the most critical limit state, and theframework is based on both safe life and damage tolerance approaches. The assessment procedure might involve goingthrough all the paths of the framework, depending on the different degradation states of fatigue critical details in a singlestructure. The significance of the proposed framework is highlighted through a case study on an existing jacket structure. Theframework is an attempt to provide more detailed case-dependent guidelines by adding relevant theories and models, whichcan capture the time-dependent structural degradation more precisely than currently available assessment guidelines andstandards. It caters to the needs of practising engineers by providing recommendations on various issues such as simulation ofstructural degradation in the absence of any corrosion measurements, precision of loading history, as well as the effect oflocalized corrosion on stress concentration factors. Suggestions are also made on the determination of stress cycles and theselection of a suitable fatigue strength curve, particularly for severely corroded details. Recently developed precise fatiguedamage theories are also included for a more accurate estimation of remaining life.
The simulation of structural degradation using the proposed framework approach is compared with the conventionalapproach, through the case study. Conventionally, either structural degradation is not modelled for cases of mild corrosion ormodel parameters are taken on the conservative side to represent patch corrosion. The model parameters recommended inthe proposed framework constitute an attempt to reduce such variability in the selection of model parameters. The remainingfatigue life of critical joints is found more accurately using the proposed framework approach, as compared to the conven-tional approach. The structure can also be assessed for other limit states using the framework. Strengthening/inspection plans
A. Aeran et al. / Marine Structures 56 (2017) 237e259 257
for extended life are also recommended. It can be concluded that the proposed framework provides an accurate prediction ofremaining life, and the framework is a currently required tool to assess the structural integrity of an ageing jacket structure forpossible life extension. The limitations of the proposed framework have been identified. The proposed framework considersonly the functional ageing characterised by fatigue and corrosion. Other aspects of functional ageing such as erosion, creep,accumulated plastic deformation have not been considered. Moreover, technological ageing, knowledge based ageing andorganisational ageing have been neglected and should be considered wherever applicable. The proposed framework isapplied to the considered case study using a deterministic approach but can be used with probabilistic approaches as well.The significance of the proposed framework should be further highlighted on other ageing existing jacket structures using afew more case studies. Thereafter, the proposed framework and given model parameters may be adopted in the assessmentstandards in future.
Acknowledgements
The funding for this research work is supported by the Norwegian Ministry of Education and Research.
References
[1] Ersdal G. Assessment of existing offshore structures for life extension. Doctoral thesis. Norway: University of Stavanger; 2005.[2] Galbraith D, Sharp JV, Terry E. Managing life extension in aging offshore installations. In: Society of Petroleum engineers international conference;
2005. Aberdeen.[3] Stacey A, Birkinshaw M, Sharp JV. Life extension issues for ageing offshore installations. In: Proceedings of the 27th international conference on
offshore mechanics and arctic engineering; 2008. Estoril, Portugal.[4] Ersdal G, Selnes PO. Life extension of ageing petroleum facilities offshore. In: Society of Petroleum engineers international conference; 2010. Rio de
Janeiro, Brazil.[5] Zettlemoyer N. Life extension of fixed platforms. Tubul Struct XIII 2010:3e13.[6] Solland G, Sigurdsson G, Ghosal A. Life extension and assessment of existing offshore structures. In: Society of Petroleum engineers international
conference; 2011. Doha, Qatar.[7] Nezamian A, Nicolson JR, Iosif D. State of art on life extension of existing offshore structures. In: Proceedings of the 31st international conference on
ocean. Rio de Janeiro, Brazil: Offshore and Arctic Engineering; 2012.[8] Ersdal G, Sharp JV, Galbraith D. Ageing accidents e suggestions for a definition and examples from damaged platforms. In: Proceedings of the 33rd
international conference on offshore mechanics and arctic engineering; 2014. San Francisco, California.[9] Galbraith D, Sharp JV. Recommendations for design life extension regulations. Poseidon report for Petroleum Safety Authority, Aberdeen. 2007.
[10] Ersdal G, Hornlund E. Assessment of offshore structures for life extension. In: Proceedings of the 27th international conference on offshore mechanicsand arctic engineering; 2008. Estoril, Portugal.
[11] Stacey A, Sharp JV. Ageing and life extension considerations in the integrity management of fixed and mobile offshore installations. In: Proceedings ofthe 30th international conference on ocean. Rotterdam, The Netherlands: Offshore and Arctic Engineering; 2011.
[12] Rusell J, Keith I. The challenges of extending the life of UK offshore installations. In: International Petroleum technology conference; 2014. Doha,Qatar.
[13] Nezamian A, Iqbal K. Requalification and extension of service life and integrity requirements for offshore structures in Middle East. In: InternationalPetroleum technology conference; 2015. Doha, Qatar.
[14] Osmundsen P, Tveteras R. Decommissioning of petroleum installationsdmajor policy issues. Energy Policy 2003;31(15):1579e88.[15] Max H, Bernstein B, Swamy S. A multi-attribute decision analysis for decommissioning offshore oil and gas platforms. Integr Environ Assess Manag
2015;11(4):594e609.[16] Alveberg LJ, Melberg VE. Facts 2013 Norwegian petroleum sector. Report by the Ministry of Petroleum and the Norwegian Petroleum Directorate,
Publication number: Y-0103/14 E, ISSN 1502e5446. 2013.[17] Lønvik K, Leinum BH, Heier EB, Serednicki A, Gjørv OE, Myhre T, et al. Material risk e ageing of offshore installations. DNV report for Petroleum Safety
Authority Norway, Norway. 2006.[18] Wintle J, Sharp J. Requirements for life extension of ageing offshore production installations. For Petroleum Safety Authority. TWI report 17554/1/08.
2008.[19] Hokstad P, Håbrekke S, Johnsen R, Sangesland S. Ageing and extension for offshore facilities in general and for specific systems. Norway: SINTEF
Technology and Society; 2010.[20] Hornlund E, Ersdal G, Hinderaker HR, Johnsen R, Sharp JV. Material issues in ageing and life extension. In: Proceedings of the 30th international
conference on ocean. Rotterdam, The Netherlands: Offshore and Arctic Engineering; 2011.[21] Stacey A, Sharp JV. Safety factor requirements for the offshore industry. Eng Fail Anal 2007;14(3). 442e258.[22] Garbatov Y, Soares CG, Parunov J, Kodvanj J. Tensile strength assessment of corroded small scale specimens. Corros Sci 2014;85:296e303.[23] Soares CG, Garbatov Y. Reliability of maintained ship hull girders subjected to corrosion and fatigue. Struct Saf 1998;20(3):201e19.[24] Popoola LT, Grema AS, Latinwo GK, Gutti B, Balogun AS. Corrosion problems during oil and gas production and its mitigation. Int J Industrial Chem
2013;4(1):4e35.[25] Adasooriya ND, Siriwardane S. Remaining fatigue life estimation of corroded bridge members. Fatigue Fract Eng Material Struct 2014;37(6):603e22.[26] Zhang W, Yuan H. Corrosion fatigue effects on life estimation of deteriorated bridges under vehicle impacts. Eng Struct 2014;71:128e36.[27] Dong W, Moan T, Gao Z. Fatigue reliability analysis of the jacket support structure for offshore wind turbine considering the effect of corrosion and
inspection. Reliab Eng Syst Saf 2012;106:11e27.[28] Det Norske Veritas. Design of offshore wind turbine structures. 2014. DNV-OS-J101, May 2014.[29] Qin S, Cui W. Effect of corrosion models on the time-dependent reliability of steel plated elements. Mar Struct 2003;16(1):15e34.[30] Det Norske Veritas. Cathodic protection design. 2010. DNV-RP-B401, October 2010.[31] Moan T. Accidents and near-misses in the offshore oil and gas industry e how and why. Oslo: Norsk Offshore Day; 2007.[32] Moan T. Reliability-based management of inspection, maintenance and repair of offshore structures. Struct Infrastructure Eng 2005;1(1):33e62.[33] Det Norske Veritas. Probabilistic methods for planning of inspection for fatigue cracks in offshore structures. 2015. DNVGL-RP-0001, May 2015.[34] Stacey A, Birkinshaw W. Initiatives on structural integrity management of ageing North Sea installations. In: Proceedings of the 27th international
conference on offshore mechanics and arctic engineering; 2008. Estoril, Portugal.[35] Stacey A. KP4: ageing and life extension inspection programme for offshore installations. In: Proceedings of the 30th international conference on
ocean. Rotterdam, The Netherlands: Offshore and Arctic Engineering; 2011.[36] H.S.E. Key programme 4 (KP4) ageing and life extension. An interim report by the offshore division of HSE’s hazardous installations directorate, UK.
2012.
A. Aeran et al. / Marine Structures 56 (2017) 237e259258
[37] Selnes PO, Ersdal G. Industry developed guidelines and standards for ageing and life extension. In: Proceedings of the 30th international conferenceon ocean. Rotterdam, The Netherlands: Offshore and Arctic Engineering; 2011.
[38] American Petroleum Institute. Recommended practice for planning, design and constructing fixed offshore platformsdworking stress design. 2000.API RP 2A-WSD, December 2000.
[39] International Standards Organization. General principles on reliability for structures. 1996. ISO 2394, December 1996.[40] International Standards Organization. Bases for design of structures e assessment of existing structures. 2001. ISO 13822, December 2001.[41] International Standards Organization. Petroleum and natural gas industries e general requirements for offshore installations. 2002. ISO 19900,
December 2002.[42] International Standards Organization. Petroleum and natural gas industries e offshore structures, fixed offshore structures. 2007. ISO 19902,
December 2007.[43] H.S.E. Structural integrity management framework for fixed jacket structures. A report by Atkins Limited for the HSE, UK. 2009.[44] Standard NORSOK. Assessment of structural integrity for existing offshore load-bearing structures. 2009. N-006, March 2009.[45] Norwegian Oil and Gas Association. Recommended guidelines for the assessment and documentation of service life extension of facilities. 2008. OLF
Guideline No. 122, June 2008.[46] American Petroleum Institute. Recommended practice for the structural integrity management of fixed offshore structures. 2014. API RP2 SIM,
November 2014.[47] Det Norske Veritas. Probabilistic methods for planning of inspection for fatigue cracks in offshore structures. 2015. DNVGL-RP-C210, November 2015.[48] British Standard Institution. Guide to methods for assessing the acceptability of flaws in metallic structures. 2013. BS 7910, December 2013.[49] Nezamian A, Altmann J. An oil field structural integrity assessment for re-qualification and life extension. In: Proceedings of the 32nd international
conference on ocean. Nantes, France: Offshore and Arctic Engineering; 2013.[50] Sharp JV, Terry EG, Wintle J. A framework for the management of ageing of safety critical elements offshore. In: Proceedings of the 30th international
conference on ocean. Rotterdam, The Netherlands: Offshore and Arctic Engineering; 2011.[51] Liu H, Shi X, Chen X, Liu Y. Management of life extension for topsides process system of offshore platforms in Chinese Bohai Bay. J Loss Prev Process
Industries 2015;35:357e65.[52] Almar-Naess A. Fatigue handbook. Trondheim, Norway: Tapir Publishers; 1985.[53] Lotsberg I. Fatigue design of marine structures. Cambridge: Cambridge University Press; 2016.[54] Haagensen PJ. Fatigue of tubular joints and fatigue improvement methods. Prog Struct Eng Mater 1997;1:96e106.[55] Gurney TR. Fatigue of welded structures. Cambridge: Cambridge University Press; 1979.[56] Suresh S. Fatigue of materials. Cambridge: Cambridge University Press; 1991.[57] Ziegler L, Muskulus M. Comparing a fracture mechanics model to the SN-curve approach for jacket-supported offshore wind turbines: challenges and
opportunities for lifetime prediction. In: Proceedings of the 35th international conference on ocean. Busan, South Korea: Offshore and Arctic En-gineering; 2016.
[58] Det Norske Veritas. Fatigue design of offshore steel structures. 2016. DNVGL-RP-C-203, April 2016.[59] Mesmacque G, Garcia S, Amrouche A, Rubio-Gonzalez C. Sequential law in multiaxial fatigue, a new damage indicator. Int J Fatigue 2005;27:461e7.[60] Siriwardane S, Ohga M, Dissanayake R, Taniwaki K. Application of new damage indicator-based sequential law for remaining fatigue life estimation of
railway bridges. J Constr Steel Res 2008;64:228e37.[61] Siriwardane S, Ohga M, Dissanayake R, Taniwaki K. Structural appraisal-based different approach to estimate the remaining fatigue life of railway
bridges. Struct Health Monit 2010;9:323e39.[62] Austen IM. An analysis of the applicability of empirical fatigue crack growth relationships. BSC Research Report SH/PT/6795/79/B. London: British
Steel Corporation; 1976.[63] Irving PE, McCartney LN. Prediction of fatigue crack growth rates: theory, mechanisms and experimental results. Metal Sci 1977;11(8/9):351e436.[64] Forman RG. Study of fatigue crack initiation from flaws using fracture mechanics theory. Eng Fract Mech 2003;4(2):333e45.[65] Paris PC, Erdogan FA. A critical analysis of crack propagation laws. J Basic Eng 1963;85D(4):528e34.[66] King RN. A review of fatigue crack growth rates in air and sea water. Offshore Technology Report, OTH 511. London: H.S.E. Books; 1998.[67] Chryssanthopoulos MK, Righiniotis TD. Fatigue reliability of welded steel structures. J Constr Steel Res 2006;62(11):1199e209.[68] Ayala-Uraga E, Moan T. Fatigue reliability-based assessment of welded joints applying consistent fracture mechanics formulations. Int J Fatigue 2007;
29(3):444e56.[69] Yasser Y, Jeom KM. Ultimate strength reliability analysis of corroded steel-box girder bridges. Thin Walled Struct 2011;49:157e66.[70] Nguyen KT, Garbatov Y, Soares CG. Spectral fatigue damage assessment of tanker deck structural detail subjected to time-dependent corrosion. Int J
Fatigue 2013;48:147e55.[71] Melchers RE. Modeling and prediction of long-term corrosion of steel in marine environments. Int J Offshore Polar Eng 2012;22:257e63.[72] Melchers RE. Modelling long term corrosion of steel infrastructure in natural marine environments. Underst Biocorrosion 2014:213e41.[73] Feliu S, Morcillo M, Feliu Jr S. The prediction of atmospheric corrosion frommeteorological and pollution parametersdII. Long-term forecasts. Corros
Sci 1993;34(3):415e22.[74] Soares CG, Garbatov Y. Reliability of maintained, corrosion protected plate subjected to nonlinear corrosion and compressive loads. Mar Struct 1999;
12:425e45.[75] Soares CG, Garbatov Y, Zayed A, Wang G, Melchers R, Paik J. Non-linear corrosion model for immersed steel plates accounting for environmental
factors. Trans Soc Nav Archit Mar Eng 2005;113:306e22.[76] Melchers RE. Probabilistic modelling of marine corrosion of steel specimens. In: Proceedings of the 5th international offshore and polar engineering
conference; 1995. Hague, The Netherlands.[77] Melchers RE. Corrosion uncertainty modelling for steel structures. J Constr Steel Res 1999;52(1):3e19.[78] Bhandari J, Khan F, Abbassi R, Garaniya V, Ojeda R. Modelling of pitting corrosion in marine and offshore steel structuresda technical review. J Loss
Prev Process Industries 2015;37:39e62.[79] Sidharth AAP. Effect of pitting corrosion on ultimate strength and buckling strength of plate-a review. Dig J Nanomater Biostructures 2009;4(4):
783e8.[80] Abdel-Ghany R, Saad-Eldeen S, Leheta H. The effect of pitting corrosion on the strength capacity of steel offshore structures. In: Proceedings of the
27th international conference on offshore mechanics and arctic engineering; 2008. Estoril, Portugal.[81] Rokhlin SI, Kim JY, Nagy H, Zoofan H. Effect of pitting corrosion on fatigue crack initiation and fatigue life. Eng Fract Mech 1999;62(4):425e44.[82] Dolley EJ, Lee B, Wei RP. The effect of pitting corrosion on fatigue life. Fatigue & Fract Eng Mater Struct 2000;23(7):555e60.[83] Melchers RE. Pitting corrosion of mild steel in marine immersion environment e Part 1: maximum pit depth. Corrosion 2004;60(9):824e36.[84] Jakubowski M. Influence of pitting corrosion on fatigue and corrosion fatigue of ship structures Part I Pitting corrosion of ship structures. Pol Marit
Res 2014;21(1):62e9.[85] Wang Y, Wang Y, Huang X, Cui W. A simplified maximum pit depth model of mild and low alloy steels in marine immersion environment. J Ship
Mech 2008;6(1):401e17.[86] Linder J, Blom R. Development of a method for corrosion fatigue life prediction of structurally loaded bearing steel. Corrosion 2001;57(5):404e12.[87] Kumakura Y, Takanashi M, Fuji A, Kitagawa M, Ojima M, Kobayashi Y. Fatigue strength of coated steel plate in seawater. In: Proceedings of the 9th
international offshore and polar engineering conference4; 1999. p. 108e13. Brest, France.[88] Forsyth DS, Yolken HT, Matzkanin GA. A brief introduction to nondestructive testing. AMMTIAC 2006;1(2):7e10.
A. Aeran et al. / Marine Structures 56 (2017) 237e259 259
[89] Jamali SS, Zhao Y, Gao Z, Li H, Hee AC. In situ evaluation of corrosion damage using non-destructive electrochemical measurementsda case study.J Industrial Eng Chem 2016;43:36e43.
[90] Kawakam Y, Hidesada Kanaji H, Oku K. Study on application of field signature method (FSM) to fatigue crack monitoring on steel bridges. ProcediaEng 2011;14:1059e64.
[91] Li SY, Kim YG, Jung S, Song HS, Lee SM. Application of steel thin film electrical resistance sensor for in situ corrosion monitoring. Sensors Actuators2007;120(2):368e77.
[92] Standard NORSOK. Assessment of structural integrity for existing offshore load-bearing structures. 2015. N-006, Ed. 2, April 2015.[93] Adedipe O, Brennan F, Kolios A. Review of corrosion fatigue in offshore structures: present status and challenges in the offshore wind sector. Renew
Sustain Energy Rev 2016;61:141e54.[94] Standard NORSOK. Design of steel structures. 2013. N-004, February 2013.[95] Chakrabarti SK. Hydrodynamics of offshore structures. Boston: Computational Mechanics Publications; 1987.[96] Dean RG. Spec. Rep. 1. Evaluation and development of water wave theories for engineering application, vols. 1 and 2. Fort Belvoir, USA: U.S. Army,
Coastal Engineering Research Center; 1974.[97] Budynas RG, Young WC, Sadegh A. Roark's formulas for stress and strain. eighth ed. USA: The McGraw-Hill Companies, Inc.; 2001.[98] Det Norske Veritas. Position monitoring. 2010. DNV-OS-E301, October 2010.[99] Miner MA. Cumulative damage. J Appl Mech 1945;12:159e64.
[100] Det Norske Veritas. Riser fatigue. 2010. DNV-RP-F204, October 2010.[101] Det Norske Veritas. Design of offshore steel structures. General. 2016. DNV-OS-C101, April 2016.[102] Dattoma V, Giancane S, Nobile R, Panella FW. Fatigue life prediction under variable loading based on a new non-linear continuum damage mechanics
model. Int J Fatigue 2006;28(2):89e95.[103] Huneau B, Mendez J. Evaluation of environmental effects on fatigue crack growth behaviour of a high strength steel in a saline solution with cathodic
protection. Int J Fatigue 2006;28(2):124e31.[104] Adedipe O, Brennan F, Kolios A. Corrosion fatigue load frequency sensitivity analysis. Mar Struct 2015;42:115e36.[105] Vasudevan AK, Sadananda K. Classification of environmentally assisted fatigue crack growth behavior. Int J Fatigue 2009;31(11/12):1696e708.[106] NORSOK Standard. Condition monitoring of loadbearing structures. 1997. N-005, December 1997.[107] Det Norske Veritas. Fatigue assessment of ship structures. 2014. Classification Notes 30.7, April 2014.[108] Det Norske Veritas. Corrosion protection for wind turbines. 2016. DNVGL-RP-0416, March 2016.[109] Computers and Structures Inc. SAP2000. Berkeley: California; 1995., Version 17. .[110] BMT ARGOSS, Maritime consultancy and weather forecasting company, Amersfoort, 3824 MR, Netherlands.[111] Segers JPM. Life extension investigation and repair options for deteriorating marine structures. From Sea to Shore? Meeting the Challenges of the Sea,
vol. 1. ICE Publishing; 2015. p. 1127e38.[112] Martinez LL, Barsoum Z, Paradowska A. State of the art: fatigue life extension of offshore installations. In: Proceedings of the 31st international
conference on ocean. Rio de Janeiro, Brazil: Offshore and Arctic Engineering; 2012.