Embed Size (px)
Citation preview
Signal & Image Processing : An International Journal(SIPIJ) Vol.2, No.1, March 2011
DOI : 10.5121/sipij.2011.2104 36
A FREQUENCY DOMAIN APPROACH TO PROTEIN
SEQUENCE SIMILARITY ANALYSIS AND
FUNCTIONAL CLASSIFICATION
Anu Sabarish.R1 and Tessamma Thomas
2
Department of Electronics, Cochin University of Science and Technology,
Kerala, India [email protected]
ABSTRACT
A new computational approach for protein sequence similarity analysis and functional classification
which is fast and easier compared to the conventional method is described. This technique uses Discrete
Wavelet Transform decomposition followed by sequence correlation analysis. The technique can also be
used for identifying the functional class of a newly obtained protein sequence. The classification was
done using a sample set of 270 protein sequences obtained from organisms of diverse origins and
functional classes, which gave a classification accuracy of 94.81%. Accuracy and reliability of the
technique is verified by comparing the results with that obtained from NCBI.
KEYWORDS
Genomic Signal Processing, Discrete Wavelet Transforms, Protein Sequence Similarity, Electron Ion
Interaction Potential, Protein functional classification.
1. INTRODUCTION
Genomic sequence analysis is a highly cross disciplinary field which aims at processing and
interpreting the vast information available from the bio molecular sequences, for quicker and
better understanding. A wide range of computational methods are being used with the intention
of extracting valuable information from these sequences in real time, where the traditional
methods based on statistical techniques are less suited.
DNA molecule has a double helix structure [1] consisting of two strands, where each strand
consists of a linked chain of smaller nucleotides or bases. There are 4 types of bases- adenine
(A), thymine (T), cytosine (C) and guanine (G). Three adjacent bases in a DNA sequence form a
triplet called codon. Each of these codons represents an amino acid and instructs the cell
machinery to produce the corresponding amino acid during the Translation phase of protein
synthesis. Thus a protein is a linear chain of amino acids which starts with a start codon ATG,
which corresponds to the amino acid methionine, followed by a sequence of amino acids and
ends with a stop codon. Among the numerous available amino acids only 20 are generally found
in living beings and they form a linear polypeptide chain by covalent linkages [2]. The amino
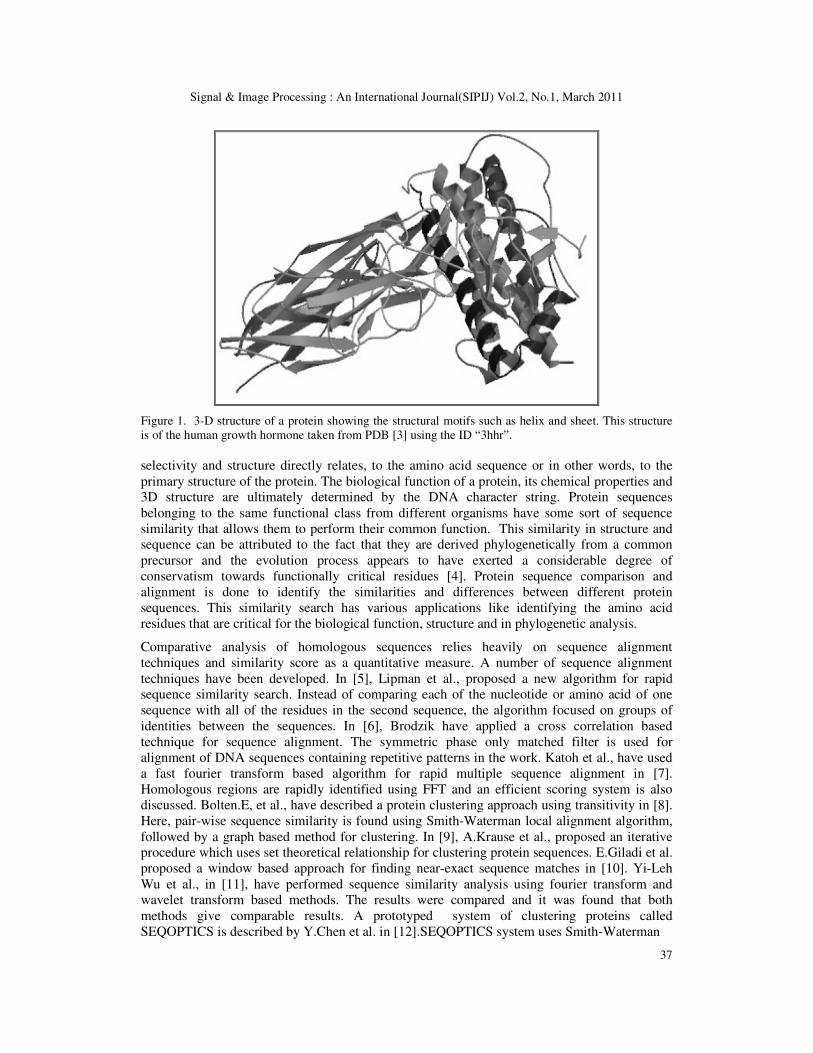
acid sequence that makes a protein is called its primary structure. The physical and chemical
interactions between the amino acids force the chain to take several different secondary
structures like alpha – helix and beta – sheet as shown in Figure 1. Protein molecules tend to
fold into complex three-dimensional structures forming weak bonds between their own atoms
and they are responsible for carrying out nearly all of the essential functions in the living cell by
properly binding to other molecules with a number of chemical bonds connecting neighbouring
atoms. This unique 3-D structure enables the protein to have target specificity, as protein –
target interaction occurs at predefined targets within the 3-D structure of the protein. This
Signal & Image Processing : An International Journal(SIPIJ) Vol.2, No.1, March 2011
37
Figure 1. 3-D structure of a protein showing the structural motifs such as helix and sheet. This structure
is of the human growth hormone taken from PDB [3] using the ID “3hhr”.
selectivity and structure directly relates, to the amino acid sequence or in other words, to the
primary structure of the protein. The biological function of a protein, its chemical properties and
3D structure are ultimately determined by the DNA character string. Protein sequences
belonging to the same functional class from different organisms have some sort of sequence
similarity that allows them to perform their common function. This similarity in structure and
sequence can be attributed to the fact that they are derived phylogenetically from a common
precursor and the evolution process appears to have exerted a considerable degree of
conservatism towards functionally critical residues [4]. Protein sequence comparison and
alignment is done to identify the similarities and differences between different protein
sequences. This similarity search has various applications like identifying the amino acid
residues that are critical for the biological function, structure and in phylogenetic analysis.
Comparative analysis of homologous sequences relies heavily on sequence alignment
techniques and similarity score as a quantitative measure. A number of sequence alignment
techniques have been developed. In [5], Lipman et al., proposed a new algorithm for rapid
sequence similarity search. Instead of comparing each of the nucleotide or amino acid of one
sequence with all of the residues in the second sequence, the algorithm focused on groups of
identities between the sequences. In [6], Brodzik have applied a cross correlation based
technique for sequence alignment. The symmetric phase only matched filter is used for
alignment of DNA sequences containing repetitive patterns in the work. Katoh et al., have used
a fast fourier transform based algorithm for rapid multiple sequence alignment in [7].
Homologous regions are rapidly identified using FFT and an efficient scoring system is also
discussed. Bolten.E, et al., have described a protein clustering approach using transitivity in [8].
Here, pair-wise sequence similarity is found using Smith-Waterman local alignment algorithm,
followed by a graph based method for clustering. In [9], A.Krause et al., proposed an iterative
procedure which uses set theoretical relationship for clustering protein sequences. E.Giladi et al.
proposed a window based approach for finding near-exact sequence matches in [10]. Yi-Leh
Wu et al., in [11], have performed sequence similarity analysis using fourier transform and
wavelet transform based methods. The results were compared and it was found that both
methods give comparable results. A prototyped system of clustering proteins called
SEQOPTICS is described by Y.Chen et al. in [12].SEQOPTICS system uses Smith-Waterman
Signal & Image Processing : An International Journal(SIPIJ) Vol.2, No.1, March 2011
38
algorithm for distance measurement and OPTICS for clustering. OPTICS (Ordering points to
identify the clustering structure) uses a density based clustering approach. In [13], M.G.
Grabherr et al. have described a procedure using fast fourier transform and cross correlation for
sequence alignment. In [14], Kin-pong Chan et al. have used wavelet transform using haar
wavelets for time series matching. In [15], S.A Aghili et al. have studied the effectiveness of the
integration of DFT and DWT techniques for sequence similarity search of biological sequences.
It is proposed as a pre-processing phase for any other sequence alignment technique as the
method can be used to prune most of the non desired sequences and reduce the real search
problem to only a fraction of the database. In [16], Veljkovic et al. proposed a Resonant
Recognition Model (RRM) where the presence of consensus spectrum corresponding to a
biological function is identified. In [17], Trad et al. used wavelet decomposition to extract
characteristic bands from protein sequences. A sequence scale similarity analysis is also
proposed to identify the functional similarity between sequences.
Traditional sequence comparison and alignment methods concentrate on local similarity, and the
alignment is achieved introducing insertions and deletions into the sequences. In this method a
sequence comparison and similarity measurement based on multi-resolution analysis of protein
sequence using discrete wavelet transform is adopted. This allows comparison of two sequences
at different resolutions. Based on this analysis a protein classification using simple sequence
correlation is done which can be used as a pre screening method before further detailed analysis.
The paper is organised as follows. The method for representing protein sequence data in
numerical form is mentioned in section 2. Section 3 describes the methodology used and in
section 4 the details of implementation and results are discussed.
2. NUMERICAL REPRESENTATION OF AMINO ACID SEQUENCE
Most of the identified protein sequence data is available freely over the web at various online
databases, one of which is the Entrez search and retrieval system of the National Center for
Biotechnology Information (NCBI) [18]. These Protein sequences are often in the form of a
sequence of characters, each representing a distinct amino acid. In order to perform an analysis
on these protein sequence using digital signal processing methods the amino acid character
sequence has to be represented in some numerical form. For a reliable representation, the
numerical values assigned to each amino acid should represent a physical characteristic of the
particular amino acid and should be relevant for the biological activity of these molecules [16].
A comparison of the informational capacity of various physicochemical, thermodynamic,
structural and statistical amino acid parameters are analysed in [19] and it is shown that Electron
Ion Interaction Potential (EIIP) is the most suitable known amino acid property that can be used
in structure-function analyses of proteins. The EIIP values for amino acids and nucleotides are
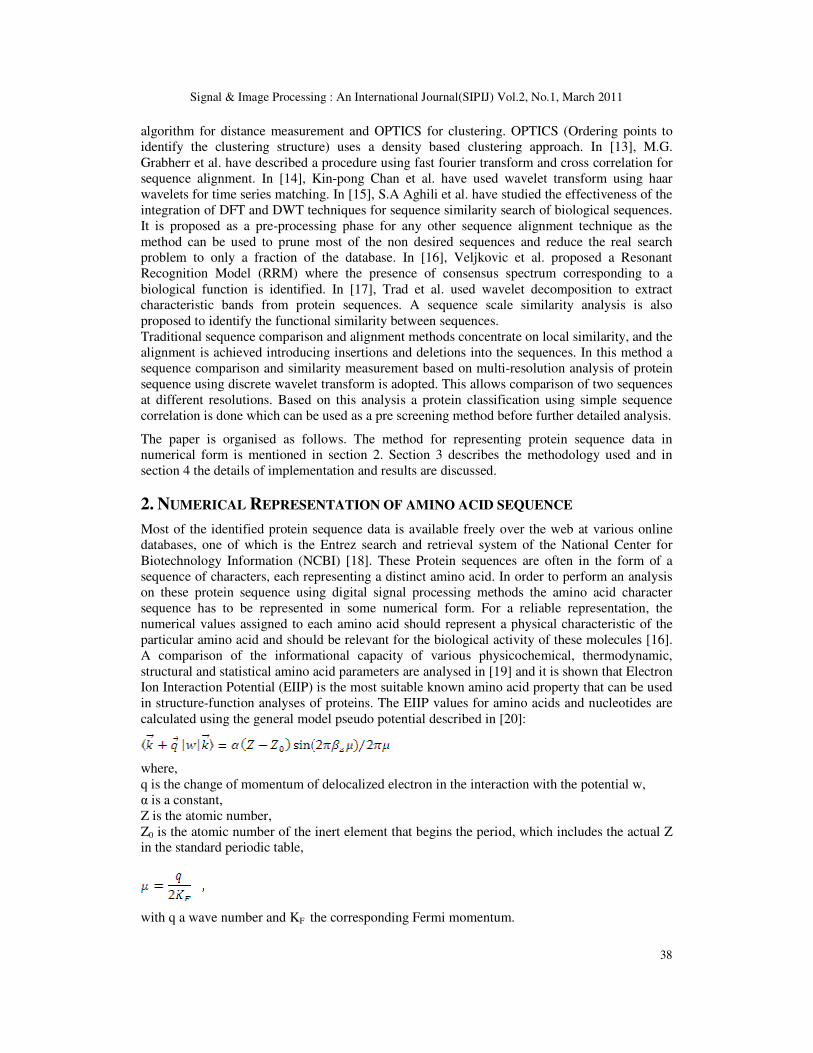
calculated using the general model pseudo potential described in [20]:
where,
q is the change of momentum of delocalized electron in the interaction with the potential w,
α is a constant,
Z is the atomic number,
Z0 is the atomic number of the inert element that begins the period, which includes the actual Z
in the standard periodic table,
with q a wave number and KF the corresponding Fermi momentum.
Signal & Image Processing : An International Journal(SIPIJ) Vol.2, No.1, March 2011
39
with (EF)Z the corresponding Fermi energy,
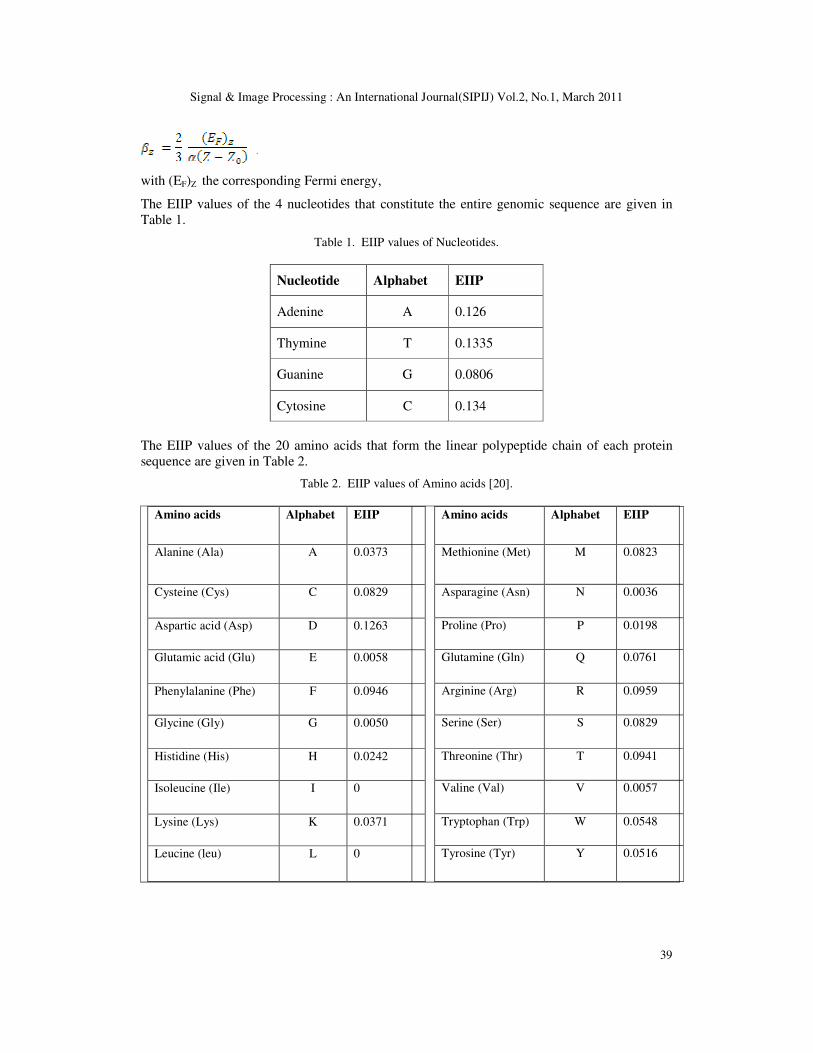
The EIIP values of the 4 nucleotides that constitute the entire genomic sequence are given in
Table 1.
Table 1. EIIP values of Nucleotides.
Nucleotide Alphabet EIIP
Adenine A 0.126
Thymine T 0.1335
Guanine G 0.0806
Cytosine C 0.134
The EIIP values of the 20 amino acids that form the linear polypeptide chain of each protein
sequence are given in Table 2.
Table 2. EIIP values of Amino acids [20].
Amino acids Alphabet EIIP
Alanine (Ala) A 0.0373
Cysteine (Cys) C 0.0829
Aspartic acid (Asp) D 0.1263
Glutamic acid (Glu) E 0.0058
Phenylalanine (Phe) F 0.0946
Glycine (Gly) G 0.0050
Histidine (His) H 0.0242
Isoleucine (Ile) I 0
Lysine (Lys) K 0.0371
Leucine (leu) L 0
Amino acids Alphabet EIIP
Methionine (Met) M 0.0823
Asparagine (Asn) N 0.0036
Proline (Pro) P 0.0198
Glutamine (Gln) Q 0.0761
Arginine (Arg) R 0.0959
Serine (Ser) S 0.0829
Threonine (Thr) T 0.0941
Valine (Val) V 0.0057
Tryptophan (Trp) W 0.0548
Tyrosine (Tyr) Y 0.0516
Signal & Image Processing : An International Journal(SIPIJ) Vol.2, No.1, March 2011
40
3. METHODOLOGY
3.1. Discrete Wavelet Transform decomposition of sequences
In Wavelet Transform (WT) analysis, a signal is represented as a linear combination of scaled
and shifted versions of the mother wavelet and scaling functions. Thus it represents a signal as
the sum of wavelets with different locations and scales, with the coefficients indicating the
strength of the contribution of the wavelet at the corresponding locations and scales. In DWT,
any discrete time sequence ƒ(n) of finite energy can be expressed in terms of the discrete time
basis functions as,
,
where, represent the coefficient corresponding to scale j and location k.
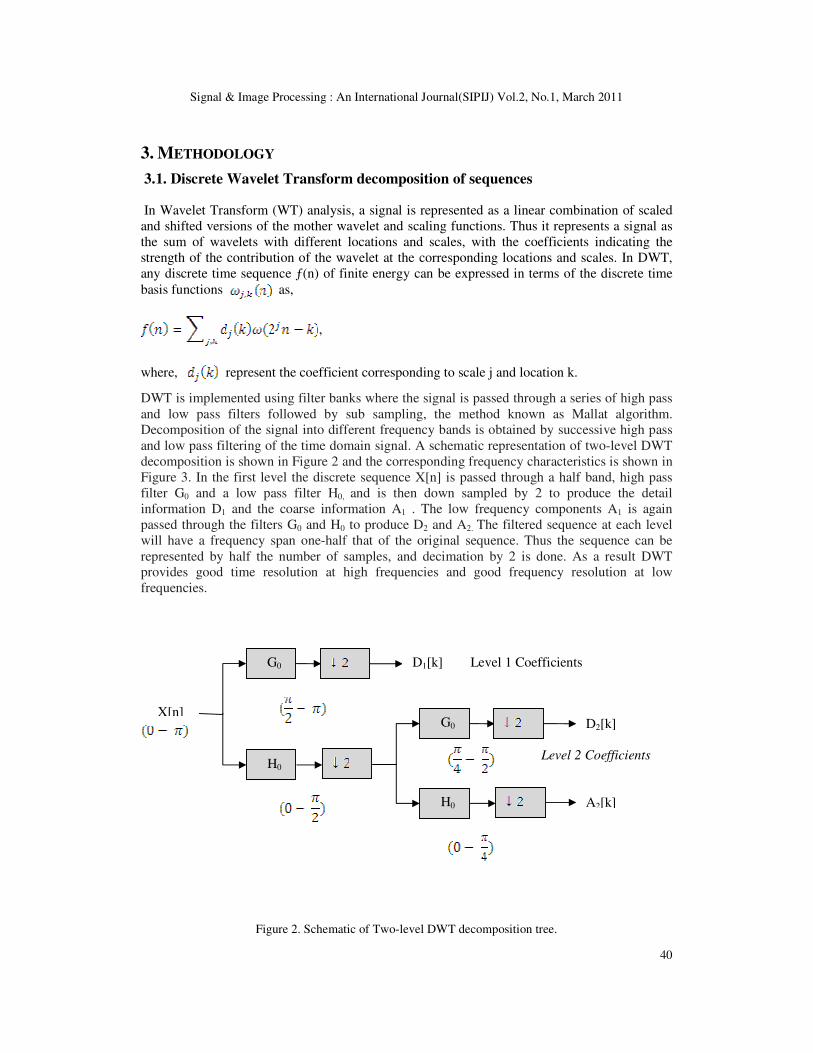
DWT is implemented using filter banks where the signal is passed through a series of high pass
and low pass filters followed by sub sampling, the method known as Mallat algorithm.
Decomposition of the signal into different frequency bands is obtained by successive high pass
and low pass filtering of the time domain signal. A schematic representation of two-level DWT
decomposition is shown in Figure 2 and the corresponding frequency characteristics is shown in
Figure 3. In the first level the discrete sequence X[n] is passed through a half band, high pass
filter G0 and a low pass filter H0, and is then down sampled by 2 to produce the detail
information D1 and the coarse information A1 . The low frequency components A1 is again
passed through the filters G0 and H0 to produce D2 and A2. The filtered sequence at each level
will have a frequency span one-half that of the original sequence. Thus the sequence can be
represented by half the number of samples, and decimation by 2 is done. As a result DWT
provides good time resolution at high frequencies and good frequency resolution at low
frequencies.
Figure 2. Schematic of Two-level DWT decomposition tree.
G0
H0
X[n]
G0
H0
D1[k] Level 1 Coefficients
D2[k]
A2[k]
Level 2 Coefficients
Signal & Image Processing : An International Journal(SIPIJ) Vol.2, No.1, March 2011
41
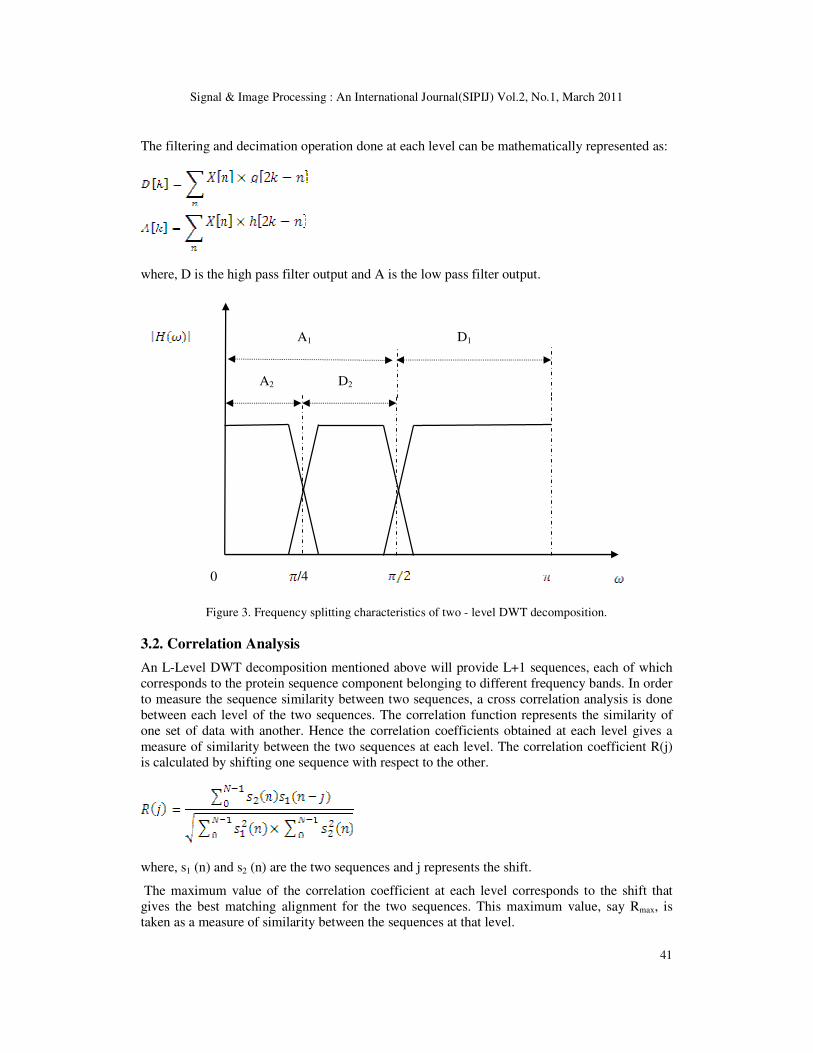
The filtering and decimation operation done at each level can be mathematically represented as:
where, D is the high pass filter output and A is the low pass filter output.
Figure 3. Frequency splitting characteristics of two - level DWT decomposition.
3.2. Correlation Analysis
An L-Level DWT decomposition mentioned above will provide L+1 sequences, each of which
corresponds to the protein sequence component belonging to different frequency bands. In order
to measure the sequence similarity between two sequences, a cross correlation analysis is done
between each level of the two sequences. The correlation function represents the similarity of
one set of data with another. Hence the correlation coefficients obtained at each level gives a
measure of similarity between the two sequences at each level. The correlation coefficient R(j)
is calculated by shifting one sequence with respect to the other.
where, s1 (n) and s2 (n) are the two sequences and j represents the shift.
The maximum value of the correlation coefficient at each level corresponds to the shift that
gives the best matching alignment for the two sequences. This maximum value, say Rmax, is
taken as a measure of similarity between the sequences at that level.
A2 D2
D1 A1
/4
A
0
Signal & Image Processing : An International Journal(SIPIJ) Vol.2, No.1, March 2011
42
4. PROTEIN SEQUENCE COMPARISON AND CLASSIFICATION
The protein sequences that are represented in numerical form are subjected to multi resolution
analysis using DWT followed by correlation analysis.
4.1 Database
The protein sequences that are used in this work are obtained from the National Center for
Biotechnology Information (NCBI) website [18]. The Myoglobin sequences mentioned in
section 4.3.1 are taken from the 24 different animals, Human, Finback whale, Dolphin, Baboon,
Cattle, Dog, Fox, Gorilla, Grey whale, Horse, Mouse, Killer whale, Marmoset, Minke whale,
Mole rat, Night monkey, Norway rat, Pika, Pilot whale, Rabbit, Red deer, Sheep, Sperm whale
and Zebra, all belonging to the class Mammalia. The 11 Beta Actin sequences used in the
second example are taken from Human, Vervet, Cattle, Chicken, Dog, Horse, Rhesus macaque,
Mouse, Pig, Rabbit and Rat. The 15 Cytochrome C sequences used in the third example are
taken from Cattle, Camel, Chicken, Chimpanzee, Dog, Gorilla, Grey whale, Horse, Mouse,
Human, Rat, Ostrich, Pig, Seal and Sheep. The 270 protein sequences used in section 4.3.2 are
also taken from the NCBI database.
4.2 Implementation
The protein sequences are first represented numerically using EIIP values, and normalized for
zero mean. Then a 3 level DWT decomposition using Bior3.3 wavelet is performed giving 4 set
of coefficient sequences, detail D1, D2, D3 and approximation A3. Bior3.3 decomposition
wavelet function and scaling function are very rugged and have many abrupt changes and are
shown suitable for the analysis of protein sequence which is also very rugged in nature [17].
The 4 coefficient sequences thus obtained from the two different proteins are subjected to
correlation analysis, giving 4 correlation values corresponding to Rmax as mentioned above,
representing the measure of sequence similarity. The sequence similarity thus obtained can be
used for functional classification of proteins for which two conditions are to be satisfied. The
first condition is that protein sequences belonging to same functional class should show very
strong sequence similarity. The second condition is that sequences from different classes that
belong to the same organism should not show any significant sequence similarity.
4.3 Results and Discussion
4.3.1 Correlation analysis of proteins
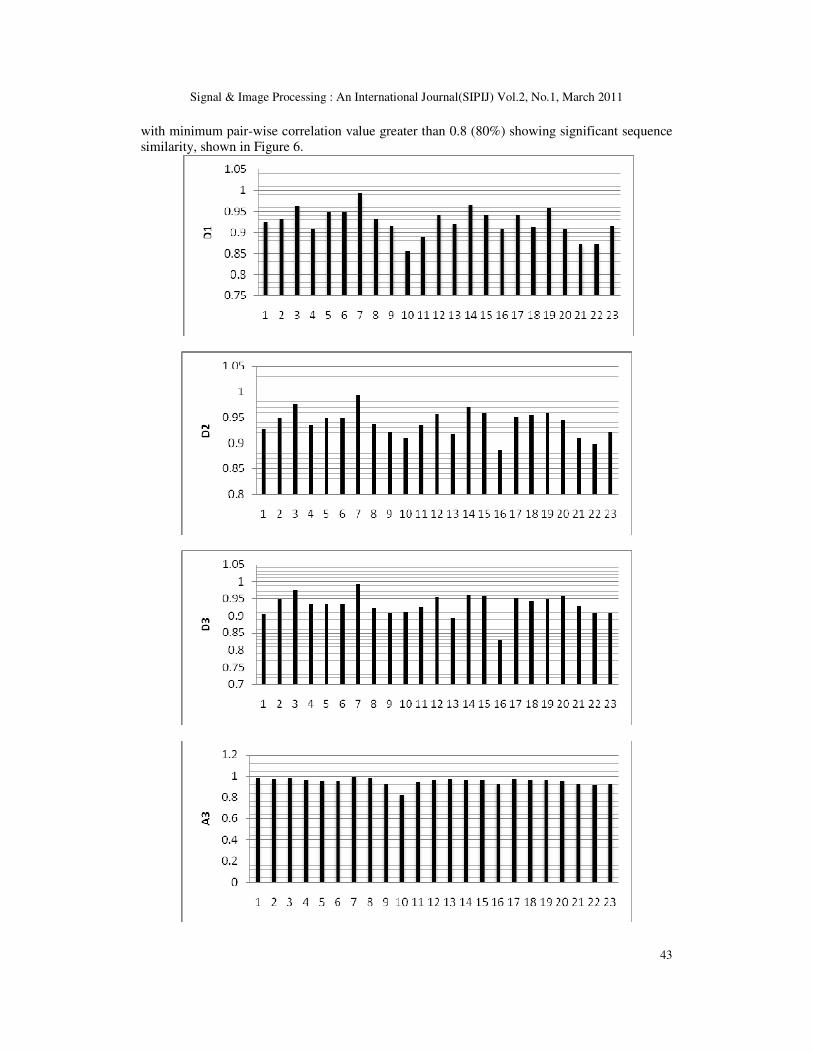
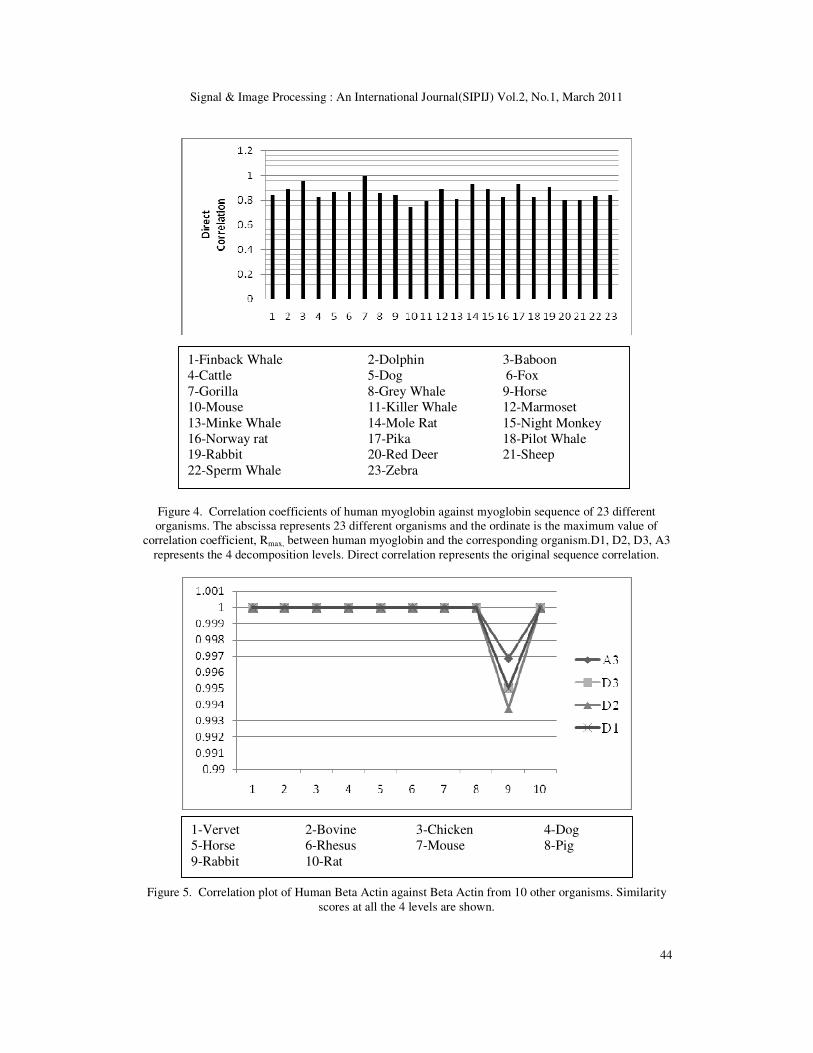
Initially Myoglobin sequences obtained from 24 different mammals mentioned above were
considered. Human Myoglobin was taken as reference and it was compared with the remaining
23 sequences. The result of the correlation analysis is shown in the Figure 4. It can be noted that
there is very strong correlation between every pair of sequences at all decomposition levels.
This shows not only the local pair-wise similarity but also the global sequence similarity which
we cannot obtain by conventional sequence alignment methods. There is more than 90%
similarity in almost all pairs, which points to the conservation of nucleotides which are critical
to the functionality of the proteins, across organisms.
As a second example Beta Actin sequences were considered. Here also, human beta actin
sequence is taken as reference and Beta Actin sequence of 10 other organisms are taken for
analysis. Nine out of Ten sequences showed 100% correlation while the remaining one showed
99% correlation. The result is shown in Figure 5. Third example taken was the Cytochrome C
sequence. Here Bovine Cytochrome C sequence is taken as reference and it was compared with
Cyt C sequences from 14 other origins. The result obtained was similar to the previous ones
Signal & Image Processing : An International Journal(SIPIJ) Vol.2, No.1, March 2011
43
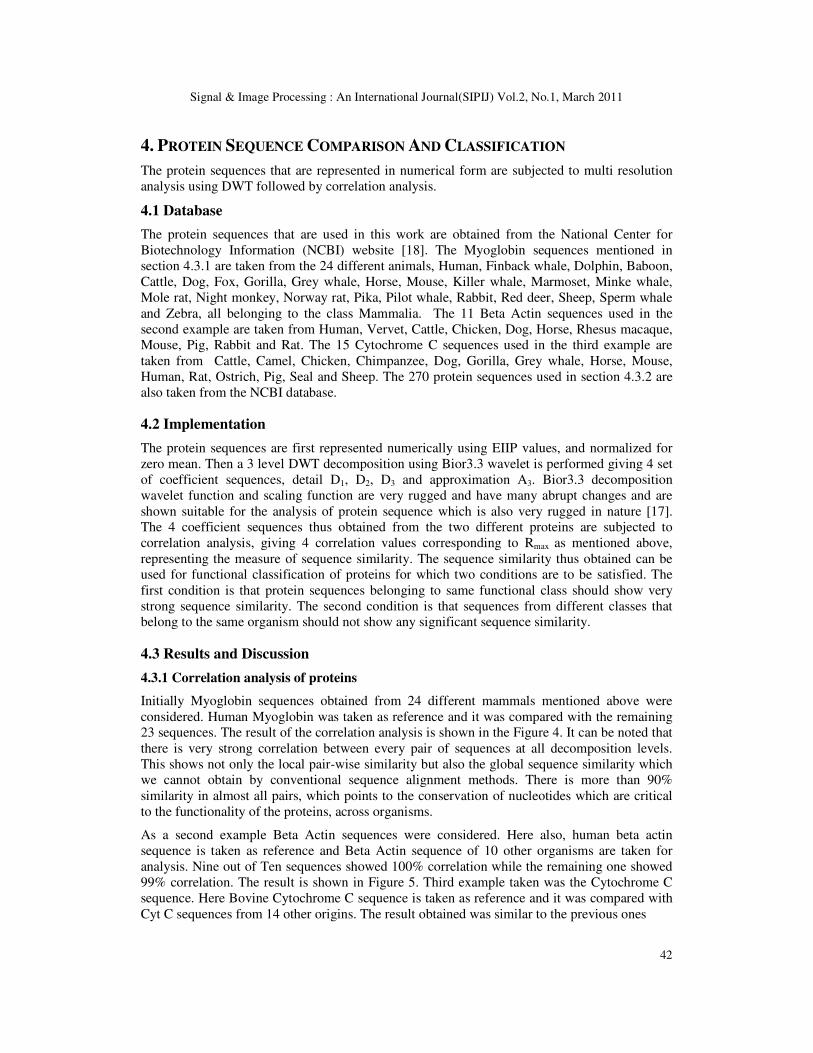
with minimum pair-wise correlation value greater than 0.8 (80%) showing significant sequence
similarity, shown in Figure 6.
Signal & Image Processing : An International Journal(SIPIJ) Vol.2, No.1, March 2011
44
Figure 4. Correlation coefficients of human myoglobin against myoglobin sequence of 23 different
organisms. The abscissa represents 23 different organisms and the ordinate is the maximum value of
correlation coefficient, Rmax, between human myoglobin and the corresponding organism.D1, D2, D3, A3
represents the 4 decomposition levels. Direct correlation represents the original sequence correlation.
Figure 5. Correlation plot of Human Beta Actin against Beta Actin from 10 other organisms. Similarity
scores at all the 4 levels are shown.
1-Finback Whale 2-Dolphin 3-Baboon
4-Cattle 5-Dog 6-Fox
7-Gorilla 8-Grey Whale 9-Horse
10-Mouse 11-Killer Whale 12-Marmoset
13-Minke Whale 14-Mole Rat 15-Night Monkey
16-Norway rat 17-Pika 18-Pilot Whale
19-Rabbit 20-Red Deer 21-Sheep
22-Sperm Whale 23-Zebra
1-Vervet 2-Bovine 3-Chicken 4-Dog
5-Horse 6-Rhesus 7-Mouse 8-Pig
9-Rabbit 10-Rat
Signal & Image Processing : An International Journal(SIPIJ) Vol.2, No.1, March 2011
45
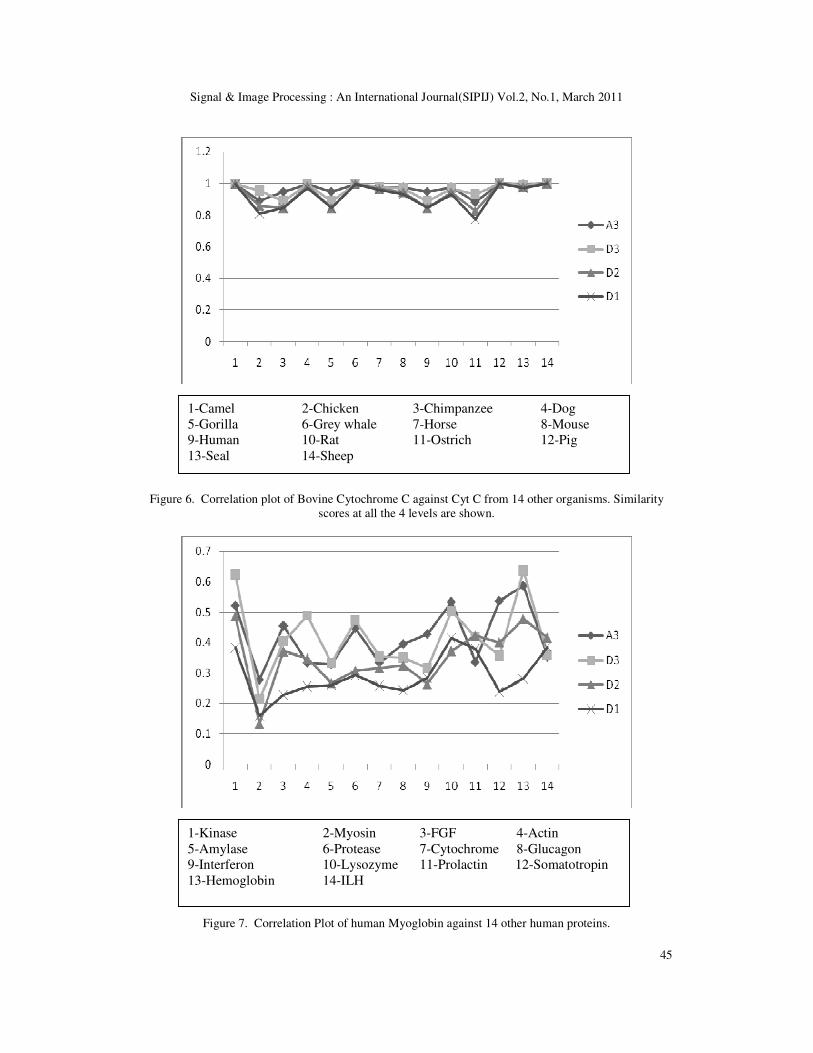
Figure 6. Correlation plot of Bovine Cytochrome C against Cyt C from 14 other organisms. Similarity
scores at all the 4 levels are shown.
Figure 7. Correlation Plot of human Myoglobin against 14 other human proteins.
1-Camel 2-Chicken 3-Chimpanzee 4-Dog
5-Gorilla 6-Grey whale 7-Horse 8-Mouse
9-Human 10-Rat 11-Ostrich 12-Pig
13-Seal 14-Sheep
1-Kinase 2-Myosin 3-FGF 4-Actin
5-Amylase 6-Protease 7-Cytochrome 8-Glucagon
9-Interferon 10-Lysozyme 11-Prolactin 12-Somatotropin
13-Hemoglobin 14-ILH
Signal & Image Processing : An International Journal(SIPIJ) Vol.2, No.1, March 2011
46
From the above results it is clear that the first condition is satisfied. To check the second
condition the Myoglobin sequence itself was taken as an example. Human myoglobin was
compared with 14 other human proteins. The result showed that there is no significant
correlation between any pair at any decomposition level as shown in Figure 7.
To confirm this, 15 different human protein sequences belonging to the following family:
Kinase, Myosin, FGF, Actin, Amylase, Protease, Cytochrome, Glucagon, Interferon, Lysozyme,
Myoglobin, Prolactin, Somatotropin, Hemoglobin and Insulin like hormone, were compared
among themselves. All the 120 possible pair wise similarity was measured and the results
analysed. The result showed that among these only one protein, alpha hemoglobin showed good
correlation (0.79) with kinase which is a functionally different protein. But this similarity is only
in one frequency band (D3) and all other bands showed negligible correlation. None of the
protein sequences showed similarity in all the bands with functionally dissimilar protein
sequence. This confirmed that the second condition is also satisfied and this can be used for
classifying protein sequences into different functional classes. Using this, when an unknown
sequence is obtained it can be compared with a list of reference proteins and by best match
criteria one can identify the functional class of that new protein.
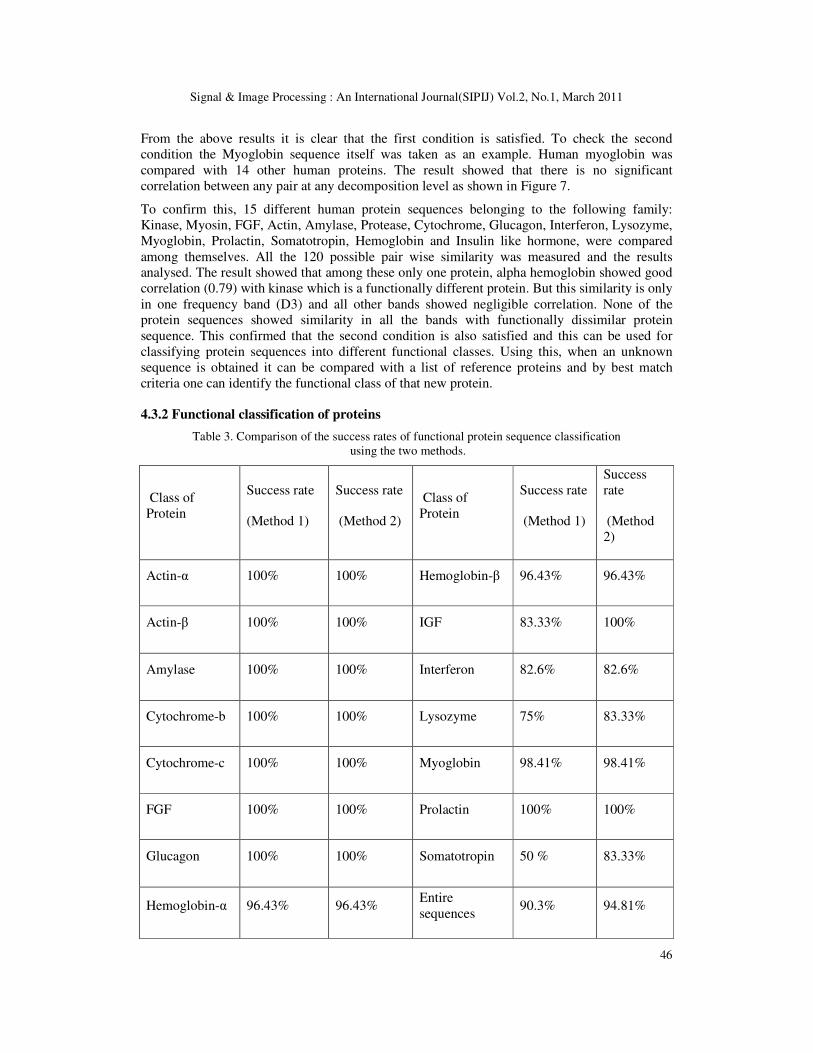
4.3.2 Functional classification of proteins
Table 3. Comparison of the success rates of functional protein sequence classification
using the two methods.
Class of
Protein
Success rate
(Method 1)
Success rate
(Method 2)
Class of
Protein
Success rate
(Method 1)
Success
rate
(Method
2)
Actin-α 100% 100% Hemoglobin-β 96.43% 96.43%
Actin-β 100% 100% IGF 83.33% 100%
Amylase 100% 100% Interferon 82.6% 82.6%
Cytochrome-b 100% 100% Lysozyme 75% 83.33%
Cytochrome-c 100% 100% Myoglobin 98.41% 98.41%
FGF 100% 100% Prolactin 100% 100%
Glucagon 100% 100% Somatotropin 50 % 83.33%
Hemoglobin-α 96.43% 96.43% Entire
sequences 90.3% 94.81%
Signal & Image Processing : An International Journal(SIPIJ) Vol.2, No.1, March 2011
47
A sequence correlation based classification was done on a sample set of 270 proteins belonging
to 15 functional classes. These protein sequences are taken from vertebrates of diverse origin.
Two methods were considered for the classification. In the first method, human protein
sequences corresponding to the 15 protein classes are taken as reference protein set. Then from
the sample set, each sequence is randomly selected and compared with reference set to find the
class that has the best sequence similarity using the DWT coefficient correlation method
mentioned in section 3.2.
The reference set consists of human protein sequence of the following classes: Alpha actin, Beta
actin, Amylase, Cytochrome-b, Cytochrome-c, FGF, Glucagon, Alpha hemoglobin, Beta
hemoglobin, IGF, Interferon, Lysozyme, Myoglobin, Prolactin and Somatotropin. The detailed
result of the classification are shown in the Table 3 as Method 1. Using this method 244 out of
the 270 protein sequences were classified to the correct family giving a success rate of 90.3%.
In method 2, further modification is done to improve the success rate by changing the selection
criterion of the reference protein. In the previous step human sequences were selected as
reference set which was a random selection. In this method reference protein for each class is
selected by finding the one that has the maximum similarity with the rest of the proteins in the
same class. Using this method 256 out of the 270 protein sequences were successfully classified
with a success rate of 94.81%. The result obtained by this procedure is also shown in Table 3 as
Method 2. The result illustrates that by selecting the reference proteins suitably the classification
accuracy can be fine tuned.
5. CONCLUSIONS
A simple and successful method for identifying the protein similarity using frequency domain
information is presented. The method uses a 3-level DWT decomposition using Bior3.3
wavelets followed by correlation analysis. This allows measurement of sequence similarity at 4
different scales, coarser A3 level to finer D1 level. Sequence scale similarity analysis of
Myoglobin, Beta Actin and Cytochrome C taken from different organisms have been performed.
It is seen that protein sequences of same functional class from different origins have strong
correlation showing high sequence similarity. 15 functionally different protein sequences from
human were taken and all the possible 120 combinations of pair wise similarity were analysed
which clearly showed that protein sequences of different class taken from the same organism
have no significant sequence similarity. Based on the above inference, classification is done on
a sample set of 270 protein sequences obtained from organisms of diverse origins and functional
class using two different methods. Using method 1, with human sequence as reference set, 244
out of the 270 samples were successfully classified with an accuracy of 90.3%. Using method 2,
where reference set is selected based on maximum similarity criteria, 256 out of the 270
samples were successfully classified with an accuracy of 94.81%.Also when a new protein
sequence is obtained, this method can be used as an initial step for identifying the functional
class to which it belongs. The paper compared all the results with the NCBI database for
verifying the reliability and accuracy of the results.
6. REFERENCES
[1] J.D. Watson & F.H.C. Crick, (1953) “A structure for DNA”, Nature, Vol. 171, pp 737-738.
[2] P. Ramachandran & A. Antoniou, (2008) “Identification of hot-spot locations in proteins using
digital filters”, IEEE Journal of selected topics in signal processing, Vol. 2, No.3, pp 378–389.
[3] Protein Data Bank, Available: http://www.pdb.org/.
[4] E. Margoliash, (1963) “Primary structure and evolution of cytochrome c”, Proceedings of the
National academy of sciences of the USA, Vol. 50, pp 672-679.
Signal & Image Processing : An International Journal(SIPIJ) Vol.2, No.1, March 2011
48
[5] Lipman D.J & Pearson.W.R, (1985) “Rapid and sensitive protein similarity searches”, Science,
Vol. 227, pp 1435-1441.
[6] A.K.Brodzik (2005) “A comparative study of cross correlation methods for alignment of DNA
sequences containing repetitive patterns”, European signal processing conference EU-SIPCO
2005.
[7] K.Katoh, K.Misawa, K.Kuma & T.Miyata (2002) “MAFFT: a novel method for rapid multi[ple
sequence alignment based on fast Fourier transform”, Nucleic acids research, Vol. 30, No.14, pp
3059–3066.
[8] E.Bolten. et al. (2001) “Clustering protein sequences –structure prediction by transitive
homology”, Bioinformatics, Vol. 17, No.10, pp 935–941.
[9] A.Krause & M.Vingron (1998) “A set theoretic approach to database searching and clustering”,
Bioinformatics, Vol. 14, No.5, pp 430–438.
[10] E.Giladi et al. (2002) “SST: an algorithm for finding near exact sequence matches in time
proportional to the logarithm of the database size”, Bioinformatics, Vol. 18, No.6, pp 873–879.
[11] Yi-Leh Wu et al. (2000) “A comparison of DFT and DWT based similarity search in Time-
Series Databases”, CIKM, pp 488–495.
[12] Y.Chen et al. (2006) “SEQOPTICS: a protein sequence clustering system”, BMC Bioinformatics,
Vol. 7.
[13] M.G.Grabherr. et al. (2010) “Genome-wide synteny through highly sensitive sequence
alignment: Sastuma”, Bioinformatics, Vol. 26, No.9, pp 1145–1151.
[14] Kin-pong Chan & A.W Fu (1999) “Efficient time series matching by wavelets”, International
conference on data engineering, pp.126.
[15] S.A.Aghili. et al. (2005) “Sequence similarity search using discrete fourier and wavelet
transformation techniques”, International Journal on Artificial Intelligence Tools, Vol. 14, No.5,
pp 733–754.
[16] V.Veljkovic, I.Cosic, B.Dimitrijevic & D.Lalovic, (1985) “Is it possible to analyze DNA and
protein sequences by the methods of digital signal processing?”, IEEE Transactions on
Biomedical Engineering, Vol. BME-32, No. 5, pp 337-341.
[17] C.H.De Trad, Q.Fang & I.Cosic, (2002) “Protein sequence comparison based on the wavelet
transform approach”, Protein Engineering, Vol. 15, No.3, pp 193–203.
[18] National Center for Biotechnology Information, Available: http://www.ncbi.nlm.nih.gov/.
[19] J.Lazovic, (1996) “Selection of amino acid parameters for fourier transform-based analysis of
proteins”, CABIOS Communication, Vol. 12, No. 6, pp 553-562.
[20] V.Veljkovic & I.Slavic, (1972) “Simple General-Model Pseudopotential”, Physical Review
Letters, Vol. 29, No. 2, pp 105-107.
Signal & Image Processing : An International Journal(SIPIJ) Vol.2, No.1, March 2011
49
Authors
[1] Anu Sabarish.R graduated from Government Engineering
College, Thrissur, India in Electronics and Communication
Engineering (2005), completed his M.Tech in Digital
Electronics (2007) and is pursuing Ph.D in the area of Genomic
Signal Processing from Cochin University of Science and
Technology, India. His area of interest includes Genomic Signal
Processing and Time Frequency Analysis.
[2] Dr.Tessamma Thomas received her M.Tech. and Ph.D from
Cochin University of Science and Technology, Cochin-22,
India. At present she is working as Professor in the Department
of Electronics, Cochin University of Science and Technology.
She has to her credit more than 80 research papers, in various
research fields, published in International and National journals
and conferences. Her areas of interest include digital signal /
image processing, bio medical image processing, super
resolution, content based image retrieval, genomic signal
processing, etc.