Embed Size (px)
Citation preview
A Functional Approach to Quality Function Deployment (Putting the Function back into Quality Function Deployment) Technical Paper 0001/sb January 2007
Dr Stuart Burge Abstract This paper presents a mechanism, the use of which greatly facilitates conducting Phase 1 of Quality Function Deployment through the alignment of a Holistic Requirements Model to the structure of the Phase 1 chart. Based upon Systems Thinking, this alignment is also shown to provide a Requirements Architecture for the future phases and charts of Quality Function Deployment. A simple case study is presented to illustrate the mechanism and the Requirements Architecture.
Copyright and IPR Notice: Copyright and IPR exists and is held by BHW and the Systems Engineering Company. This work must not be copied,
distributed or otherwise used without the express permission of BHW
1.0 Introduction Quality Function Deployment (QFD) presents a prima facia case for being a powerful tool to aid the translation of vague, imprecise Customer Requirements into clear measurable Technical Requirements. Based upon a sequence of matrix charts, QFD provides a logical and systematic methodology for capturing and organizing the requirements translations necessary for effective and efficient new system introduction. Despite the apparent simplicity of QFD, many organizations frequently find it difficult to apply and discard it in favour of less rigorous approaches. The difficulties experienced are often due to:
• The type of market in which QFD is applied; • Confusion over requirement categories; • Problem complexity.
This paper provides a way of overcoming these difficulties through consideration of a Holistic Requirements Model. It is shown that the Holistic Requirements Model greatly facilitates the translation of Customer Requirements to Technical Requirements. It also provides an invaluable insight into how best to populate the First Phase QFD chart. Furthermore, this insight pervades the other deployment phases of QFD, providing a sound and logical Requirements Architecture for handling the complexity of large and small systems throughout new system introduction. Section 2 provides a brief review of the classic QFD methodology highlighting the issue of translating vague, ambiguous and subjective Customer Requirements to clear measurable Technical Requirements. Section 3 introduces the concept of broad and narrow customer markets in order to further elucidate the issue of applying QFD in the case of over-detailed Customer Requirements. Section 4 introduces the Holistic Requirements Model that is centred on the functionality of the system under consideration. Section 5 shows how the use of the Holistic Requirements Model can greatly assist in constructing a phase 1 QFD chart. This alignment is also shown to provide a Requirements Architecture for the future phases of QFD. In the penultimate section, section 6, the approach proposed in the earlier sections is developed into a practical and pragmatic approach that will enable an organization to benefit from clearer, more consistent and complete technical translations of Customer Requirements. This is illustrated with a simple case study.
Finally, section 7 presents the conclusions of this paper.
2.0 Review of the Classic QFD Methodology
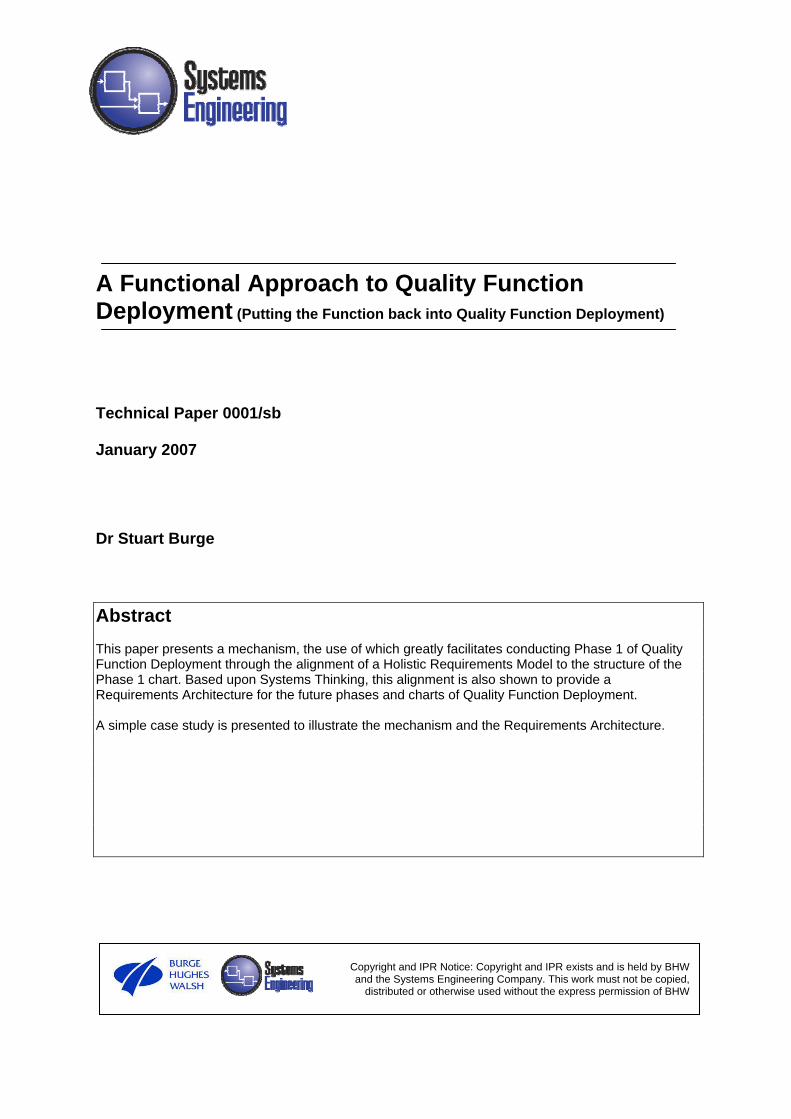
2.1 Overview of the Methodology Texts on QFD such as Clausing 1991 and Arako 1980 describe QFD as a technique for translating Customer Requirements into Company Requirements from the market analysis through to production control. This is achieved in many ways but the most prevalent is through four requirements translation phases as shown in Figure 1, with a QFD chart forming the translation medium.
A Functional Approach to Quality Function Deployment January 2007 2
Customer Requirements
Design Requirements
Part Requirements
Manufacturing Requirements
Production Requirements
TranslatedintoQFD 1
QFD 2
QFD 3
QFD 4
Translatedinto
Translatedinto
Translatedinto
Definition Phase
Concept Phase
Realisation Phase
Delivery Phase
Figure 1: The 4 Phases of QFD Notice that, the overall QFD process looks similar to traditional practice – but it is unique in that the same tool is used to manage each translation. This is a key feature of QFD and ensures the preservation of knowledge and flow-down of requirements giving excellent traceability. As Figure 1 clearly indicates, there are four QFD charts that manage the requirement flow-down through the new product introduction process. Each chart is associated with the corresponding phase. Current custom and practice labels the phases simply as 1 to 4. Whilst this can be a very useful ‘shorthand’, it is not particularly informative. This paper, therefore, will also use the phase terminology given in Table 1.
Phase Name Phase No Brief Description
Definition 1 The translation of Customer Requirements in to measurable Technical Requirements
Concept 2 The translation of Technical Requirements into compliant Design Solution (down to part or component ) Requirements
Realization 3 The translation of the Design Solution Requirements into Realization System Requirements
Delivery 4 The translation of the Realization System Requirements into a set of Delivery Requirements
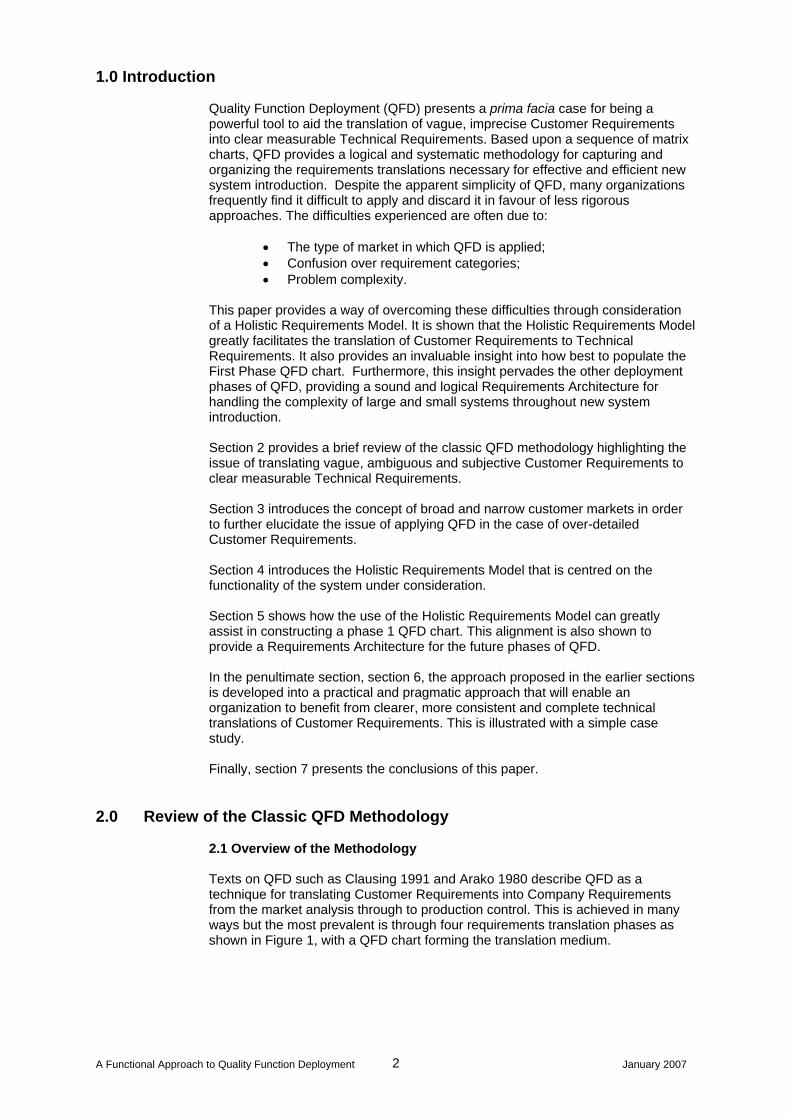
Table 1: Quality Function Deployment phase Terminology The QFD chart itself is a special form of Matrix Diagram [Mizuno1988] of which the basic format is shown in Figure 2. In essence, the QFD chart comprises two sets (lists) of requirements, List 1 and List 2, plus a relationship matrix that indicates the presence and strength of the relationships that exist between those requirements through a set of three symbols:
indicates a strong relationship indicates a medium indicates a weak relationship
A Functional Approach to Quality Function Deployment January 2007 3
LIST 2 of Requirements
Item
A
Item
B
Item
C
Item
D
...
...
...
Item 1
Item 2
Item 3
Item 4
… LI
ST 1
of
Req
uire
men
ts
…
Item
s re
late
d to
ite
m A
Item
s re
late
d to
item
B
Item
s re
late
d to
item
C
Item
s re
late
d to
item
D
LIST 3 many-to-one related with List 2
Figure 2: The Basic Structure of the QFD Type Matrix Diagram An empty cell in the relationship matrix indicates no relationship. There is a third list that typically provides target values for the requirements in List 2. The origin of QFD is with manufactured products. However, it can and has been applied to the development of processes and services. QFD is a genuine systems tool but is easiest to explain in terms of product-based systems. For this reason, the following brief overview will be product-based. In the Definition Phase, List 1 comprises the ‘Customer requirements’ which are often expressed in vague and ambiguous terms. List 2 comprises the set of derived measurable Technical ‘Design Requirements’ for the product under development. The matrix, therefore, is used to show the relationships between the Customer and Design Requirements. Blank or sparse rows or columns within the relationship matrix highlight potential deficiencies in either set of requirements. List 3 is used to set target levels for the measurable Technical Design Requirements in List 2. Requirements deployment and traceability is achieved through the transfer of Lists 2 and 3 to the next chart. So for example, the Concept Phase of QFD starts with transfer of Lists 2 and 3 from QFD 1 to list 1 on the QFD 2 chart. Effort is then expended to determine the design solution to best meet the measurable Technical Design Requirements1. This design solution is entered as a set of Design Solution (Part) Requirements’ as list 2 of the QFD 2 chart. The numerical values/characteristics/targets of the Part Requirements are entered as List 3. This process of transferring from one chart to another continues with the Realization Phase. List 2 (Part Requirements) and List 3 (the numerical targets) are transferred to List 1 of the QFD 3 chart. List 2 of the QFD 3 chart contains the manufacturing process steps and key parameters (the ‘Manufacturing Requirements’) that have been selected to realize the new product. Again, the relationship matrix can be constructed to ensure that there are no deficiencies.
1 Finding the ‘best’ design solution can take many weeks or months! It is an important point to note that completing a QFD chart can take a considerable amount of time. What the QFD chart can provide, therefore, is a visual and powerful method for monitoring the maturity of system development.
A Functional Approach to Quality Function Deployment January 2007 4
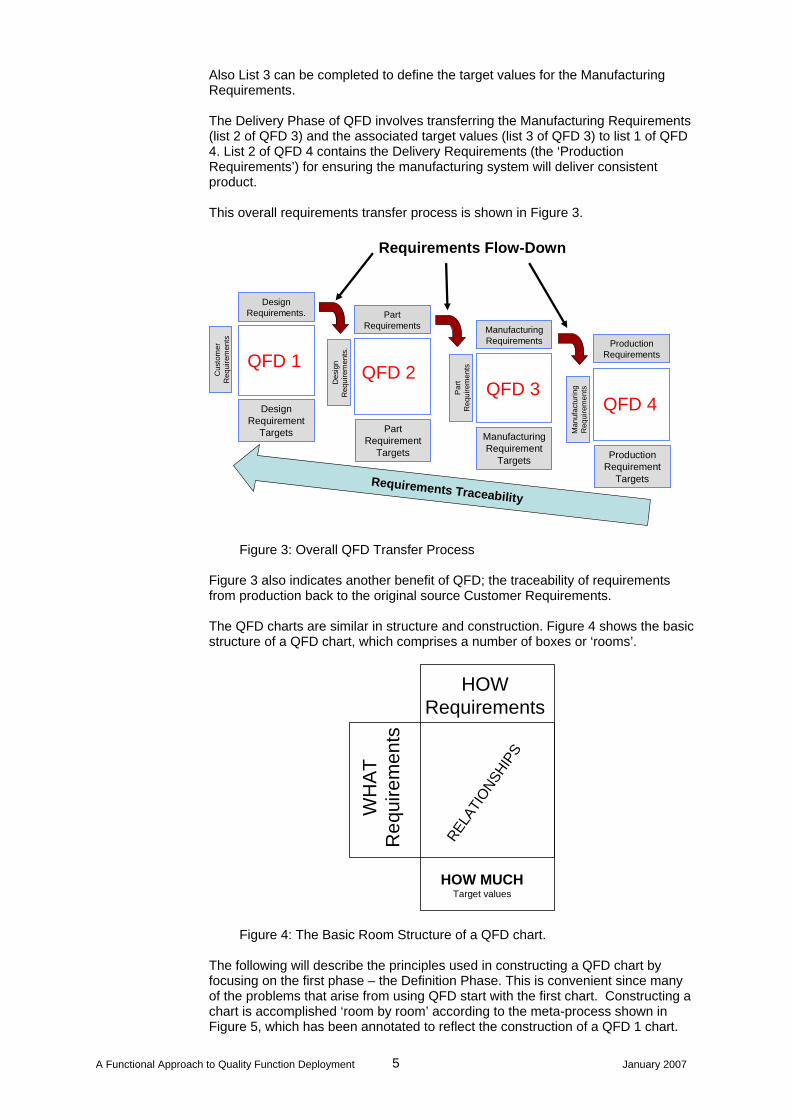
Also List 3 can be completed to define the target values for the Manufacturing Requirements. The Delivery Phase of QFD involves transferring the Manufacturing Requirements (list 2 of QFD 3) and the associated target values (list 3 of QFD 3) to list 1 of QFD 4. List 2 of QFD 4 contains the Delivery Requirements (the ‘Production Requirements’) for ensuring the manufacturing system will deliver consistent product. This overall requirements transfer process is shown in Figure 3.
Requirements Flow-Down
Design Requirements.
Cus
tom
er
Req
uire
men
ts
Design Requirement
Targets
Part Requirements
Des
ign
Req
uire
men
ts.
Part Requirement
Targets
Manufacturing Requirements
House of Quality
#3
Part
Req
uire
men
ts
Manufacturing Requirement
Targets
Production Requirements
House of Quality
#4
Man
ufac
turin
g R
equi
rem
ents
QFD 1 QFD 2QFD 3
QFD 4
Production Requirement
TargetsRequirements Traceability
Figure 3: Overall QFD Transfer Process Figure 3 also indicates another benefit of QFD; the traceability of requirements from production back to the original source Customer Requirements.
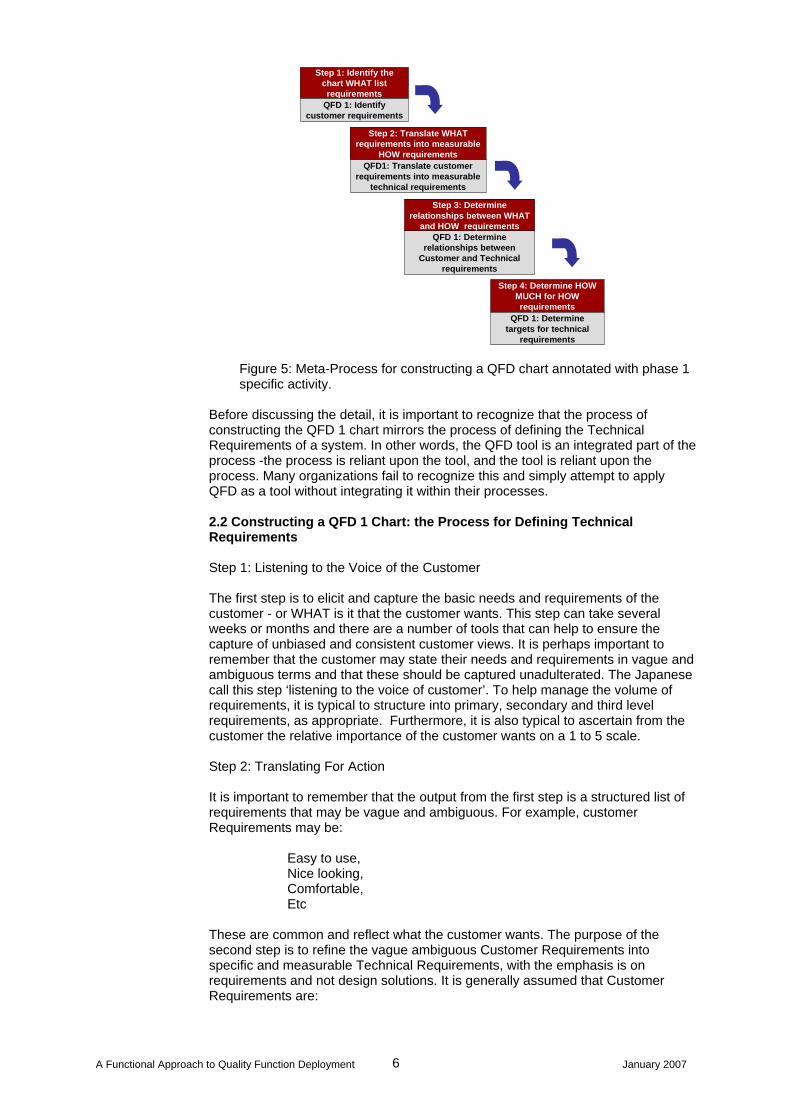
The QFD charts are similar in structure and construction. Figure 4 shows the basic structure of a QFD chart, which comprises a number of boxes or ‘rooms’.
HOW MUCHTarget values
WH
AT
Req
uire
men
ts
HOWRequirements
RELAT
IONSH
IPS
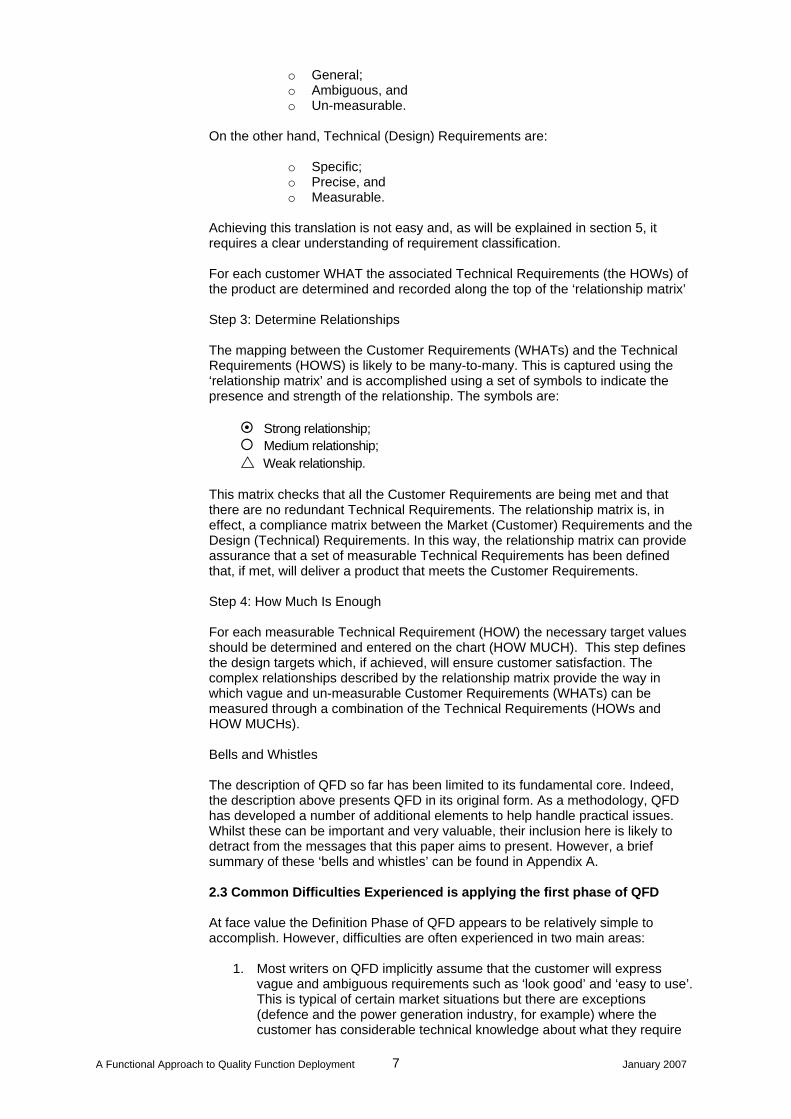
Figure 4: The Basic Room Structure of a QFD chart. The following will describe the principles used in constructing a QFD chart by focusing on the first phase – the Definition Phase. This is convenient since many of the problems that arise from using QFD start with the first chart. Constructing a chart is accomplished ‘room by room’ according to the meta-process shown in Figure 5, which has been annotated to reflect the construction of a QFD 1 chart.
A Functional Approach to Quality Function Deployment January 2007 5
Step 1: Identify the chart WHAT list
requirements
Step 2: Translate WHAT requirements into measurable
HOW requirements
Step 4: Determine HOW MUCH for HOW requirements
Step 3: Determine relationships between WHAT
and HOW requirements
QFD 1: Identify customer requirements
QFD1: Translate customer requirements into measurable
technical requirements
QFD 1: Determine relationships between
Customer and Technical requirements
QFD 1: Determine targets for technical
requirements
Figure 5: Meta-Process for constructing a QFD chart annotated with phase 1 specific activity.
Before discussing the detail, it is important to recognize that the process of constructing the QFD 1 chart mirrors the process of defining the Technical Requirements of a system. In other words, the QFD tool is an integrated part of the process -the process is reliant upon the tool, and the tool is reliant upon the process. Many organizations fail to recognize this and simply attempt to apply QFD as a tool without integrating it within their processes.
2.2 Constructing a QFD 1 Chart: the Process for Defining Technical Requirements Step 1: Listening to the Voice of the Customer The first step is to elicit and capture the basic needs and requirements of the customer - or WHAT is it that the customer wants. This step can take several weeks or months and there are a number of tools that can help to ensure the capture of unbiased and consistent customer views. It is perhaps important to remember that the customer may state their needs and requirements in vague and ambiguous terms and that these should be captured unadulterated. The Japanese call this step ‘listening to the voice of customer’. To help manage the volume of requirements, it is typical to structure into primary, secondary and third level requirements, as appropriate. Furthermore, it is also typical to ascertain from the customer the relative importance of the customer wants on a 1 to 5 scale. Step 2: Translating For Action It is important to remember that the output from the first step is a structured list of requirements that may be vague and ambiguous. For example, customer Requirements may be: Easy to use, Nice looking, Comfortable, Etc These are common and reflect what the customer wants. The purpose of the second step is to refine the vague ambiguous Customer Requirements into specific and measurable Technical Requirements, with the emphasis is on requirements and not design solutions. It is generally assumed that Customer Requirements are:
A Functional Approach to Quality Function Deployment January 2007 6
o General; o Ambiguous, and o Un-measurable.
On the other hand, Technical (Design) Requirements are:
o Specific; o Precise, and o Measurable.
Achieving this translation is not easy and, as will be explained in section 5, it requires a clear understanding of requirement classification. For each customer WHAT the associated Technical Requirements (the HOWs) of the product are determined and recorded along the top of the ‘relationship matrix’ Step 3: Determine Relationships The mapping between the Customer Requirements (WHATs) and the Technical Requirements (HOWS) is likely to be many-to-many. This is captured using the ‘relationship matrix’ and is accomplished using a set of symbols to indicate the presence and strength of the relationship. The symbols are:
Strong relationship; Medium relationship; Weak relationship.
This matrix checks that all the Customer Requirements are being met and that there are no redundant Technical Requirements. The relationship matrix is, in effect, a compliance matrix between the Market (Customer) Requirements and the Design (Technical) Requirements. In this way, the relationship matrix can provide assurance that a set of measurable Technical Requirements has been defined that, if met, will deliver a product that meets the Customer Requirements. Step 4: How Much Is Enough For each measurable Technical Requirement (HOW) the necessary target values should be determined and entered on the chart (HOW MUCH). This step defines the design targets which, if achieved, will ensure customer satisfaction. The complex relationships described by the relationship matrix provide the way in which vague and un-measurable Customer Requirements (WHATs) can be measured through a combination of the Technical Requirements (HOWs and HOW MUCHs).
Bells and Whistles The description of QFD so far has been limited to its fundamental core. Indeed, the description above presents QFD in its original form. As a methodology, QFD has developed a number of additional elements to help handle practical issues. Whilst these can be important and very valuable, their inclusion here is likely to detract from the messages that this paper aims to present. However, a brief summary of these ‘bells and whistles’ can be found in Appendix A. 2.3 Common Difficulties Experienced is applying the first phase of QFD At face value the Definition Phase of QFD appears to be relatively simple to accomplish. However, difficulties are often experienced in two main areas:
1. Most writers on QFD implicitly assume that the customer will express vague and ambiguous requirements such as ‘look good’ and ‘easy to use’. This is typical of certain market situations but there are exceptions (defence and the power generation industry, for example) where the customer has considerable technical knowledge about what they require
A Functional Approach to Quality Function Deployment January 2007 7
and will provide this in copious detail. This detail can frustrate any attempts to apply the process described in section 2.2.
2. Undertaking the ‘Translating for Action’ is not always as writers on QFD
would suggest. The advice given by most authors is to ‘brainstorm’ the Technical Requirements from the Customer Requirements. Given that the ‘voice of the customer’ step should aim to capture the expressed vague and ambiguous Customer Requirements, brainstorming the Technical Requirements is not at all easy. Moreover, completeness of the translation is difficult to verify. Consequently, errors made in QFD Phase 1 can be permeated through phases 2, 3 and 4 engendering a false confidence of completeness.
This paper explores these two difficulties and offers practical approaches on how to deal with them. Both require the understanding of market types and the categories of requirements.
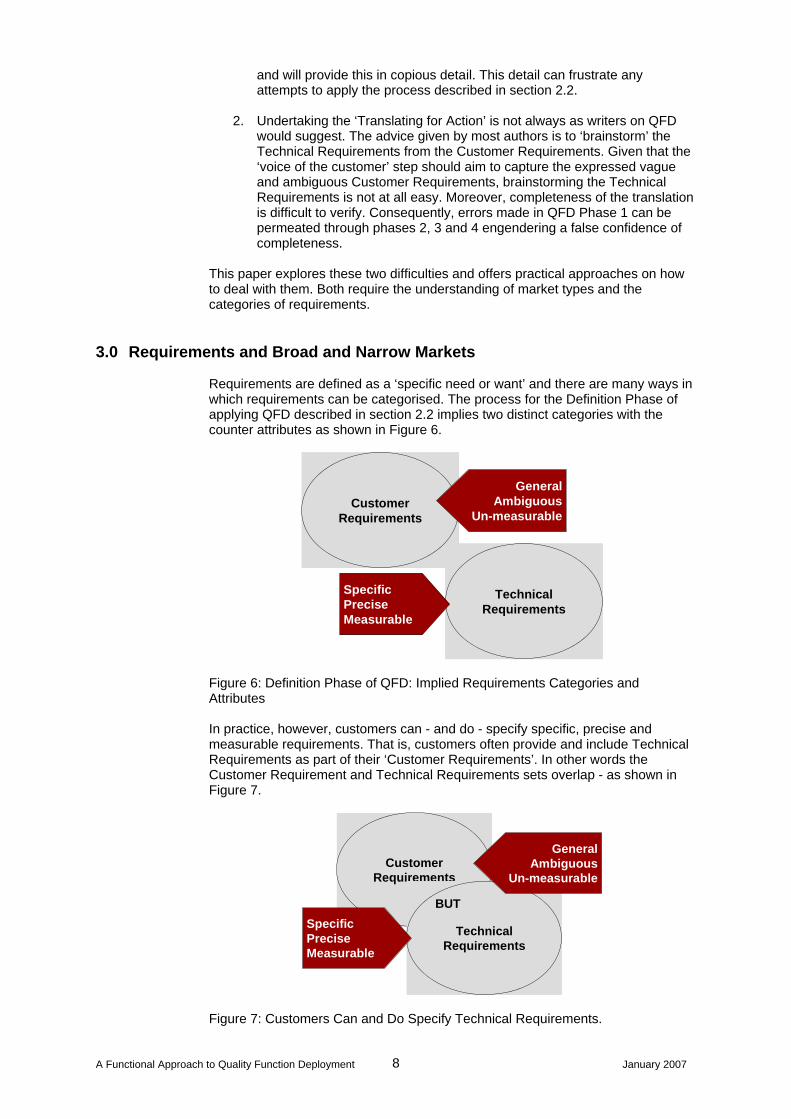
3.0 Requirements and Broad and Narrow Markets Requirements are defined as a ‘specific need or want’ and there are many ways in which requirements can be categorised. The process for the Definition Phase of applying QFD described in section 2.2 implies two distinct categories with the counter attributes as shown in Figure 6.
Customer Requirements
TechnicalRequirements
SpecificPreciseMeasurable
GeneralAmbiguous
Un-measurable
Figure 6: Definition Phase of QFD: Implied Requirements Categories and Attributes In practice, however, customers can - and do - specify specific, precise and measurable requirements. That is, customers often provide and include Technical Requirements as part of their ‘Customer Requirements’. In other words the Customer Requirement and Technical Requirements sets overlap - as shown in Figure 7.
Customer Requirements
TechnicalRequirements
SpecificPreciseMeasurable
GeneralAmbiguous
Un-measurable
BUT
Figure 7: Customers Can and Do Specify Technical Requirements.
A Functional Approach to Quality Function Deployment January 2007 8
The degree to which they overlap depends upon the market type, of which there are two extremes:
• The Broad Market • The Narrow Market
Broad Markets are typified by mass produced products/services. These include motor vehicle and consumer products and services, such as banking. With potentially vast numbers of customers, attempting to satisfy every customer fully is likely to be difficult, if not impossible. A compromise requirement that satisfies the majority of customers is the most that can usually be achieved. However, the best compromise must be sought. Where a product/service is intended to meet the demands of a broad market, the producer will generate the requirement after consultations with a large number of potential customers. Indeed, companies that sell in Board Markets normally establish a Marketing Function to determine Customer Requirements. This group of people:
• Determine the need for a product/service; • Accurately define the market sector and demand, since doing so will
determine the grade, quantity, price and timing for the product/service; • Accurately determine Customers Requirements by reviewing previous
products/services and market needs. One of the difficult tasks here is to identify any un-stated expectations or biases held by customers;
• Communicate Customer Requirements clearly and accurately to other parts of the organization.
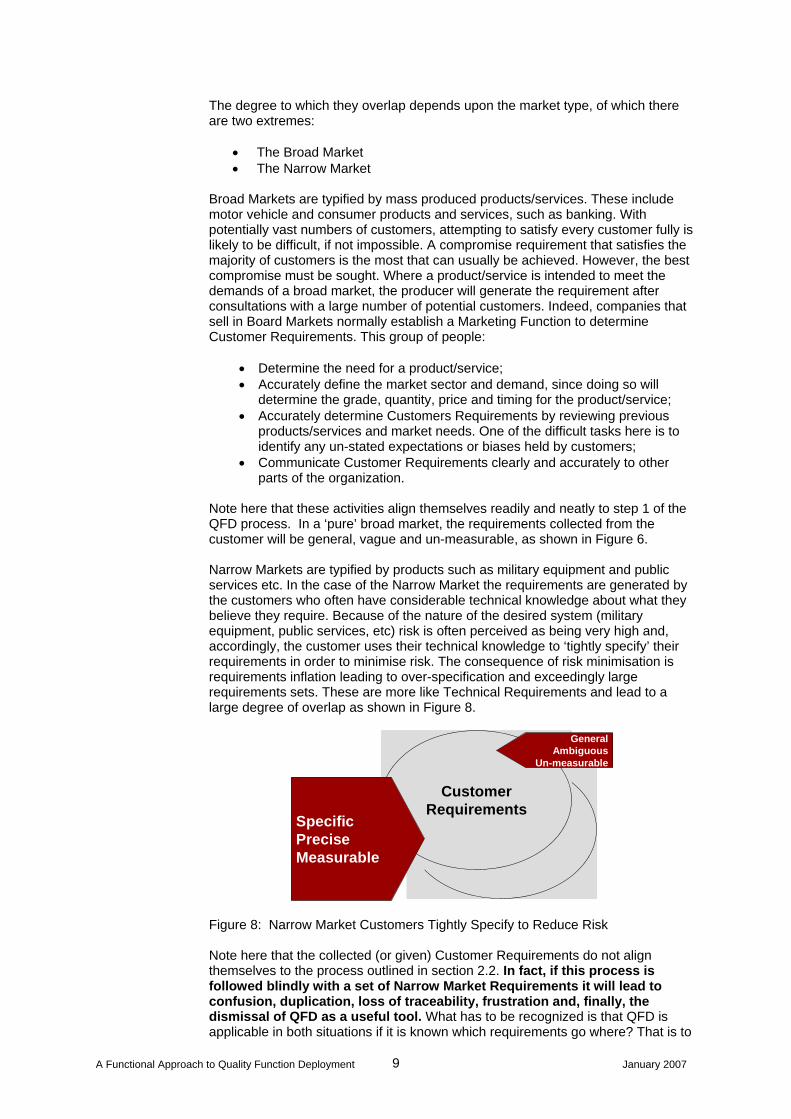
Note here that these activities align themselves readily and neatly to step 1 of the QFD process. In a ‘pure’ broad market, the requirements collected from the customer will be general, vague and un-measurable, as shown in Figure 6. Narrow Markets are typified by products such as military equipment and public services etc. In the case of the Narrow Market the requirements are generated by the customers who often have considerable technical knowledge about what they believe they require. Because of the nature of the desired system (military equipment, public services, etc) risk is often perceived as being very high and, accordingly, the customer uses their technical knowledge to ‘tightly specify’ their requirements in order to minimise risk. The consequence of risk minimisation is requirements inflation leading to over-specification and exceedingly large requirements sets. These are more like Technical Requirements and lead to a large degree of overlap as shown in Figure 8.
TechnicalRequirements
Customer Requirements
SpecificPreciseMeasurable
GeneralAmbiguous
Un-measurable
Figure 8: Narrow Market Customers Tightly Specify to Reduce Risk Note here that the collected (or given) Customer Requirements do not align themselves to the process outlined in section 2.2. In fact, if this process is followed blindly with a set of Narrow Market Requirements it will lead to confusion, duplication, loss of traceability, frustration and, finally, the dismissal of QFD as a useful tool. What has to be recognized is that QFD is applicable in both situations if it is known which requirements go where? That is to
A Functional Approach to Quality Function Deployment January 2007 9
say customer specified Technical Requirements belong in the HOW room and not in the WHAT room.
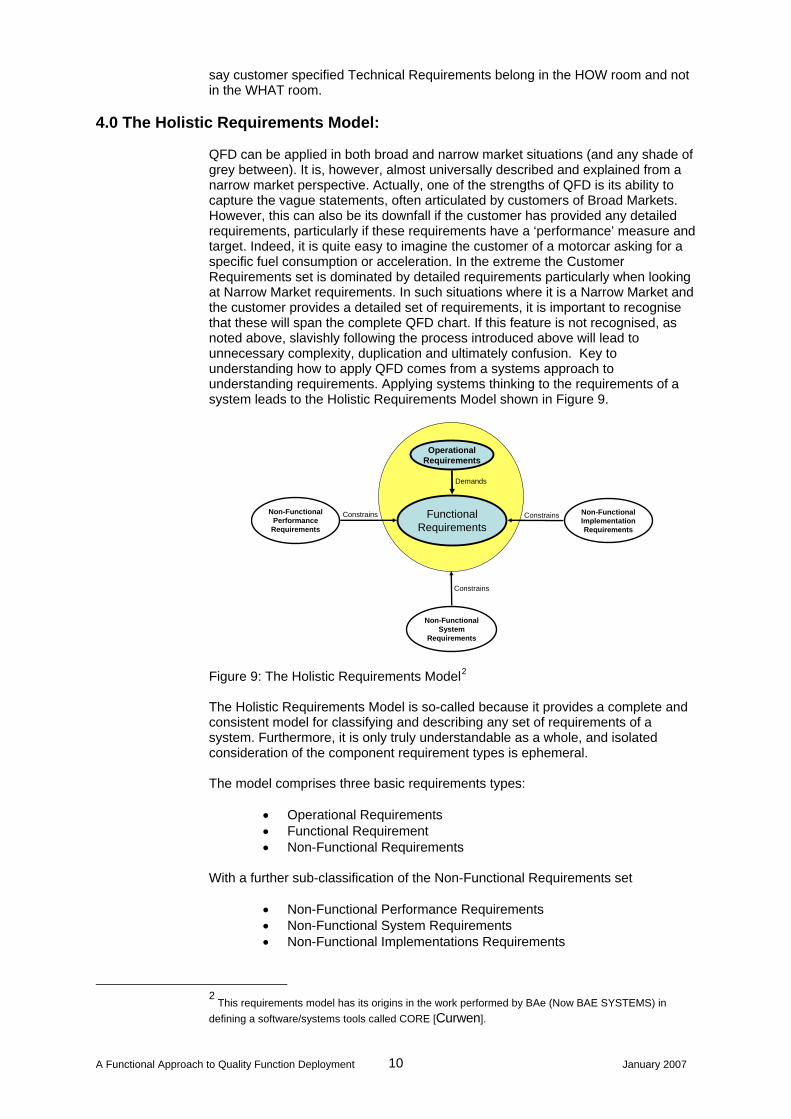
4.0 The Holistic Requirements Model: QFD can be applied in both broad and narrow market situations (and any shade of grey between). It is, however, almost universally described and explained from a narrow market perspective. Actually, one of the strengths of QFD is its ability to capture the vague statements, often articulated by customers of Broad Markets. However, this can also be its downfall if the customer has provided any detailed requirements, particularly if these requirements have a ‘performance’ measure and target. Indeed, it is quite easy to imagine the customer of a motorcar asking for a specific fuel consumption or acceleration. In the extreme the Customer Requirements set is dominated by detailed requirements particularly when looking at Narrow Market requirements. In such situations where it is a Narrow Market and the customer provides a detailed set of requirements, it is important to recognise that these will span the complete QFD chart. If this feature is not recognised, as noted above, slavishly following the process introduced above will lead to unnecessary complexity, duplication and ultimately confusion. Key to understanding how to apply QFD comes from a systems approach to understanding requirements. Applying systems thinking to the requirements of a system leads to the Holistic Requirements Model shown in Figure 9.
Non-Functional Performance
Requirements
Functional Requirements
Non-Functional Implementation Requirements
OperationalRequirements
Non-Functional System
Requirements
Constrains Constrains
Constrains
Demands
Figure 9: The Holistic Requirements Model2 The Holistic Requirements Model is so-called because it provides a complete and consistent model for classifying and describing any set of requirements of a system. Furthermore, it is only truly understandable as a whole, and isolated consideration of the component requirement types is ephemeral. The model comprises three basic requirements types:
• Operational Requirements • Functional Requirement • Non-Functional Requirements
With a further sub-classification of the Non-Functional Requirements set
• Non-Functional Performance Requirements • Non-Functional System Requirements • Non-Functional Implementations Requirements
2
This requirements model has its origins in the work performed by BAe (Now BAE SYSTEMS) in defining a software/systems tools called CORE [Curwen].
A Functional Approach to Quality Function Deployment January 2007 10
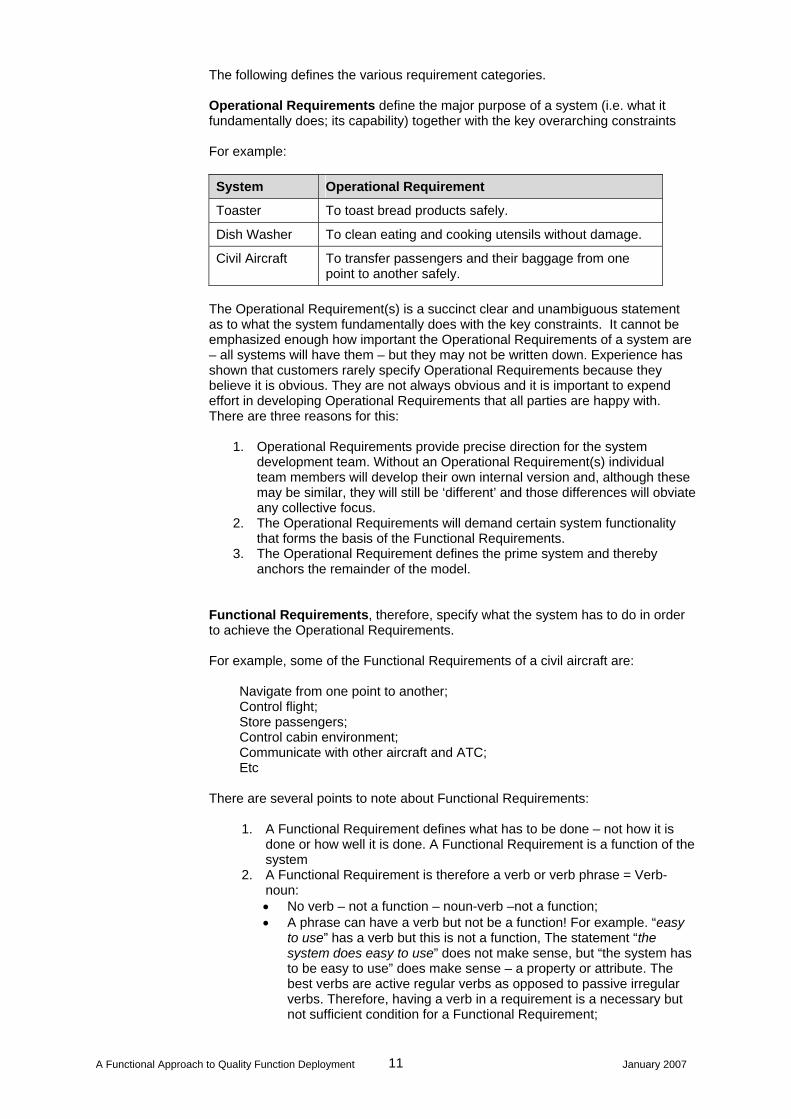
The following defines the various requirement categories. Operational Requirements define the major purpose of a system (i.e. what it fundamentally does; its capability) together with the key overarching constraints For example: System Operational Requirement
Toaster To toast bread products safely.
Dish Washer To clean eating and cooking utensils without damage.
Civil Aircraft To transfer passengers and their baggage from one point to another safely.
The Operational Requirement(s) is a succinct clear and unambiguous statement as to what the system fundamentally does with the key constraints. It cannot be emphasized enough how important the Operational Requirements of a system are – all systems will have them – but they may not be written down. Experience has shown that customers rarely specify Operational Requirements because they believe it is obvious. They are not always obvious and it is important to expend effort in developing Operational Requirements that all parties are happy with. There are three reasons for this:
1. Operational Requirements provide precise direction for the system development team. Without an Operational Requirement(s) individual team members will develop their own internal version and, although these may be similar, they will still be ‘different’ and those differences will obviate any collective focus.
2. The Operational Requirements will demand certain system functionality that forms the basis of the Functional Requirements.
3. The Operational Requirement defines the prime system and thereby anchors the remainder of the model.
Functional Requirements, therefore, specify what the system has to do in order to achieve the Operational Requirements. For example, some of the Functional Requirements of a civil aircraft are:
Navigate from one point to another; Control flight; Store passengers; Control cabin environment; Communicate with other aircraft and ATC; Etc
There are several points to note about Functional Requirements:
1. A Functional Requirement defines what has to be done – not how it is done or how well it is done. A Functional Requirement is a function of the system
2. A Functional Requirement is therefore a verb or verb phrase = Verb-noun: • No verb – not a function – noun-verb –not a function; • A phrase can have a verb but not be a function! For example. “easy
to use” has a verb but this is not a function, The statement “the system does easy to use” does not make sense, but “the system has to be easy to use” does make sense – a property or attribute. The best verbs are active regular verbs as opposed to passive irregular verbs. Therefore, having a verb in a requirement is a necessary but not sufficient condition for a Functional Requirement;
A Functional Approach to Quality Function Deployment January 2007 11
3. There are many levels of functions in a system. All of them should be determined;
4. Functions often transform inputs into outputs; 5. When identifying Functional Requirements the ‘system of interest’ should
be clear; 6. When defining Functional Requirements performance qualifiers should
be avoided. For example • Toast bread quickly; • Even toasting of bread.
7. Functional Requirements should be implementation independent (The choice of the expression “store passengers” is deliberate to avoid the use of “seat passengers” which clearly infers the solution.)
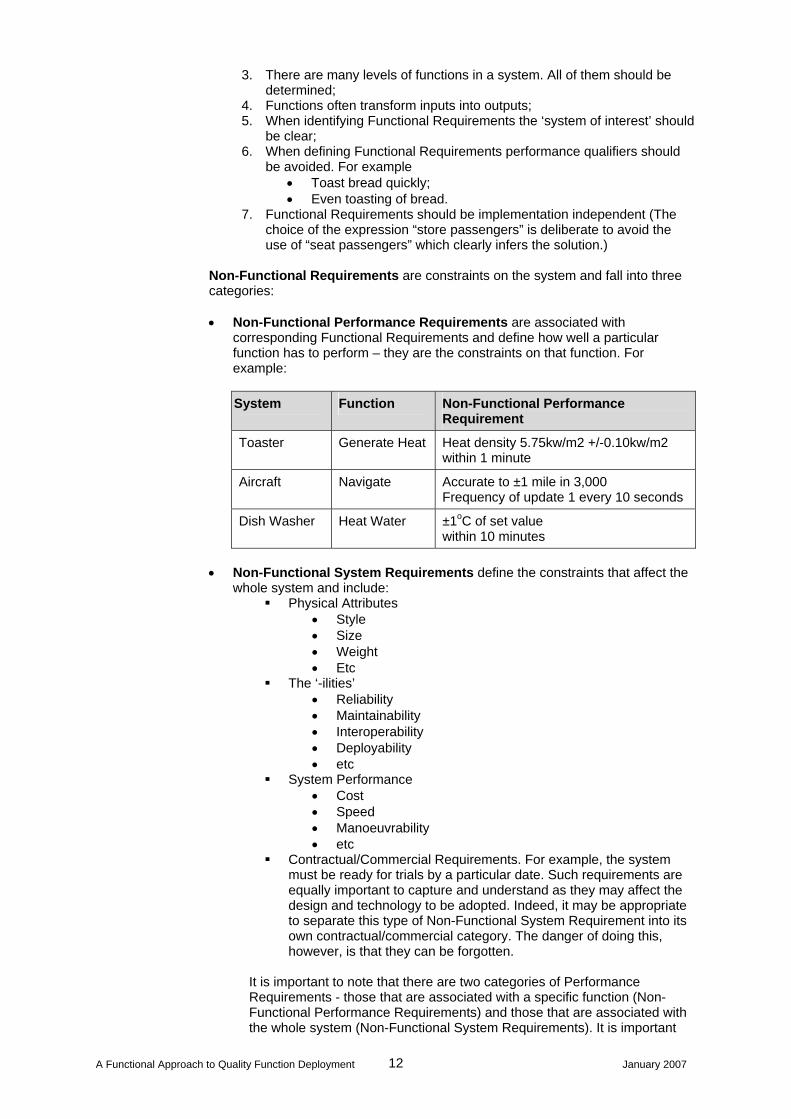
Non-Functional Requirements are constraints on the system and fall into three categories: • Non-Functional Performance Requirements are associated with
corresponding Functional Requirements and define how well a particular function has to perform – they are the constraints on that function. For example:
System Function Non-Functional Performance
Requirement
Toaster Generate Heat Heat density 5.75kw/m2 +/-0.10kw/m2 within 1 minute
Aircraft Navigate Accurate to ±1 mile in 3,000 Frequency of update 1 every 10 seconds
Dish Washer Heat Water ±1oC of set value within 10 minutes
• Non-Functional System Requirements define the constraints that affect the
whole system and include: Physical Attributes
• Style • Size • Weight • Etc
The ‘-ilities’ • Reliability • Maintainability • Interoperability • Deployability • etc
System Performance • Cost • Speed • Manoeuvrability • etc
Contractual/Commercial Requirements. For example, the system must be ready for trials by a particular date. Such requirements are equally important to capture and understand as they may affect the design and technology to be adopted. Indeed, it may be appropriate to separate this type of Non-Functional System Requirement into its own contractual/commercial category. The danger of doing this, however, is that they can be forgotten.
It is important to note that there are two categories of Performance Requirements - those that are associated with a specific function (Non-Functional Performance Requirements) and those that are associated with the whole system (Non-Functional System Requirements). It is important
A Functional Approach to Quality Function Deployment January 2007 12
(but sometimes difficult) to distinguish between them. In the early stages of system development, particularly if the system is unprecedented, it may not be clear if a particular Performance Requirements is at the Functional or System level. If this is the case, it should be categorized wherever suitable but subject to constant review.
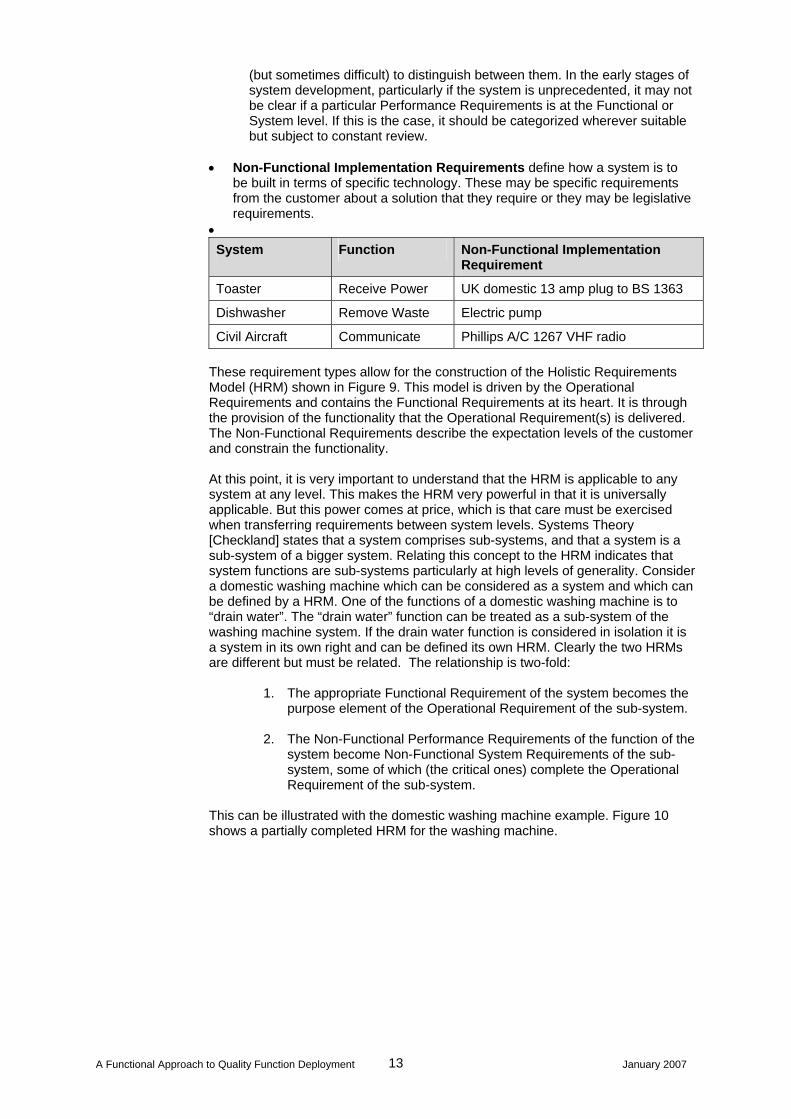
• Non-Functional Implementation Requirements define how a system is to
be built in terms of specific technology. These may be specific requirements from the customer about a solution that they require or they may be legislative requirements.
• System Function Non-Functional Implementation
Requirement
Toaster Receive Power UK domestic 13 amp plug to BS 1363
Dishwasher Remove Waste Electric pump
Civil Aircraft Communicate Phillips A/C 1267 VHF radio
These requirement types allow for the construction of the Holistic Requirements Model (HRM) shown in Figure 9. This model is driven by the Operational Requirements and contains the Functional Requirements at its heart. It is through the provision of the functionality that the Operational Requirement(s) is delivered. The Non-Functional Requirements describe the expectation levels of the customer and constrain the functionality. At this point, it is very important to understand that the HRM is applicable to any system at any level. This makes the HRM very powerful in that it is universally applicable. But this power comes at price, which is that care must be exercised when transferring requirements between system levels. Systems Theory [Checkland] states that a system comprises sub-systems, and that a system is a sub-system of a bigger system. Relating this concept to the HRM indicates that system functions are sub-systems particularly at high levels of generality. Consider a domestic washing machine which can be considered as a system and which can be defined by a HRM. One of the functions of a domestic washing machine is to “drain water”. The “drain water” function can be treated as a sub-system of the washing machine system. If the drain water function is considered in isolation it is a system in its own right and can be defined its own HRM. Clearly the two HRMs are different but must be related. The relationship is two-fold:
1. The appropriate Functional Requirement of the system becomes the purpose element of the Operational Requirement of the sub-system.
2. The Non-Functional Performance Requirements of the function of the
system become Non-Functional System Requirements of the sub-system, some of which (the critical ones) complete the Operational Requirement of the sub-system.
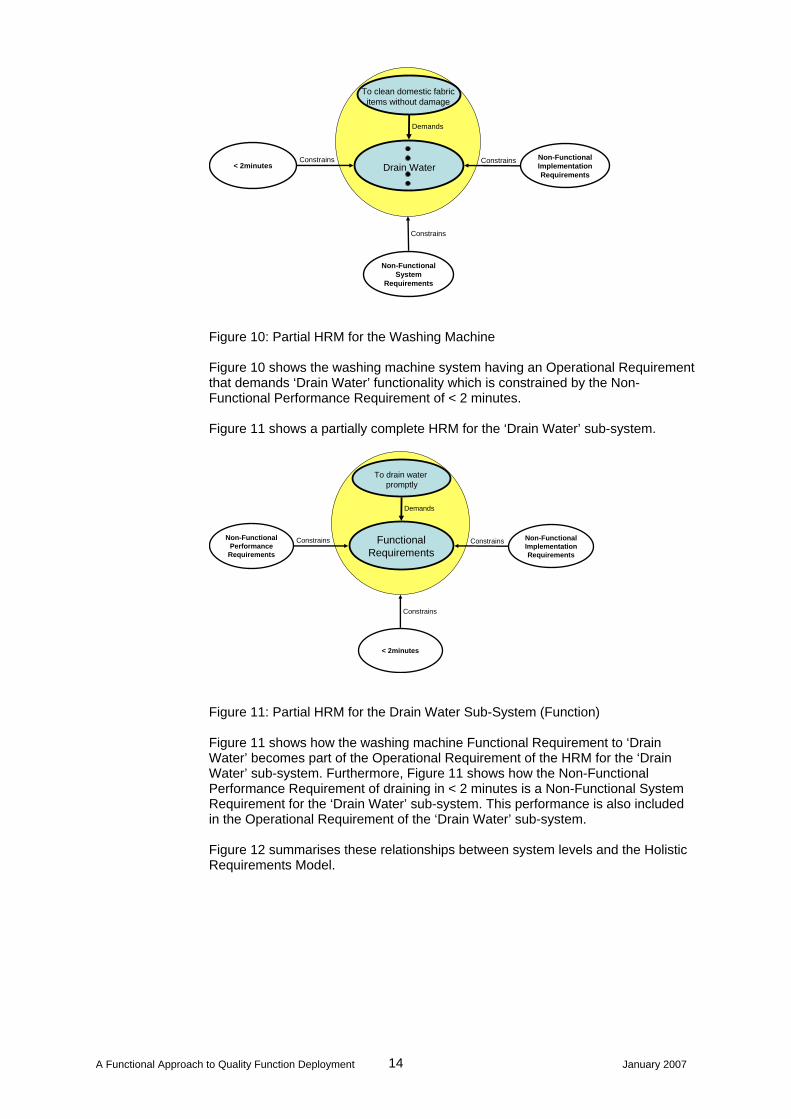
This can be illustrated with the domestic washing machine example. Figure 10 shows a partially completed HRM for the washing machine.
A Functional Approach to Quality Function Deployment January 2007 13
< 2minutesNon-Functional Implementation Requirements
Non-Functional System
Requirements
Constrains Constrains
Constrains
Demands
To clean domestic fabric items without damage
Drain Water
Figure 10: Partial HRM for the Washing Machine Figure 10 shows the washing machine system having an Operational Requirement that demands ‘Drain Water’ functionality which is constrained by the Non-Functional Performance Requirement of < 2 minutes. Figure 11 shows a partially complete HRM for the ‘Drain Water’ sub-system.
Non-Functional Performance
Requirements
FunctionalRequirements
Non-Functional Implementation Requirements
< 2minutes
Constrains Constrains
Constrains
Demands
To drain waterpromptly
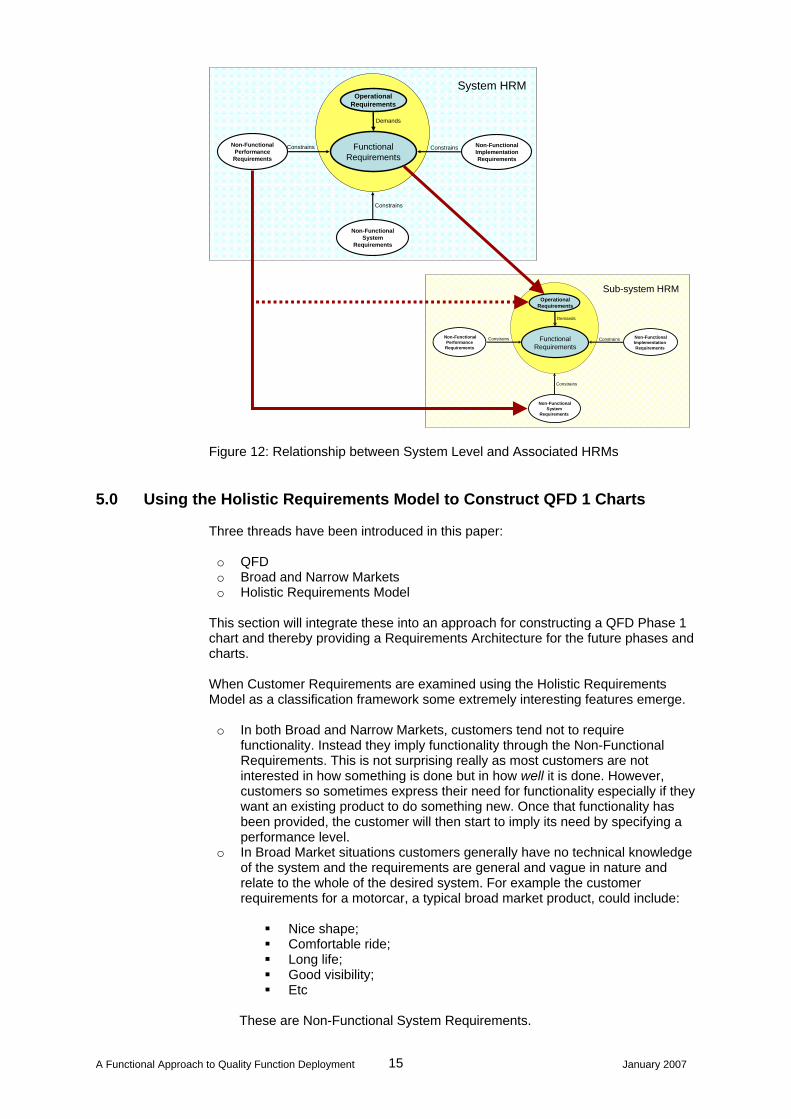
Figure 11: Partial HRM for the Drain Water Sub-System (Function) Figure 11 shows how the washing machine Functional Requirement to ‘Drain Water’ becomes part of the Operational Requirement of the HRM for the ‘Drain Water’ sub-system. Furthermore, Figure 11 shows how the Non-Functional Performance Requirement of draining in < 2 minutes is a Non-Functional System Requirement for the ‘Drain Water’ sub-system. This performance is also included in the Operational Requirement of the ‘Drain Water’ sub-system. Figure 12 summarises these relationships between system levels and the Holistic Requirements Model.
A Functional Approach to Quality Function Deployment January 2007 14
Non-Functional Performance
Requirements
Functional Requirements
Non-Functional Implementation Requirements
OperationalRequirements
Non-Functional System
Requirements
Constrains Constrains
Constrains
Demands
Non-Functional Performance Requirements
Functional Requirements
Non-Functional Implementation Requirements
OperationalRequirements
Non-Functional System
Requirements
Constrains Constrains
Constrains
Demands
System HRM
Sub-system HRM
Figure 12: Relationship between System Level and Associated HRMs
5.0 Using the Holistic Requirements Model to Construct QFD 1 Charts Three threads have been introduced in this paper:
o QFD o Broad and Narrow Markets o Holistic Requirements Model
This section will integrate these into an approach for constructing a QFD Phase 1 chart and thereby providing a Requirements Architecture for the future phases and charts. When Customer Requirements are examined using the Holistic Requirements Model as a classification framework some extremely interesting features emerge.
o In both Broad and Narrow Markets, customers tend not to require functionality. Instead they imply functionality through the Non-Functional Requirements. This is not surprising really as most customers are not interested in how something is done but in how well it is done. However, customers so sometimes express their need for functionality especially if they want an existing product to do something new. Once that functionality has been provided, the customer will then start to imply its need by specifying a performance level.
o In Broad Market situations customers generally have no technical knowledge of the system and the requirements are general and vague in nature and relate to the whole of the desired system. For example the customer requirements for a motorcar, a typical broad market product, could include:
Nice shape; Comfortable ride; Long life; Good visibility; Etc
These are Non-Functional System Requirements.
A Functional Approach to Quality Function Deployment January 2007 15
o Narrow Market customers are significantly more adverse to risk due to the long time scales, high cost and system complexity. To mitigate these risks, Narrow Market customers employ experts to help express their requirements in a measurable, precise way. For example, the Customer Requirements for a commercial aircraft, a narrow market product, could include:
GPS based navigation system; Airworthy to FAA and BAA requirements; Specific fuel consumption < XXX Etc
These requirements are Non-Functional Implementation, Non-Functional Performance Requirements and Non-Functional System Requirements.
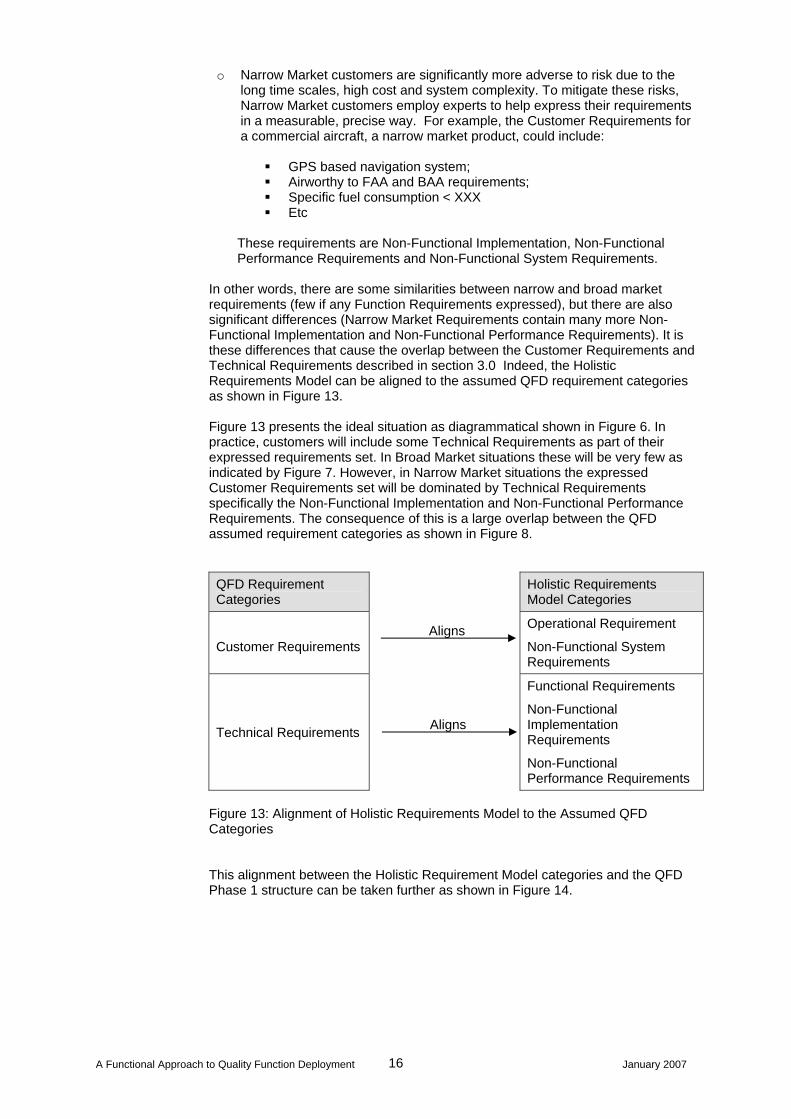
In other words, there are some similarities between narrow and broad market requirements (few if any Function Requirements expressed), but there are also significant differences (Narrow Market Requirements contain many more Non-Functional Implementation and Non-Functional Performance Requirements). It is these differences that cause the overlap between the Customer Requirements and Technical Requirements described in section 3.0 Indeed, the Holistic Requirements Model can be aligned to the assumed QFD requirement categories as shown in Figure 13. Figure 13 presents the ideal situation as diagrammatical shown in Figure 6. In practice, customers will include some Technical Requirements as part of their expressed requirements set. In Broad Market situations these will be very few as indicated by Figure 7. However, in Narrow Market situations the expressed Customer Requirements set will be dominated by Technical Requirements specifically the Non-Functional Implementation and Non-Functional Performance Requirements. The consequence of this is a large overlap between the QFD assumed requirement categories as shown in Figure 8.
QFD Requirement Categories
Holistic Requirements Model Categories
Customer Requirements
Operational Requirement
Non-Functional System Requirements
Technical Requirements
Functional Requirements
Non-Functional Implementation Requirements
Non-Functional Performance Requirements
Aligns
Aligns
Figure 13: Alignment of Holistic Requirements Model to the Assumed QFD Categories This alignment between the Holistic Requirement Model categories and the QFD Phase 1 structure can be taken further as shown in Figure 14.
A Functional Approach to Quality Function Deployment January 2007 16
HOW MUCHTarget values
WH
AT
Req
uire
men
ts
RELAT
IONSH
IPS
HOWRequirements
Functional RequirementsNon-Functional Implementation Requirements
Non-Functional Performance Requirements
OperationalRequirementsNon-Functional System Requirements
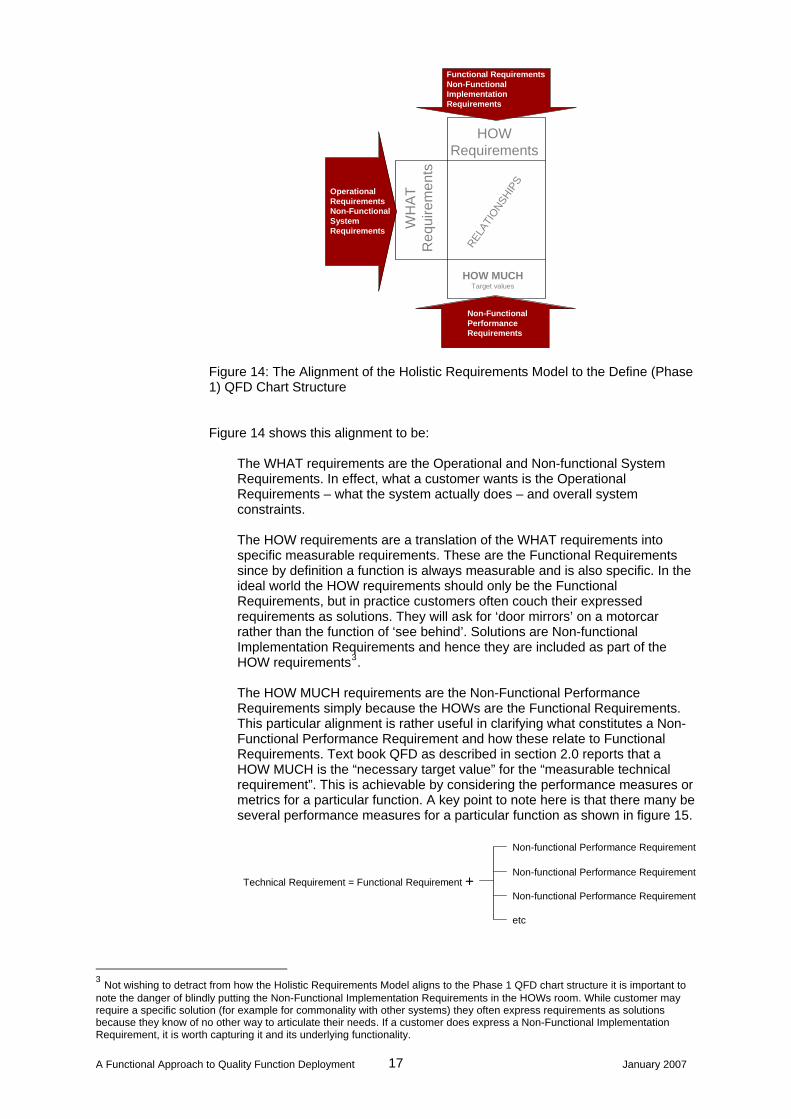
Figure 14: The Alignment of the Holistic Requirements Model to the Define (Phase 1) QFD Chart Structure Figure 14 shows this alignment to be:
The WHAT requirements are the Operational and Non-functional System Requirements. In effect, what a customer wants is the Operational Requirements – what the system actually does – and overall system constraints. The HOW requirements are a translation of the WHAT requirements into specific measurable requirements. These are the Functional Requirements since by definition a function is always measurable and is also specific. In the ideal world the HOW requirements should only be the Functional Requirements, but in practice customers often couch their expressed requirements as solutions. They will ask for ‘door mirrors’ on a motorcar rather than the function of ‘see behind’. Solutions are Non-functional Implementation Requirements and hence they are included as part of the HOW requirements3. The HOW MUCH requirements are the Non-Functional Performance Requirements simply because the HOWs are the Functional Requirements. This particular alignment is rather useful in clarifying what constitutes a Non-Functional Performance Requirement and how these relate to Functional Requirements. Text book QFD as described in section 2.0 reports that a HOW MUCH is the “necessary target value” for the “measurable technical requirement”. This is achievable by considering the performance measures or metrics for a particular function. A key point to note here is that there many be several performance measures for a particular function as shown in figure 15.
Technical Requirement = Functional Requirement
Non-functional Performance Requirement
+Non-functional Performance Requirement
Non-functional Performance Requirement
etc
3 Not wishing to detract from how the Holistic Requirements Model aligns to the Phase 1 QFD chart structure it is important to note the danger of blindly putting the Non-Functional Implementation Requirements in the HOWs room. While customer may require a specific solution (for example for commonality with other systems) they often express requirements as solutions because they know of no other way to articulate their needs. If a customer does express a Non-Functional Implementation Requirement, it is worth capturing it and its underlying functionality.
A Functional Approach to Quality Function Deployment January 2007 17
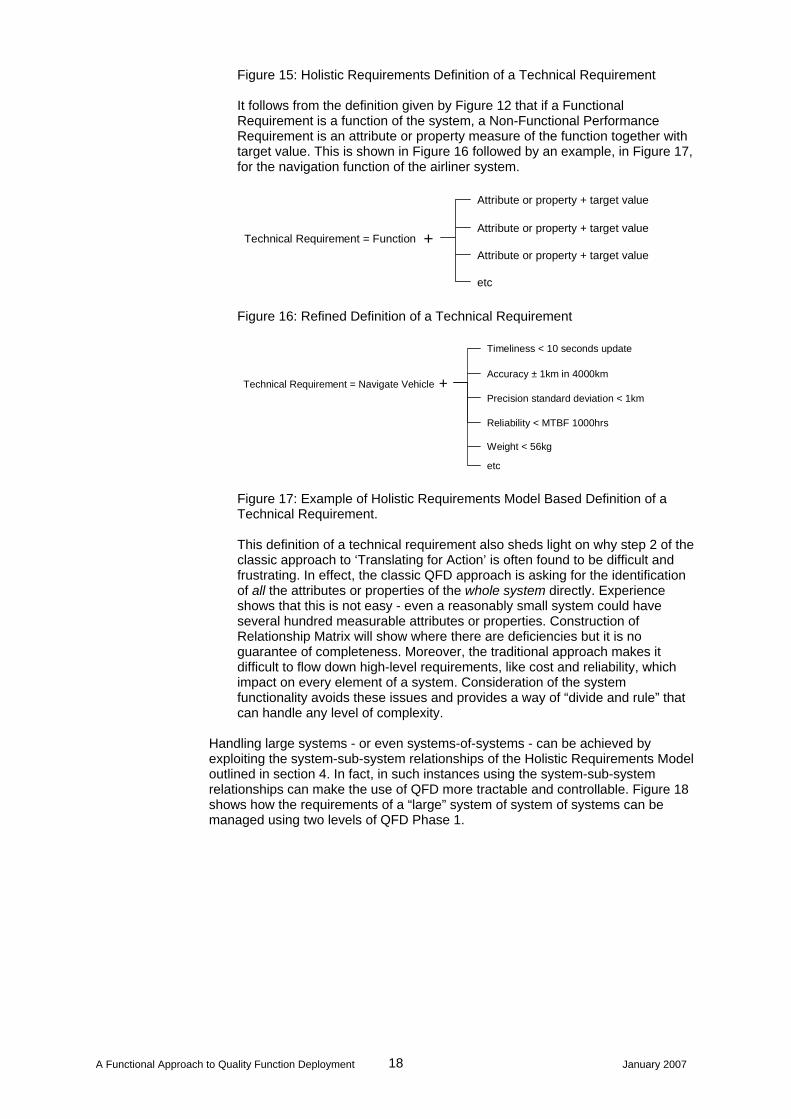
Figure 15: Holistic Requirements Definition of a Technical Requirement It follows from the definition given by Figure 12 that if a Functional Requirement is a function of the system, a Non-Functional Performance Requirement is an attribute or property measure of the function together with target value. This is shown in Figure 16 followed by an example, in Figure 17, for the navigation function of the airliner system.
Technical Requirement = Function
Attribute or property + target value
+Attribute or property + target value
Attribute or property + target value
etc Figure 16: Refined Definition of a Technical Requirement
Technical Requirement = Navigate Vehicle
Timeliness < 10 seconds update
+Accuracy ± 1km in 4000km
Precision standard deviation < 1km
Reliability < MTBF 1000hrs
Weight < 56kg
etc Figure 17: Example of Holistic Requirements Model Based Definition of a Technical Requirement. This definition of a technical requirement also sheds light on why step 2 of the classic approach to ‘Translating for Action’ is often found to be difficult and frustrating. In effect, the classic QFD approach is asking for the identification of all the attributes or properties of the whole system directly. Experience shows that this is not easy - even a reasonably small system could have several hundred measurable attributes or properties. Construction of Relationship Matrix will show where there are deficiencies but it is no guarantee of completeness. Moreover, the traditional approach makes it difficult to flow down high-level requirements, like cost and reliability, which impact on every element of a system. Consideration of the system functionality avoids these issues and provides a way of “divide and rule” that can handle any level of complexity.
Handling large systems - or even systems-of-systems - can be achieved by exploiting the system-sub-system relationships of the Holistic Requirements Model outlined in section 4. In fact, in such instances using the system-sub-system relationships can make the use of QFD more tractable and controllable. Figure 18 shows how the requirements of a “large” system of system of systems can be managed using two levels of QFD Phase 1.
A Functional Approach to Quality Function Deployment January 2007 18
A Functional Approach to Quality Function Deployment January 2007 19
FRSys
NFPSys
Sys C
ORSys&
NFSSys
FRSys
ORSys&
NFSSys
NFPSys
Sys B
FRSofS
ORSofS&
NFSSofS
NFPSofS
Sys A Sys B Sys C
FRSys
ORSys&
NFSSys
NFPSys
Sys A
Need to identify the Operational Requirement for System A based on the functionality and constraints
System-of-System Non-Functional Performance Requirements are equivalent to Non-Functional System Requirements at the system level
System-of-System Functions can each be decomposed into many functions at the system level
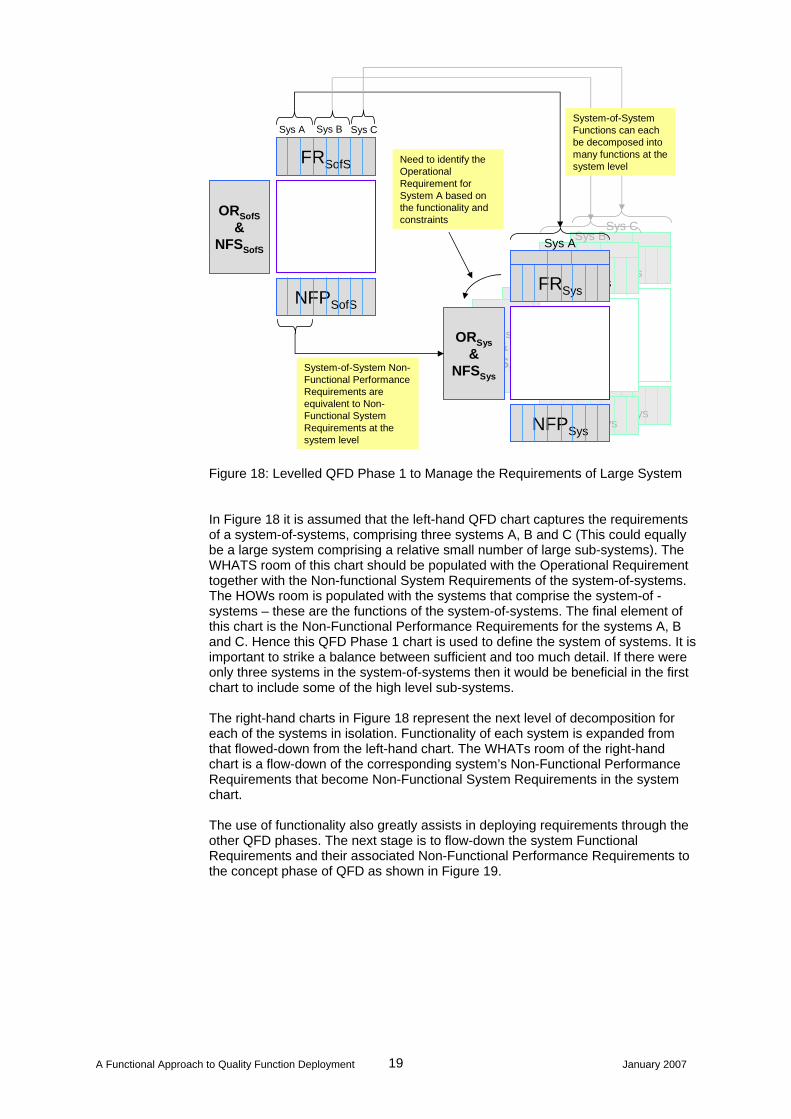
Figure 18: Levelled QFD Phase 1 to Manage the Requirements of Large System In Figure 18 it is assumed that the left-hand QFD chart captures the requirements of a system-of-systems, comprising three systems A, B and C (This could equally be a large system comprising a relative small number of large sub-systems). The WHATS room of this chart should be populated with the Operational Requirement together with the Non-functional System Requirements of the system-of-systems. The HOWs room is populated with the systems that comprise the system-of -systems – these are the functions of the system-of-systems. The final element of this chart is the Non-Functional Performance Requirements for the systems A, B and C. Hence this QFD Phase 1 chart is used to define the system of systems. It is important to strike a balance between sufficient and too much detail. If there were only three systems in the system-of-systems then it would be beneficial in the first chart to include some of the high level sub-systems. The right-hand charts in Figure 18 represent the next level of decomposition for each of the systems in isolation. Functionality of each system is expanded from that flowed-down from the left-hand chart. The WHATs room of the right-hand chart is a flow-down of the corresponding system’s Non-Functional Performance Requirements that become Non-Functional System Requirements in the system chart. The use of functionality also greatly assists in deploying requirements through the other QFD phases. The next stage is to flow-down the system Functional Requirements and their associated Non-Functional Performance Requirements to the concept phase of QFD as shown in Figure 19.
NFPSS ACNFPSS ACNFPSS ABNFPSS AB
ORSys&
NFSSys
FRSys
NFPSys
Sys C
ORSys&
NFSSys
FRSys
ORSys&
NFSSys
NFPSys
Sys B
FRSofS
ORSofS&
NFSSofS
NFPSofS
Sys A Sys B Sys C
FRSys A
ORSys&
NFSSys
NFPSys A
Sys A
Need to identify the Operational Requirement for System A based on the functionality and constraints
System-of-System Non-Functional Performance Requirements are equivalent to Non-Functional System Requirements at the system level
System of System Functions can each be decomposed into many functions at the system level
Sub-System Solutions (NFISS)
FRsys
NFPSS
NFPsysFRSys
NFPSys
FRSys
ORSys&
NFSSys
NFPSys
SS AA SS AB SS AC
Parts
NFISS AA
Part Characteristics
& targets
NFPparts
Sub Sys AA
NFPSS AA
ORSys&
NFSSys
Sub-System Solutions (NFISS)
FRSys A
NFPSS
NFSSys AFRSys
NFPParts
FRSys
ORSys&
NFSSys
NFPParts
SS AA SS AB SS AC
Parts NFIparts
NFISS AA
Part Characteristics
& targets
NFPparts
Sub Sys AA
NFSSS AA
Sub-System solutions can be isolated and treated independently by flowing down to a lower level chart
QFD 1
QFD 2
System Non-Functional Performance Requirements are equivalent to Non-Functional System Requirements at the sub-system level
NFPSys
Parts
Part Characteristics
& targets
NFPparts
Sub Sys AA
NFPSS AA
FRSys
ORSys&
NFSSys
NFPProcess
Process StepsFRprocess
Part A Characteristics
NFIpart A
Process Characteristics
& targets
NFPprocess
Processes
Part A Characteristic
targetsNFPpart A
Process A Process B
Part A Part B
Sub-System parts can be isolated and treated independently by flowing down to a lower level chart
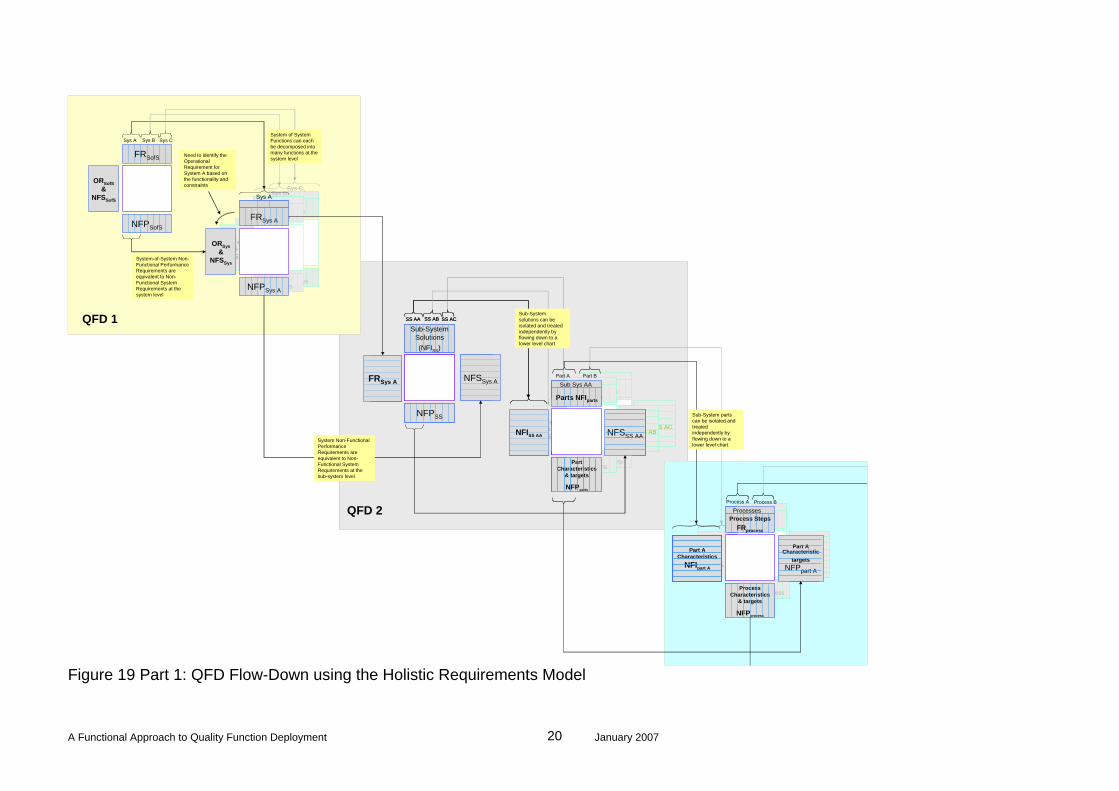
Figure 19 Part 1: QFD Flow-Down using the Holistic Requirements Model
A Functional Approach to Quality Function Deployment January 2007 20
Quality Function Deployment January 2007 21
NFPSys
Parts
Part Characteristics
& targets
NFPparts
Sub Sys AA
NFPSS AA
FRSys
ORSys&
NFSSys
NFPProcess
Process StepsFRprocess
Part A Characteristics
NFIpart A
Process Characteristics
& targets
NFPprocess
Processes
Part A Characteristic
targetsNFPpart A
Process A Process B
NFPSysPart
Characteristics & targets
NFPparts
NFPSS AA
FRSys
ORSys&
NFSSys
NFPProcess
Process A Parameters NFIprocess A
Process A Steps FRprocess A
Process A Parameter
targets
NFPprarmeters
Process A Characteristics
& targetsNFSprocess A
QFD 3
Sub-Processes can be isolated and treated independently by flowing down to a lower level chart
Process Non-Functional Performance Requirements are equivalent to Non-F20%unctional System Requirements at the sub-process level
Part Characteristics
& targets
NFPparts
NFPSS AA
Control Method NFIcontrol
Process A Parameters
NFIprocess A
Control Method Performance
NFPcontrol
Process A Parameter
targetsNFPparameters
QFD 4 Figure 19 Part 2: QFD Flow-Down using the Holistic Requirements Model
A Functional Approach to
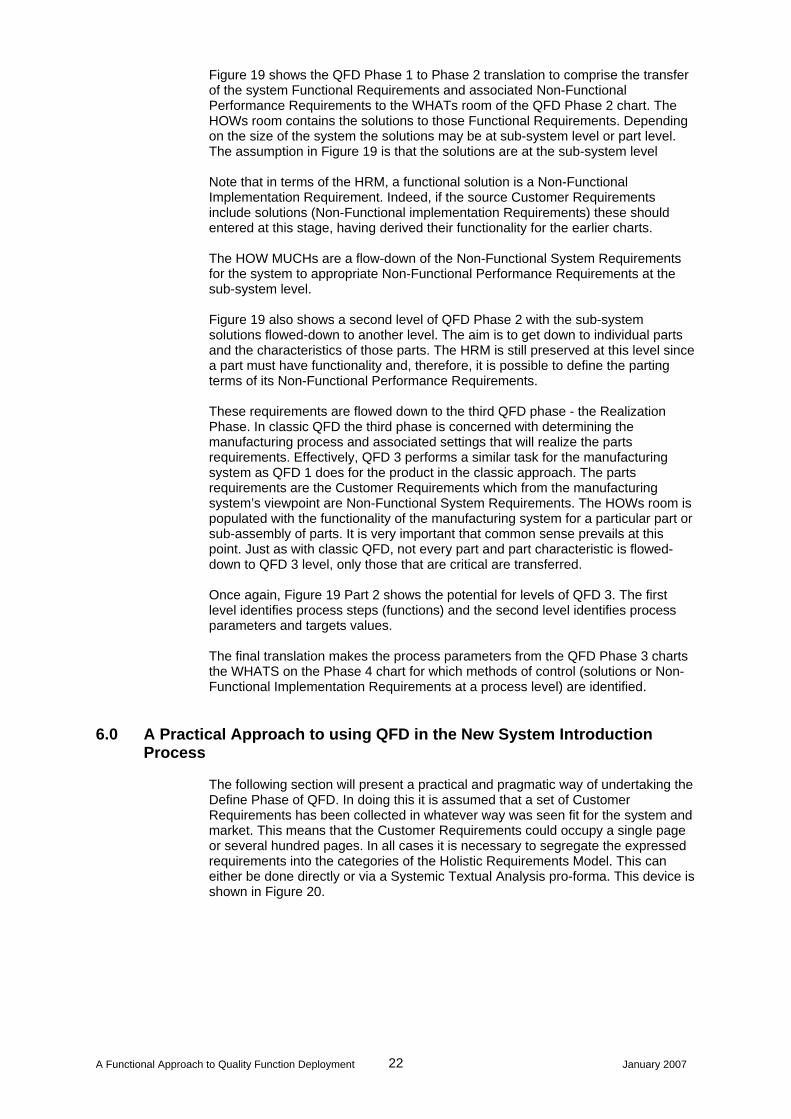
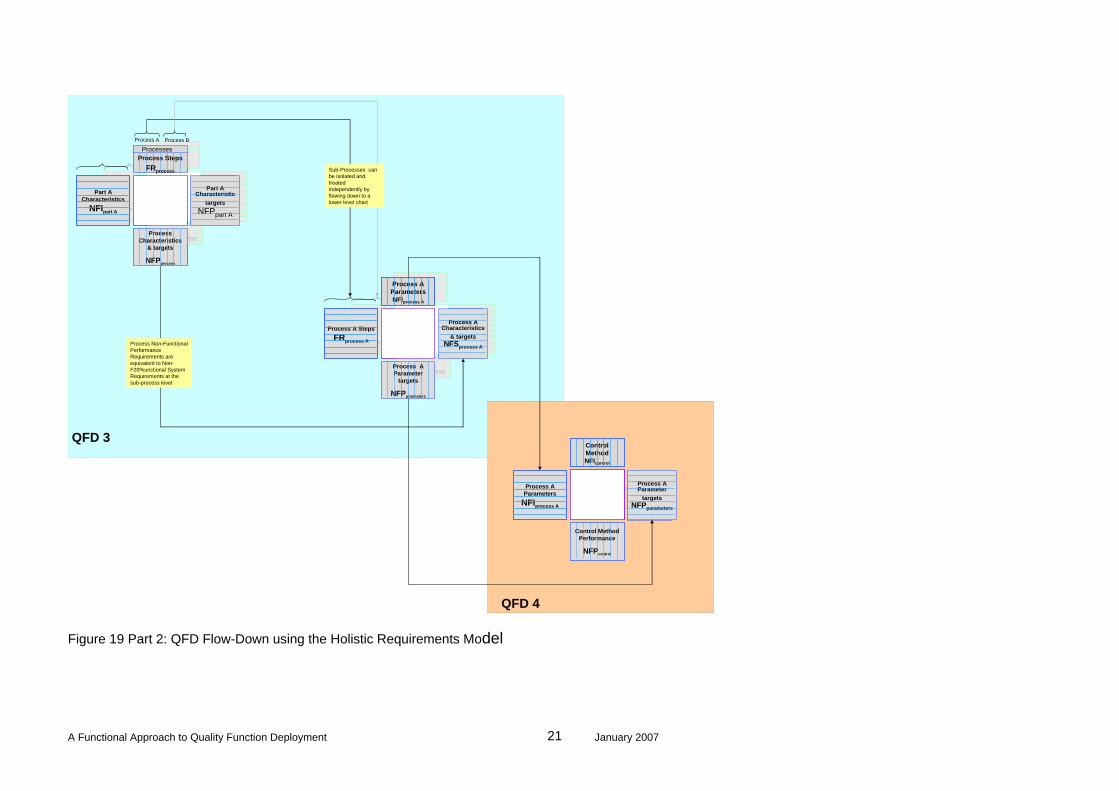
Figure 19 shows the QFD Phase 1 to Phase 2 translation to comprise the transfer of the system Functional Requirements and associated Non-Functional Performance Requirements to the WHATs room of the QFD Phase 2 chart. The HOWs room contains the solutions to those Functional Requirements. Depending on the size of the system the solutions may be at sub-system level or part level. The assumption in Figure 19 is that the solutions are at the sub-system level Note that in terms of the HRM, a functional solution is a Non-Functional Implementation Requirement. Indeed, if the source Customer Requirements include solutions (Non-Functional implementation Requirements) these should entered at this stage, having derived their functionality for the earlier charts. The HOW MUCHs are a flow-down of the Non-Functional System Requirements for the system to appropriate Non-Functional Performance Requirements at the sub-system level. Figure 19 also shows a second level of QFD Phase 2 with the sub-system solutions flowed-down to another level. The aim is to get down to individual parts and the characteristics of those parts. The HRM is still preserved at this level since a part must have functionality and, therefore, it is possible to define the parting terms of its Non-Functional Performance Requirements. These requirements are flowed down to the third QFD phase - the Realization Phase. In classic QFD the third phase is concerned with determining the manufacturing process and associated settings that will realize the parts requirements. Effectively, QFD 3 performs a similar task for the manufacturing system as QFD 1 does for the product in the classic approach. The parts requirements are the Customer Requirements which from the manufacturing system’s viewpoint are Non-Functional System Requirements. The HOWs room is populated with the functionality of the manufacturing system for a particular part or sub-assembly of parts. It is very important that common sense prevails at this point. Just as with classic QFD, not every part and part characteristic is flowed-down to QFD 3 level, only those that are critical are transferred. Once again, Figure 19 Part 2 shows the potential for levels of QFD 3. The first level identifies process steps (functions) and the second level identifies process parameters and targets values. The final translation makes the process parameters from the QFD Phase 3 charts the WHATS on the Phase 4 chart for which methods of control (solutions or Non-Functional Implementation Requirements at a process level) are identified.
6.0 A Practical Approach to using QFD in the New System Introduction Process
The following section will present a practical and pragmatic way of undertaking the Define Phase of QFD. In doing this it is assumed that a set of Customer Requirements has been collected in whatever way was seen fit for the system and market. This means that the Customer Requirements could occupy a single page or several hundred pages. In all cases it is necessary to segregate the expressed requirements into the categories of the Holistic Requirements Model. This can either be done directly or via a Systemic Textual Analysis pro-forma. This device is shown in Figure 20.
A Functional Approach to Quality Function Deployment January 2007 22
Systemic Textual Analysis
Project: Date:
Author: Issue:
Requirements Comments
Context:
Operational Requirement:
Non functional System Requirements:
Non-Functional Implementation Requirement
Functional Requirement
Non Functional Performance Requirement
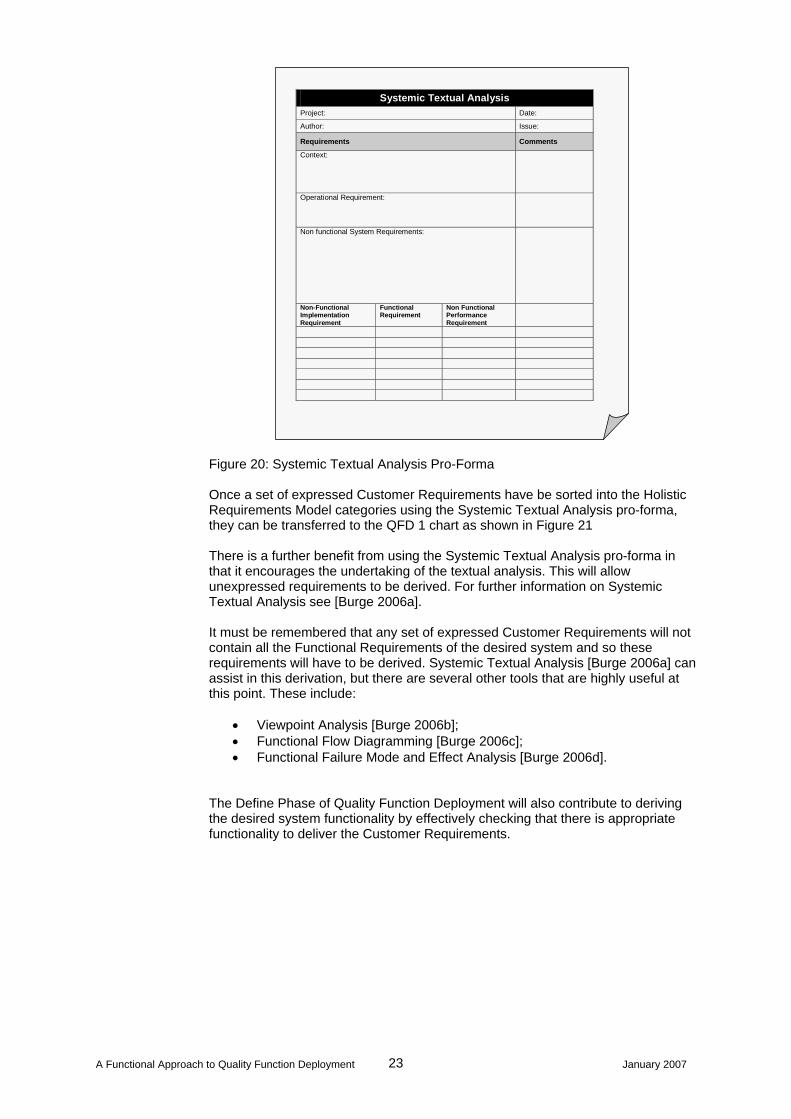
Figure 20: Systemic Textual Analysis Pro-Forma Once a set of expressed Customer Requirements have be sorted into the Holistic Requirements Model categories using the Systemic Textual Analysis pro-forma, they can be transferred to the QFD 1 chart as shown in Figure 21 There is a further benefit from using the Systemic Textual Analysis pro-forma in that it encourages the undertaking of the textual analysis. This will allow unexpressed requirements to be derived. For further information on Systemic Textual Analysis see [Burge 2006a]. It must be remembered that any set of expressed Customer Requirements will not contain all the Functional Requirements of the desired system and so these requirements will have to be derived. Systemic Textual Analysis [Burge 2006a] can assist in this derivation, but there are several other tools that are highly useful at this point. These include:
• Viewpoint Analysis [Burge 2006b]; • Functional Flow Diagramming [Burge 2006c]; • Functional Failure Mode and Effect Analysis [Burge 2006d].
The Define Phase of Quality Function Deployment will also contribute to deriving the desired system functionality by effectively checking that there is appropriate functionality to deliver the Customer Requirements.
A Functional Approach to Quality Function Deployment January 2007 23
Systemic Textual Analysis
Project: Date:
Author: Issue:
Requirements Comments
Context:
Operational Requirement:
Non functional System Requirements:
Non-Functional Implementation Requirement
Functional Requirement
Non Functional Performance Requirement
HOW MUCHTarget values
WH
ATR
equi
rem
ents
HOWRequirements
RELAT
IONSH
IPS
Figure 21: How the Systemic Textual Analysis Provides the Requirements for Phase 1 QFD. There will also be gaps in the HOW MUCHs since it is highly unlikely that the customer will provide every Non-Functional Performance Requirement. Indeed, many of the Non-Functional Performance Requirements are the responsibility of the system designer to specify based upon the expectations of the customer’s expressed Non-Functional System Requirements. The generation of these can be approached in a systematic way, function by function. For each Functional Requirement, it will be necessary to identify the attributes of properties that contribute to the performance/measurement of the function. This can be approached in two ways. Firstly, the function can be isolated and a team of experts used to brainstorm the attributes or properties. The second approach involves examining which Customer Requirements (WHAT requirements) are related to a particular Functional Requirement and devising attributes or properties at the functional level that relate to the Customer Requirement. This illustrated in Figure 22, which shows a partial QFD 1 chart.
Cus
tom
er Im
port
a
Wash Sensing
Det
ect L
oad
Mak
e U
p
Mea
sure
H20
H
ardn
ess
Load Machine
Load
Dirt
y Ite
ms
Unl
oad
Load
Cle
anin
g Ag
ents
Manage Water
Fill
Wat
er
Dra
in W
ater
Rem
ove
XS W
ater
Clean
Was
h
Cus
tom
er R
equi
rem
ents
Inte
llige
nt W
ashi
ng M
achi
ne
Eas
e of
Use
Dry Performance
Wash Performance
Automation & IntelligenceEasy to use ControlsAccess Ergonomics
Cos
t Purchase
Running
Lon
g Li
fe
Reliable
Easy to Maintain
Styl
e
Attractive
How Much
F G H F
F H G H G H H F
F H H G
G
F F F
F G G G G G G G H
G H G G
H G G G F H
G G G
1.0
1.0
5.0
5.0
3.0
1.0
2.0
1.0
1.0
5.0
< 2m
ins
D
TUPC
<£8
FY
FR <
2%
Intelligent Washing Machine
Functional Requirements
System Functions
The “Drain Water” function
is related to several
“Customer Requirements”the HOW MUCH should reflect
these “Customer Requirements”
Drain Time <2minFYFR <2%DTUPC <£8.0
Figure 22: Partial QFD Phase 1 for an Intelligent Washing Machine Showing the use of the Relations to Derive Technical Requirements
A Functional Approach to Quality Function Deployment January 2007 24
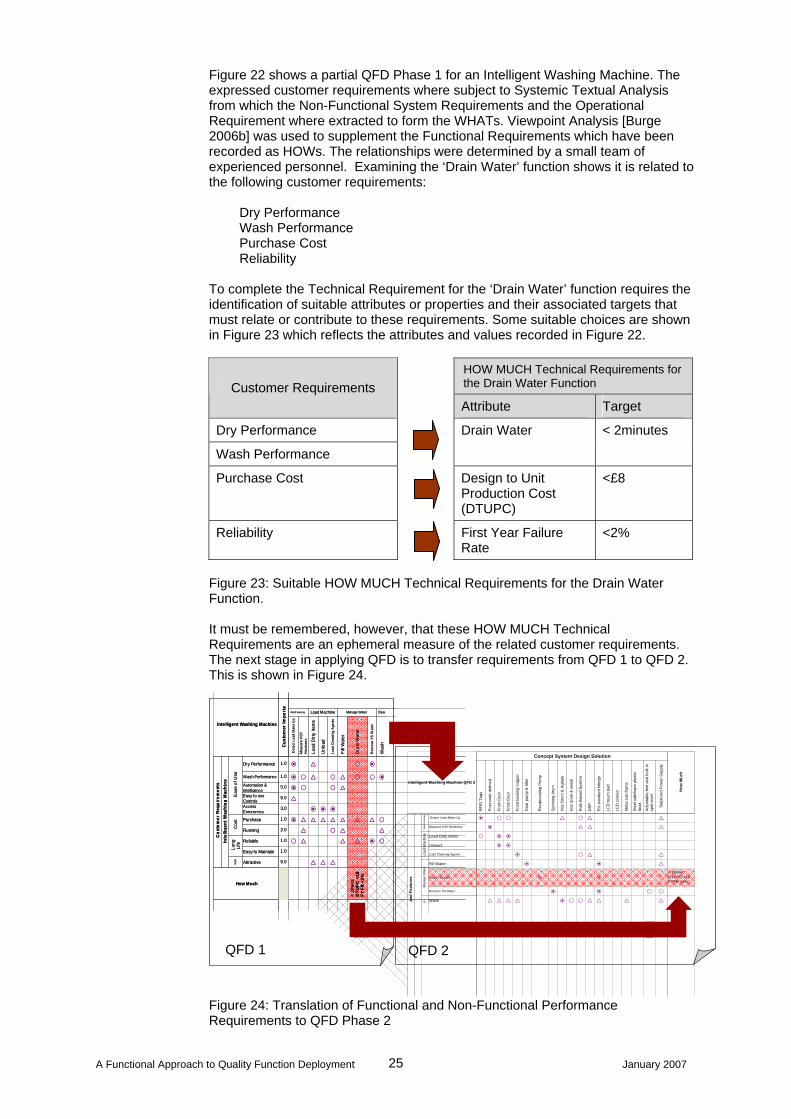
Figure 22 shows a partial QFD Phase 1 for an Intelligent Washing Machine. The expressed customer requirements where subject to Systemic Textual Analysis from which the Non-Functional System Requirements and the Operational Requirement where extracted to form the WHATs. Viewpoint Analysis [Burge 2006b] was used to supplement the Functional Requirements which have been recorded as HOWs. The relationships were determined by a small team of experienced personnel. Examining the ‘Drain Water’ function shows it is related to the following customer requirements: Dry Performance
Wash Performance Purchase Cost Reliability To complete the Technical Requirement for the ‘Drain Water’ function requires the identification of suitable attributes or properties and their associated targets that must relate or contribute to these requirements. Some suitable choices are shown in Figure 23 which reflects the attributes and values recorded in Figure 22.
HOW MUCH Technical Requirements for the Drain Water Function Customer Requirements
Attribute Target
Dry Performance
Wash Performance
Drain Water < 2minutes
Purchase Cost Design to Unit Production Cost (DTUPC)
<£8
Reliability First Year Failure Rate
<2%
Figure 23: Suitable HOW MUCH Technical Requirements for the Drain Water Function. It must be remembered, however, that these HOW MUCH Technical Requirements are an ephemeral measure of the related customer requirements. The next stage in applying QFD is to transfer requirements from QFD 1 to QFD 2. This is shown in Figure 24.
Concept System Design Solution
RFI
D T
ags
Pos
t cod
e de
fined
Fron
t Doo
r
Fron
t Doo
r
Fron
t loa
ding
hop
per
Gea
r pum
p &
filte
r
Rec
ipro
catin
g P
ump
Spi
nnin
g dr
um
Hoz
Dru
m &
Agi
tate
Hoz
dru
m &
sw
ish
Rul
e B
ased
Sys
tem
DS
P
EU
sta
ndar
d fit
tings
LCD
touc
h pa
d
LCD
scr
een
Met
al s
ub-fr
ame
Ste
el s
ide/
back
pla
stic
fa
cia
Adj
usta
ble
feet
and
bui
lt in
sp
rit le
vel
Sta
biliz
ed P
ower
Sup
ply
How
Muc
h
s an
d Fe
atur
es
Was
h Se
nsin
g
Detect Load Make Up
Measure H20 Hardness
Load
Mac
hine Load Dirty Items
Unload
Load Cleaning Agents
Man
age
Wat
er
Fill Water
Drain Water
Remove XS Water
an Wash
F H H G H G G
F G G G
H F F
F F
F H G G
F F G
F F G
F F H H
G G G G F H H G G G G
< 2mins DTUPC <£8 FYFR <2%
Intelligent Washing Machine QFD 2
Cus
tom
er Im
port
a
Wash Sensing
Det
ect L
oad
Mak
e U
p
Mea
sure
H20
H
ardn
ess
Load Machine
Load
Dirt
y Ite
ms
Unl
oad
Load
Cle
anin
g Ag
ents
Manage Water
Fill
Wat
er
Dra
in W
ater
Rem
ove
XS W
ater
Clean
Was
h
Cus
tom
er R
equi
rem
ents
Inte
llige
nt W
ashi
ng M
achi
ne
Eas
e of
Use
Dry Performance
Wash Performance
Automation & IntelligenceEasy to use ControlsAccess Ergonomics
Cos
t Purchase
Running
Lon
g Li
fe
Reliable
Easy to Maintain
Styl
e
Attractive
How Much
F G H F
F H G H G H H F
F H H G
G
F F F
F G G G G G G G H
G H G G
H G G G F H
G G G
1.0
1.0
5.0
5.0
3.0
1.0
2.0
1.0
1.0
5.0
< 2m
ins
D
TUPC
<£8
FY
FR <
2%
Intelligent Washing Machine
Cus
tom
er Im
port
a
Wash Sensing
Det
ect L
oad
Mak
e U
p
Mea
sure
H20
H
ardn
ess
Load Machine
Load
Dirt
y Ite
ms
Unl
oad
Load
Cle
anin
g Ag
ents
Manage Water
Fill
Wat
er
Dra
in W
ater
Rem
ove
XS W
ater
Clean
Was
h
Cus
tom
er R
equi
rem
ents
Inte
llige
nt W
ashi
ng M
achi
ne
Eas
e of
Use
Dry Performance
Wash Performance
Automation & IntelligenceEasy to use ControlsAccess Ergonomics
Cos
t Purchase
Running
Lon
g Li
fe
Reliable
Easy to Maintain
Styl
e
Attractive
How Much
F G H F
F H G H G H H F
F H H G
G
F F F
F G G G G G G G H
G H G G
H G G G F H
G G G
1.0
1.0
5.0
5.0
3.0
1.0
2.0
1.0
1.0
5.0
< 2m
ins
D
TUPC
<£8
FY
FR <
2%
Intelligent Washing Machine
QFD 1 QFD 2
Figure 24: Translation of Functional and Non-Functional Performance Requirements to QFD Phase 2
A Functional Approach to Quality Function Deployment January 2007 25
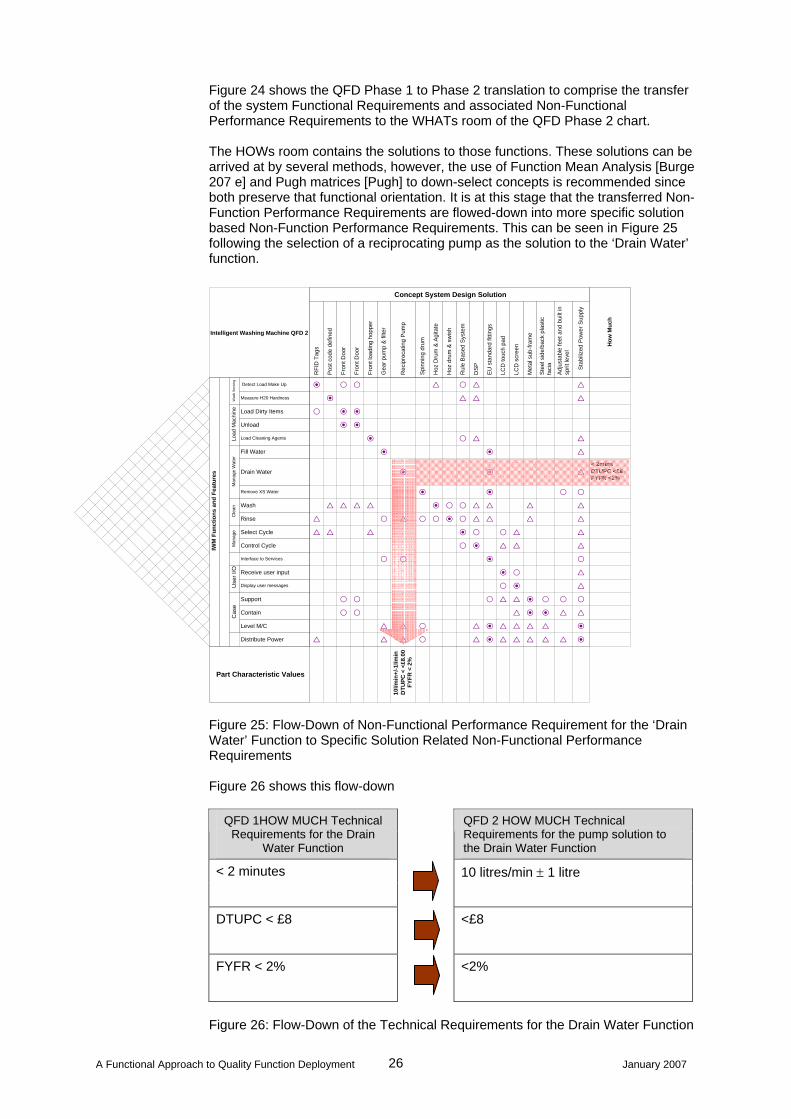
Figure 24 shows the QFD Phase 1 to Phase 2 translation to comprise the transfer of the system Functional Requirements and associated Non-Functional Performance Requirements to the WHATs room of the QFD Phase 2 chart. The HOWs room contains the solutions to those functions. These solutions can be arrived at by several methods, however, the use of Function Mean Analysis [Burge 207 e] and Pugh matrices [Pugh] to down-select concepts is recommended since both preserve that functional orientation. It is at this stage that the transferred Non-Function Performance Requirements are flowed-down into more specific solution based Non-Function Performance Requirements. This can be seen in Figure 25 following the selection of a reciprocating pump as the solution to the ‘Drain Water’ function.
Concept System Design Solution
RFI
D T
ags
Pos
t cod
e de
fined
Fron
t Doo
r
Fron
t Doo
r
Fron
t loa
ding
hop
per
Gea
r pum
p &
filte
r
Rec
ipro
catin
g P
ump
Spi
nnin
g dr
um
Hoz
Dru
m &
Agi
tate
Hoz
dru
m &
sw
ish
Rul
e B
ased
Sys
tem
DS
P
EU
sta
ndar
d fit
tings
LCD
touc
h pa
d
LCD
scr
een
Met
al s
ub-fr
ame
Ste
el s
ide/
back
pla
stic
fa
cia
Adj
usta
ble
feet
and
bui
lt in
sp
rit le
vel
Sta
biliz
ed P
ower
Sup
ply
How
Muc
h
IWM
Fun
ctio
ns a
nd F
eatu
res
W
ash
Sen
sing Detect Load Make Up
Measure H20 Hardness
Load
Mac
hine Load Dirty Items
Unload
Load Cleaning Agents
Man
age
Wat
er
Fill Water
Drain Water
Remove XS Water
Cle
an Wash
Rinse
Man
age Select Cycle
Control Cycle
Interface to Services
Use
r I/O Receive user input
Display user messages
Cas
e
Support
Contain
Level M/C
Distribute Power
Part Characteristic Values
10l/m
in+/
-1l/m
in
DTU
PC <
<£8
.00
FY
FR <
2%
F H H G H G G
F G G G
H F F
F F
F H G G
F F G
F F G
F F H H
G G G G F H H G G G G
G H G H H F H G G G G
G G G F H H G G
H F G G G
H H F H
F H G
H F G
H H H G G F H H H
H H G F F G G
G G H G F G G G G F
G G G H G F G G G G G F
< 2mins DTUPC <£8 FYFR <2%
Intelligent Washing Machine QFD 2
Figure 25: Flow-Down of Non-Functional Performance Requirement for the ‘Drain Water’ Function to Specific Solution Related Non-Functional Performance Requirements Figure 26 shows this flow-down
QFD 1HOW MUCH Technical Requirements for the Drain
Water Function
QFD 2 HOW MUCH Technical Requirements for the pump solution to the Drain Water Function
< 2 minutes
10 litres/min ± 1 litre
DTUPC < £8
<£8
FYFR < 2%
<2%
Figure 26: Flow-Down of the Technical Requirements for the Drain Water Function
A Functional Approach to Quality Function Deployment January 2007 26
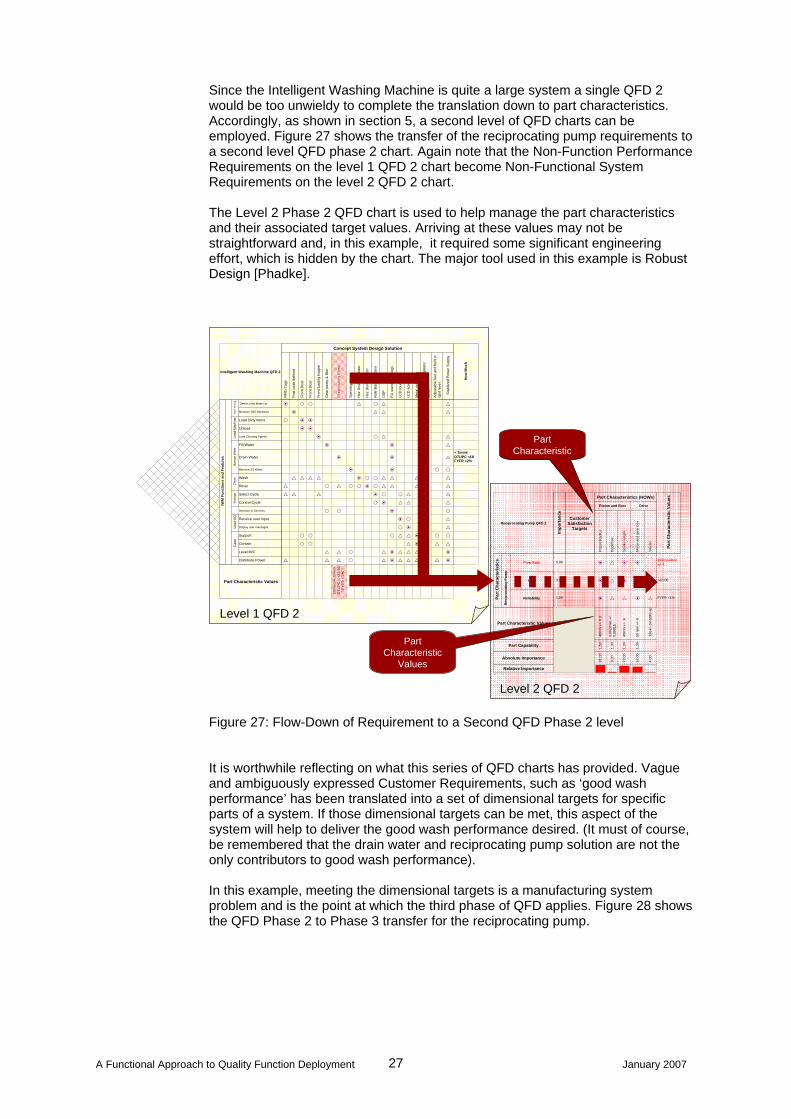
Since the Intelligent Washing Machine is quite a large system a single QFD 2 would be too unwieldy to complete the translation down to part characteristics. Accordingly, as shown in section 5, a second level of QFD charts can be employed. Figure 27 shows the transfer of the reciprocating pump requirements to a second level QFD phase 2 chart. Again note that the Non-Function Performance Requirements on the level 1 QFD 2 chart become Non-Functional System Requirements on the level 2 QFD 2 chart. The Level 2 Phase 2 QFD chart is used to help manage the part characteristics and their associated target values. Arriving at these values may not be straightforward and, in this example, it required some significant engineering effort, which is hidden by the chart. The major tool used in this example is Robust Design [Phadke].
Concept System Design Solution
RFI
D T
ags
Post
cod
e de
fined
Fron
t Doo
r
Fron
t Doo
r
Fron
t loa
ding
hop
per
Gea
r pum
p &
filte
r
Rec
ipro
catin
g Pu
mp
Spin
ning
dru
m
Hoz
Dru
m &
Agi
tate
Hoz
dru
m &
sw
ish
Rul
e Ba
sed
Syst
em
DSP
EU s
tand
ard
fittin
gs
LCD
touc
h pa
d
LCD
scr
een
Met
al s
ub-fr
ame
Stee
l sid
e/ba
ck p
last
ic
faci
a
Adju
stab
le fe
et a
nd b
uilt
in
sprit
leve
l
Stab
ilized
Pow
er S
uppl
y
How
Muc
h
IWM
Fun
ctio
ns a
nd F
eatu
res
W
ash
Sens
ing
Detect Load Make Up
Measure H20 Hardness
Load
Mac
hine Load Dirty Items
Unload
Load Cleaning Agents
Man
age
Wat
er
Fill Water
Drain Water
Remove XS Water
Cle
an Wash
Rinse
Man
age Select Cycle
Control Cycle
Interface to Services
Use
r I/O Receive user input
Display user messages
Cas
e
Support
Contain
Level M/C
Distribute Power
Part Characteristic Values
10l/m
in+/
-1l/m
in
DTU
PC <
<£8
.00
FY
FR <
2%
F H H G H G G
F G G G
H F F
F F
F H G G
F F G
F F G
F F H H
G G G G F H H G G G G
G H G H H F H G G G G
G G G F H H G G
H F G G G
H H F H
F H G
H F G
H H H G G F H H H
H H G F F G G
G G H G F G G G G F
G G G H G F G G G G G F
< 2mins DTUPC <£8 FYFR <2%
Intelligent Washing Machine QFD 2
Impo
rtan
ce
Customer Satisfaction
Targets
Part Characteristics (HOWs)
Piston and Bore
Pis
ton
Rad
ius
Bac
kflo
w
Stro
ke le
ngth
Drive
Mot
or a
nd g
ear b
ox
Sta
rter
Part
Cha
ract
eris
tic V
alue
s
Part
Cha
ract
eris
tics
Rec
ipro
catin
g Pu
mp
Flow Rate
Cost
Reliability
Part Characteristic Values
Part Capability
Absolute Importance
Relative Importance
5.00
3.00
1.0040
mm
+/-
0.3
0.00
2l/m
in +
/- 0.
0001
5
40m
m +
/- .6
50 rp
m +
/- 6
230+
/- 5V
50h
z ac
1.50
1.30
1.30
1.30
81.0
0
9.00
73.0
0
63.0
0
4.00
F G F F
F G F H G
F G G F G
10litres/min +/- 1
<£8.00
FYFR <1%
Reciprocating Pump QFD 2
Part Characteristic
Part Characteristic
Values
Level 1 QFD 2
Level 2 QFD 2 Figure 27: Flow-Down of Requirement to a Second QFD Phase 2 level It is worthwhile reflecting on what this series of QFD charts has provided. Vague and ambiguously expressed Customer Requirements, such as ‘good wash performance’ has been translated into a set of dimensional targets for specific parts of a system. If those dimensional targets can be met, this aspect of the system will help to deliver the good wash performance desired. (It must of course, be remembered that the drain water and reciprocating pump solution are not the only contributors to good wash performance). In this example, meeting the dimensional targets is a manufacturing system problem and is the point at which the third phase of QFD applies. Figure 28 shows the QFD Phase 2 to Phase 3 transfer for the reciprocating pump.
A Functional Approach to Quality Function Deployment January 2007 27
Impo
rtan
ce
Customer Satisfaction
Targets
Part Characteristics (HOWs)
Piston and Bore
Pis
ton
Rad
ius
Bac
kflo
w
Stro
ke le
ngth
Drive
Mot
or a
nd g
ear b
ox
Sta
rter
Part
Cha
ract
eris
tic V
alue
s
Part
Cha
ract
eris
tics
Rec
ipro
catin
g Pu
mp
Flow Rate
Cost
Reliability
Part Characteristic Values
Part Capability
Absolute Importance
Relative Importance
5.00
3.00
1.00
40m
m +
/- 0.
3
0.00
2l/m
in +
/- 0.
0001
5
40m
m +
/- .6
50 rp
m +
/- 6
230+
/- 5V
50h
z ac
1.50
1.30
1.30
1.30
81.0
0
9.00
73.0
0
63.0
0
4.00
F G F F
F G F H G
F G G F G
10litres/min +/- 1
<£8.00
FYFR <1%
Reciprocating Pump QFD 2
Level 2 QFD 2
Impo
rtan
ce
Process Parameters
Machining
Turn
Pis
tion
Bor
e C
ylin
der
Casting
Cra
nk C
astin
g
Coiling
No
roto
r tur
ns
Wire
dia
met
er
Part
Cha
ract
eris
tic V
alue
s
Part
Pi
ston
and
B
ore
Piston Radius
Backflow
Stroke length
Driv
e
Motor and gear box
Process Parameter Values
Process Capability
Absolute Importance
Relative Importance
4.00
1.00
3.00
5.00
Mea
n 40
mm
S
D 0
.1M
ean
40.2
SD
0.0
5M
ean
40m
m
SD
0.0
4
55
Mea
n 0.
5mm
S
D 0
.001
39.0
0
9.00
27.0
0
45.0
0
45.0
0
F
H F
F
F F
40mm +/- 0.3
0.002l/min +/-
40mm +/- .6
50 rpm +/- 6
Reciprocating Pump QFD 3
QFD 3
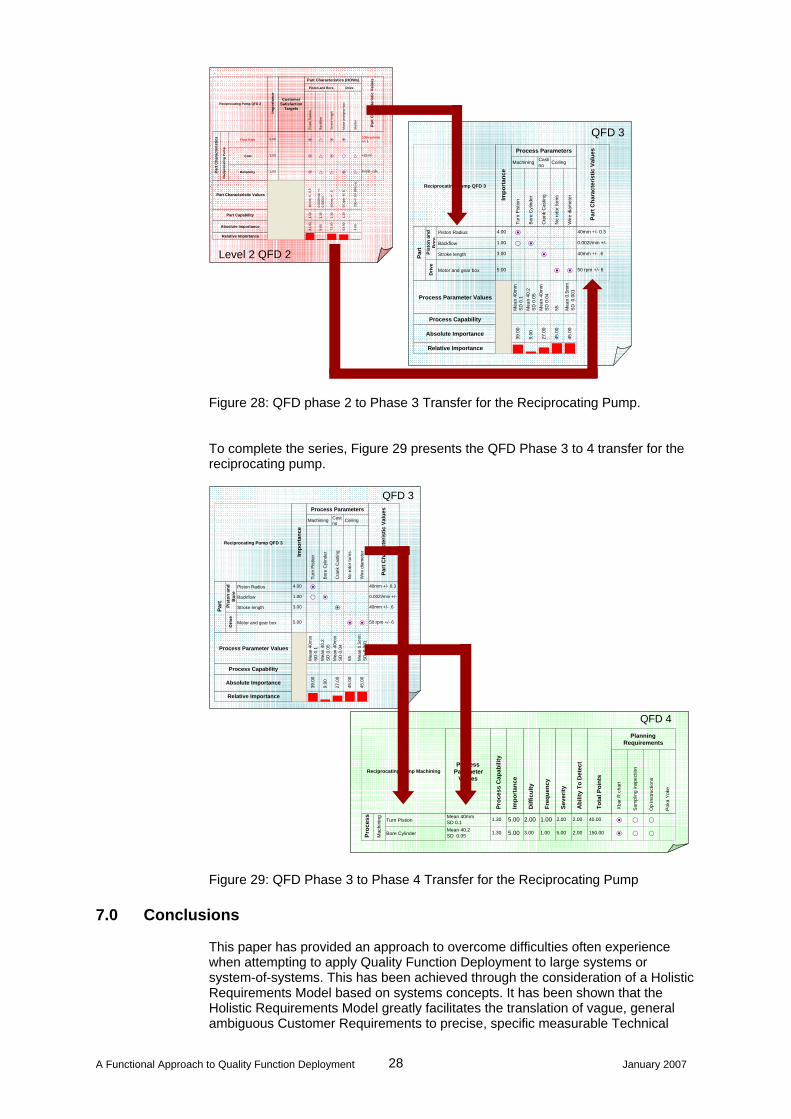
Figure 28: QFD phase 2 to Phase 3 Transfer for the Reciprocating Pump. To complete the series, Figure 29 presents the QFD Phase 3 to 4 transfer for the reciprocating pump.
Process Parameter
Values
Pro
cess
Cap
abili
ty
Impo
rtan
ce
Diff
icul
ty
Fre
quen
cy
Sev
erity
Abi
lity
To D
etec
t
Tot
al P
oint
s
Planning Requirements
Xba
r R c
hart
Sam
plin
g in
spec
tion
Op
Inst
ruct
ions
Pok
a Y
oke
Proc
ess
Mac
hini
ng Turn Pistion
Bore Cylinder
Mean 40mm SD 0.1Mean 40.2 SD 0.05
1.30
1.30
5.00
5.00
2.00
3.00
1.00
1.00
2.00
5.00
2.00
2.00
40.00
150.00
F H H
F H H
Reciprocating Pump Machining
Impo
rtan
ce
Process Parameters
Machining
Turn
Pis
tion
Bor
e C
ylin
der
Casting
Cra
nk C
astin
g
Coiling
No
roto
r tur
ns
Wire
dia
met
er
Part
Cha
ract
eris
tic V
alue
s
Part
Pi
ston
and
B
ore
Piston Radius
Backflow
Stroke length
Driv
e
Motor and gear box
Process Parameter Values
Process Capability
Absolute Importance
Relative Importance
4.00
1.00
3.00
5.00
Mea
n 40
mm
S
D 0
.1M
ean
40.2
SD
0.0
5M
ean
40m
m
SD
0.0
4
55
Mea
n 0.
5mm
S
D 0
.001
39.0
0
9.00
27.0
0
45.0
0
45.0
0
QFD 3
F
H F
F
F F
40mm +/- 0.3
0.002l/min +/-
40mm +/- .6
50 rpm +/- 6
Reciprocating Pump QFD 3
QFD 4
Figure 29: QFD Phase 3 to Phase 4 Transfer for the Reciprocating Pump 7.0 Conclusions
This paper has provided an approach to overcome difficulties often experience when attempting to apply Quality Function Deployment to large systems or system-of-systems. This has been achieved through the consideration of a Holistic Requirements Model based on systems concepts. It has been shown that the Holistic Requirements Model greatly facilitates the translation of vague, general ambiguous Customer Requirements to precise, specific measurable Technical
A Functional Approach to Quality Function Deployment January 2007 28
Requirements. Moreover, the Holistic Requirements Model has provides a valuable insight into how best to populate the first phase of QFD. Furthermore, it has been shown that this insight pervades the other deployment phases of QFD, thus providing a sound and logical Requirements Architecture for handling the complexity of large and small systems throughout new system introduction. This has been illustrated with a simple case study.
8.0 References Clausing, D.P. and Krinninger, A. “Quality Function Deployment for Production” Working paper published by the Laboratory for manufacturing and productivity of the Massachusetts Institute of Technology, Cambridge, Massachusetts, August 1991. Akao, Y. “Quality Function Deployment”, Productivity Press, Cambridge, Massachusetts, 1990. Mizuno, S. “Management for Quality Improvement – The Seven New QC Tools”, Productivity Press, Cambridge, Massachusetts, 1988. Curwen, P. “System Development Using the CORE Method’”,British Aerospace Report BAe/WIT/ML/GEN/SWE/1227, March 1990. Phadke M.S. “Quality Engineering Using Robust Design”, Prentice Hall, 1989 Checkland P. “Systems Thinking, Systems Practice” John Wiley, 1999 Pugh, S. “Total Design” Addison-Wesley, 1990 Burge, S. (a) “Systemic Textual Analysis”, 2007 Burge, S. (b) “Viewpoint Analysis”, www.burgehugheswalsh.co.uk, 2007 Burge, s. (c) “Functional Flow Diagramming”, www.burgehugheswalsh.co.uk, 2007 Burge, S. (d) “Functional Failure Mode and Effect Analysis”, www.burgehugheswalsh.co.uk, 2007 Burge, S (e) “Function Means Analysis”, www.burgehugheswalsh.co.uk, 2007
A Functional Approach to Quality Function Deployment January 2007 29
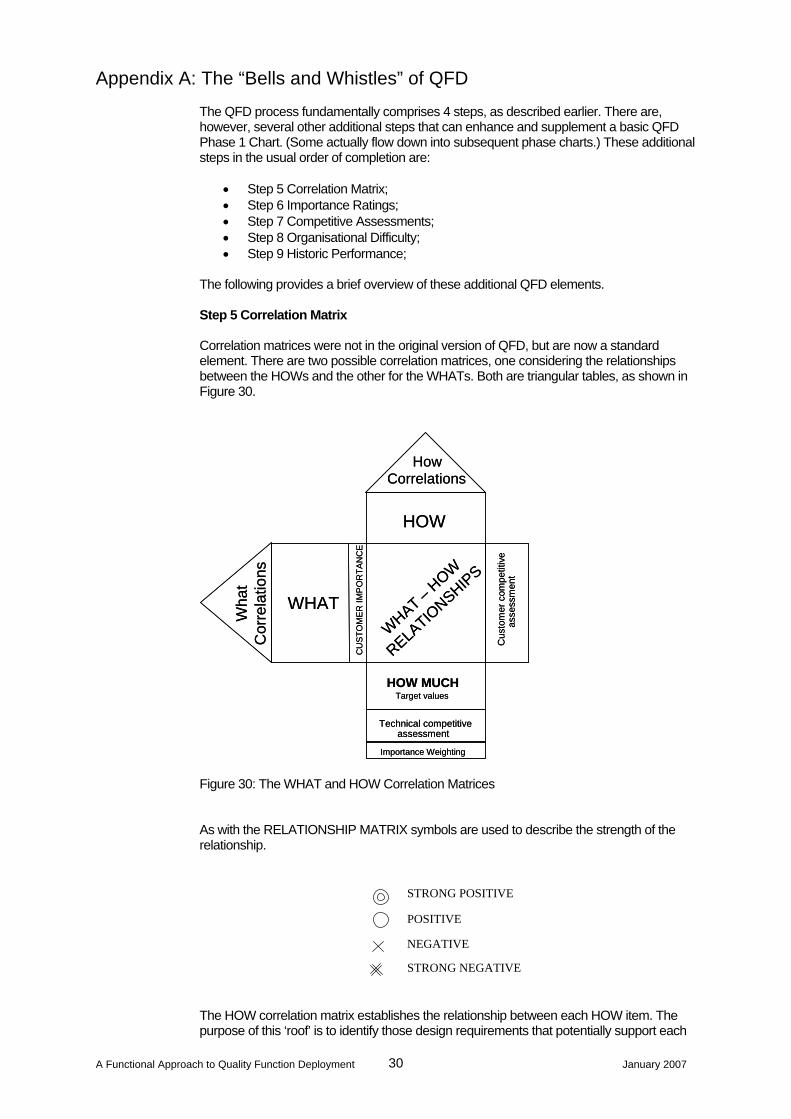
Appendix A: The “Bells and Whistles” of QFD
The QFD process fundamentally comprises 4 steps, as described earlier. There are, however, several other additional steps that can enhance and supplement a basic QFD Phase 1 Chart. (Some actually flow down into subsequent phase charts.) These additional steps in the usual order of completion are:
• Step 5 Correlation Matrix; • Step 6 Importance Ratings; • Step 7 Competitive Assessments; • Step 8 Organisational Difficulty; • Step 9 Historic Performance;
The following provides a brief overview of these additional QFD elements. Step 5 Correlation Matrix Correlation matrices were not in the original version of QFD, but are now a standard element. There are two possible correlation matrices, one considering the relationships between the HOWs and the other for the WHATs. Both are triangular tables, as shown in Figure 30.
Importance Weighting
HOW MUCHTarget values
Technical competitiveassessment
WHAT
HOW
CU
STO
ME
R IM
PO
RTA
NC
E
WHAT –HOW
RELATIO
NSHIPS
Cus
tom
er c
ompe
titiv
eas
sess
men
t
HowCorrelations
Wha
tC
orre
latio
ns
Importance Weighting
HOW MUCHTarget values
Technical competitiveassessment
WHAT
HOW
CU
STO
ME
R IM
PO
RTA
NC
E
WHAT –HOW
RELATIO
NSHIPS
Cus
tom
er c
ompe
titiv
eas
sess
men
t
HowCorrelations
Wha
tC
orre
latio
ns
Figure 30: The WHAT and HOW Correlation Matrices As with the RELATIONSHIP MATRIX symbols are used to describe the strength of the relationship.
POSITIVE
STRONG POSITIVE
NEGATIVE
STRONG NEGATIVE
The HOW correlation matrix establishes the relationship between each HOW item. The purpose of this ‘roof’ is to identify those design requirements that potentially support each
A Functional Approach to Quality Function Deployment January 2007 30
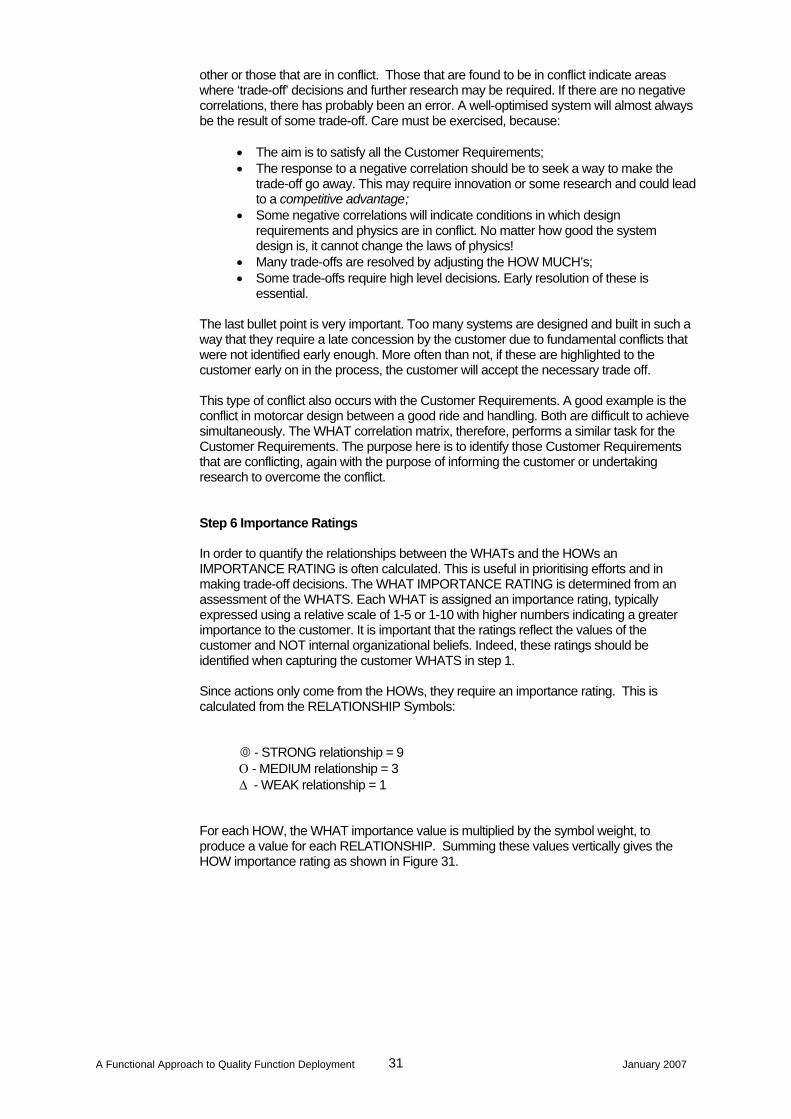
other or those that are in conflict. Those that are found to be in conflict indicate areas where ‘trade-off’ decisions and further research may be required. If there are no negative correlations, there has probably been an error. A well-optimised system will almost always be the result of some trade-off. Care must be exercised, because:
• The aim is to satisfy all the Customer Requirements; • The response to a negative correlation should be to seek a way to make the
trade-off go away. This may require innovation or some research and could lead to a competitive advantage ;
• Some negative correlations will indicate conditions in which design requirements and physics are in conflict. No matter how good the system design is, it cannot change the laws of physics!
• Many trade-offs are resolved by adjusting the HOW MUCH’s; • Some trade-offs require high level decisions. Early resolution of these is
essential.
The last bullet point is very important. Too many systems are designed and built in such a way that they require a late concession by the customer due to fundamental conflicts that were not identified early enough. More often than not, if these are highlighted to the customer early on in the process, the customer will accept the necessary trade off. This type of conflict also occurs with the Customer Requirements. A good example is the conflict in motorcar design between a good ride and handling. Both are difficult to achieve simultaneously. The WHAT correlation matrix, therefore, performs a similar task for the Customer Requirements. The purpose here is to identify those Customer Requirements that are conflicting, again with the purpose of informing the customer or undertaking research to overcome the conflict. Step 6 Importance Ratings In order to quantify the relationships between the WHATs and the HOWs an IMPORTANCE RATING is often calculated. This is useful in prioritising efforts and in making trade-off decisions. The WHAT IMPORTANCE RATING is determined from an assessment of the WHATS. Each WHAT is assigned an importance rating, typically expressed using a relative scale of 1-5 or 1-10 with higher numbers indicating a greater importance to the customer. It is important that the ratings reflect the values of the customer and NOT internal organizational beliefs. Indeed, these ratings should be identified when capturing the customer WHATS in step 1. Since actions only come from the HOWs, they require an importance rating. This is calculated from the RELATIONSHIP Symbols:
- STRONG relationship = 9
Ο - MEDIUM relationship = 3 Δ - WEAK relationship = 1
For each HOW, the WHAT importance value is multiplied by the symbol weight, to produce a value for each RELATIONSHIP. Summing these values vertically gives the HOW importance rating as shown in Figure 31.
A Functional Approach to Quality Function Deployment January 2007 31
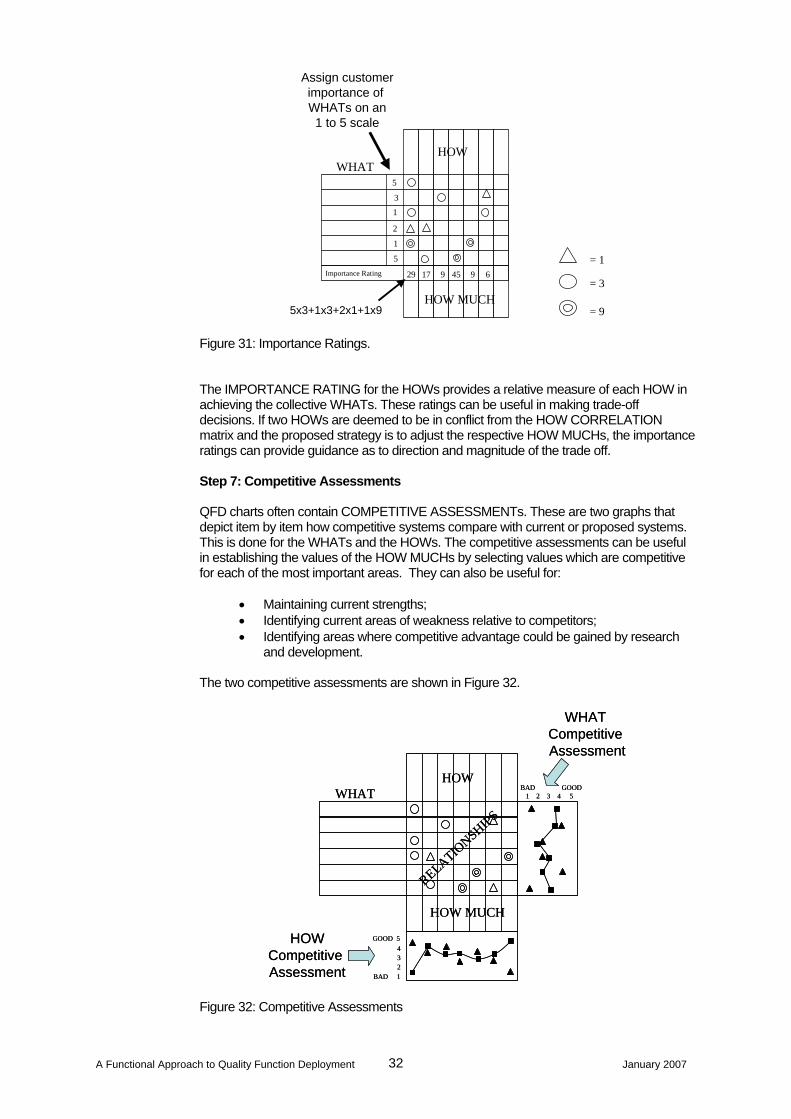
HOW
HOW MUCH
WHAT
Importance Rating
5
3
1
2
1
5 = 1
= 3
= 9
29 17 9 45 9 6
Assign customerimportance of WHATs on an1 to 5 scale
5x3+1x3+2x1+1x9 Figure 31: Importance Ratings. The IMPORTANCE RATING for the HOWs provides a relative measure of each HOW in achieving the collective WHATs. These ratings can be useful in making trade-off decisions. If two HOWs are deemed to be in conflict from the HOW CORRELATION matrix and the proposed strategy is to adjust the respective HOW MUCHs, the importance ratings can provide guidance as to direction and magnitude of the trade off.
Step 7: Competitive Assessments QFD charts often contain COMPETITIVE ASSESSMENTs. These are two graphs that depict item by item how competitive systems compare with current or proposed systems. This is done for the WHATs and the HOWs. The competitive assessments can be useful in establishing the values of the HOW MUCHs by selecting values which are competitive for each of the most important areas. They can also be useful for:
• Maintaining current strengths; • Identifying current areas of weakness relative to competitors; • Identifying areas where competitive advantage could be gained by research
and development.
The two competitive assessments are shown in Figure 32.
RELATIONSHIPS
HOW
HOW MUCH
WHAT BAD GOOD1 2 3 4 5
GOOD 5
BAD 1
432
WHAT Competitive Assessment
HOWCompetitive Assessment
RELATIONSHIPS
HOW
HOW MUCH
WHAT BAD GOOD1 2 3 4 5
GOOD 5
BAD 1
432
WHAT Competitive Assessment
HOWCompetitive Assessment
Figure 32: Competitive Assessments
A Functional Approach to Quality Function Deployment January 2007 32

Customer Competitive Assessment The COMPETITIVE ASSESSMENT of the WHATs is often called a Customer Competitive Assessment, and should use customer-oriented information. It should not be done by Engineers since they add too much technical bias. It is extremely important to understand the customer’s perceptions relative to the competition. Technical Competitive Assessment The COMPETITIVE ASSESSMENT of the HOWs is called a Technical Competitive Assessment and should be done by Engineers to analyse competing products.
Step 8: Organizational Difficulty The ORGANIZATIONAL DIFFICULTY is an additional row in which it is possible to evaluate how difficult it is currently for the organization to achieve a particular HOW MUCH. This is performed again on a relative scale where 5 implies ‘difficult’ and 1 ‘relatively easy’. The ORGANIZATIONAL DIFFICULTY row provides a crude risk assessment. A row of 1s would suggests that the system requirements as expressed by the HOWs and HOW MUCHs are not particularly demanding. Equally, a row of 5s would suggest a set of over-demanding requirements. Step 9: Historic Performance Since most systems are evolutionary, an attempt should be made to capture historic performance on the QFD to help ensure that “the same mistakes are not designed in again”. QFD charts can be used to capture historic performance data, like warranty claims and customer complaints, etc, such that the design requirements can embody these. This is achieved by annotating the various elements as appropriate to capture this useful information.
A Functional Approach to Quality Function Deployment January 2007 33