Embed Size (px)
Citation preview
RESEARCH ARTICLE
A general framework for flood risk-based storm sewer network design
Si’Ao Suna*, Slobodan Djordjevica and Soon-Thiam Khub
aCollege of Engineeringm, Mathematics and Physical Sciences, University of Exeter, Exeter, EX4 4QF, UK; bSchool of Engineeringand Physical Sciences, University of Surrey, Guildford Surrey, GU2 7XH, UK
(Received 17 January 2010; final version received 17 August 2010)
Storm sewer networks are usually designed under a certain predefined design storm. This paper proposes a generalframework for a risk-based storm sewer network design, which is capable of taking future risk into account. In theframework, the flood risk evaluation is located within an optimisation loop. The flood risk is obtained by integratingthe area under the probabilistic flood consequence curve, which is identified by simulations of sewer systemperformance under several design storms. The genetic algorithm is adapted for this specific optimisation problem inorder to make the procedure computationally efficient. The framework is applied to the designs of a syntheticnetwork and a real-world network. The results show that the general framework is able to identify the networkdesign balancing the construction cost and flood risk.
Keywords: GA; optimisation; risk; storm sewer network design
1. Introduction
In the area of water resources engineering, whendesigning infrastructures such as storm sewer networks,flooding defences and water distribution systems,decisions need to be made on their design criteria. Anover-designed standard results in a waste of publicfunds while an under-designed standard can lead tounwelcome problems such as flooding or interruptionsof water supply. Uncertainties are commonly recog-nised in this area, for example, the rainfall, the riverdischarge and the water demands all have a stochasticnature. The uncertainty leads to risks, indicating thatthe decisions about a design are generally associatedwith risk. The problem of the acceptable level of riskcan be formulated as an economic decision problem(Vrijling et al. 1995). It is widely acknowledged that anadequate design standard should be based on a goodbalance between the construction cost and the futurerisks that may occur. Risk-based design methods havebeen developed over the past decades and arerecognised as a good approach capable of taking bothaspects into account. Risk is generally defined as acombination of the probability of an event occurringand the impact associated with that event.
In floodplain management, WRC (1983) andGoodman (1984) recommended the economic frame-work that minimises the sum of the expected annualdamage and the flood management expenses. Lund
(2002) asserted that probabilistic benefit–cost analysishas largely replaced older forms of economic analysisthat examines only one particular design flood. Voort-man (2003) believed that the appropriate protectionlevel provided by a flood defence system is ideallyobtained by balancing the cost of the protectionagainst the risk reduction in the protected area.Additionally, Korving et al. (2003, 2009) determinedthe optimal storage volume of a sewer system by takinginto account both the cost of building sewer storageand the risk of the environmental damage in case of anoverflow. Morita (2008) presented a risk-based analy-sis method for the assessment of an optimal floodprotection level in a fluvial flooding urban area.Furthermore, within a risk-based concept concerningthe sewer rehabilitation and management, Ryu andButler (2008) allowed a rational comparison ofalternatives for flood risk alleviation options in anurban area. In the field of the hydrogeological design,Freeze et al. (1990) provided a framework forhydrogeological decision analysis based on the netpresent value of expected benefits, costs and risks. Inthe area of the water distribution design, Kapelan et al.(2006) recommended a risk-based method whichconsiders the consequence of a potential service failurein addition to the probability of that failure.
Specifically in the field of the storm sewer networkdesign, the problem was first formulated and solved
*Corresponding author. Email: [email protected]
Urban Water Journal
Vol. 8, No. 1, February 2011, 13–27
ISSN 1573-062X print/ISSN 1744-9006 online
� 2011 Taylor & Francis
DOI: 10.1080/1573062X.2010.542819
http://www.informaworld.com
aiming to minimise the construction costs whilstensuring no surcharge or flood with a fixed designdischarge in each pipe. Models have been proposed forthe application of dynamic programming (DP) byMays and Wenzel (1976), Yen et al. (1984), Kulkarniand Khanna (1985), linear programming (Elimamet al. 1989), genetic algorithm (GA) and tabu search(Liang et al. 2004). These approaches suffer from theshortcoming that the capacity of each pipe in thenetwork is considered individually. Consequently thesystem capacity is ignored as sewers can generallyaccommodate a considerable surcharge before surfaceflooding occurs. Hence these approaches using a designdischarge for each pipe may result in inappropriateevaluation of the system capacity. In this sense, adesign-storm based method provides a better solution.With this approach, the system performance is assessedas a whole under a predefined design storm. A goodsystem performance (e.g., no flood occurrence) isrequired with this approach. The selection of pipediameters (usually from several available pipe sizes) toconstitute a network of the least capital cost is an NP-hard (non-deterministic polynomial-time hard) pro-blem (Yates et al. 1984). The evolutionary methodshave performed well in this kind of optimisationproblems. Among these methods, GA (Goldberg1989), is the most popular advanced method appliedfor this task with great success (Savic and Walters1997). Other techniques, such as the ant colonyoptimisation method (Zecchin et al. 2006), the particleswarm optimisation method (Izquierdo et al. 2008) andthe cellular automata (Guo et al. 2007) have also beenapplied successfully.
This paper aims to present a general framework foroptimal flood risk-based storm sewer network designwith a given layout. Different from the conventionalmethod requiring a predefined design level, this risk-based approach allows the identification of theappropriate design level, which is implicitly determinedin the optimisation process. It is a constrained non-linear optimisation problem with the decision variablesbeing a combination of discrete variables (pipe sizes)and continuous variables (pipe slopes). In the frame-work, the flood risk evaluation is located within theoptimisation loop. For each candidate design network,the flood risk is estimated by simulations of sewersystem performances under several design storms. Theoptimisation process (GA is used in this paper) is thenapplied to find the best design with respect to theoverall cost including the construction cost and floodrisk cost. The paper is organised as follows: in the nextsection the problem is formulated and the frameworkproposed to solve the problem is outlined. The detailsof the adapted GA for this specific optimisationproblem are presented in the third part, followed by
two case studies which verify the framework; finally theconclusions are drawn.
2. Framework for optimal flood risk-based storm sewer
network design
2.1. Problem formulation
The optimal flood risk-based storm sewer networkdesign problem is considered under the followingassumptions:
(1) the network configuration (i.e., the manholepositions, the pipe layout and the connectivityetc.) is known beforehand;
(2) the pipe sizes and the pipe slopes are thedecision variables that need to be determined;
(3) the flood consequences can be expressed with amonetary unit.
The objective of an optimal flood risk-based stormsewer network design is to balance the constructioncost against the flood risk reduction, i.e., to minimisethe sum of the construction cost and the flood risk cost(the expected flood damage is used to present theprobabilistic flood risk in this paper, as detailed insection 2.2). The objective of the problem is:
min f Di;Sið Þ ¼ c Di;Sið Þ þ r Di;Sið Þ; i ¼ 1; 2; . . . n
ð1Þ
where f(Di, Si) is the objective function to be minimisedwith the decision variables being the pipe diameters Di
chosen from a discrete set of available values and theslopes Si belong to a continuous interval [Smin, Smax];c(Di, Si) is the construction cost of the systemdetermined by decision variables; r (Di, Si) is the floodrisk cost which is also a function of the network design;n is the number of pipes in the network.
The flood risk cost commonly requires incorporat-ing all relevant effects caused by flood (see section 2.3).However, there is no generally accepted way tomonetise non-monetary impacts such as intangibleconsequences. The risk-based approach can be criti-cised because it necessitates the quantification of theconsequences caused by a flood in monetary terms, butit is one of the essential parts of information which isnecessary for rational decision making (Jonkman et al.2004). Despite the limitation, the risk-based methodcan still provide significant rational information todecision makers.
The pipe diameters should satisfy the usualconstraint that the size of a downstream pipe is noless than that of its upstream pipes:
Di � Didown 8i ð2Þ
14 S. Sun et al.
where Didown presents the diameter of the downstreampipe of pipe i. The excavation depth should not exceedsome value due to the limits of the excavationequipment and technology:
hi � hmax 8i ð3Þ
where hi is the excavation depth of manhole i, hmax isthe allowed maximum excavation depth. Additionally,the height of the surface cover over pipes is required tobe not less than certain value in order to make sure thepipes are below the frost depth and they stay awayfrom excessive live loads on the surface:
h0i � h0min 8i ð4Þ
where h0i is the surface cover height over the pipe nearthe manhole i, h0min is the allowed minimum surfacecover height. The excavation depth is computed fromthe pipe cover height at the same place by adding thesize of the pipe on it (pipe thickness is neglected herefor simplicity):
hi ¼ h0i þDj ð5Þ
The manhole depths are sometimes considered asthe decision variables instead of pipe slopes. It will notaffect the optimal design, as the vertical network layoutis completely determined by either one of them. Inpractice, some other constraints such as a minimumpipe flow velocity for self cleansing requirement and amaximum velocity to avoid excessive erosion to pipesneed to be taken into account. This paper does notconsider all constraints in case studies but theproposed methodology can easily incorporate otherconstraints if required.
2.2. The Framework of flood risk based storm sewernetwork optimisation
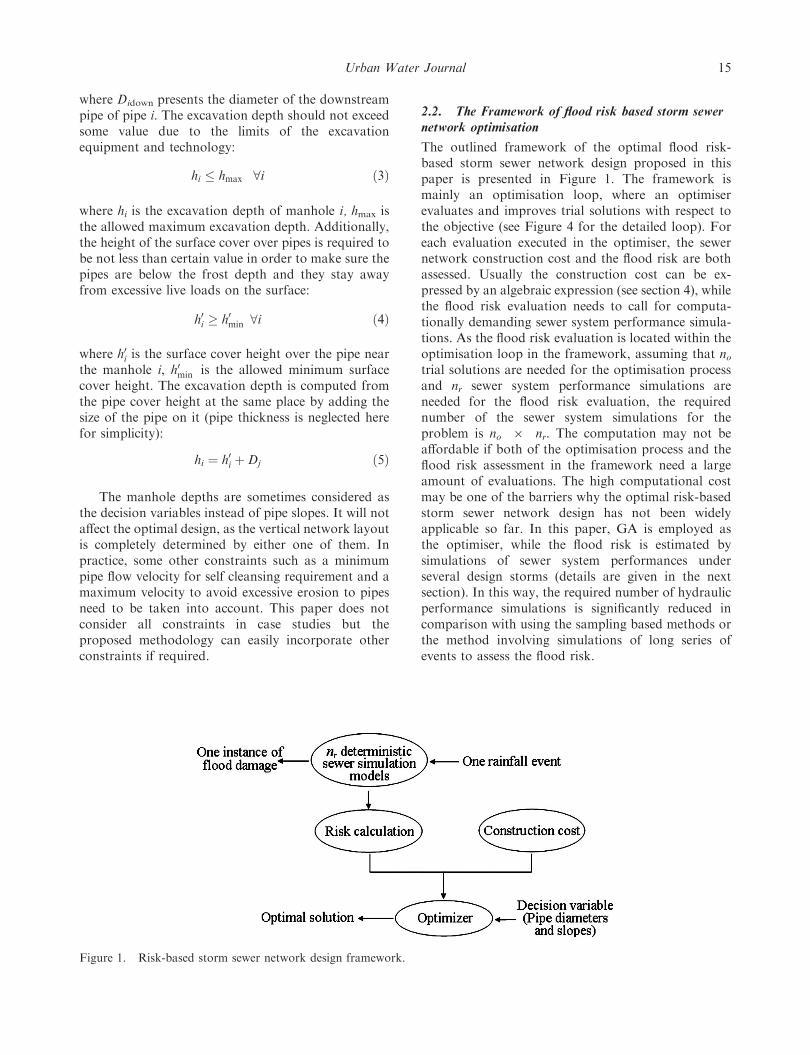
The outlined framework of the optimal flood risk-based storm sewer network design proposed in thispaper is presented in Figure 1. The framework ismainly an optimisation loop, where an optimiserevaluates and improves trial solutions with respect tothe objective (see Figure 4 for the detailed loop). Foreach evaluation executed in the optimiser, the sewernetwork construction cost and the flood risk are bothassessed. Usually the construction cost can be ex-pressed by an algebraic expression (see section 4), whilethe flood risk evaluation needs to call for computa-tionally demanding sewer system performance simula-tions. As the flood risk evaluation is located within theoptimisation loop in the framework, assuming that notrial solutions are needed for the optimisation processand nr sewer system performance simulations areneeded for the flood risk evaluation, the requirednumber of the sewer system simulations for theproblem is no 6 nr. The computation may not beaffordable if both of the optimisation process and theflood risk assessment in the framework need a largeamount of evaluations. The high computational costmay be one of the barriers why the optimal risk-basedstorm sewer network design has not been widelyapplicable so far. In this paper, GA is employed asthe optimiser, while the flood risk is estimated bysimulations of sewer system performances underseveral design storms (details are given in the nextsection). In this way, the required number of hydraulicperformance simulations is significantly reduced incomparison with using the sampling based methods orthe method involving simulations of long series ofevents to assess the flood risk.
Figure 1. Risk-based storm sewer network design framework.
Urban Water Journal 15
2.3. Flood risk evaluation
The rainfall is the main driver of urban flooding. Dueto its stochastic property, the flood risk is not a fixedvalue, but a probabilistic variable. The risk-basedmethod comparing the construction cost and the floodrisk reduction is not straightforward because itinvolves the problematic comparison between a fixedvalue and a probabilistic value. The most straightfor-ward way to solve this problem is to represent theprobabilistic flood risk with a fixed value. The expectedannual flood damage is extensively used as therepresentative (Korving et al. 2003, Dawson et al.2008, Morita 2008, Ryu and Butler 2008):
r ¼Z 10
x p xð Þdx ð6Þ
where x is the flood consequence, p is the annual floodprobability. The expected flood consequence, corre-sponding to the average annual consequence caused byflooding, is appropriate to represent flood risk in adecision making process especially in a long term(storm sewer networks are usually designed for a longtime period). The average flood consequence can bewell captured by the mean value. In this paper, theexpected flood consequence is adopted to representflood risk.
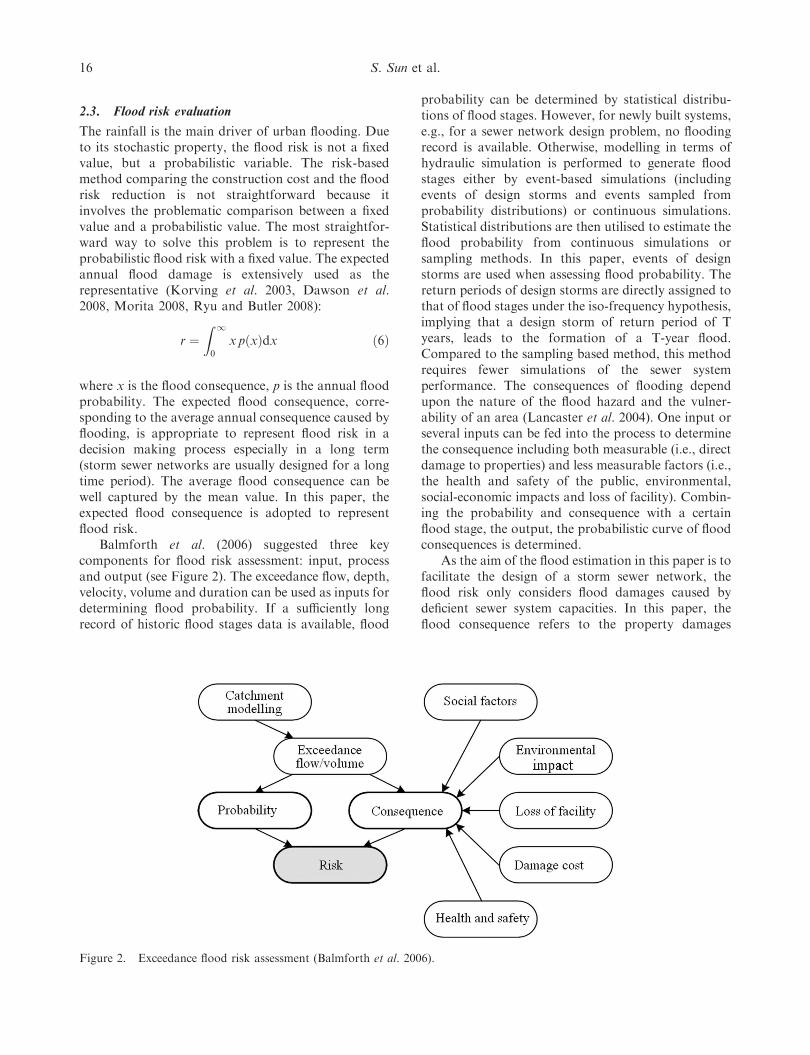
Balmforth et al. (2006) suggested three keycomponents for flood risk assessment: input, processand output (see Figure 2). The exceedance flow, depth,velocity, volume and duration can be used as inputs fordetermining flood probability. If a sufficiently longrecord of historic flood stages data is available, flood
probability can be determined by statistical distribu-tions of flood stages. However, for newly built systems,e.g., for a sewer network design problem, no floodingrecord is available. Otherwise, modelling in terms ofhydraulic simulation is performed to generate floodstages either by event-based simulations (includingevents of design storms and events sampled fromprobability distributions) or continuous simulations.Statistical distributions are then utilised to estimate theflood probability from continuous simulations orsampling methods. In this paper, events of designstorms are used when assessing flood probability. Thereturn periods of design storms are directly assigned tothat of flood stages under the iso-frequency hypothesis,implying that a design storm of return period of Tyears, leads to the formation of a T-year flood.Compared to the sampling based method, this methodrequires fewer simulations of the sewer systemperformance. The consequences of flooding dependupon the nature of the flood hazard and the vulner-ability of an area (Lancaster et al. 2004). One input orseveral inputs can be fed into the process to determinethe consequence including both measurable (i.e., directdamage to properties) and less measurable factors (i.e.,the health and safety of the public, environmental,social-economic impacts and loss of facility). Combin-ing the probability and consequence with a certainflood stage, the output, the probabilistic curve of floodconsequences is determined.
As the aim of the flood estimation in this paper is tofacilitate the design of a storm sewer network, theflood risk only considers flood damages caused bydeficient sewer system capacities. In this paper, theflood consequence refers to the property damages
Figure 2. Exceedance flood risk assessment (Balmforth et al. 2006).
16 S. Sun et al.
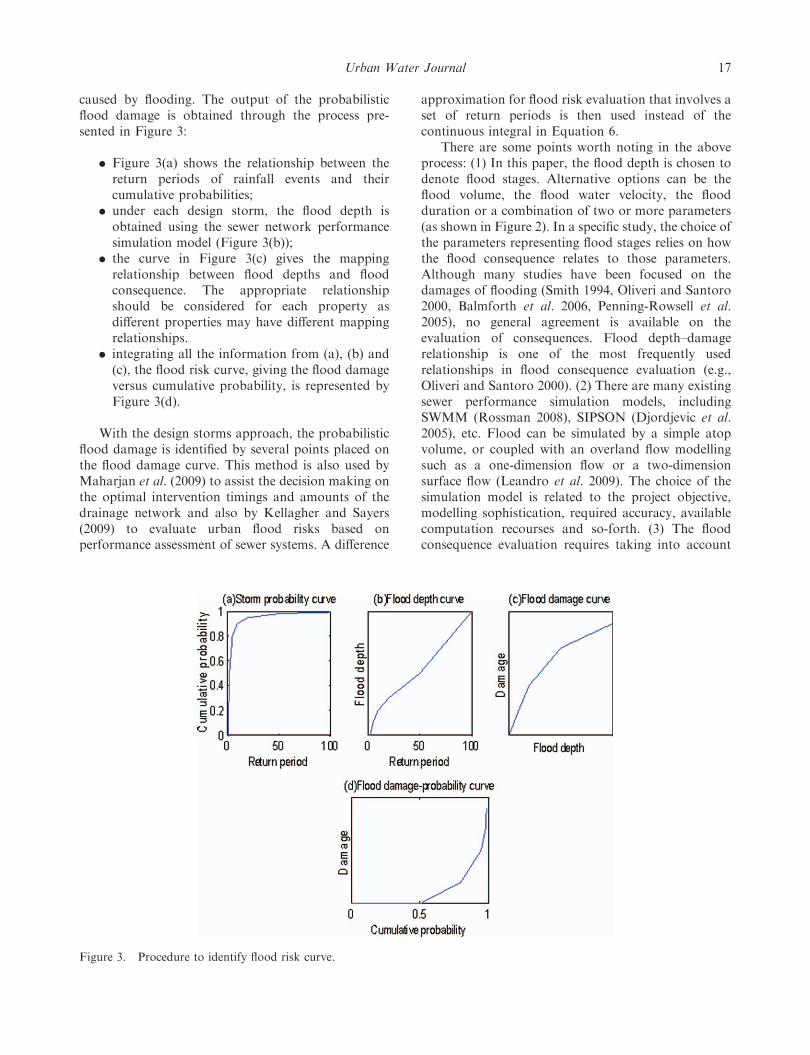
caused by flooding. The output of the probabilisticflood damage is obtained through the process pre-sented in Figure 3:
. Figure 3(a) shows the relationship between thereturn periods of rainfall events and theircumulative probabilities;
. under each design storm, the flood depth isobtained using the sewer network performancesimulation model (Figure 3(b));
. the curve in Figure 3(c) gives the mappingrelationship between flood depths and floodconsequence. The appropriate relationshipshould be considered for each property asdifferent properties may have different mappingrelationships.
. integrating all the information from (a), (b) and(c), the flood risk curve, giving the flood damageversus cumulative probability, is represented byFigure 3(d).
With the design storms approach, the probabilisticflood damage is identified by several points placed onthe flood damage curve. This method is also used byMaharjan et al. (2009) to assist the decision making onthe optimal intervention timings and amounts of thedrainage network and also by Kellagher and Sayers(2009) to evaluate urban flood risks based onperformance assessment of sewer systems. A difference
approximation for flood risk evaluation that involves aset of return periods is then used instead of thecontinuous integral in Equation 6.
There are some points worth noting in the aboveprocess: (1) In this paper, the flood depth is chosen todenote flood stages. Alternative options can be theflood volume, the flood water velocity, the floodduration or a combination of two or more parameters(as shown in Figure 2). In a specific study, the choice ofthe parameters representing flood stages relies on howthe flood consequence relates to those parameters.Although many studies have been focused on thedamages of flooding (Smith 1994, Oliveri and Santoro2000, Balmforth et al. 2006, Penning-Rowsell et al.2005), no general agreement is available on theevaluation of consequences. Flood depth–damagerelationship is one of the most frequently usedrelationships in flood consequence evaluation (e.g.,Oliveri and Santoro 2000). (2) There are many existingsewer performance simulation models, includingSWMM (Rossman 2008), SIPSON (Djordjevic et al.2005), etc. Flood can be simulated by a simple atopvolume, or coupled with an overland flow modellingsuch as a one-dimension flow or a two-dimensionsurface flow (Leandro et al. 2009). The choice of thesimulation model is related to the project objective,modelling sophistication, required accuracy, availablecomputation recourses and so-forth. (3) The floodconsequence evaluation requires taking into account
Figure 3. Procedure to identify flood risk curve.
Urban Water Journal 17
all the relevant effects caused by flooding. In thispaper, only property damages are considered forsimplification. In all, though the case studies of thispaper generate the flood risk with a simplifiedmechanism, it would not lose the generality of themethodology.
The design storm hydrograph can either be createdfrom intensity-duration-frequency (IDF) curves usingthe alternating block method (Chow et al. 1988) or begiven directly. If a T-year design storm is presented bya set of hydrographs with different durations, thesystem performance simulation model should be rununder a number of durations and the worst
consequence should be adopted as the T-year floodconsequence (see Kellagher and Sayers 2009).
3. Optimisation by adapted GA
The GA (Holland 1975), at first inspired by evolu-tionary biology, is a popular evolutionary optimisationmethods. It is categorised as a global searchingoptimisation method and is applicable for bothcontinuous and discrete problems. It is employed asthe optimisation algorithm in this paper. The originalGA is briefly described: firstly, the decision variablesare encoded according to some rules (traditionally
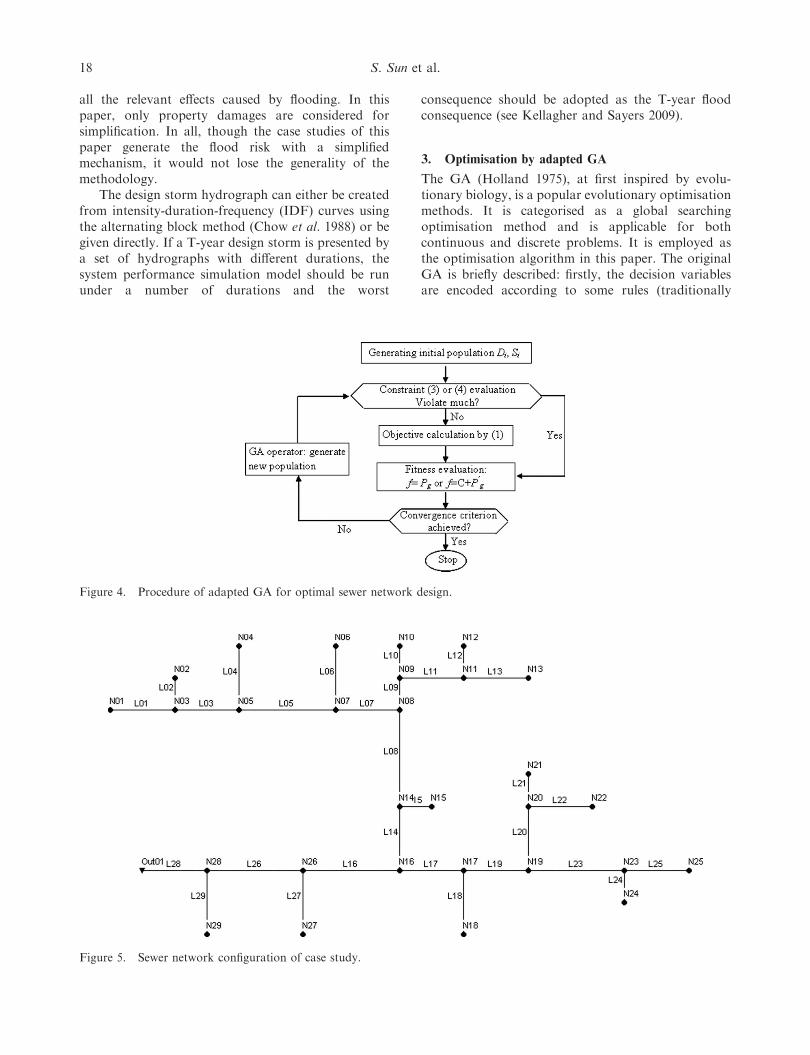
Figure 4. Procedure of adapted GA for optimal sewer network design.
Figure 5. Sewer network configuration of case study.
18 S. Sun et al.
using binary strings but other encodings are alsopossible); then the initial population is randomlygenerated where each individual, called a chromosome,is represented by a set of parameter values thatcompletely describe a solution; the fitness value whichmeasures how good a chromosome is with respect tothe objective function is evaluated for each individual;based on fitness values individuals are selected; with acertain proportion of crossover and mutation, the nextgeneration of chromosomes is generated; the steps ofevaluating fitness and generating next generation ofchromosomes are repeated until a convergence criter-ion is attained.
In the optimal storm sewer system design definedabove, the decision variables include pipe diametersand pipe slopes. Accordingly a chromosome isconsisted of two parts: the first part describes pipediameters and the second part presents pipe slopes.Chromosomes are encoded with decimal values. Asimple example of a chromosome describing a two-pipe network is given: 3 5 0.05 0.03, where the first halfpart represents the pipe sizes (the first pipe has thethird and the second pipe has the fifth diameter fromthe available sizes) and the second half part representsthe pipe slopes (the first pipe has a slope of 0.05and the second has a slope of 0.03).
Generally GA is designed for non-constrainedoptimisations. If a constrained optimisation problemis considered, a penalty function approach is usuallyperformed to penalise the fitness of solutions when aconstraint is violated. With the penalised cost,candidate solutions that violate constraints are judgedinferior. As there are three constraints (2), (3) and (4)in our storm sewer network design, it is even difficult toattain a solution that satisfies all constraints whenconsidering the three constraints with penalty func-tions simultaneously. Therefore in this paper theconstraints (3) and (4) are dealt with penalty, whilethe constraint (2) is considered implicitly in theoptimisation process, i.e., the initialisation and theoperation (including crossover and mutation) parts of
GA are constructed in a way that implicitly satisfies (2)for each candidate solution.
The fitness of each candidate is combined of twoparts: the first part is given by (1) and the second partcorresponds to the penalty on the violation of (3) and(4). Considering that the objective evaluation of (1)based on several simulations of sewer system perfor-mance is much more computationally demanding thanthe evaluation of (3) and (4) with algebraic expressions,the following process is proposed in order to reducecomputations. In the optimisation process, if acandidate solution badly violates one of the con-straints, its fitness is directly assigned a large penaltyvalue, without evaluating (1). The procedure of theadapted GA for the application of optimal flood risk-based storm sewer network design is presented inFigure 4. If the candidate solutions violate (3) or (4)more than a threshold value defined beforehand, arelatively large penalty is given directly to the fitness:
f ¼ Pg ð7Þ
Table 1. Sewer pipe costs for case study.
Pipe diameter (m) Unit cost (£/m)
0.150 33.540.225 44.270.330 54.140.375 69.830.450 92.200.600 139.540.750 192.790.900 252.291.050 311.251.200 442.93
Table 2. Percentages of total value of the damaged property(Oliveri and Santoro 2000).
Property type
Flood depth (m)
0.25 0.50 0.75 1.00 1.25
1 or 2 stories,no basement (%)
4.8 7.8 12.5 15.6 17.8
4 storeys, nobasement (%)
5.3 7.5 8.8 9.0 9.7
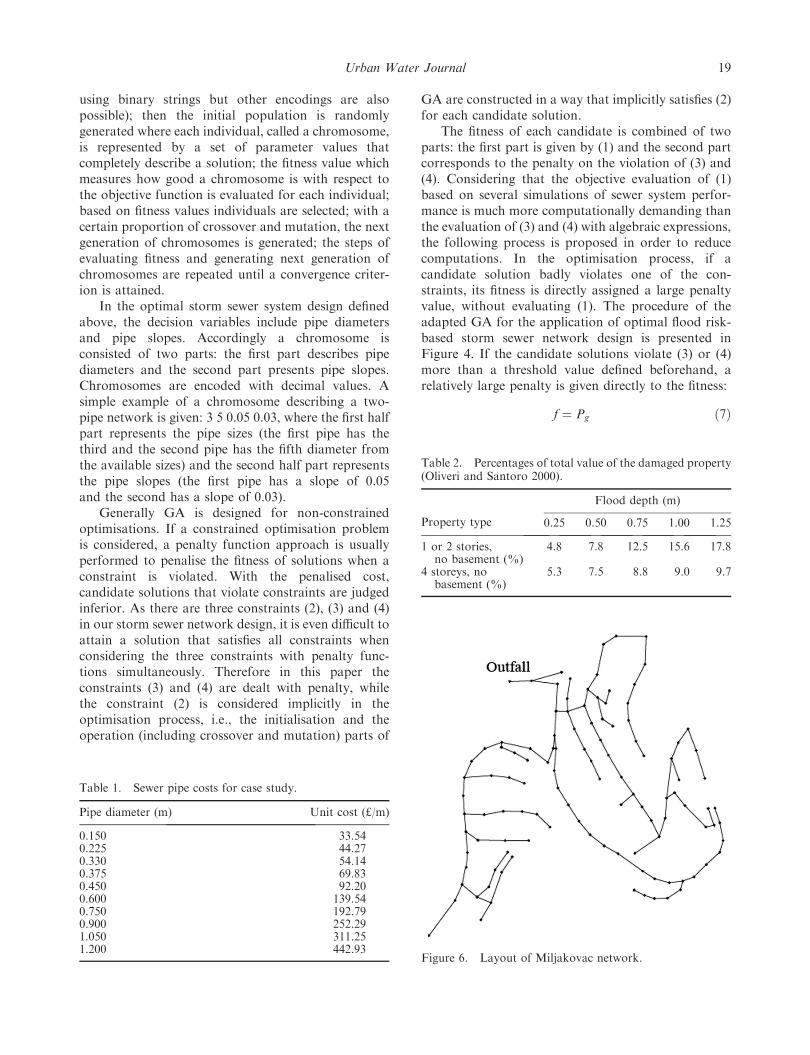
Figure 6. Layout of Miljakovac network.
Urban Water Journal 19
where f is the fitness value and Pg is a relatively largepenalty for violating (3) or (4).
Only the ‘good enough’ candidates with respect to(3) and (4) can go to the next stage of fitness evaluationby adding the penalty of violation to the objectivefunction:
f ¼ Cþ P0g ð8Þ
where C is the evaluated objective value, P0g is thepenalty for violating (3) and (4).
4. Case studies
The proposed framework for optimal flood risk-basedstorm sewer network design is applied to two casestudies: a synthetic network and a real network ofMiljakovac, in Belgrade, Serbia. The two cases werestudied by Guo et al. (2007) to determine the pipe sizesin the network under a predefined design storm.
4.1. The synthetic network
The synthetic network has a simple layout (see Figure5) and highly simplified system features. It consists of29 circular pipes, 29 standard manholes, and 1 outfallwith a free outflow boundary condition. All pipes havethe same Manning roughness coefficient of 0.013 anddifferent lengths of 100, 200 or 300 meters. Pipediameters can be chosen from 0.15 to 1.20 m with
0.075 or 0.15 increments. Slopes Si belong to thecontinuous interval [0.0015, 0.05]. The ground surfaceof the area is assumed horizontal. Each manholecollects runoff from a subcatchment of 5 6 103 m2 andconnects to a street with the size being 100 6 5 m. Thesurface flood is simply simulated by considering thestreets as ponds on top of manholes. In this case, flooddepth on each street is considered as the maximumwater depth from atop area.
The allowed minimum height of surface covers overpipes is 0.5 m and the maximum excavation depth is10 m. The construction cost of the sewer systemcontains: (1) pipe cost; (2) earthworks; (3) manholeconstruction fees. Table 1 presents the unit length costof sewer pipes with different sizes. The unit cost ofearthworks is 180 £/m3. The cross-section shape of thetrench is trapezoidal: the width of the trench bottom isb ¼ Di þ 0.5; the trench depth changes along a pipe;let h0 be the trench depth of a pipe at the upstream end;the angle of trench side wall is y ¼ 458. The excavationvolume along a pipe is integrated along the pipe length,with the form:
V ¼ 1
3tan yS2L3 þ 1
2bSþ 2h0tan ySð ÞL2
þ bh0 þ h02tan y� �
L ð9Þ
The manhole construction cost follows the function:
C hð Þ ¼ 292:80hþ 123:21 ð10Þ
Assuming the sewer network is designed for 70years use, the construction price is discounted toannual cost by formula:
ca ¼1� a1� an
c ð11Þ
where ca is the discounted annual construction cost, cis the total construction cost, and a is the discountfactor which can be calculated from:
a ¼ 1
1þ rð12Þ
inwhich r ¼ 5% is the assumedbenchmark interest rate.There are 5 houses on each side of the 100-m long street.The value of each house is £5 6 105. All houses in the
Table 3. Lookup table for pipeline cost and bedding cost(updated from Heaney et al. 2002).
Diameter(m)
Pipelinecost (£/m)
Trenchwidth (m)
Beddingcost (£/m3)
0.203 24.63 0.610 11.420.254 30.92 0.610 12.500.305 37.73 0.610 13.760.381 48.21 0.914 18.500.457 54.76 0.914 21.330.610 78.87 1.219 30.420.762 97.48 1.219 35.370.914 143.59 1.829 52.851.219 213.82 2.134 73.811.524 309.72 2.438 98.001.829 470.35 3.048 135.63
Table 4. Parameters set in GA.
Populationsize
Selectionmethod
Crossoverrate
Mutationrate
Elitesize
Totalgeneration Convergence criterion
200 Roulette 0.8 0.05 2 1000 No improvement for 200 generations
20 S. Sun et al.
study area are assumed to be 1 or 2 stories and they allhave the damage curve given in Table 2 (Oliveri andSantoro 2000). In real cases, different damage curvesshould be incorporated if different types of property areconsidered. The IDF curves of 1, 2, 5, 10, 20, 50, 100, and200 years return periods for this area are given.
4.2. Miljakovac Network
The urban catchment Miljakovac is situated inBelgrade, Serbia. Its area covers 2.55 6 105 m2. The
sewer network consists of 112 circular pipes, 112standard manholes, and 1 outfall. The layout of thenetwork is shown in Figure 6.
The construction cost function is built according toHeaney et al. (2002), including pipeline installationexpenses, trench excavation costs, bedding costs andmanhole costs. Lookup tables for pipeline installationexpenses and bedding cost for different pipe sizes, themanhole cost function, as well as the unit excavationcost are given by Heaney et al. (2002) at January 1999prices. Costs are updated to 2009 values according to
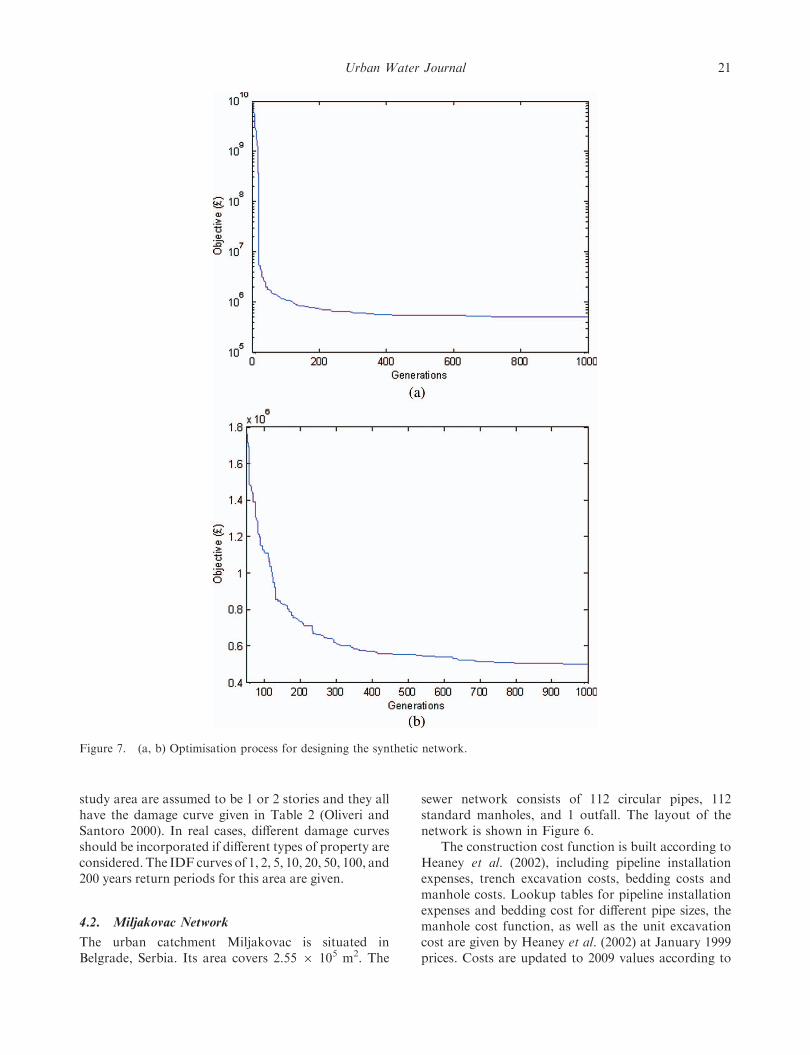
Figure 7. (a, b) Optimisation process for designing the synthetic network.
Urban Water Journal 21
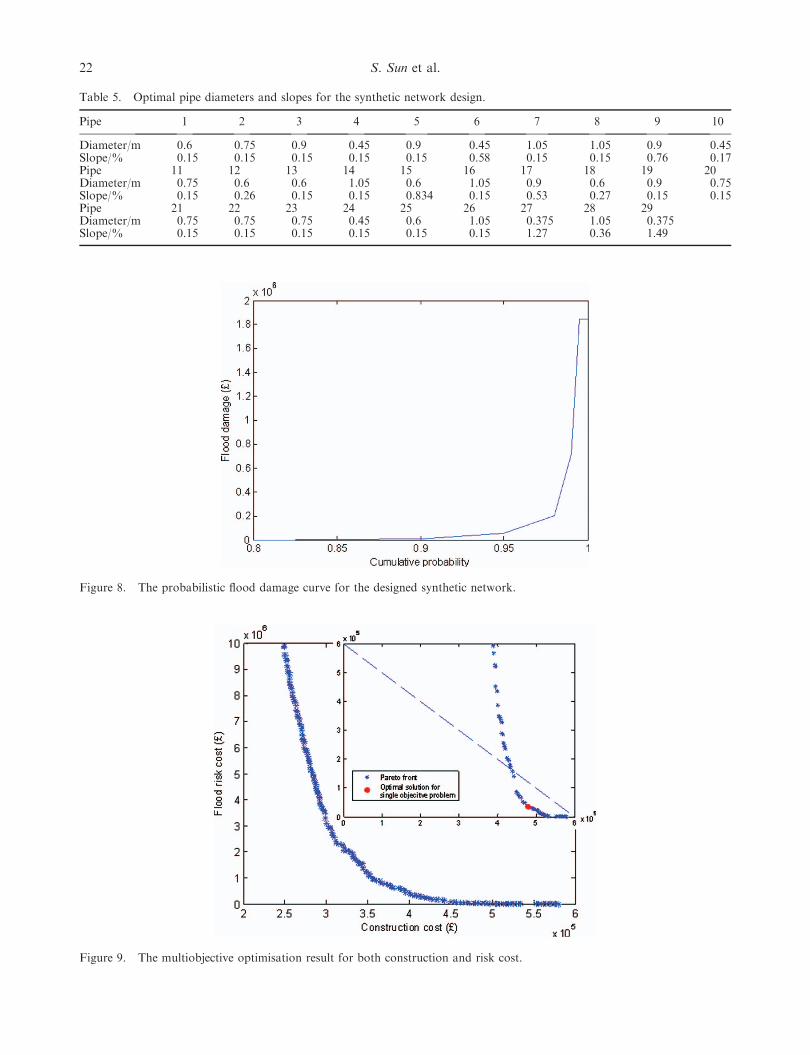
Table 5. Optimal pipe diameters and slopes for the synthetic network design.
Pipe 1 2 3 4 5 6 7 8 9 10
Diameter/m 0.6 0.75 0.9 0.45 0.9 0.45 1.05 1.05 0.9 0.45Slope/% 0.15 0.15 0.15 0.15 0.15 0.58 0.15 0.15 0.76 0.17Pipe 11 12 13 14 15 16 17 18 19 20Diameter/m 0.75 0.6 0.6 1.05 0.6 1.05 0.9 0.6 0.9 0.75Slope/% 0.15 0.26 0.15 0.15 0.834 0.15 0.53 0.27 0.15 0.15Pipe 21 22 23 24 25 26 27 28 29Diameter/m 0.75 0.75 0.75 0.45 0.6 1.05 0.375 1.05 0.375Slope/% 0.15 0.15 0.15 0.15 0.15 0.15 1.27 0.36 1.49
Figure 8. The probabilistic flood damage curve for the designed synthetic network.
Figure 9. The multiobjective optimisation result for both construction and risk cost.
22 S. Sun et al.
the US Engineering News-Record (ENR) constructioncost index. The units are converted into metric unitsand the US dollars are exchanged to UK pounds at anexchange rate of 0.559 pounds per dollar. The lookuptables for pipeline installation expenses and beddingcost are shown in Table 3. The underground soil typeof this area is clay. The trench excavation volume isevaluated according to (9), but with the pipe slope S in(9) substituted by the relative slope Sr ¼ S7Sg, whereSr is the relative slope and Sg is the ground surfaceslope. The unit excavation cost including backfill andblasting is 199.97£/m3. The manhole cost is related tothe depth of the manhole:
Cmh ¼ 1165H0:9317 ð13Þ
On each street there are 8 houses, each worth£5 6 105, and the damage curve is the same as inTable 2. The ground surface slopes of some part in thearea are very steep thus the pipe slopes are allowed tobe in the interval of [0.003, 0.25]. The pipe cover is setto be no less than 0.5 m and the excavation depth is nomore than 12 meters. The sewer network is designedfor 70 years use, discounted formula and parametersare set the same as in the synthetic network. The IDFcurves are assumed with the form of I ¼ a/(duration þb)c, where a, b and c are parameters. The curves ofreturn periods of 2, 5, 10, 25, 50, 100, 200 years aregiven. The damage relationships are given in Table 2(Oliveri and Santoro 2000).
5. Results and discussions
5.1. The synthetic network
Parameters and schemes set in GA are given in Table4. The Storm Water Management Model (SWMM) isemployed as the storm sewer performance simulator.
As a GA is a stochastic optimisation algorithm, theprogram was run 10 times. Among the 10 runs, theresultant optimal objective values at the last generationvary between £499,108 and £519,488, with the largestrelative difference being around 4%. The best design ispresented. The objective values of all generations areplotted in a logarithm scale, as shown in Figure 7 (a, b)is the objective values from the 50th generation with alinear scale. The objective value decreases as the searchgoes on. At the beginning the objective value is muchhigher than the subsequent ones. This is because allchromosomes at the beginning violate (3) or (4) badly,and are directly assigned a high penalty value. Theobjective value of the optimal design is £499,108. Theobtained optimal design is listed in Table 5.
In order to identify the flood return period of thedesigned sewer system, the performances of the designnetwork are simulated under design storms. Anysurface water is considered as flood. No flood appearswith the 5-year design storm and some flooding occurswith the 10-year design storm. It indicates that in thiscase, the average annual cost can be minimised whenthe storm sewer network is designed under this specificreturn period. Compared with the traditional sewernetwork design method in which the design return
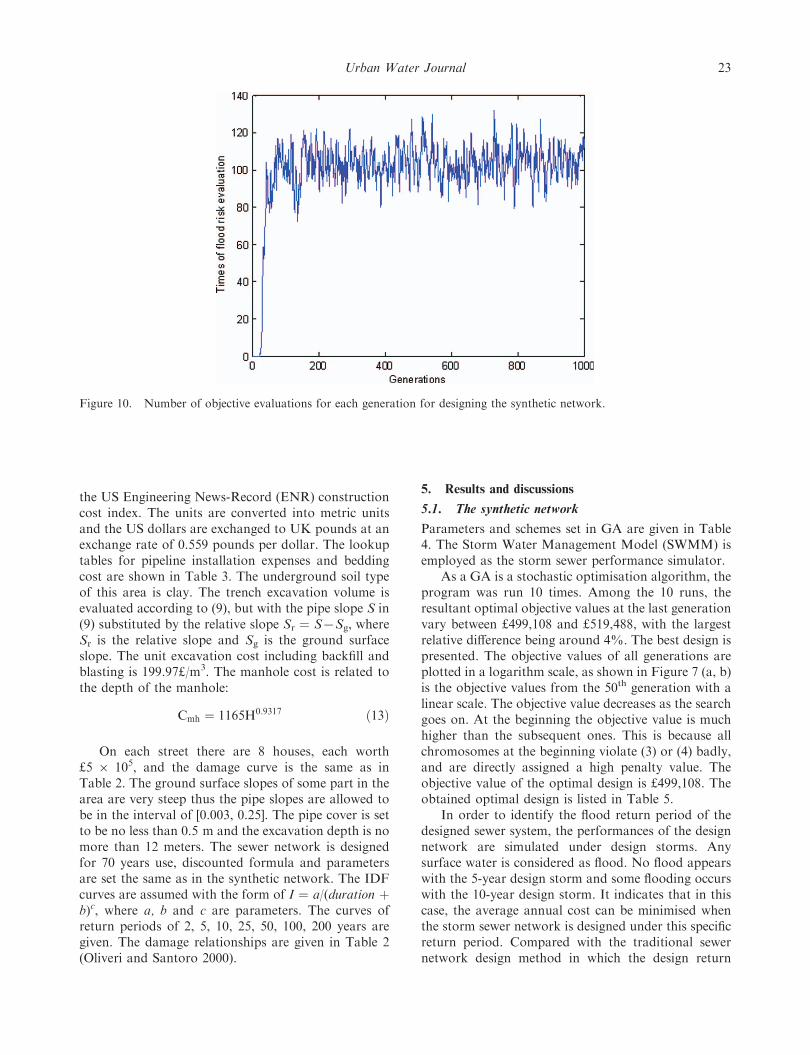
Figure 10. Number of objective evaluations for each generation for designing the synthetic network.
Urban Water Journal 23
period needs to be given beforehand according toexperience or experts’ opinion, this risk based methodimplicitly determines the service level. The traditionaldesign may cause inappropriate capital spendingbecause it is not based on a balance betweenconstruction cost and flood risk. It is worth mentioningthat the appropriate protection level is highly related tothe construction cost function and the flood conse-quence function. The design level of a certain systemvaries corresponding to specific situations.
Figure 8 shows the probabilistic flood damagecurve for the obtained optimal design. The curve isapproximated by linear interpolation of the flooddamage under design storms. The curve is extendedhorizontally when the flood return period exceeds 200years (top right corner at the diagram in Figure 8).
The construction cost and flood risk cost for theobtained design network are respectively £472,791 and£26,317 for an annual year. Usually the flood risk of asewer network decreases when the construction cost
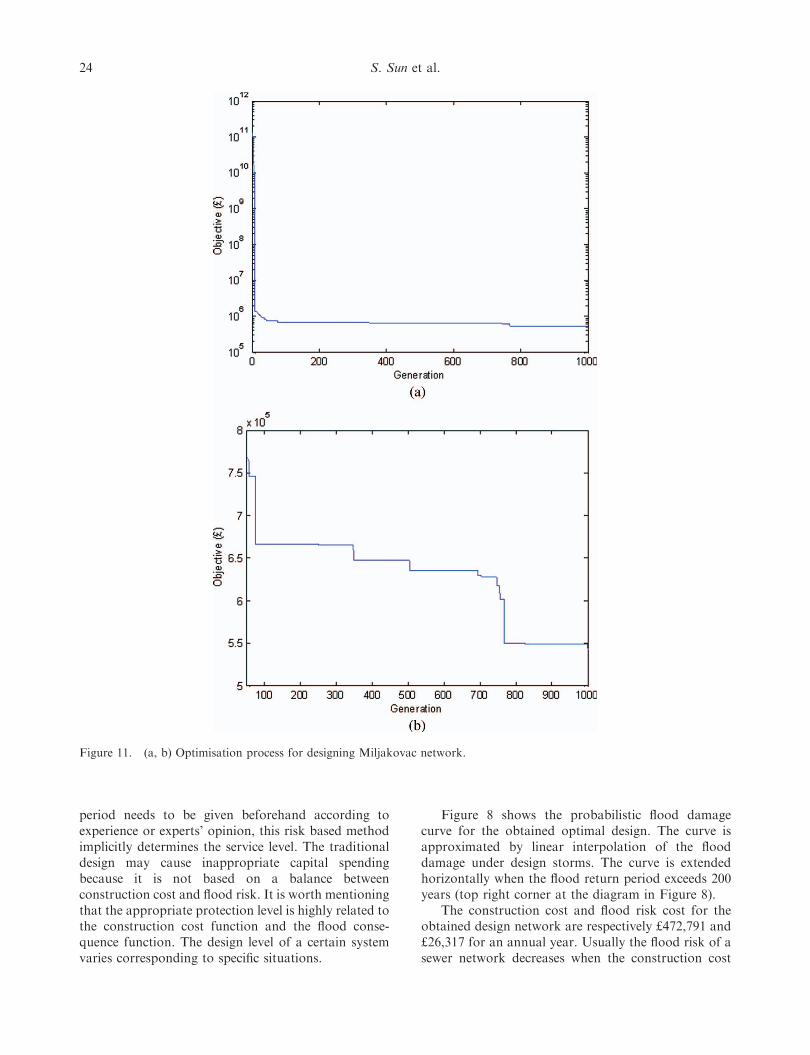
Figure 11. (a, b) Optimisation process for designing Miljakovac network.
24 S. Sun et al.
increases. In order to know the trade-off between thesetwo values, a multi-objective optimisation is carriedout to attain the Pareto front of the minimisation ofboth the construction cost and the flood risk cost.Figure 9 shows the Pareto front. The construction coststarts from a threshold value corresponding to theexisting minimum spending on the infrastructure. Atthe beginning, the increase of the construction cost isvery efficient at reducing the expected flood risk cost.However, when it achieves a certain level (around£4 6 105in this case), where the capacity of the sewer
network is adequate, the trade off between the growthof the construction cost and the reduction of the floodrisk cost becomes inefficient. The most economicdesign minimising the sum of construction cost andflood risk cost is located on the Pareto front with themaximum distance to the line x þ y ¼ c (wherec ¼ £6 6 105 in Figure 9).
The number of the flood risk evaluations for allgenerations is shown in Figure 10. No simulation iscalled for the first 20 generations, which shows that allthe initial random candidate solutions violate (3) or (4)
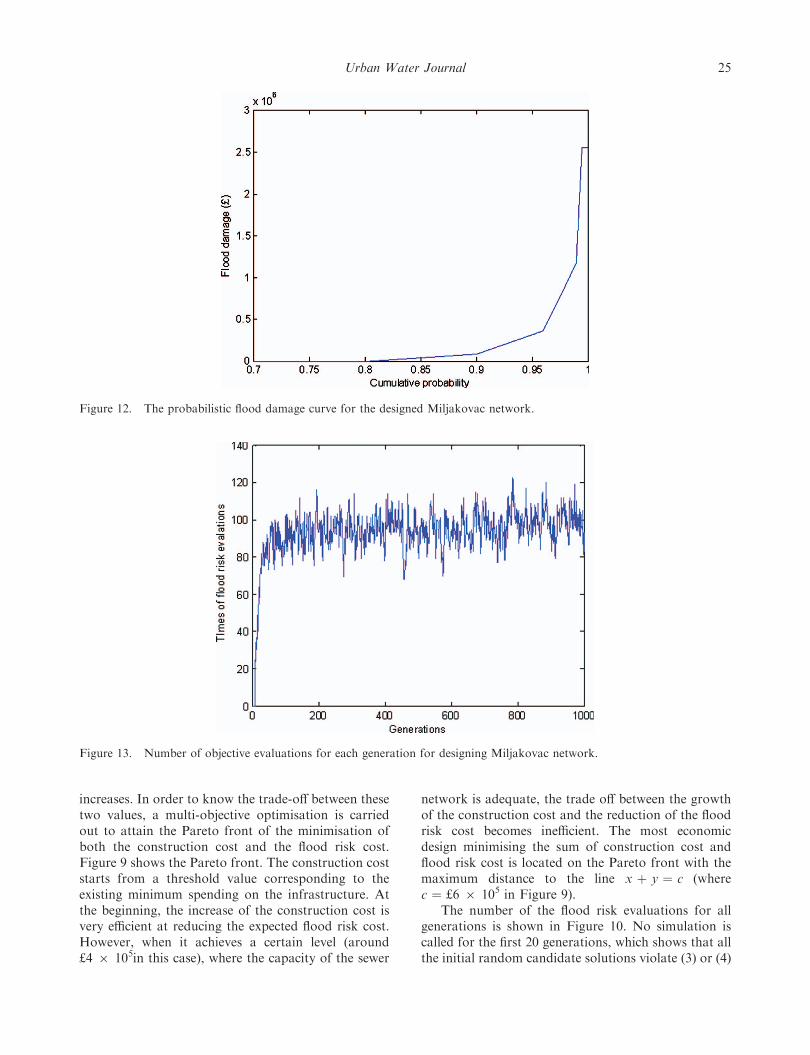
Figure 12. The probabilistic flood damage curve for the designed Miljakovac network.
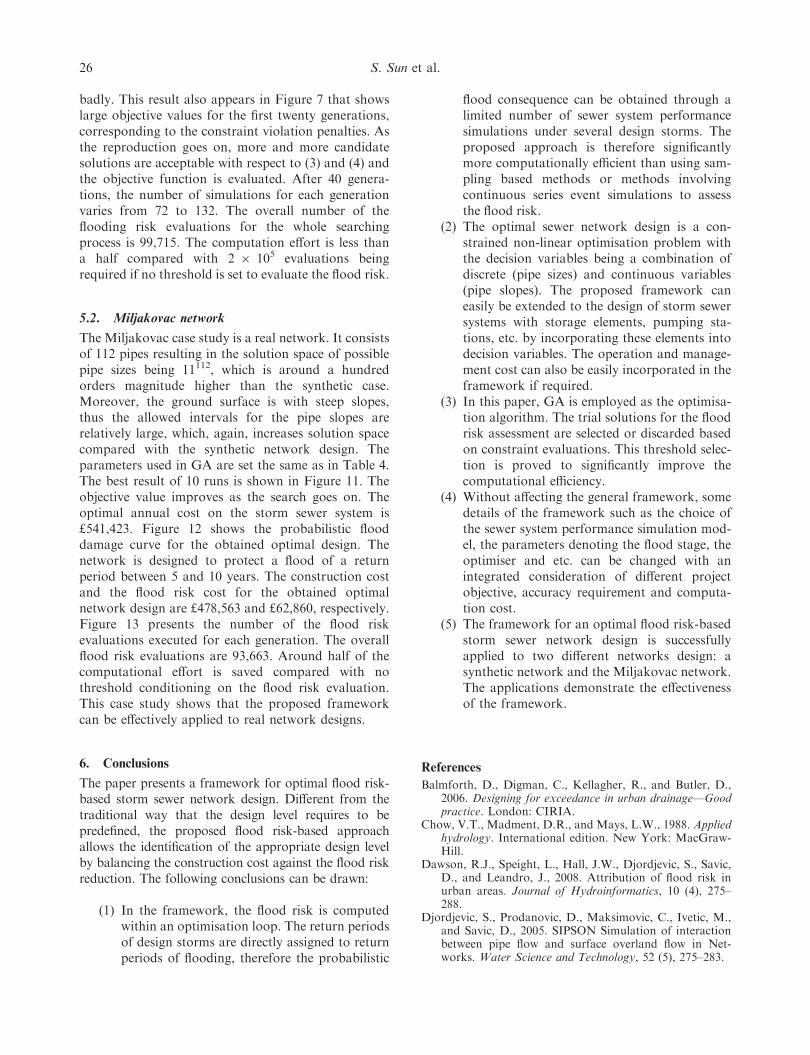
Figure 13. Number of objective evaluations for each generation for designing Miljakovac network.
Urban Water Journal 25
badly. This result also appears in Figure 7 that showslarge objective values for the first twenty generations,corresponding to the constraint violation penalties. Asthe reproduction goes on, more and more candidatesolutions are acceptable with respect to (3) and (4) andthe objective function is evaluated. After 40 genera-tions, the number of simulations for each generationvaries from 72 to 132. The overall number of theflooding risk evaluations for the whole searchingprocess is 99,715. The computation effort is less thana half compared with 2 6 105 evaluations beingrequired if no threshold is set to evaluate the flood risk.
5.2. Miljakovac network
The Miljakovac case study is a real network. It consistsof 112 pipes resulting in the solution space of possiblepipe sizes being 11112, which is around a hundredorders magnitude higher than the synthetic case.Moreover, the ground surface is with steep slopes,thus the allowed intervals for the pipe slopes arerelatively large, which, again, increases solution spacecompared with the synthetic network design. Theparameters used in GA are set the same as in Table 4.The best result of 10 runs is shown in Figure 11. Theobjective value improves as the search goes on. Theoptimal annual cost on the storm sewer system is£541,423. Figure 12 shows the probabilistic flooddamage curve for the obtained optimal design. Thenetwork is designed to protect a flood of a returnperiod between 5 and 10 years. The construction costand the flood risk cost for the obtained optimalnetwork design are £478,563 and £62,860, respectively.Figure 13 presents the number of the flood riskevaluations executed for each generation. The overallflood risk evaluations are 93,663. Around half of thecomputational effort is saved compared with nothreshold conditioning on the flood risk evaluation.This case study shows that the proposed frameworkcan be effectively applied to real network designs.
6. Conclusions
The paper presents a framework for optimal flood risk-based storm sewer network design. Different from thetraditional way that the design level requires to bepredefined, the proposed flood risk-based approachallows the identification of the appropriate design levelby balancing the construction cost against the flood riskreduction. The following conclusions can be drawn:
(1) In the framework, the flood risk is computedwithin an optimisation loop. The return periodsof design storms are directly assigned to returnperiods of flooding, therefore the probabilistic
flood consequence can be obtained through alimited number of sewer system performancesimulations under several design storms. Theproposed approach is therefore significantlymore computationally efficient than using sam-pling based methods or methods involvingcontinuous series event simulations to assessthe flood risk.
(2) The optimal sewer network design is a con-strained non-linear optimisation problem withthe decision variables being a combination ofdiscrete (pipe sizes) and continuous variables(pipe slopes). The proposed framework caneasily be extended to the design of storm sewersystems with storage elements, pumping sta-tions, etc. by incorporating these elements intodecision variables. The operation and manage-ment cost can also be easily incorporated in theframework if required.
(3) In this paper, GA is employed as the optimisa-tion algorithm. The trial solutions for the floodrisk assessment are selected or discarded basedon constraint evaluations. This threshold selec-tion is proved to significantly improve thecomputational efficiency.
(4) Without affecting the general framework, somedetails of the framework such as the choice ofthe sewer system performance simulation mod-el, the parameters denoting the flood stage, theoptimiser and etc. can be changed with anintegrated consideration of different projectobjective, accuracy requirement and computa-tion cost.
(5) The framework for an optimal flood risk-basedstorm sewer network design is successfullyapplied to two different networks design: asynthetic network and the Miljakovac network.The applications demonstrate the effectivenessof the framework.
References
Balmforth, D., Digman, C., Kellagher, R., and Butler, D.,2006. Designing for exceedance in urban drainage—Goodpractice. London: CIRIA.
Chow, V.T., Madment, D.R., and Mays, L.W., 1988. Appliedhydrology. International edition. New York: MacGraw-Hill.
Dawson, R.J., Speight, L., Hall, J.W., Djordjevic, S., Savic,D., and Leandro, J., 2008. Attribution of flood risk inurban areas. Journal of Hydroinformatics, 10 (4), 275–288.
Djordjevic, S., Prodanovic, D., Maksimovic, C., Ivetic, M.,and Savic, D., 2005. SIPSON Simulation of interactionbetween pipe flow and surface overland flow in Net-works. Water Science and Technology, 52 (5), 275–283.
26 S. Sun et al.
Elimam, A.A., Charalambous, C., and Ghobrial, F.H., 1989.Optimum design of large sewer networks. Journal ofEnvironmental Engineering, 115 (6), 1171–1190.
Freeze, R.A., Massmann, J., Smith, L., Sperling, T., andJames, B., 1990. Hydrogeological decision analysis. 1. Aframework. Ground Water, 28 (5), S738–766.
Goldberg, D.E., 1989. Genetic algorithms in search, optimiza-tion and machine learning. Boston, MA: Kluwer Aca-demic Publishers.
Goodman, A.S., 1984. Principles of water resources planning.Prentice Hall, NJ.
Guo, Y., Walters, G.A., Khu, S.T., and Keedwell, E.C.,2007. A novel cellular automata based approach to stormsewer design. Engineering Optimization, 39 (3), 345–364.
Heaney, J.P., Sample, D., and Wright, L., 2002. Costs ofurban stormwater control. Water supply and waterresources division national risk management researchlaboratory edition, NJ 08837.
Holland, J.H., 1975. Adaptation in natural and artificialsystems. USA: The University of Michigan Press.
Izquierdo, H., Montalvo, I., Perez, R., and Fuertes, V.S.,2008. Design optimization of wastewater collectionnetworks by PSO. Computer and Mathematics withApplications, 56 (3), 777–784.
Jonkman, S.N., Brinkhuis-Jak, M., and Mok, M., 2004. Costbenefit analysis and flood damage mitigation in theNetherlands. Heron, 49 (1), 95–111.
Kapelan, Z., Savic, D.A., Walters, G.A., and Babayan, A.V.,2006. Risk- and robustness-based solutions to a multi-objective water distribution system rehabilitation pro-blem under uncertainty. Water Science and Technology,53 (1), 61–75.
Kellagher, R. and Sayers, P., 2009. SAM-system-basedanalysis and management of urban flood risks: A newprocedure for performance assessment of seweragesystems. HR Wallingford report SR700.
Korving, H., van Noortwijk, J.M., van Gelder, P.H.A.J.M.,and Parkhi, R.S., 2003. Coping with uncertainty in sewersystem rehabilitation. In: Bedford and van Gelder, eds.Safety and Reliability. Swets & Zeitlinger, 959–968.
Korving, H., Noortwijk, van J.M., Gelder, van P.H.A.J.M.,and Clemens, F.H.L.R., 2009. Risk-based design ofsewer system rehabilitation. Structure and InfrastructureEngineering, 5 (3), 215–227.
Kulkarni, V.S. and Khanna, P., 1985. Pumped wastewatercollection systems optimization. Journal of EnvironmentalEngineering, 111 (5), 589–601.
Lancaster, J.W., Preene, M., and Marshall, C.T., 2004.Development and flood risk- guidance for the construc-tion industry. CIRIA Funders Report CP/102, London:CIRIA.
Leandro, J., Chen, A., Djordjevic, S., and Savic, D.A., 2009.A comparison of 1D/1D and 1D/2D coupled hydraulicmodels for urban flood simulation. Journal of HydraulicEngineering, 135 (6), 495–504.
Liang, L.Y., Thompson, R.G., and Young, D.M., 2004.Optimising the design of sewer networks using geneticalgorighms and tabu search. Engineering. Constructionand Architectural Management, 11 (2), 101–112.
Lund, J.R., 2002. Floodplain planning with risk-basedoptimization. Journal of Water Resources Planning andManagement, 128 (3), 202–207.
Maharjan, M., Pathirana, A., Gersonius, B., and Vairava-moorthy, K., 2009. Staged cost optimization of urbanstorm drainage systems based on hydraulic performancein a changing environment. Hydrology and Earth SystemScience, 13, 481–489.
Mays, L.W. and Wenzel, H.G., 1976. Optimal design ofmulti-level branching sewer systems. Water ResourcesResearch, 12 (5), 913–917.
Morita, M., 2008. Flood risk analysis for determiningoptimal flood protection levels in urban river manage-ment. Journal of Flood Risk Management, 1 (3), 142–149.
Oliveri, E. and Santoro, M., 2000. Estimation of urbanstructural flood damages: The case study of Palermo.Urban Water Journal, 2 (3), 223–234.
Penning-Rowsell, E., Johnson, C., Tunstall, S., Tapsell, S.,Morris, J., Chatterton, J., and Green, C., 2005. Thebenefits of flood and coastal risk management: A handbookof assessment techniques. Middlesex University Press.
Rossman, L.A., 2008. Storm Water Management ModelUser’s Manual (version 5.0). U.S. Environment Protec-tion Agency, Cincinnati, USA.
Ryu, J. and Butler, D., 2008. Managing sewer flood Risk,11th International Conference on Urban Drainage.Edinburgh, UK.
Savic, D.A. and Walters, G.A., 1997. Genetic algorithms forleast cost design of water distribution networks. Journalof Water Resources Planning and Management, 123 (2),67–77.
Smith, D.I., 1994. Flood damage estimation – a review ofurban stage-damage curves and loss functions. WaterSA, 20 (3), 231–238.
Voortman, H.G., 2003. Risk-based design of large-scale flooddefence systems. The Netherlands: PrintPartners Ips-kamp BV.
Vrijling, K., Hengel, van, W., and Houben, R.J., 1995. Aframework for risk evaluation. Journal of HazardousMaterials, 43, 245–261.
WRC (Water Resources Council), 1983. Economic andEnvironmental Principles and Guidelines for Water andRelated Land Resources Implementation Studies. USA.
Yates, D.F., Templeman, A.B., and Boffey, T.B., 1984. Thecomputational complexity of the problem of determiningleast capital cost designs for water supply networks.Engineering Optimization, 7 (2), 142–155.
Yen, B.C., Cheng, S.-T., Jun, R.-I., Voorhees, M.L., Wenzel,Jr, H.G., and Mays, L.I., 1984. Illinois Least Cost SewerSystem Design Model. User’s Guide. Austin, TX.
Zecchin, A.C., Simpson, A.R., Maier, H.R., Leonard, M.,Roberts, A.J., and Berrisford, M.J., 2006. Application oftwo ant colony optimization algorithms to waterdistribution system optimization. Mathematical andComputer Modelling, 44 (5–6), 451–468.
Urban Water Journal 27

Copyright of Urban Water Journal is the property of Taylor & Francis Ltd and its content may not be copied or
emailed to multiple sites or posted to a listserv without the copyright holder's express written permission.
However, users may print, download, or email articles for individual use.

![Sewer Processes and Design - SKYSCRAPERS · 2018-09-02 · SANITARY SEWER SYSTEM [Foul Sewer] I. Storm Sewer System STORM SEWER is designed to drain excess rainfall and groundwater](https://img.pdfslide.net/doc/110x75/5e9b180035942256b30ec806/sewer-processes-and-design-skyscrapers-2018-09-02-sanitary-sewer-system-foul.jpg)