Embed Size (px)
Citation preview

A generic approach for detecting security anomalies in ISP infrastructures
Master thesis
January 2017
Jaap Mooij


A GENERIC APPROACH FOR DETECTING SECURITY ANOMALIES IN ISP INFRASTRUCTURES
JAAP MOOIJ 3 26-1-2017
Summary
In this study we address an important challenge for Internet Service Providers: detecting cyber
security anomalies in growing streams of heterogeneous data. Internet Service Providers (ISP’s) play
a pivotal role in managing the complexity behind “the Internet”. In a world of ever changing threats
to cyber security, they face the daunting responsibility to keep the Internet safe for themselves and
for their customers. Early detection of security breaches is an important building block towards
achieving this goal. During the past two decades ISP’s have implemented virus- and vulnerability-
scanning, intrusion- and DDoS-detection, log analysis and other measures: all different ways of
looking at the infrastructure and its behaviour to detect intrusions. Each new tool adds more
visibility, but also increases the burden on security staff to monitor, correlate, prioritize and follow
up on alarms. This is the reason that ISP’s, like other organizations, are embracing Security
Information and Event Management (SIEM); solutions that process security logs from different
sources in real time and generate correlated, prioritized alarms. Additional tooling is available to
support manual data analysis and forensics. This typical set-up with automated real time detection
and manual off-line analysis significantly improves overall security, but still has important
limitations. Current SIEM products are optimized for reliable detection of pre-configured, known
attack scenarios, but they are less effective for detecting new intrusion patterns. Manual analysis is
effective for following up on specific alarms or suspicions, but the volume of available data is so
large that only a small fraction of events can be examined.
This thesis demonstrates that applying statistical anomaly detection to complement existing
solutions can significantly improve detection of anomalies for ISP’s. This is achieved by
systematically processing data coming from various sources in the infrastructure, and triggering
alerts when an anomaly is suspected. In order to accomplish a functional system, our solution
introduces a new anomaly detection mechanism that is able to handle the nature of the available
data:
- Data comes from heterogeneous sources
- The volume of potentially relevant data is typically very large.
- The vast majority of events contain no evidence of security incidents
- Labelled data is scarce
Other requirements include scalability and the support of continuous, stream based processing. It
should be possible to continuously optimize the solution based on expert knowledge, incident
analysis, threat intelligence and user feedback.
A literature study has shown that existing approaches to security anomaly detection do not fully
meet these requirements. The scientific community has developed advanced data mining
algorithms, but has largely focused on labelled and/or small datasets. Existing commercial solutions
are typically built for a limited number of known attack scenario’s. More advanced solutions based
on deep learning are at the peak of the hype cycle, but no clear solutions have emerged yet and little
documentation is available. Fortunately, much can be learned from studying other disciplines.
Financial fraud detection based on deviation from ‘normal’ behaviour has been studied intensely, as
has the analysis of call detail records to detect phone related fraud.
To address the deficiencies in existing solutions, his thesis proposes a generic approach for
unsupervised, stream based anomaly detection. This is achieved by aggregating data from
heterogeneous sources into time/space points, where ‘space’ can be any relevant entity (e.g. a user
or a computer) and time is a chosen time interval (e.g. an hour or a day). The behaviour of an entity
during such an interval can be characterized by specific features, which can be collected in a ‘feature
vector’. By aggregating these feature vectors over multiple time/space points, the system can model

A GENERIC APPROACH FOR DETECTING SECURITY ANOMALIES IN ISP INFRASTRUCTURES
JAAP MOOIJ 4 26-1-2017
‘normal’ behaviour. The final step is to build a tuneable algorithm to detect anomalies in incoming
data by matching its feature vectors to the stored profiles. Profiles can either be built along the
spatial axis, where the behaviour of e.g. a computer is compared to that of other similar computers,
or along the temporal axis, where the behaviour of an entity is compared to its own behaviour in the
past. This study focuses on the second option.
A design approach is presented following a slightly adapted version of the CRISP-DM model to
describe the data mining process. A five-step flow model is proposed for the implementation of
historic profiling and anomaly detection system, and important design considerations are
highlighted.
The proposed model is validated in two ways: Firstly, a round of interviews has been conducted with
10 security experts within the ISP for which the author works. These experts have expressed their
belief in the validity of the basic approach, and have provided valuable feedback to improve the
model. Secondly, the model has been applied to a realistic dataset of over 1.6 billion records. The
Los Alamos comprehensive security data set captures 58 days of consecutive logging from different
log sources in the network of the Los Alamos National Laboratory, and offers a good approximation
of the data that will be encountered in ISPs. With the implemented model, several suspected
security anomalies in the data were identified.
After discussing the proposed model with domain experts and applying it to the Los Alamos dataset,
it can be concluded that it is a promising approach to complement existing tooling. The model
proved straightforward to implement, intuitively links high level overviews to specific details and
scales well. It is also flexible in the sense that there are many ways to gradually augment and
improve it as experience with the tooling and the data grows.

A GENERIC APPROACH FOR DETECTING SECURITY ANOMALIES IN ISP INFRASTRUCTURES
JAAP MOOIJ 5 26-1-2017
Table of content
Summary ................................................................................................................................................. 3
Table of content ...................................................................................................................................... 5
1 Introduction .................................................................................................................................... 7
1.1 Detecting Security Intrusions in ISP infrastructures ............................................................... 8
1.2 Moving towards automated alarm correlation and data lakes .............................................. 9
1.3 Ambition of this study ........................................................................................................... 10
1.4 Design approach and structure of this document ................................................................ 11
2 Related research ........................................................................................................................... 12
2.1 Anomaly detection ................................................................................................................ 12
2.2 Logfile analysis ...................................................................................................................... 13
2.3 Profiling ................................................................................................................................. 13
2.4 Commercial incident detection ............................................................................................. 14
3 Building a model for detecting anomalies in heterogeneous data ............................................... 15
3.1 The data mining process model ............................................................................................ 15
3.2 Business- and data-understanding ....................................................................................... 16
3.3 Data preparation: log collection ........................................................................................... 16
3.4 Modelling .............................................................................................................................. 17
3.5 Data priming.......................................................................................................................... 18
3.6 Buffer size ............................................................................................................................. 19
3.7 Feature vector construction ................................................................................................. 19
3.8 Profile maintenance .............................................................................................................. 20
3.9 Detecting anomalies ............................................................................................................. 21
4 Feedback from security experts .................................................................................................... 24
4.1 On the environment and business needs ............................................................................. 24
4.2 On the knowledge base and applicable knowledge ............................................................. 24
4.3 On the proposed model ........................................................................................................ 24
4.4 On the design choices ........................................................................................................... 25
5 Model verification with a real-life dataset.................................................................................... 26
5.1 The Los Alamos dataset ........................................................................................................ 26
5.2 Experimental setup ............................................................................................................... 27
5.3 Data understanding .............................................................................................................. 28
5.3.1 Authentication .............................................................................................................. 28
5.3.2 Process start and stop events ....................................................................................... 29
5.3.3 Netflow data ................................................................................................................. 30

A GENERIC APPROACH FOR DETECTING SECURITY ANOMALIES IN ISP INFRASTRUCTURES
JAAP MOOIJ 6 26-1-2017
5.3.4 DNS events .................................................................................................................... 30
5.3.5 Red Team Events ........................................................................................................... 31
5.4 Interdependencies ................................................................................................................ 32
5.5 Design and implementation of the model ............................................................................ 33
5.5.1 Data priming .................................................................................................................. 33
5.6 Buffer .................................................................................................................................... 33
5.6.1 Feature vector construction.......................................................................................... 34
5.7 Profiling ................................................................................................................................. 36
5.8 Anomaly detection ................................................................................................................ 37
5.9 Results ................................................................................................................................... 38
5.9.1 User anomaly scores ..................................................................................................... 38
5.9.2 Computer anomaly scores ............................................................................................ 40
5.10 Computational impact .......................................................................................................... 41
5.11 Discussion of the results ....................................................................................................... 42
6 Conclusions and recommendations for further study .................................................................. 43
7 Bibliography .................................................................................................................................. 44
Data Priming ..................................................................................................................... 46
Feature vector definition .................................................................................................. 48
A1. Definition of user Feature vector .......................................................................................... 48
A2. Definition of computer feature vector ................................................................................. 50
Parameter distribution ..................................................................................................... 52
Computer feature vector distribution .............................................................................. 53

A GENERIC APPROACH FOR DETECTING SECURITY ANOMALIES IN ISP INFRASTRUCTURES
JAAP MOOIJ 7 26-1-2017
1 Introduction
In the span of three decades, “the Internet” has evolved from an obscure academic project into
something that has permeated our daily lives up to the capillaries. Still, not many people realize that
“the Internet” or “the Cloud” actually consists of thousands of individual infrastructures that have
organically evolved over time into complex, interconnected structures. Internet Service Providers
play a pivotal role in knitting everything together, since they supply much of the connectivity and run
the access networks that connect their customers to the rest of the world. These customers use
their connectivity for everything, from online flirting to running a business, and although the vast
majority of transactions are benign, incidents and criminal activities do happen. Online Law
enforcement is still very much in its infancy, and because much of the infrastructure is privately
owned, private organizations play a much larger role in policing the Internet than they do in keeping
our physical world safe.
This thesis will take the point of view of an Internet Service Provider (ISP). Care for the customer,
fear of reputation damage and legal obligations give ISP’s a strong incentive to protect their
networks against intruders. However, the industry is struggling to keep up with the increasingly
complex challenges it faces:
- Technological development cycles are accelerating. Even though security awareness has
grown, pressure to go to market may tempt equipment vendors and software suppliers into
taking security shortcuts. New developments such as network virtualization are largely
uncharted territory as far as security is concerned.
- At the same time, phasing out legacy systems proves challenging, leaving ISP’s with large
pieces of infrastructure that are virtually impossible to keep in line with the latest security
requirements.
- Many ISP’s are outsourcing large parts of their operations to Managed Service Providers
(MSP’s) across the world. Even though security is now a standard annex in MSP contracts,
verifying that all security policies are adhered to by all subcontractors is virtually impossible.
- Intrusion attempts are becoming more frequent and more professional, as organized crime
and state actors are scaling up their online operations. The Cyber Security Assessment
Netherlands 2016 observes that “Professional criminals are an ever greater danger to digital
security in the Netherlands” (National Cyber Security Center, 2016). Because ISP’s count
citizens, private organizations and governmental agencies amongst their customers, all
developments in the threat landscape ultimately affect them (see Figure 1).
Cyber security is a complex, multi-disciplinary subject ranging from law to psychology to economics.
This thesis will focus on technical security measures, and the processes needed to enable them.
Different models exist to structure these cyber security activities. One of the best known is the NIST
Security Framework (National Institute of Standards and Technology, 2014), which recognizes 5
functions in security:
Identify - Understand business context, identify key assets, threat- and risk-assessment etc.
Protect - Develop safeguards in the infrastructure and implement processes to support them.
Detect - Develop activities and tooling to detect cyber-security incidents.
Respond - Organize activities to take appropriate actions when a security incident is detected.
Recover - Prepare for quick recovery of normal operations after a cyber-security incident.

A GENERIC APPROACH FOR DETECTING SECURITY ANOMALIES IN ISP INFRASTRUCTURES
JAAP MOOIJ 8 26-1-2017
Each of these functions is a security discipline in itself, and a good security policy will need to
address all five. However, this study will focus on the third aspect: the “Detect” function.
1.1 Detecting Security Intrusions in ISP infrastructures
ISP infrastructures are large, complex and constantly changing. A medium sized ISP will have
hundreds of thousands of active elements in their data centres, plus millions of modems and set-top
boxes at their customers’ premises. All these elements are connected through fibres, routers,
switches and firewalls, with thousands of mutations every day. Even though security policies,
architecture guidelines and awareness programs are in place to keep intruders out (the ‘prevent’
function from the NIST model), successful attacks will still take place. ISPs have established Security
Operation Centres (SOCs) and Cyber Emergency Response Teams (CERTs) to coordinate response
and recovery.
To be effective, security breaches must be detected as early in the kill chain (Hutchins, Cloppert, &
Amin, 2011) as possible. Over the past decades, the industry has developed different technologies to
gather and analyse operational data to accomplish this, often supported by frequent intelligence
updates to keep systems aware of the latest attack patterns. A typical ISP will have several of these
solutions in place:
Figure 1 Cyber Security Assessment Netherlands (National Cyber Security Center, 2016)
Figure 2. The NIST Security Framework
A GENERIC APPROACH FOR DETECTING SECURITY ANOMALIES IN ISP INFRASTRUCTURES
JAAP MOOIJ 9 26-1-2017
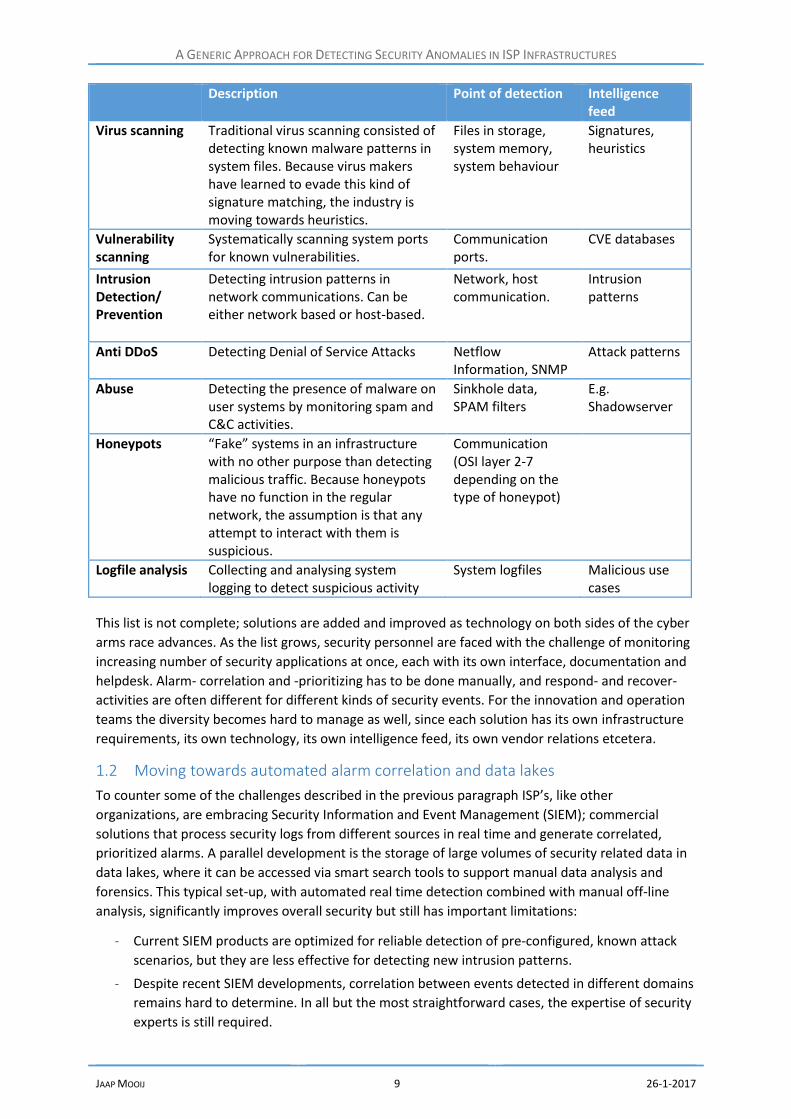
Description Point of detection Intelligence feed
Virus scanning
Traditional virus scanning consisted of detecting known malware patterns in system files. Because virus makers have learned to evade this kind of signature matching, the industry is moving towards heuristics.
Files in storage, system memory, system behaviour
Signatures, heuristics
Vulnerability scanning
Systematically scanning system ports for known vulnerabilities.
Communication ports.
CVE databases
Intrusion Detection/ Prevention
Detecting intrusion patterns in network communications. Can be either network based or host-based.
Network, host communication.
Intrusion patterns
Anti DDoS
Detecting Denial of Service Attacks Netflow Information, SNMP
Attack patterns
Abuse
Detecting the presence of malware on user systems by monitoring spam and C&C activities.
Sinkhole data, SPAM filters
E.g. Shadowserver
Honeypots
“Fake” systems in an infrastructure with no other purpose than detecting malicious traffic. Because honeypots have no function in the regular network, the assumption is that any attempt to interact with them is suspicious.
Communication (OSI layer 2-7 depending on the type of honeypot)
Logfile analysis
Collecting and analysing system logging to detect suspicious activity
System logfiles Malicious use cases
This list is not complete; solutions are added and improved as technology on both sides of the cyber
arms race advances. As the list grows, security personnel are faced with the challenge of monitoring
increasing number of security applications at once, each with its own interface, documentation and
helpdesk. Alarm- correlation and -prioritizing has to be done manually, and respond- and recover-
activities are often different for different kinds of security events. For the innovation and operation
teams the diversity becomes hard to manage as well, since each solution has its own infrastructure
requirements, its own technology, its own intelligence feed, its own vendor relations etcetera.
1.2 Moving towards automated alarm correlation and data lakes
To counter some of the challenges described in the previous paragraph ISP’s, like other
organizations, are embracing Security Information and Event Management (SIEM); commercial
solutions that process security logs from different sources in real time and generate correlated,
prioritized alarms. A parallel development is the storage of large volumes of security related data in
data lakes, where it can be accessed via smart search tools to support manual data analysis and
forensics. This typical set-up, with automated real time detection combined with manual off-line
analysis, significantly improves overall security but still has important limitations:
- Current SIEM products are optimized for reliable detection of pre-configured, known attack
scenarios, but they are less effective for detecting new intrusion patterns.
- Despite recent SIEM developments, correlation between events detected in different domains
remains hard to determine. In all but the most straightforward cases, the expertise of security
experts is still required.
A GENERIC APPROACH FOR DETECTING SECURITY ANOMALIES IN ISP INFRASTRUCTURES
JAAP MOOIJ 10 26-1-2017
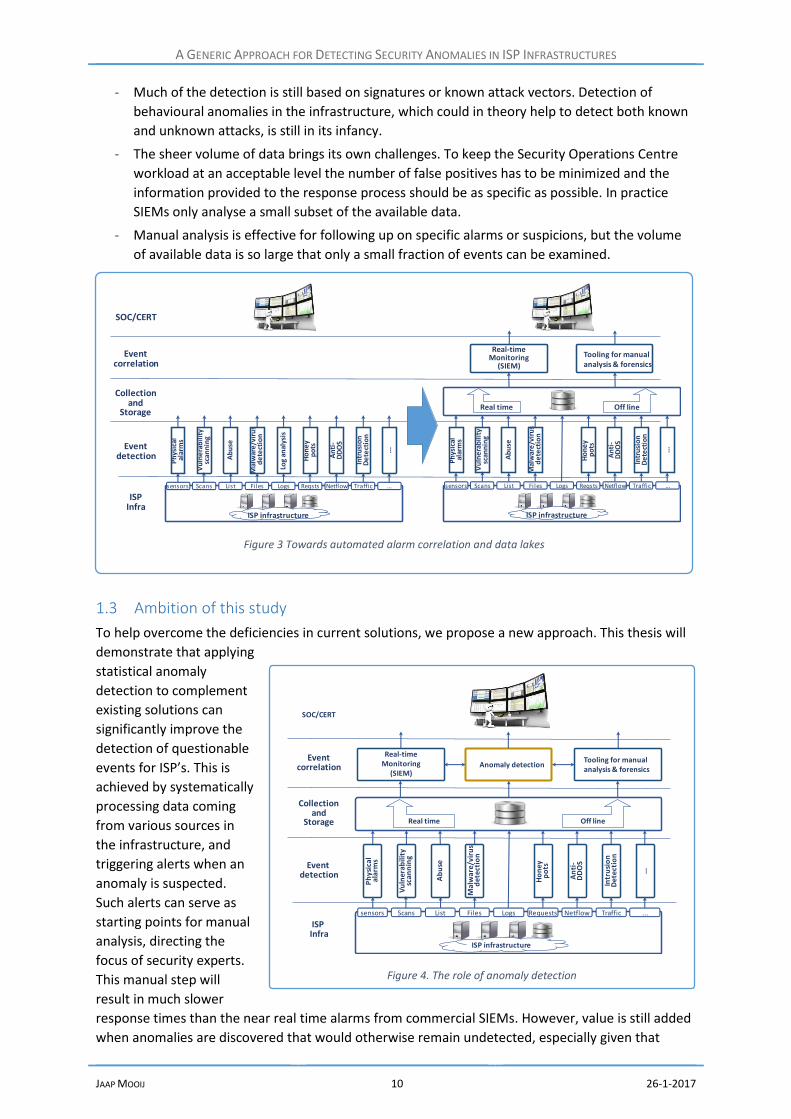
- Much of the detection is still based on signatures or known attack vectors. Detection of
behavioural anomalies in the infrastructure, which could in theory help to detect both known
and unknown attacks, is still in its infancy.
- The sheer volume of data brings its own challenges. To keep the Security Operations Centre
workload at an acceptable level the number of false positives has to be minimized and the
information provided to the response process should be as specific as possible. In practice
SIEMs only analyse a small subset of the available data.
- Manual analysis is effective for following up on specific alarms or suspicions, but the volume
of available data is so large that only a small fraction of events can be examined.
1.3 Ambition of this study
To help overcome the deficiencies in current solutions, we propose a new approach. This thesis will
demonstrate that applying
statistical anomaly
detection to complement
existing solutions can
significantly improve the
detection of questionable
events for ISP’s. This is
achieved by systematically
processing data coming
from various sources in
the infrastructure, and
triggering alerts when an
anomaly is suspected.
Such alerts can serve as
starting points for manual
analysis, directing the
focus of security experts.
This manual step will
result in much slower
response times than the near real time alarms from commercial SIEMs. However, value is still added
when anomalies are discovered that would otherwise remain undetected, especially given that
Figure 4. The role of anomaly detection
ISP Infra
Real-timeMonitoring
(SIEM)
Tooling for manual analysis & forensics
Eventcorrelation
SOC/CERT
Event detection
Collection and
Storage Off lineReal time
ISP infrastructure
Anomaly detection
Logs
Ma
lwar
e/v
iru
sd
ete
ctio
n
Files
Ab
use
List
Vu
lner
abili
tysc
an
nin
g
Scans
Ho
ney
p
ots
Requests Netflow
An
ti-
DD
OS
Intr
usi
on
Det
ect
ion
Traffic
...
...
Ph
ysi
cal
alar
ms
sensors
Figure 3 Towards automated alarm correlation and data lakes
ISP Infra
Real-timeMonitoring
(SIEM)
Tooling for manual analysis & forensics
Eventcorrelation
SOC/CERT
Event detection
Collection and
StorageOff lineReal time
ISP infrastructure
Logs
Mal
war
e/v
iru
sd
ete
ctio
n
Files
Ab
use
List
Vu
lne
rab
ilit
ysc
ann
ing
Scans
Ho
ne
y p
ots
Reqsts Netflow
An
ti-
DD
OS
Intr
usi
on
De
tect
ion
Traffic
...
...
Ph
ysic
al
alar
ms
sensors
ISP infrastructure
Logs
Mal
war
e/v
iru
sd
ete
ctio
n
Files
Ab
use
List
Vu
lne
rab
ilit
ysc
ann
ing
Scans
Ho
ne
y p
ots
Reqsts Netflow
An
ti-
DD
OS
Intr
usi
on
De
tect
ion
Traffic
...
...
Ph
ysic
al
alar
ms
sensors
Log
anal
ysis

A GENERIC APPROACH FOR DETECTING SECURITY ANOMALIES IN ISP INFRASTRUCTURES
JAAP MOOIJ 11 26-1-2017
commercial security firms report that the average time between a security breach and its discovery
is several months (Mandiant Consulting, 2016). By feeding the results from manual analysis back into
the system, its detection reliability can be improved continuously. Moreover, once specific alarms
become sufficiently reliable to warrant automatic response, they can be migrated to the real-time
monitoring environment.
In order to accomplish a functional system, our solution introduces a new anomaly detection
mechanism that is able to handle the nature of the available data:
- Data comes from heterogeneous sources
- The volume of potentially relevant data is typically very large.
- The vast majority of events contain no evidence of security incidents (assumption)
- Labelled data is scarce; if labels are available they are usually positive (e.g. when an alarm is
triggered)
Other requirements include scalability and the support of continuous, stream based processing. It
should be possible to continuously optimize the solution based on expert knowledge, incident
analysis, threat intelligence and user feedback.
1.4 Design approach and structure of this document
The remainder of this thesis will describe how a solution was designed and prototyped that meets
the requirements listed in the previous paragraph. The design process roughly followed the
structure as described by Hevner et all and depicted in Figure 5 (Hevner, March, Park, & Ram, 2004).
In the previous
paragraphs the ISP
environment and its
business needs have
been introduced. In
chapter 2 we will
evaluate the existing
knowledge base and
identify relevant
knowledge gaps.
Based on the business
needs and the
applicable knowledge,
we will propose a
model for detecting
anomalies in
heterogeneous data
sources in chapter 3.
In order to evaluate
this model, it has
been applied on a real-life dataset. This is the subject of chapter 5. A special role is played by domain
experts. Their knowledge has contributed to all elements in the design process. A summary of their
input has been place between chapters 3 and 5, because much of their feedback concerned the
proposed model and its application to the dataset. Finally, in chapter 6 we will present our
conclusions and give recommendations for further study.
Figure 5. Information Systems Research Framework (from Hevner et al.)

A GENERIC APPROACH FOR DETECTING SECURITY ANOMALIES IN ISP INFRASTRUCTURES
JAAP MOOIJ 12 26-1-2017
2 Related research
The detection of security incidents using data mining- or machine learning-techniques has been a
fruitful research area since the 1990’s. Excellent overviews exist of the progress that has been made,
in articles (e.g. (Buczak & Guven, 2016)), books (e.g. (Dua & Du, 2016), (Bhattacharyya & Kalita,
2014), (Barbará & Jajodia, 2002)) and university courses (e.g. (Stanford, 2014)).
A review, however, shows that most authors have focused on very specific types of attacks and/or
have used limited datasets, e.g. from a single source, or containing fully labelled data. This allowed
them to achieve accurate algorithms (e.g. UHAD (Hajamydeen, Udzir, Mahmod, & Abdul Ghania,
2016)), but makes their findings less relevant when addressing the ambition of this thesis: to find
anomalies in high volumes of unlabelled data from heterogeneous sources.
The rest of section will focus on specific topics that are key to the challenge at hand: anomaly
detection, logfile analysis and profiling. Also, a brief look will be taken at developments outside the
academic world.
2.1 Anomaly detection
Anomaly detection is an area of data mining that has received academic interests since the 1990’s,
and has been applied to a wide range of problems including fraud detection, system health
monitoring, image- and text processing and intrusion detection. Techniques can be grouped into
several categories: Classification based approaches define “normal” based on available training data
and label new points that do not fit this description as anomalous. Nearest neighbour algorithms
calculate the multi-dimensional distance between data points, and assume that points that lie far
from other points are anomalies. Clustering based techniques identify clusters in the data. Data
points outside clusters are considered anomalies. Finally, statistical analyses identify anomalies by
determining low probability regions in a stochastic model. Overviews of anomaly detection
techniques can be found in (Chandola, Banerjee, & Kumar, September 2009), from which these
categories were taken and (Goldstein & Seiichi, A Comparative Evaluation of Unsupervised Anomaly
Detection Algorithms for Multivariate Data, 2016).
Portnoy et al. (Portnoy, Eskin, & Stolfo, 2001) recognize the fact that labelled data is expensive to
obtain, and that methods relying on it are likely to miss new forms of attack. Based on metrics
selected by domain experts, they use a clustering algorithm to form groups of data-points that have
a smaller Euclidian distance to each other than to other clusters. By assuming that ‘normal’ network
behaviour accounts for the vast majority of data, they reason that small clusters are likely to indicate
malicious activity. They used the KDD dataset to evaluate their algorithm. Interestingly, performance
was poor when applied to the normal dataset. This was caused by the fact that the KDD dataset is
specifically created for testing incident detection algorithms, and contains an unrealistically high
percentage of attack data. Once additional ‘normal’ points were added to the data, the algorithm
was able to detect a significant percentage of the attacks contained in the set. In 2016 a U.S. patent
was granted for a method expanding on this approach (U.S. Patentnr. US9306966 B2, 2016)
Wenjie et al. (Hu, Liao, & Vemuri, 2003) compare the performance of Support Vector Machines
(SVM), Robust SVM (RSVM) and k Nearest Neighbours (kNN) in detection of anomalies in noisy data.
Using the DARPA 1998 dataset (to which they added noise), they demonstrated that RVSM gives the
best over-all performance. Their method, however, requires labelled data for training.
It is instructive to draw parallels to financial fraud detection, which is another area for which
anomaly detection in imbalanced data has been widely studied. Data mining techniques such as
logistic regression, Support Vector Machines, Random Forest (Bhattacharyya, Jha, Tharakunnel, &
Westland, 2011) and Neural Networks (Brause, Langsdorf, & Hepp, 1999) have been applied to

A GENERIC APPROACH FOR DETECTING SECURITY ANOMALIES IN ISP INFRASTRUCTURES
JAAP MOOIJ 13 26-1-2017
detect anomalies in credit card data. Again, data volumes in these studies seem relatively limited.
Extensive overviews of research into financial fraud detection can be found in (Phua, Lee, Smith, &
Gayler, 2010) and (Ngai, Hu, Wong, Chen , & Sun, February 2011).
2.2 Logfile analysis
Logfiles are increasingly recognized as an important source of network- and security- incident
detection. Makanju et al cluster logs generated by specific nodes over time into “nodehours”. They
generate signatures of anomalies by asking experts to indicate when and where anomalous events
have occurred in historic data, and then mining the indicated nodehours for patterns that
characterize them. They show that they can detect similar anomalies by matching these signatures
to historic or real time (unlabelled) data (Makanju, Zincir-Heywood, & Milios, 2013).
In order to address the problem that very little labelled training data is available in real-life
situations, Wurzenberger et al. propose to actively create different kinds of security incidents in an
infrastructure and analyse how these incidents are reflected in the loggings of the systems involved.
Because such tests cannot be performed on live networks, they suggest how a realistic test
environment can be realized that sufficiently reflects the behaviour of the production networks
(Wurzenberger, Skopik, Settanni, & Scherrer, 2016).
2.3 Profiling
User profiling has been used in different disciplines to detect unwanted behaviour. One such
discipline is the telecommunication industry, where fraud relating to international telephony or
premium numbers has long been a major source of revenue loss. Wiens et al (Wiens, Wiens, &
Massoth, 2014) used unsupervised profiling of phone-usage based on VoIP Call Detail Records
(CDR’s) to detect fraudulent customers. Using a sliding window approach, they compare current
behaviour against historic evidence and calculate a ratio in order to measure change. Once this ratio
passes a certain threshold, fraud is suspected. To adjust for normal fluctuations (weekends, holidays,
business peaks) they use global parameters to scale the corresponding user parameters. In a similar
use case, Hilas et al. (Hilas, Mastorocostas, & Rekanos, 2015) apply K-means and agglomerative
clustering to a set of anonymized CDR’s using various measures of distance. Their data set is very
small, but results suggest that using correlation as a distance measure yields the best results.
Perhaps unsurprisingly, using more detailed user profiles also increases accuracy.
Of course, profiling has also been studied extensively in the context of cyber security. In most cases,
the parameters used to define user profiles are a combination of available system logging and
specifically calculated data (e.g. change over time) constructed by domain experts. Examples can be
found in (Lee & Stolfo, 1998), (Lee, Stolfo, & Mok, 1999) and (Phua, Alahakoon, & Lee, 2004 ).
Shavlik & Shavlik present a model to build profiles of individual Windows users (Shavlik & Shavlik,
2004). They start by recording hundreds of parameters per second for each user during a training
period (during which they assume no fraud takes place). Next, they derive which standard
distribution best fits each parameter for each user (normal, uniform, exponential or Erlang), which
enables them to estimate the likelihood that new measurements are in fact generated by that user.
To determine which parameters best characterize a user, they create a training set by adding
“abnormal” data taken from other users. Each parameter that helps to correctly detect this
abnormal behaviour gets a higher weight factor, while the weight of parameters that do not
attribute to detection is decreased. Despite this pruning, their model still ends up with long user
vectors.

A GENERIC APPROACH FOR DETECTING SECURITY ANOMALIES IN ISP INFRASTRUCTURES
JAAP MOOIJ 14 26-1-2017
2.4 Commercial incident detection
Needless to say, the detection of security
incidents is receiving significant interest
outside the academic community as well.
Many major vendors invest in Security
Information and Event Management
(SIEM) solutions that use large streams of
different kinds of logging to generate
security alarms. Figure 6 shows the often
cited 2016 Magic Quadrant, in which the
Gartner group assesses the merits of
different vendors. Global market size is
estimated at $1,73 billion in 2015
(Kavanagh, Rochford, & Bussa, 2016).
More infrastructure specific solutions
exist, e.g. Microsoft Advanced Threat
Analytics and Cisco Stealthwatch. Little is
known about the algorithms deployed in
these commercial solutions, but a brief
survey of patent filings gives snippets of
insight: Nokia received a patent for
building application profiles by
monitoring the interaction of applications
with their environment, but details on profile parameters and anomaly detection mechanism are not
given (US Patent No. US20080022404 A1, 2008). A patent granted to Derek Lin (EMC Corporation)
gives an interesting listing of meaningful metrics that can be monitored to detect security intrusions
(U.S. Patentnr. US9112895 B1, 2015). The author goes on to describe a method to link security
incidents likely to related into an attack chain by looking for shared attributes between events.
More recently, IBM reports that it is starting a pilot using its deep learning environment “Watson” to
discover security incidents in the networks of several pilot customers (IBM, 2016). Unfortunately,
few details are available at the time of writing.
Figure 6. The Gartner Magic Quadrant for Security Information and Event Management (SIEM)
IBMSplunkLogRhytm
HPEIntel Security
EMC (RSA)
AlienVault
Micro FocusTrustwave
SolarWinds
ManageEngineEventTracker
Fortinet(AccelOps)
BlackSTratus
Challengers Leaders
VisionariesNiche players
COMPLETENESS OF VISION
AB
ILIT
Y TO
EXE
CU
TE
As of August 2016

A GENERIC APPROACH FOR DETECTING SECURITY ANOMALIES IN ISP INFRASTRUCTURES
JAAP MOOIJ 15 26-1-2017
3 Building a model for detecting anomalies in heterogeneous data
Starting point for developing our model is the realization that the behaviour of almost any entity in a
network can be described by extracting metrics from available logfiles. As an example: the behaviour
of a user on a given day could be
described by features such as the
time he/she first logs on, the
programs she/he runs, the protocols
that are used, the number of other
users that are contacted etcetera.
These features can be described by
numerical parameters that each
describe an aspect of the user’s
behaviour. In this thesis, the set all
parameters for a specific user and
time interval is called a feature
vector.
Of course, there will be natural fluctuations in behaviour, and therefore in the values of the
parameters describing it. To model the range of “normal” behaviour, a series of feature vectors can
be combined to form a profile for a specific user. Now, if we want to determine whether any
observed behaviour is “normal”, we can compare the parameters describing it with the user’s
profile. This results in an anomaly score. The more a new measurement deviates from what is seen
in the profile, the higher the score.
The remainder of this chapter describes how this basic concept was developed into a practical
model.
3.1 The data mining process model
To develop and build a data mining solution that meets the requirements described in chapter 1.3,
the CRISP Data Mining process model (Wirth & Hipp, 2000) was used as a starting point. The Cross
Industry Standard Process for Data Mining was developed in the late 90’s by a consortium of
developers and users, with support from the European Committee, and is the most widely used data
Figure 7. A simple illustration of the terminology used in this thesis
• .....• .....• .....• .....• .....
Profile
Parameters
Featurevector
?Anomaly
score
• .....• .....• .....• .....• .....
Figure 8. The original CRISP - DM model (left) and the adapted version used in this thesis (right)
Data Understanding
Business Understanding
Data Preparation
Modelling
Evaluation
Data
Deployment
Data Understanding
Business Understanding
Data Preparation
Modelling
Deployment
Data
Evaluation

A GENERIC APPROACH FOR DETECTING SECURITY ANOMALIES IN ISP INFRASTRUCTURES
JAAP MOOIJ 16 26-1-2017
mining framework today (kdnuggets, 2014). However, the CRISP model is primarily aimed at one-off
data mining studies, with clear preparation-, development- and deployment-phases and an
evaluation at the end. Since the goal of this study is to develop a system that will run indefinitely,
with continuous improvement, a small adaptation is made to the original model: The “Deployment”
and “Evaluation” steps are interchanged This closes the circle (see Figure 8) and in the view of the
author makes it better suitable to serve as a framework for this study. Also, an arrow is added
between “Evaluation” and “Modelling” to indicate that there exists a second, shorter feedback loop
for day to day optimization. The following paragraphs will expand on each of the steps in the model.
3.2 Business- and data-understanding
The first step in any applied data mining development is understanding the business and its
requirements. These have already been discussed extensively in the introduction to this thesis.
Closely related to business understanding is understanding the data that is available to meet the
project objectives. Many different data sources are available in ISP infrastructures. This study will
focus on a source that is especially important for anomaly detection: Log messages.
Logs are short, generally text based, messages that can be generated by virtually all active elements
in an ISP infrastructure to record events or report on their status. As such, they form an invaluable
source of information for many ISP processes, including fault-, performance- and capacity-
management, audits, and also security monitoring. The size of the log-stream that is generated by an
ISP infrastructure depends on factors such as the number of active elements, their log configuration
and the completeness of the log collection infrastructure, but will easily reach many thousands of
messages per second. Some logs will be collected continuously, others will arrive in batches of
varying time intervals. The content and format of messages is highly system specific, and fields with
the same meaning may have different notations in different log formats.
It is important to realize that logging isn’t free: generating log messages consumes system resources,
as does collecting, storing and processing them. For most systems, logging can be set to different
levels. Configuration should be handled with caution: Setting a system to full debugging mode may
lower its performance to a point that its operational readiness is impacted. Designing a system for
log analysis therefore has to be approached end-to-end, in close cooperation between security
analysts, network operators and capacity planning. For security developers, it is good practice to first
make an inventory of the logging that is already in use for other business processes before
requesting additional data.
3.3 Data preparation: log collection
The availability of sufficiently relevant, accurate and complete data is an important pre-condition for
effective anomaly detection. For solutions based on log processing this begins by ensuring that all
systems are configured to generate the right logging. The gathering of the resulting log messages
from throughout the infrastructure requires a network of (typically local) log collectors. Additional
connectivity and tooling is needed if logs are to be stored and analysed centrally. Tools and
procedures have to be implemented to constantly monitor and manage the log collection process
once it is in production.
Log collection is a challenging topic in itself; one that has recently seen revived interest in both
industry- and research-communities with the rise of “Big data”. For this thesis log collection is out of
scope; it is simply assumed that a log collection infrastructure is in place and that the required data
is available.
A GENERIC APPROACH FOR DETECTING SECURITY ANOMALIES IN ISP INFRASTRUCTURES
JAAP MOOIJ 17 26-1-2017
3.4 Modelling
Processing all individual log messages to detect security anomalies has a high computational cost.
Most SIEM implementations therefore only process a fraction of the total volume of logging
available, with the risk of missing important indicators. As described in the introduction to this
chapter, this thesis proposes a method that enables ISP to process a much broader scope of logging
at a reasonable computational cost. This is achieved by clustering all messages that are collected
during a time interval around the entities they provide information on (see Figure 9). These entities
can be anything in the infrastructure whose behaviour (or change of behaviour) is relevant from a
security perspective. Obvious choices for the entity dimension are:
- Users (which can be both human beings or processes using user credentials). Deviant user
behaviour could indicate for instance stolen credentials or an insider attack.
- Systems (e.g. servers, pcs, routers), whose behaviour will change when they are compromised
by malware.
- Processes or applications, which may behave different when they are used in attacks.
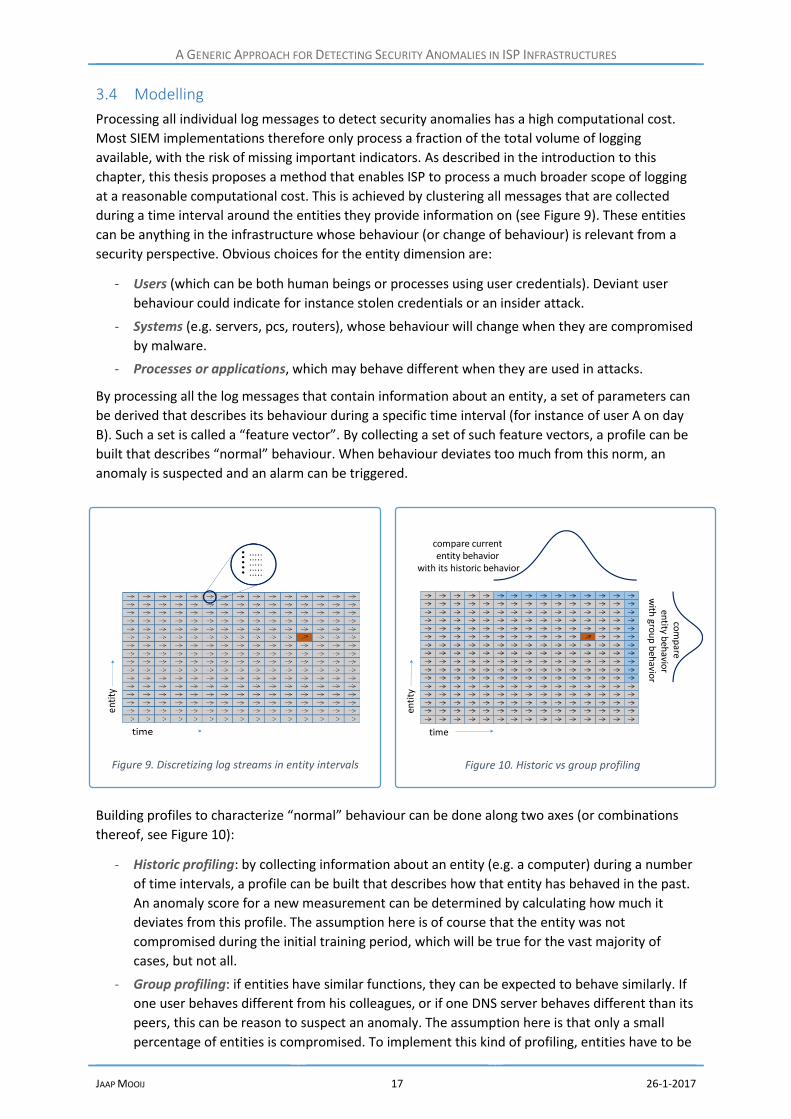
By processing all the log messages that contain information about an entity, a set of parameters can
be derived that describes its behaviour during a specific time interval (for instance of user A on day
B). Such a set is called a “feature vector”. By collecting a set of such feature vectors, a profile can be
built that describes “normal” behaviour. When behaviour deviates too much from this norm, an
anomaly is suspected and an alarm can be triggered.
Building profiles to characterize “normal” behaviour can be done along two axes (or combinations
thereof, see Figure 10):
- Historic profiling: by collecting information about an entity (e.g. a computer) during a number
of time intervals, a profile can be built that describes how that entity has behaved in the past.
An anomaly score for a new measurement can be determined by calculating how much it
deviates from this profile. The assumption here is of course that the entity was not
compromised during the initial training period, which will be true for the vast majority of
cases, but not all.
- Group profiling: if entities have similar functions, they can be expected to behave similarly. If
one user behaves different from his colleagues, or if one DNS server behaves different than its
peers, this can be reason to suspect an anomaly. The assumption here is that only a small
percentage of entities is compromised. To implement this kind of profiling, entities have to be
Figure 10. Historic vs group profiling
time
enti
ty
compare current entity behavior
with its historic behavior
com
pare
entity b
ehavio
rw
ith gro
up
beh
avior
Figure 9. Discretizing log streams in entity intervals
A GENERIC APPROACH FOR DETECTING SECURITY ANOMALIES IN ISP INFRASTRUCTURES
JAAP MOOIJ 18 26-1-2017
clustered in groups of which similar behaviour would be expected. This can be achieved by
domain knowledge (e.g. from an HR system that contains job titles of employees), or by data
clustering techniques.
Both approaches to profiling are valid and can be used simultaneously, or even combined into
historic profiling of groups. This thesis will focus on historic profiling, because the added complexity
of having to define relevant groups for group profiling does not contribute to the goal of validating
the basic model.
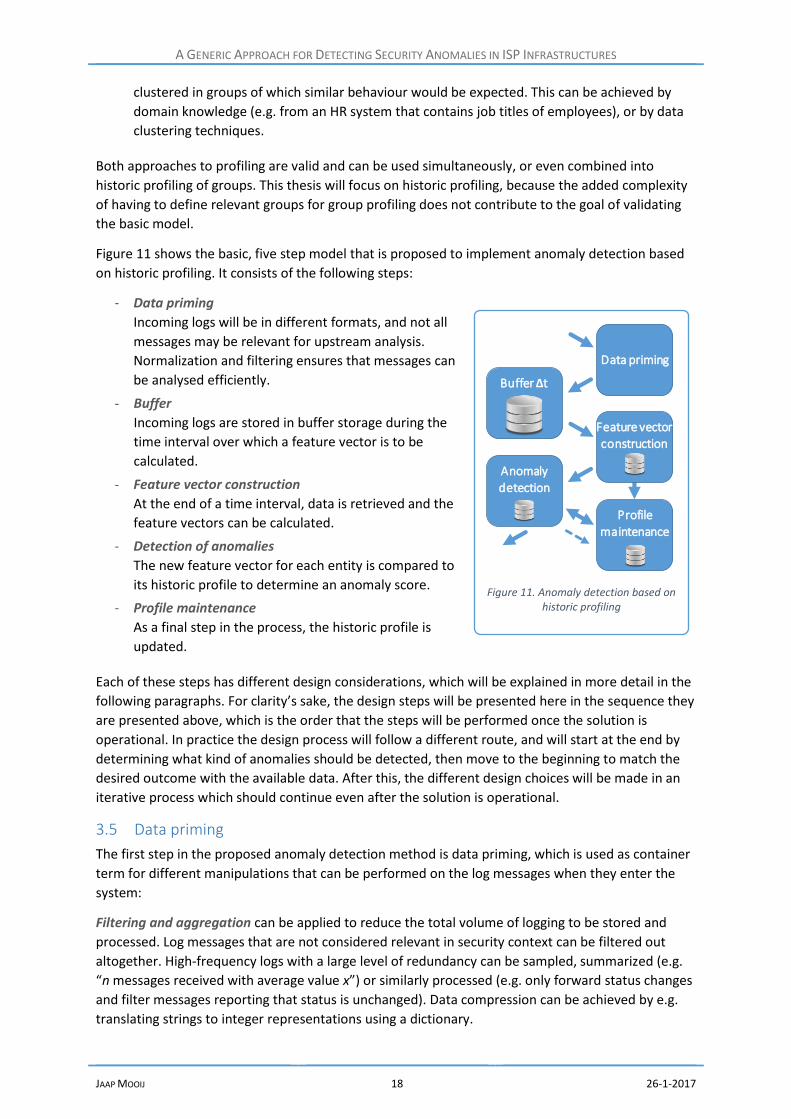
Figure 11 shows the basic, five step model that is proposed to implement anomaly detection based
on historic profiling. It consists of the following steps:
- Data priming
Incoming logs will be in different formats, and not all
messages may be relevant for upstream analysis.
Normalization and filtering ensures that messages can
be analysed efficiently.
- Buffer
Incoming logs are stored in buffer storage during the
time interval over which a feature vector is to be
calculated.
- Feature vector construction
At the end of a time interval, data is retrieved and the
feature vectors can be calculated.
- Detection of anomalies
The new feature vector for each entity is compared to
its historic profile to determine an anomaly score.
- Profile maintenance
As a final step in the process, the historic profile is
updated.
Each of these steps has different design considerations, which will be explained in more detail in the
following paragraphs. For clarity’s sake, the design steps will be presented here in the sequence they
are presented above, which is the order that the steps will be performed once the solution is
operational. In practice the design process will follow a different route, and will start at the end by
determining what kind of anomalies should be detected, then move to the beginning to match the
desired outcome with the available data. After this, the different design choices will be made in an
iterative process which should continue even after the solution is operational.
3.5 Data priming
The first step in the proposed anomaly detection method is data priming, which is used as container
term for different manipulations that can be performed on the log messages when they enter the
system:
Filtering and aggregation can be applied to reduce the total volume of logging to be stored and
processed. Log messages that are not considered relevant in security context can be filtered out
altogether. High-frequency logs with a large level of redundancy can be sampled, summarized (e.g.
“n messages received with average value x”) or similarly processed (e.g. only forward status changes
and filter messages reporting that status is unchanged). Data compression can be achieved by e.g.
translating strings to integer representations using a dictionary.
Figure 11. Anomaly detection based on historic profiling
Buffer Δt
Profile
maintenance
Anomaly
detection
Data priming
Feature vector
construction

A GENERIC APPROACH FOR DETECTING SECURITY ANOMALIES IN ISP INFRASTRUCTURES
JAAP MOOIJ 19 26-1-2017
Normalization is the arduous but essential task of translating different log dialects into a universal
syntax. Naming conventions must be aligned between different sources with the help of a master
data-dictionary. Cleaning up or discarding damaged or incomplete data is also part of this process.
Tagging can enrich the information in logs, for instance by adding a time- and location stamp
describing when and where each log message was collected.
Pre-processing can ease the computational peak at the end of each interval, when feature vectors
are determined, anomalies detected and profiles updated. As a rule, any required processing that
can be done on a single log should be done immediately when it is collected.
Priming will often be implemented in a combined decentralized/centralized fashion. As a rule, some
forms of tagging (e.g. time-stamps) should be implemented as close to the source as possible, while
others (e.g. parsing message content) should be performed centrally because they inflate the
volume of the logs and would require bigger collection bandwidth when performed decentralized.
Messages that are not used in any upstream process can be filtered out close to the source, while
messages that are used for other processes but not for security analysis will usually be filtered out in
the central log collection facility.
3.6 Buffer size
The choice of the time interval, over which events are collected to form a single feature vector, is an
important design step. As illustrated in Figure 12, choosing a too short interval (Δt3) will result in a
vector based on a small number of events, which
means that perfectly normal random fluctuations
may contribute heavily to the vector and interfere
with the anomaly detection mechanism. Choosing the
interval too long may mean that shorter anomalies or
trends remain invisible because they are averaged
out (Δt1). The optimal interval times may depend on
the technical domain and the entity that is profiled
and should, like the other design choices, be
established in cooperation with domain experts. If
necessary, different time intervals can be tried to experimentally discover which one yields the best
results. At the cost of making the system more complex, it would also be feasible to use different
intervals for different parameters or entities.
3.7 Feature vector construction
The definition of a vector that describes the behaviour of an entity (e.g. a computer) during a
specific time interval requires close cooperation between domain experts, security experts and the
engineers implementing the detection system. Not all envisioned information may be available and
not all analyses can be implemented. The assessment made for this thesis, together with domain
experts (see chapter 4), revealed that different kinds of parameters can be defined, with different
degrees of computational complexity:
Figure 12. Illustration of time interval selection
A GENERIC APPROACH FOR DETECTING SECURITY ANOMALIES IN ISP INFRASTRUCTURES
JAAP MOOIJ 20 26-1-2017
Parameter type Description
Direct internal parameters Straightforward parameters that can be derived directly from the available logging, e.g. the number of failed authentication events, the number of computers logged on to or the average byte count of a communication event during a specified interval.
Distinct element count Parameters that count the number of distinct elements encountered during a time interval (e.g. users, computers, processes)
External/global parameters Parameters recorded from outside, which may help to explain the behaviour of the entity observed. As an example, recording companywide internet usage as a reference may help to determine if an individual’s bandwidth usage is due to a peak in business activity or is something that needs to be examined.
Calculated parameters These can include simple ratio’s (e.g. the average number of events per interactive logon) or conditional events (e.g. the number of interactive logons using Kerberos authentication).
Stateful parameters Events that occurred previous to the timeframe observed may be relevant to define the entity profile for that timeframe. A simple example is the number of processes running at a specific time. This can be derived by keeping track of the processes started and stopped since the entity was first observed. A more complex example would be a parameter that records how many different computers have been logged on to by a user that he/she did not log on to during the past week.
Analysis based parameters In order to predict the spread of potential intrusions, results from previous analyses can be included, e.g. in a parameter that counts the number of entities a user has interacted with that have been labelled “suspect” during the previous n analysis rounds.
3.8 Profile maintenance
The previous paragraph described how a feature vector can describe the behaviour of an entity
during a specific time interval. By combining feature vectors over a series of time intervals during a
training period, a profile can be built that characterizes the “normal” behaviour of an entity over a
longer period of time. The assumption here is of course that the behaviour during the training period
is “normal”, i.e. contains no evidence of malicious activities. Chances are that this assumption is not
valid for all entities. This implies that historic anomaly detection is blind to malicious activities that
were already going on when the system was first activated. However, given that that average time
that an intrusion remains undetected is in the order of months, this effect will gradually fade out if
anomaly detection is continued.
A side effect of anomalies is that they also pollute the profile. “Echo’s” are a well-known effect in
network management, where anomaly alarms are sometimes triggered not only when an anomaly
occurs, but also when things return to normal.
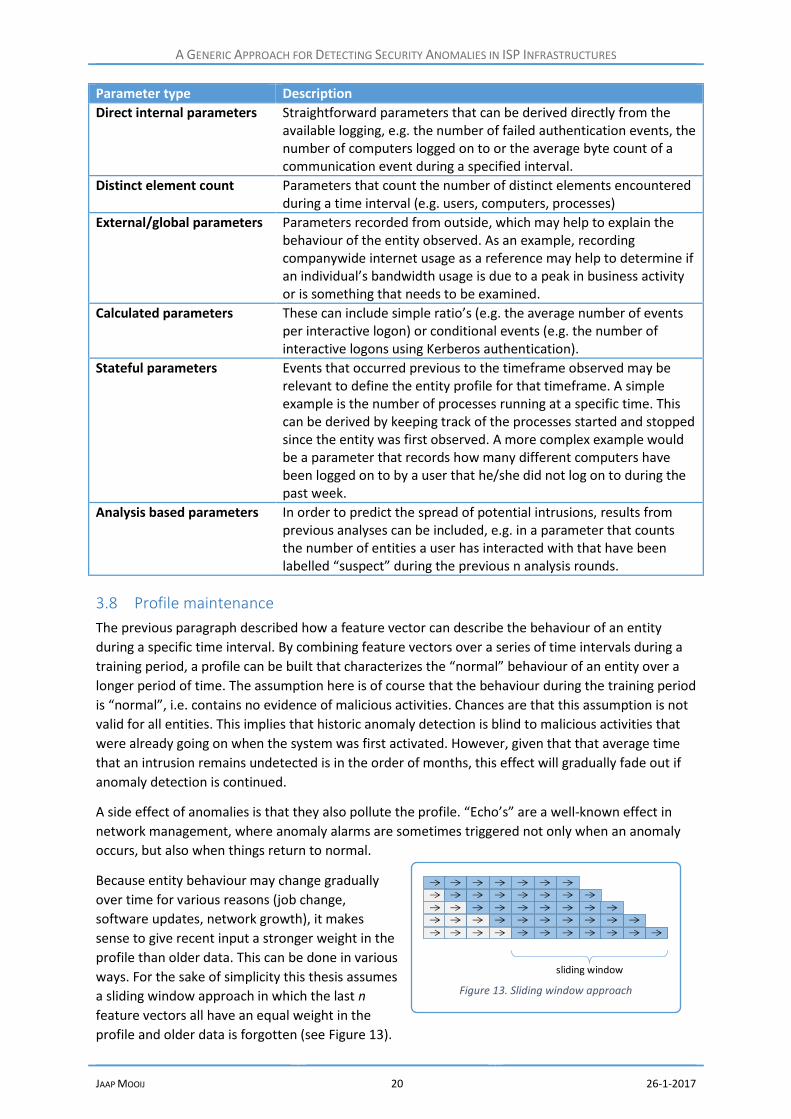
Because entity behaviour may change gradually
over time for various reasons (job change,
software updates, network growth), it makes
sense to give recent input a stronger weight in the
profile than older data. This can be done in various
ways. For the sake of simplicity this thesis assumes
a sliding window approach in which the last n
feature vectors all have an equal weight in the
profile and older data is forgotten (see Figure 13).
Figure 13. Sliding window approach
sliding window

A GENERIC APPROACH FOR DETECTING SECURITY ANOMALIES IN ISP INFRASTRUCTURES
JAAP MOOIJ 21 26-1-2017
3.9 Detecting anomalies
After the initial training period, a profile is available that describes the expected behaviour of an
entity over all the dimensions of the feature vector. Now anomaly scores can be computed by
comparing behaviour during the most recent interval to this profile. As explained in chapter 2, there
are many mathematically sound anomaly detection techniques available to make this comparison,
each with its own strengths and weaknesses. For the sake of conceptual and computational
simplicity, this study only considers basic statistical methods. Moreover, anomaly detection is
implemented in a one-dimension-at-the-time approach: First, an anomaly score is calculated for
every parameter in the feature vector. Second, an overall entity anomaly score is calculated by
combining the anomaly scores for each parameter. This considerably reduces computational load,
but has the disadvantage that complex anomalies might be missed, given that values for different
parameters might not be unlikely by themselves but unusual in combination. This disadvantage can
be partially mitigated in the design process: if (for instance in an in depth, off-line analysis of historic
data), anomalies are found that involve a combination of parameters, a new parameter can be
added to the feature vector that reflects this interaction. As a simple example: a student may enter a
building in The Hague, and log in to a physical terminal in Leiden. Logs registering these events
would not be anomalous in themselves, but if they occurred within seconds of each other it should
be cause for alarm. Such anomalies could be detected by defining a new parameter that specifically
registers this kind of mismatches.
The first objective is to measure the deviation from normal behaviour for a single parameter and
express it in a single number: the anomaly score. There are many ways to do this; the optimal way
depends on the nature of the data (amongst other things). Figure 14 shows three basic methods:
- When a specific statistical distribution is expected or assumed (e.g. Gaussian, Poisson,
binomial), its parameters can be estimated from the data in the profile. For any new point, the
likelihood that it belongs to the dataset can be determined. The definition of the anomaly
score will depend on the actual distribution. For instance, a Gaussian/normal distribution
would be modelled by its mean µ and the standard deviation σ, and the obvious measure for
deviation is the z-score, the number of standard deviations that a data point lies away from
the mean.
- When assuming a specific statistical distribution cannot be justified, the Inter Quartile Range
(IQR) can be used as a measure of deviation. In this method, one dimensional data instances
are sorted from lowest to highest. The data-points are then divided in four equal parts, or
quartiles, named Q1-Q4. The difference between the highest values in Q3 and Q1 is called the
interquartile range (IQR). This can be visualized in so called “box-and-whisker” plots (see
Figure 14). Different methods exist to define quartile boundaries. This thesis will use the
method described by Mendenhall and Sincich, in which the Q1 and Q3 boundaries lie at
Figure 14. Different methods for modelling profiles. From left to right: statistical distribution, inter quartile range, histogram
Q1
Q3

A GENERIC APPROACH FOR DETECTING SECURITY ANOMALIES IN ISP INFRASTRUCTURES
JAAP MOOIJ 22 26-1-2017
1
4(𝑛 + 1) and
3
4(𝑛 + 1) respectively1. This has the advantage that boundaries always lie at one
of the data-points and no interpolation is required (Mendenhall & Sincich, 1995). The anomaly
score is determined by the number of IQRs a data point x lies below Q1 or above Q3. Often a
threshold value t is applied, where t is usually chosen as 1.5.
- As an alternative, for instance when data is distributed along several clusters, the probability
distribution of data points in the profile can be modelled in histograms. Usually evenly spaced
bins are used, but with very uneven distributions dynamic bin width can be used to ensure
that each bin contains a minimum number of samples. A rule of thumb is to set the number of
bins at the square root of the number of samples. From this it follows that this method is less
suitable for smaller samples. The anomaly score for a new sample can be found by
determining its likelihood at the hand of the histogram. The anomaly score is the inverse of
this value (Goldstein & Dengel, 2012).
Just like the definition of the feature vector itself, deciding how to compare individual parameters
with their profiled past should be done with the help of domain experts. Modelling can be different
for different parameters: For some parameters exceeding a certain threshold may indicate a security
breach by itself, while for others only a deviation from historic behaviour is significant. For some
parameters any value outside the normal range is interesting, while for others only upward
deviations are relevant. Scores can be a real number or binary (e.g True when a threshold is
exceeded). Even though calculations may be different for each parameter, for comparison and
further processing it is desirable to define them in such a way that a similar score represents a
similar anomaly likelihood.
The over-all anomaly score is calculated from the one-dimensional parameter anomalies. This can
be done in any number of ways. It is important to accommodate some form of weighing of the
scores for the different parameters. This gives security experts the means to continuously optimize
the model, for instance by processing the results of manual analysis of a suspected anomaly: When
the system correctly indicates an anomaly, the parameters that correctly indicated this event can be
given a larger weight, while false positive may lead to depreciation of the responsible parameters.
Ultimately this may lead to the removal from the model of parameters that do not contribute to
accurate anomaly detection.
As a simple solution to obtain a weighed combination of anomaly scores in this thesis, the over-all
anomaly score will be determined by summarizing the products of the anomaly scores for each
parameter and their respective weights w (see Figure 15).
1 To be entirely accurate: in case the Q1 boundary falls exactly between two data points it should be rounded up. If this is the case with Q3 it should be rounded down

A GENERIC APPROACH FOR DETECTING SECURITY ANOMALIES IN ISP INFRASTRUCTURES
JAAP MOOIJ 23 26-1-2017
The next step after the over-all anomaly scores are determined depends on factors such as the
maturity of the system, the sensitivity of the affected assets and the resources that are available to
manually follow up on alarms. When the system still produces a lot of false positives it can make
sense to analyse the top n of anomaly scores every day, or to reserve a fixed amount of time for
analysis. When anomaly scores become more reliable they can be treated like regular security
alarms.
Figure 15. Calculating the over-all anomaly score
parameter 1 parameter 2 parameter .. parameter n
anomalyscore
A1 A2 A.. An
weight factor w1 w2 w.. wn
1

A GENERIC APPROACH FOR DETECTING SECURITY ANOMALIES IN ISP INFRASTRUCTURES
JAAP MOOIJ 24 26-1-2017
4 Feedback from security experts
Domain knowledge is generally considered to be essential for the implementation of any successful
security solution. In order to get feedback on the different design aspects covered in this thesis,
semi-structured interviews were held with 10 domain experts within the authors’ organization
(a large ISP in the Netherlands). Interviewees included 3 SOC seniors (including the SOC manager),
2 CERT members, 2 Innovation architect/designers, 1 RED team member and 2 operators that
maintain the existing detection infrastructure. This intensive interaction proved extremely
rewarding, and confirms the importance of talking to experts. Their feedback and suggestions are
reflected throughout this thesis. A brief summary is included below.
4.1 On the environment and business needs
All professionals are, by the nature of their jobs, acutely aware of the threat landscape and the
responsibilities they carry on their shoulders as an ISP and provider of critical infrastructure. There is
a general feeling that a large and/or sophisticated attack can strike at any moment. This leads to a
broad sense of urgency to further improve the existing detection and mitigation capabilities. The
observation that a diversity of detection applications becomes increasingly difficult to manage as the
number of solutions grows is, not coincidentally, widely recognized by the interviewed experts. The
SOC operators are confronted by this reality in their daily work: even though alarms are presented in
a single interface through a generic presentation layer, for follow up actions they still have to access
the underlying applications. Operations and innovation experience a comparable burden, as they are
required to maintain an increasing number of systems, interfaces and vendors. CERT experts
currently require the suspicion of an incident from an outside source as a starting point before they
can effectively start a manual analysis of log data.
4.2 On the knowledge base and applicable knowledge
There is an apparent gap between the academic and the business world: almost none of the
professionals interviewed regularly study academic publications. They do, however, keep up to date
by reading professional literature and online publications, and by frequent interaction with peers
and vendors. When asked for their professional assessment of where the detection industry is
heading, big data and machine learning are generally recognized as the important themes. As a
group, they have high expectations for SIEM-like solutions in the future, but admit that current
functionality is limited.
4.3 On the proposed model
The proposed method of aggregating individual log messages into feature vectors represents a
fundamentally new approach, because the current way of working is predominantly based on
parsing individual log messages. This noticeably required a shift in the way of thinking about
anomaly detection: The current manual approach is based on loosely defined decision trees and
does not always directly translate into an approach where many messages are aggregated into a
single feature vector. Once this mind-shift was made, there was a general enthusiasm for the
ambition to detect anomalies across a much wider scope than currently is possible. Even without
reliable anomaly detection, the possibility to get quick insight in essential aspects of infrastructure
behaviour is considered an important benefit.
A concern that was voiced is that it might not always be possible to distinguish between security
related anomalies and more generic fault and performance related incidents. This would imply the
need for a closer cooperation between network- and security-operations to follow up on alarms.

A GENERIC APPROACH FOR DETECTING SECURITY ANOMALIES IN ISP INFRASTRUCTURES
JAAP MOOIJ 25 26-1-2017
4.4 On the design choices
In the eyes of experts, both historic profiling and group profiling are useful. Group profiling is
viewed as specifically promising for groups of machines that have identical functions, and can thus
be expected to behave similarly (e.g. parallel DNS servers). Other systems are expected to behave
very differently depending on the task they are given (e.g. generic servers), and are therefore less
suitable for group profiling. The general opinion was the diversity in user-types is too big to cluster
them into groups at all, without generating a lot of false anomalies.
Users, systems and applications are mentioned most frequently as entities for which profiles can
be constructed. Of course, the latter categories are somewhat fluid, as network functionality is
shifting from hardware to software. Also, profiles could be generated for entities in different layers
of software stacks (e.g. network, host OS, hypervisor, OS, application).
It is clear that data preparation requires substantial domain expertise. When examining sample
data (see next chapter), single fields in log messages turned out to carry multiple meanings that
could be mapped to multiple parameters. Other, complex fields could be simplified into a limited
number of categories.
Concerning the discretization time interval over which vectors are collected: both day and hour
were suggested as an appropriate aggregation interval, with the caveat that the time of day would
have to be factored in somehow since user behaviour changes significantly during the day (e.g. office
hours vs. non-office hours). Another suggestion was to make the time configurable, so that
experiments could show which interval produces the best results.
Much of the discussion went into possible definitions of feature vectors and which anomalies should
lead to alarms. Details of this input are reflected both in the previous and the following chapter. At a
high level three groups of clusters were identified
- Absolute indicators: events that regardless of their context or history reflect strange
behaviour that should be investigated (e.g. source ports below 1024, users performing local
login on different locations at the same time)
- Context related indicators: certain events are normal in one context but not in another (e.g a
user process that starts when no user is logged in or a successful Kerberos logon that is not
followed by more Kerberos messages).
- Indicators that mark a change in behaviour: These are perhaps the most interesting, as they
are hard to capture using conventional methods.
Of course it depends on the way definitions are chosen, but for most (but not all) of the parameters
suggested, upward deviations are more interesting than downward deviations. Lower-than-historic
values can have many mundane reasons (e.g. an off-site day or sick leave), but legitimate scenarios
for a sharp rise are considerably less likely.
A GENERIC APPROACH FOR DETECTING SECURITY ANOMALIES IN ISP INFRASTRUCTURES
JAAP MOOIJ 26 26-1-2017
5 Model verification with a real-life dataset
An important part of the design process is the verification of the proposed solution, by implementing
it in code and testing it on a realistic dataset. Regrettably, no real ISP data could be used. This type of
data is extremely security-and privacy-sensitive, and can therefore only be processed within a
secured environment, and only for the purpose for which it was collected. The effort required for
normalizing and anonymizing a sufficiently large volume to test the proposed model falls beyond the
boundaries for this study. Fortunately, after a survey of publicly available databases, a good
alternative was found in the Los Alamos dataset.
5.1 The Los Alamos dataset
The Los Alamos National Laboratory is a national facility in the New Mexico desert, where
fundamental research is conducted relating to national security of the USA. It employs over 10.000
staff and nearly 1000 students (Wikipedia, 2016). The Los Alamos dataset was created by Alexander
Kent (Kent, 2015), and consists of logging from different sources collected at Los Alamos, during 58
consecutive days in 2015. The data was painstakingly anonymized and normalized. The result is that
an entity with a certain name in logging from one source carries the same name in another data set,
which makes correlation between events from different sources possible. Another feature that
makes the set suitable for the purpose of this study is its size: With over 1.6 billion events it provides
a good test to ascertain that the proposed algorithms scale effectively. Finally, the data was
collected from five different sources that give a realistic representation of what will be found in an
ISP infrastructure:
- Authentication is by far the largest subset. It contains over 1 billion authentication events
collected from individual windows based PC’s and Active Directory Servers. Events can be
initiated both by computers and by users, and can be both local (within one machine) or non-
local.
- The processes set contains start and stop events of Windows processes, also collected on
desktop PC’s and servers. The processes are anonymized: As an example, all “install.exe”
events are represented by “P16”, regardless of the location they were executed from.
- Network Flow events are recorded only for the first 29 days, due to a configuration error. Kent
describes flow data as potentially very valuable, but hard to obtain with sufficient quality in
real life conditions. Apparently, this is an aspect in which enterprise- and ISP-operations differ:
In ISP’s Netflow logging is closely monitored because it is essential for adequate DDoS
protection. However, Netflow data is often sampled because logging every individual event
has too much impact on operational performance.
- DNS data is collected from three central DNS servers in the network. To avoid performance
impact, logging was created using passive network taps. Unfortunately, two out of three taps
did not generate logging until the 28th day of the recording period due to invalid
configurations. Only DNS lookups inside the Los Alamos infrastructure are represented; there
are no records of queries to or from the Internet.
- The RedTeam data consists of time and target descriptions of ethical hacking events initiated
by the Los Alamos Red Team. They used “stolen” credentials to gain access to accounts; other
than that no information is available on the Red Teams’ exploits.
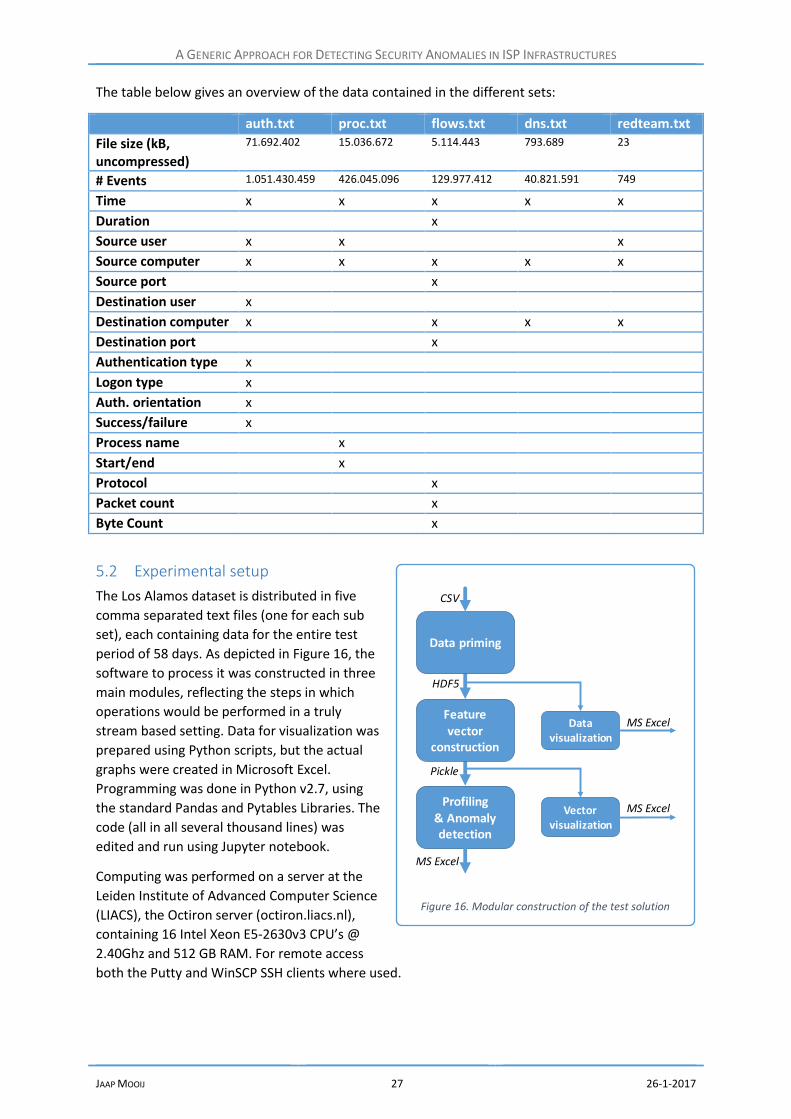
A GENERIC APPROACH FOR DETECTING SECURITY ANOMALIES IN ISP INFRASTRUCTURES
JAAP MOOIJ 27 26-1-2017
The table below gives an overview of the data contained in the different sets:
auth.txt proc.txt flows.txt dns.txt redteam.txt
File size (kB, uncompressed)
71.692.402 15.036.672 5.114.443 793.689 23
# Events 1.051.430.459 426.045.096 129.977.412 40.821.591 749
Time x x x x x
Duration x
Source user x x x
Source computer x x x x x
Source port x
Destination user x
Destination computer x x x x
Destination port x
Authentication type x
Logon type x
Auth. orientation x
Success/failure x
Process name x
Start/end x
Protocol x
Packet count x
Byte Count x
5.2 Experimental setup
The Los Alamos dataset is distributed in five
comma separated text files (one for each sub
set), each containing data for the entire test
period of 58 days. As depicted in Figure 16, the
software to process it was constructed in three
main modules, reflecting the steps in which
operations would be performed in a truly
stream based setting. Data for visualization was
prepared using Python scripts, but the actual
graphs were created in Microsoft Excel.
Programming was done in Python v2.7, using
the standard Pandas and Pytables Libraries. The
code (all in all several thousand lines) was
edited and run using Jupyter notebook.
Computing was performed on a server at the
Leiden Institute of Advanced Computer Science
(LIACS), the Octiron server (octiron.liacs.nl),
containing 16 Intel Xeon E5-2630v3 CPU’s @
2.40Ghz and 512 GB RAM. For remote access
both the Putty and WinSCP SSH clients where used.
Figure 16. Modular construction of the test solution
Profiling & Anomaly detection
Data visualization
MS Excel
Vector visualization
MS Excel
Data priming
CSV
HDF5
Feature vector
construction
Pickle
MS Excel

A GENERIC APPROACH FOR DETECTING SECURITY ANOMALIES IN ISP INFRASTRUCTURES
JAAP MOOIJ 28 26-1-2017
5.3 Data understanding
The remainder of this chapter will closely follow the steps described in chapter 3, and apply them to
the Los Alamos data. The first, important step is data understanding. One part of this is visualization,
another is reading the available documentation. Perhaps the most important element is talking to
domain experts. Although these steps have each been followed, is important to note here that the
data understanding that can be achieved with anonymized, external data, without access to the
responsible people, does not come close to what would be possible with in-company data.
Nevertheless, it proved an essential step toward the application of the model.
5.3.1 Authentication
The authentication data has been gathered during the whole collection period of 58 days. As can be
seen in Figure 17, the weekday/weekend cycle is clearly visible. However, the fluctuations are
relatively small (the y-axis has been cut). This could imply that roughly half the staff works through
the weekend, of that a significant part of the authentication events is unrelated to direct human
activity. The same can be concluded from the 24 hour pattern shown on the bottom right.
In Figure 18 two histograms are shown that illustrate that there is a wide spread in the activity of
users and computers. The bars depict the number of user/of computers per activity bin (left y-axis).
Note that the bin sizes on the x-axis are logarithmic. On the lower extreme, there are users and
computers that generate only a single event during the entire 58 collection period. At the other end
of the scale there are entities that appear in millions of logs. The curves depict the cumulative
Figure 17. Authentication events during the test period
10.000.000
12.000.000
14.000.000
16.000.000
18.000.000
20.000.000
22.000.000
24.000.000
26.000.000
1 3 5 7 9 11 13 15 17 19 21 23 25 27 29 31 33 35 37 39 41 43 45 47 49 51 53 55 57
Total auth events
0
10.000
20.000
1 7 13 19 25 31 37 43 49 55
Source users and computers
source users
sourcecomputers
0
20
40
60
0 2 4 6 8 10 12 14 16 18 20 22
24 hour pattern of auth events
Figure 18. Histogram of events over users and computers
0
50
100
150
200
250
300
350
400
0
1000
2000
3000
4000
5000
6000
7000
100 1k 10k 100k 1M 10M 100M
Distribution of events over users
Histogram Cumulative events (x1M)
0
100
200
300
400
500
600
700
0
2000
4000
6000
8000
10000
12000
100 1k 10k 100k 1M 10M
Distribution of events over computers
Histogram Cumulative events (x1M)

A GENERIC APPROACH FOR DETECTING SECURITY ANOMALIES IN ISP INFRASTRUCTURES
JAAP MOOIJ 29 26-1-2017
contribution of each group to the total number of events (right y-axis). The top 5% users generate
48% of all events. For computers this is 35%.
The authentication set contains some details about the authentication request. Figure 19 shows
which different types of authentication protocols and logons are present in the dataset. Logon and
logoff are roughly in equilibrium.
5.3.2 Process start and stop events
Figure 21 shows three time series for the process start- and stop events. It is immediately visible that
there are two volume peaks, on day 15 and 51. Closer inspection shows that these are exclusively
caused by computer accounts, and that the rise is spread over
many different accounts that as a group start more distinct
processes. This is an example where background information is
lacking: It is likely that two network related events took place (for
instance a monthly Windows update), but the author of the
dataset does not mention it in his accompanying text. Because he
uses an exponential scale the peaks are far less visible in his graph.
The logging shows a significant imbalance between the logged start-and stop events. Regrettably, it
appears that not all stop events are logged (see Figure 20). This makes it impossible to reliably keep
track of the processes that are running under each account.
Figure 21 Time series for the process start/stop data
0
2.000.000
4.000.000
6.000.000
8.000.000
10.000.000
12.000.000
14.000.000
16.000.000
18.000.000
1 3 5 7 9 11 13 15 17 19 21 23 25 27 29 31 33 35 37 39 41 43 45 47 49 51 53 55 57
Total proc events
0
5.000.000
10.000.000
15.000.000
1 6 11162126313641465156
Events by users and computers
computers
users
0
10.000
20.000
1 5 9 13 17 21 25 29 33 37 41 45 49 53 57
Processes initiated
Figure 19. Authentication- and logon type distribution in the authentication dataset
55,5%
0,1%
34,5%
4,7%5,2%
Authentication types
Unknown
Microsoft
Kerberos
NLTM
Negotiation
Logon types Network
Unknown
Service
Unlock
Interactive
Batch
NewCredentials
Other
Remote interactive
Cashed interactive
Figure 20 Start vs stop events
0 100 200 300 400
start
stop
start and stop events

A GENERIC APPROACH FOR DETECTING SECURITY ANOMALIES IN ISP INFRASTRUCTURES
JAAP MOOIJ 30 26-1-2017
5.3.3 Netflow data
As already indicated by the author of the dataset, netflow data was only recorded for the first 29
days. Judging from the graphs in Figure 22, effective collection stopped before even that. The bytes
per packet show interesting fluctuations, but given the questionable data collection, it is unsure
whether this represents real network behaviour or is an artefact created by the collection
mechanism.
5.3.4 DNS events
Although Kent indicated that two out of three DNS loggers only became operational after 27 days,
this does not fully explain how events developed over time, as shown in Figure 23 (unless the first
DNS carried about a fifth of the load of the other two and handled only traffic that was totally
weekday/weekend agnostic). After day 27, the data shows clear week- and day patterns, but only as
a fluctuation on a much larger, stable baseline. The figure on the top right shows that the number of
distinct source computers per day shows a regular pattern, while the number of computers resolved
fluctuates much more.
Combining this paragraph with the previous one, it is evident that there is no overlap between the
days that DNS and the netflow logging are fully operational.
Figure 22 Time series for the netflow dataset
0
2.000.000
4.000.000
6.000.000
8.000.000
10.000.000
12.000.000
1 3 5 7 9 11 13 15 17 19 21 23 25 27 29 31 33 35 37 39 41 43 45 47 49 51 53 55 57
Total flow events
0
50.000
100.000
1 3 5 7 9 11 13 15 17 19 21 23 25 27 29 31
Ports accessed
0
10
20
30
0
1
2
1 3 5 7 9 11 13 15 17 19 21 23 25 27 29 31
packets sent and bytes/packet
bytes sent
bytes/packet
(Billio
ns)
Figure 23. Time series for DNS events
0
200.000
400.000
600.000
800.000
1.000.000
1.200.000
1.400.000
1.600.000
1.800.000
1 3 5 7 9 11 13 15 17 19 21 23 25 27 29 31 33 35 37 39 41 43 45 47 49 51 53 55 57
Total DNS events
0
5.000
10.000
15.000
1 7 13 19 25 31 37 43 49 55
Source and resolved comp's
sourcecomputers
computersresolved
0,00,51,01,52,02,5
0 2 4 6 8 10 12 14 16 18 20 22
Events outside office hours

A GENERIC APPROACH FOR DETECTING SECURITY ANOMALIES IN ISP INFRASTRUCTURES
JAAP MOOIJ 31 26-1-2017
5.3.5 Red Team Events No regular pattern was expected in the Red Team data, and none was found. The team had two
peaks in activity, unfortunately in the beginning of the recording period. 749 events were initiated
from 98 different user accounts. Only four source computers were used, but 301 different
destination computers were targeted.
Figure 24. Time series of red team events
0
50
100
150
200
250
300
1 3 5 7 9 111315171921232527293133353739414345474951535557
Total red team events
events
users
computers
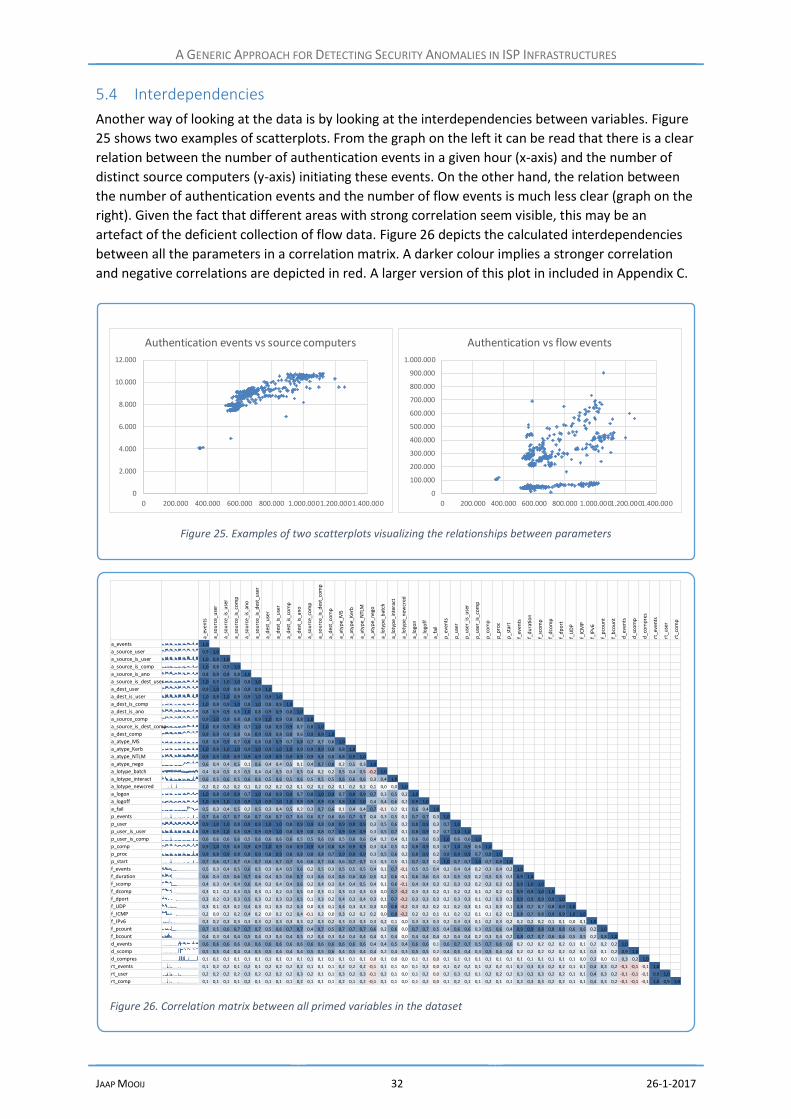
A GENERIC APPROACH FOR DETECTING SECURITY ANOMALIES IN ISP INFRASTRUCTURES
JAAP MOOIJ 32 26-1-2017
5.4 Interdependencies
Another way of looking at the data is by looking at the interdependencies between variables. Figure
25 shows two examples of scatterplots. From the graph on the left it can be read that there is a clear
relation between the number of authentication events in a given hour (x-axis) and the number of
distinct source computers (y-axis) initiating these events. On the other hand, the relation between
the number of authentication events and the number of flow events is much less clear (graph on the
right). Given the fact that different areas with strong correlation seem visible, this may be an
artefact of the deficient collection of flow data. Figure 26 depicts the calculated interdependencies
between all the parameters in a correlation matrix. A darker colour implies a stronger correlation
and negative correlations are depicted in red. A larger version of this plot in included in Appendix C.
Figure 25. Examples of two scatterplots visualizing the relationships between parameters
0
2.000
4.000
6.000
8.000
10.000
12.000
0 200.000 400.000 600.000 800.000 1.000.0001.200.0001.400.000
Authentication events vs source computers
0
100.000
200.000
300.000
400.000
500.000
600.000
700.000
800.000
900.000
1.000.000
0 200.000 400.000 600.000 800.000 1.000.0001.200.0001.400.000
Authentication vs flow events
Figure 26. Correlation matrix between all primed variables in the dataset
a_ev
ents
a_so
urc
e_u
ser
a_so
urc
e_is
_use
r
a_so
urc
e_is
_co
mp
a_so
urc
e_is
_an
o
a_so
urc
e_is
_des
t_u
ser
a_d
est_
use
r
a_d
est_
is_u
ser
a_d
est_
is_c
om
p
a_d
est_
is_a
no
a_so
urc
e_co
mp
a_so
urc
e_is
_des
t_co
mp
a_d
est_
com
p
a_at
ype_
MS
a_at
ype_
Ker
b
a_at
ype_
NTL
M
a_at
ype_
neg
o
a_lo
typ
e_b
atch
a_lo
typ
e_in
tera
ct
a_lo
typ
e_n
ewcr
ed
a_lo
gon
a_lo
goff
a_fa
il
p_e
ven
ts
p_u
ser
p_u
ser_
is_u
ser
p_u
ser_
is_c
om
p
p_c
om
p
p_p
roc
p_s
tart
f_ev
ents
f_d
ura
tio
n
f_sc
om
p
f_d
com
p
f_d
po
rt
f_U
DP
f_IC
MP
f_IP
v6
f_p
cou
nt
f_b
cou
nt
d_e
ven
ts
d_s
com
p
d_c
om
pre
s
rt_e
ven
ts
rt_u
ser
rt_c
om
p
a_events 1,0
a_source_user 0,9 1,0
a_source_is_user 1,0 0,9 1,0
a_source_is_comp 1,0 0,8 0,9 1,0
a_source_is_ano 0,8 0,9 0,9 0,8 1,0
a_source_is_dest_user 1,0 0,9 1,0 1,0 0,8 1,0
a_dest_user 0,9 1,0 0,9 0,8 0,9 0,9 1,0
a_dest_is_user 1,0 0,9 1,0 0,9 0,9 1,0 0,9 1,0
a_dest_is_comp 1,0 0,8 0,9 1,0 0,8 1,0 0,8 0,9 1,0
a_dest_is_ano 0,8 0,9 0,9 0,8 1,0 0,8 0,9 0,9 0,8 1,0
a_source_comp 0,9 1,0 0,9 0,8 0,8 0,9 1,0 0,9 0,8 0,8 1,0
a_source_is_dest_comp 1,0 0,8 0,9 0,9 0,7 1,0 0,8 0,9 0,9 0,7 0,8 1,0
a_dest_comp 0,9 0,9 0,8 0,8 0,6 0,9 0,9 0,8 0,8 0,6 0,9 0,9 1,0
a_atype_MS 0,8 0,8 0,9 0,7 0,8 0,8 0,8 0,9 0,7 0,8 0,7 0,7 0,6 1,0
a_atype_Kerb 1,0 0,9 1,0 1,0 0,9 1,0 0,9 1,0 1,0 0,9 0,9 0,9 0,8 0,8 1,0
a_atype_NTLM 0,9 0,9 0,9 0,9 0,9 0,9 0,9 0,9 0,9 0,9 0,9 0,8 0,8 0,8 0,9 1,0
a_atype_nego 0,6 0,4 0,4 0,5 0,1 0,6 0,4 0,4 0,5 0,1 0,4 0,7 0,8 0,2 0,5 0,3 1,0
a_lotype_batch 0,4 0,4 0,5 0,3 0,5 0,4 0,4 0,5 0,3 0,5 0,4 0,2 0,2 0,5 0,4 0,5 -0,2 1,0
a_lotype_interact 0,6 0,5 0,6 0,5 0,6 0,6 0,5 0,6 0,5 0,6 0,5 0,5 0,5 0,6 0,6 0,6 0,3 0,4 1,0
a_lotype_newcred 0,2 0,2 0,2 0,2 0,1 0,2 0,2 0,2 0,2 0,1 0,2 0,2 0,2 0,1 0,2 0,2 0,1 0,0 0,0 1,0
a_logon 1,0 0,8 0,9 0,9 0,7 1,0 0,8 0,9 0,9 0,7 0,8 1,0 0,9 0,7 0,9 0,9 0,7 0,3 0,5 0,2 1,0
a_logoff 1,0 0,9 1,0 1,0 0,9 1,0 0,9 1,0 1,0 0,9 0,9 0,9 0,8 0,8 1,0 1,0 0,4 0,4 0,6 0,2 0,9 1,0
a_fail 0,5 0,3 0,4 0,5 0,2 0,5 0,3 0,4 0,5 0,2 0,3 0,7 0,6 0,1 0,4 0,4 0,7 -0,1 0,2 0,1 0,6 0,4 1,0
p_events 0,7 0,6 0,7 0,7 0,6 0,7 0,6 0,7 0,7 0,6 0,6 0,7 0,6 0,6 0,7 0,7 0,4 0,3 0,5 0,1 0,7 0,7 0,3 1,0
p_user 0,9 1,0 1,0 0,8 0,9 0,9 1,0 1,0 0,8 0,9 0,9 0,8 0,8 0,9 0,9 0,9 0,3 0,5 0,6 0,2 0,8 0,9 0,3 0,7 1,0
p_user_is_user 0,9 0,9 1,0 0,8 0,9 0,9 0,9 1,0 0,8 0,9 0,8 0,8 0,7 0,9 0,9 0,9 0,3 0,5 0,7 0,1 0,8 0,9 0,2 0,7 1,0 1,0
p_user_is_comp 0,6 0,6 0,6 0,6 0,5 0,6 0,6 0,6 0,6 0,5 0,5 0,6 0,6 0,5 0,6 0,6 0,4 0,2 0,4 0,1 0,6 0,6 0,3 1,0 0,6 0,6 1,0
p_comp 0,9 1,0 0,9 0,8 0,9 0,9 1,0 0,9 0,8 0,9 0,9 0,8 0,8 0,8 0,9 0,9 0,3 0,4 0,5 0,2 0,8 0,9 0,3 0,7 1,0 0,9 0,6 1,0
p_proc 0,9 0,8 0,9 0,8 0,8 0,9 0,8 0,9 0,8 0,8 0,8 0,8 0,7 0,9 0,9 0,9 0,3 0,5 0,6 0,2 0,8 0,9 0,2 0,8 0,9 0,9 0,7 0,8 1,0
p_start 0,7 0,6 0,7 0,7 0,6 0,7 0,6 0,7 0,7 0,6 0,6 0,7 0,6 0,6 0,7 0,7 0,3 0,3 0,5 0,1 0,7 0,7 0,2 1,0 0,7 0,7 1,0 0,7 0,8 1,0
f_events 0,5 0,3 0,4 0,5 0,6 0,5 0,3 0,4 0,5 0,6 0,2 0,5 0,3 0,5 0,5 0,5 0,4 0,1 0,7 -0,1 0,5 0,5 0,4 0,2 0,4 0,4 0,2 0,3 0,4 0,2 1,0
f_duration 0,6 0,4 0,5 0,6 0,7 0,6 0,4 0,5 0,6 0,7 0,3 0,6 0,4 0,6 0,6 0,6 0,5 0,2 0,6 -0,1 0,6 0,6 0,4 0,3 0,5 0,5 0,2 0,5 0,5 0,3 0,9 1,0
f_scomp 0,4 0,3 0,4 0,4 0,6 0,4 0,3 0,4 0,4 0,6 0,2 0,4 0,3 0,4 0,4 0,5 0,4 0,1 0,6 -0,1 0,4 0,4 0,3 0,2 0,3 0,3 0,2 0,3 0,3 0,2 0,9 1,0 1,0
f_dcomp 0,3 0,1 0,2 0,3 0,5 0,3 0,1 0,2 0,3 0,5 0,0 0,3 0,1 0,3 0,3 0,3 0,3 0,0 0,7 -0,2 0,3 0,3 0,2 0,1 0,2 0,2 0,1 0,2 0,2 0,1 0,9 0,9 1,0 1,0
f_dport 0,3 0,2 0,3 0,3 0,5 0,3 0,2 0,3 0,3 0,5 0,1 0,3 0,2 0,4 0,3 0,4 0,3 0,1 0,7 -0,2 0,3 0,3 0,3 0,2 0,3 0,3 0,1 0,2 0,3 0,2 0,9 0,9 0,9 0,9 1,0
f_UDP 0,3 0,1 0,3 0,2 0,4 0,3 0,1 0,3 0,2 0,4 0,0 0,3 0,1 0,4 0,3 0,3 0,3 0,0 0,8 -0,2 0,3 0,2 0,2 0,1 0,2 0,3 0,1 0,1 0,3 0,1 0,8 0,7 0,7 0,8 0,9 1,0
f_ICMP 0,2 0,0 0,2 0,2 0,4 0,2 0,0 0,2 0,2 0,4 -0,1 0,2 0,0 0,3 0,2 0,2 0,2 0,0 0,8 -0,2 0,2 0,2 0,1 0,1 0,2 0,2 0,1 0,1 0,2 0,1 0,8 0,7 0,8 0,9 0,9 1,0 1,0
f_IPv6 0,3 0,2 0,3 0,3 0,3 0,3 0,2 0,3 0,3 0,3 0,2 0,3 0,2 0,3 0,3 0,3 0,3 0,2 0,1 0,0 0,3 0,3 0,3 0,2 0,3 0,3 0,1 0,2 0,3 0,2 0,2 0,2 0,2 0,1 0,1 0,0 0,1 1,0
f_pcount 0,7 0,5 0,6 0,7 0,7 0,7 0,5 0,6 0,7 0,7 0,4 0,7 0,5 0,7 0,7 0,7 0,6 0,2 0,6 0,0 0,7 0,7 0,5 0,4 0,6 0,6 0,3 0,5 0,6 0,4 0,9 0,9 0,8 0,8 0,8 0,6 0,6 0,2 1,0
f_bcount 0,4 0,3 0,4 0,4 0,5 0,4 0,3 0,4 0,4 0,5 0,2 0,4 0,3 0,4 0,4 0,4 0,4 0,1 0,4 0,0 0,4 0,4 0,4 0,2 0,4 0,4 0,2 0,3 0,4 0,2 0,8 0,7 0,7 0,6 0,6 0,5 0,5 0,2 0,8 1,0
d_events 0,6 0,6 0,6 0,6 0,6 0,6 0,6 0,6 0,6 0,6 0,6 0,6 0,6 0,6 0,6 0,6 0,4 0,4 0,5 0,4 0,6 0,6 0,1 0,6 0,7 0,7 0,5 0,7 0,6 0,6 0,2 0,2 0,2 0,2 0,2 0,1 0,1 0,2 0,2 0,2 1,0
d_scomp 0,5 0,5 0,4 0,4 0,4 0,5 0,5 0,4 0,4 0,4 0,5 0,5 0,6 0,4 0,5 0,4 0,4 0,2 0,4 0,3 0,5 0,5 0,2 0,4 0,5 0,4 0,3 0,5 0,4 0,4 0,2 0,2 0,2 0,2 0,2 0,2 0,1 0,3 0,1 0,2 0,9 1,0
d_compres 0,1 0,1 0,1 0,1 0,1 0,1 0,1 0,1 0,1 0,1 0,1 0,1 0,1 0,1 0,1 0,1 0,0 0,1 0,0 0,0 0,1 0,1 0,0 0,1 0,1 0,1 0,1 0,1 0,1 0,1 0,1 0,1 0,1 0,1 0,1 0,1 0,0 0,3 0,0 0,1 0,3 0,2 1,0
rt_events 0,1 0,2 0,2 0,1 0,2 0,1 0,2 0,2 0,2 0,2 0,1 0,1 0,1 0,2 0,2 0,2 -0,1 0,1 0,1 0,0 0,1 0,2 0,0 0,1 0,2 0,2 0,1 0,2 0,2 0,1 0,2 0,3 0,3 0,2 0,2 0,1 0,1 0,4 0,3 0,2 -0,1 -0,1 -0,1 1,0
rt_user 0,2 0,2 0,2 0,2 0,3 0,2 0,2 0,2 0,2 0,3 0,2 0,1 0,1 0,3 0,2 0,3 -0,1 0,2 0,1 0,0 0,1 0,2 0,0 0,2 0,3 0,2 0,1 0,2 0,2 0,2 0,3 0,3 0,3 0,2 0,2 0,1 0,1 0,4 0,3 0,2 -0,1 -0,1 -0,1 0,9 1,0
rt_comp 0,1 0,1 0,1 0,1 0,2 0,1 0,1 0,1 0,1 0,2 0,1 0,1 0,1 0,2 0,1 0,2 -0,1 0,1 0,1 0,0 0,1 0,2 0,0 0,1 0,2 0,1 0,1 0,2 0,1 0,1 0,2 0,3 0,3 0,2 0,2 0,1 0,1 0,4 0,3 0,2 -0,1 -0,1 -0,1 1,0 0,9 1,0
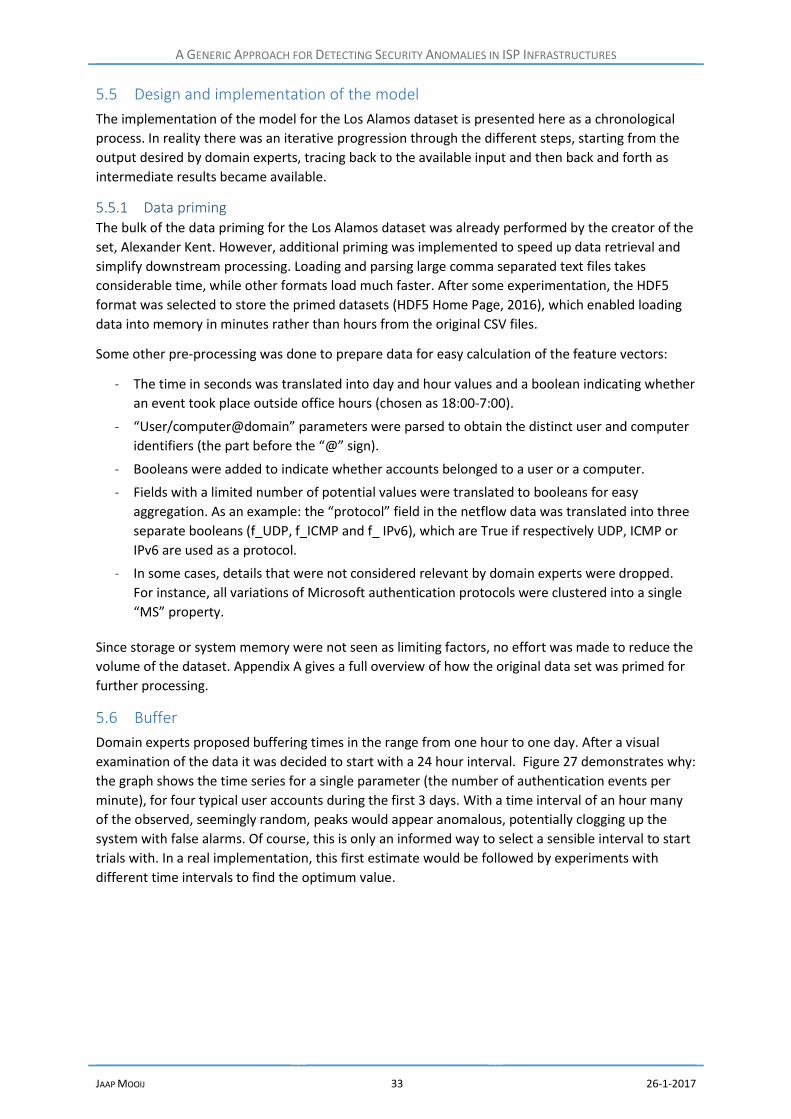
A GENERIC APPROACH FOR DETECTING SECURITY ANOMALIES IN ISP INFRASTRUCTURES
JAAP MOOIJ 33 26-1-2017
5.5 Design and implementation of the model
The implementation of the model for the Los Alamos dataset is presented here as a chronological
process. In reality there was an iterative progression through the different steps, starting from the
output desired by domain experts, tracing back to the available input and then back and forth as
intermediate results became available.
5.5.1 Data priming The bulk of the data priming for the Los Alamos dataset was already performed by the creator of the
set, Alexander Kent. However, additional priming was implemented to speed up data retrieval and
simplify downstream processing. Loading and parsing large comma separated text files takes
considerable time, while other formats load much faster. After some experimentation, the HDF5
format was selected to store the primed datasets (HDF5 Home Page, 2016), which enabled loading
data into memory in minutes rather than hours from the original CSV files.
Some other pre-processing was done to prepare data for easy calculation of the feature vectors:
- The time in seconds was translated into day and hour values and a boolean indicating whether
an event took place outside office hours (chosen as 18:00-7:00).
- “User/computer@domain” parameters were parsed to obtain the distinct user and computer
identifiers (the part before the “@” sign).
- Booleans were added to indicate whether accounts belonged to a user or a computer.
- Fields with a limited number of potential values were translated to booleans for easy
aggregation. As an example: the “protocol” field in the netflow data was translated into three
separate booleans (f_UDP, f_ICMP and f_ IPv6), which are True if respectively UDP, ICMP or
IPv6 are used as a protocol.
- In some cases, details that were not considered relevant by domain experts were dropped.
For instance, all variations of Microsoft authentication protocols were clustered into a single
“MS” property.
Since storage or system memory were not seen as limiting factors, no effort was made to reduce the
volume of the dataset. Appendix A gives a full overview of how the original data set was primed for
further processing.
5.6 Buffer
Domain experts proposed buffering times in the range from one hour to one day. After a visual
examination of the data it was decided to start with a 24 hour interval. Figure 27 demonstrates why:
the graph shows the time series for a single parameter (the number of authentication events per
minute), for four typical user accounts during the first 3 days. With a time interval of an hour many
of the observed, seemingly random, peaks would appear anomalous, potentially clogging up the
system with false alarms. Of course, this is only an informed way to select a sensible interval to start
trials with. In a real implementation, this first estimate would be followed by experiments with
different time intervals to find the optimum value.
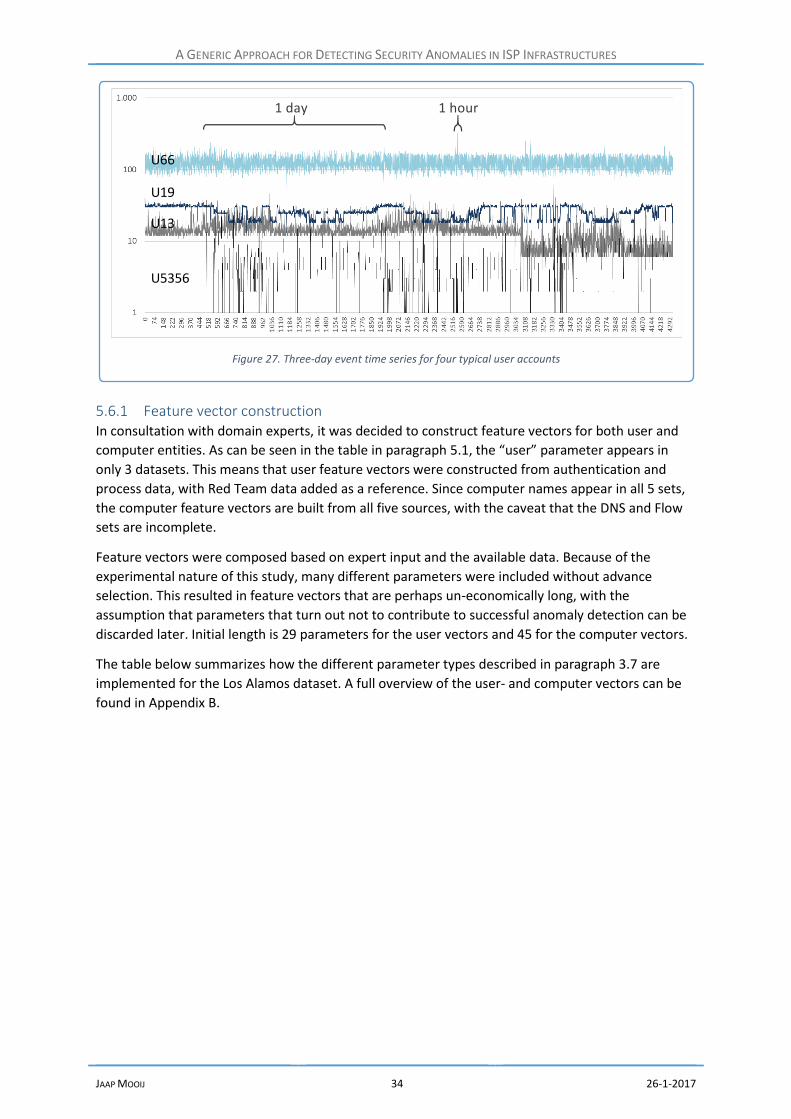
A GENERIC APPROACH FOR DETECTING SECURITY ANOMALIES IN ISP INFRASTRUCTURES
JAAP MOOIJ 34 26-1-2017
5.6.1 Feature vector construction In consultation with domain experts, it was decided to construct feature vectors for both user and
computer entities. As can be seen in the table in paragraph 5.1, the “user” parameter appears in
only 3 datasets. This means that user feature vectors were constructed from authentication and
process data, with Red Team data added as a reference. Since computer names appear in all 5 sets,
the computer feature vectors are built from all five sources, with the caveat that the DNS and Flow
sets are incomplete.
Feature vectors were composed based on expert input and the available data. Because of the
experimental nature of this study, many different parameters were included without advance
selection. This resulted in feature vectors that are perhaps un-economically long, with the
assumption that parameters that turn out not to contribute to successful anomaly detection can be
discarded later. Initial length is 29 parameters for the user vectors and 45 for the computer vectors.
The table below summarizes how the different parameter types described in paragraph 3.7 are
implemented for the Los Alamos dataset. A full overview of the user- and computer vectors can be
found in Appendix B.
Figure 27. Three-day event time series for four typical user accounts
U66
U19
U13
U5356
1 hour1 day

A GENERIC APPROACH FOR DETECTING SECURITY ANOMALIES IN ISP INFRASTRUCTURES
JAAP MOOIJ 35 26-1-2017
Parameter type Description
Direct internal parameters
Straightforward parameters were included for most of the elements in the primed data (e.g. the number of authentication events or the percentage of events using the NLTM protocol)
Distinct element count Domain experts consider distinct element count an important way to describe entity behaviour. Counts were included for:
- Users (both as source and as destination) - Computers (idem) - Port-numbers - Processes
Element count was implemented by building sets for each parameter for each user and establishing their length at the end of each interval.
External parameters No external parameters were included with the dataset.
Calculated parameters Several conditional parameters were included in the vectors, for instance:
- The number of events initiated with a low port number (<1024) - Percentage of authentication events where source- and
destination-domain are not the same - A conditional parameter that represents the number of distinct
user domains the user has unsuccessfully tried to access. - Another parameter that gives the number of computers that have
been communicated with without a DNS request
Stateful parameters Four stateful parameters were implemented: - The number of successful logons minus logoffs accumulated over
the logging period (with a minimum value of zero) - The number of processes started minus the processes stopped,
accumulated over the logging period (min=0) - The number of computers the user has accessed that have not
been accessed in the previous n days - The number of processes the user started for the first time in n
days These last two parameters were implemented by building a sliding window of sets for both parameters, with window size n=7 days.
Analysis based parameters
This is left for future work

A GENERIC APPROACH FOR DETECTING SECURITY ANOMALIES IN ISP INFRASTRUCTURES
JAAP MOOIJ 36 26-1-2017
5.7 Profile maintenance
To help understand how to detect anomalies based on the feature vectors in a profile, a visualization
was made of the distribution of parameter values over the full 58 days of the test period2. Figure 28
shows the end result for all parameters in the user feature vector. Six typical parameters are also
depicted as proper histograms for clearer reading. A similar graph for the computer vector can be
found in Appendix D. Several aspects stand out:
- Most parameters show quite regular, “nice”, distributions, but some (e.g. the number of
distinct source domains shown on the right) have irregular histograms that are difficult to
interpret without additional domain knowledge. Distributions for single users are likely to
show more irregularities than the accumulated versions presented here.
- Parameters that are defined as percentages tend to be cut off on the right because no values
over 100% are possible (e.g. the share of Kerberos authentication shown on the right or the
percentage of events were source and destination computer are different at the bottom).
- Even the regular distributions have no common shape.
These arguments led to the conclusion that describing profiles by mapping values to one (or a few)
standard statistical distributions appears unfeasible. The Python code for profile maintenance and
anomaly detection is prepared for the use of different statistical methods per parameter; however
only the interquartile range method was actually implemented.
In consultation with domain experts the training period was initially set to 14 days, which means that
the hinges of the Q1 and Q3 quartiles lie at position 4 and 11. As can be seen from the graphs in
paragraph 5.3, training 14 days before starting actual anomaly detection means that little use can be
2 To prevent the most active entities from dominating the outcome, distributions were first normalised per user/parameter and then added together to yield the final result. This required a two-pass approach: A first pass to determine the maximum value per user per parameter throughout the test period, and a second pass to calculate the normalized distributions.
Figure 28. Normalized distribution of user feature vectors
0
50000
100000
Normalized distribution of user feature vector parameters
uv_a_sd_events uv_a_no_oh uv_a_dd_events uv_a_sd_isnot_dd
uv_a_ddoms uv_a_ddoms_fail uv_a_sdoms uv_a_dcomps
uv_a_newdcomps uv_a_scomps uv_a_sc_isnot_dc uv_a_bat_lotype
uv_a_int_lotype uv_a_NC_lotype uv_a_MS_atype uv_a_Kerb_atype
uv_a_NLTM_atype uv_a_neg_atype uv_a_lognet uv_a_fails
uv_p_events uv_p_comps uv_p_newcomps uv_p_procs
uv_p_runprocs uv_p_newprocs
0
20000
40000
uv_a_dcomps
0
20000
40000
60000uv_a_Kerb_atype
0
50000
100000
uv_a_sdoms
0
10000
20000
uv_p_procs
0
50000
100000
uv_a_sc_isnot_dc
0
20000
40000
60000uv_a_newdcomps

A GENERIC APPROACH FOR DETECTING SECURITY ANOMALIES IN ISP INFRASTRUCTURES
JAAP MOOIJ 37 26-1-2017
made of the Netflow and Red Team data in the analysis. For this reason, analysis will also be
attempted with a shorter sliding window of 7 days, with hinges at positions 2 and 6.
5.8 Anomaly detection
Anomaly scores for the test set were calculated as described in paragraph 3.9, following this
structure (in pseudo code with user as the chosen entity):
for each day:
for each user with a complete profile:
for each parameter in the users feature vector:
determine parameter anomaly score
determine over-all anomaly score from parameter anomalies
Since not all users/computers are active during every day, not all training periods end on the same
day and the start of actual anomaly detection differs from entity to entity. No provisions were made
for entities with missing intervals after their first appearance: for days that no input was received all
vector values were set to zero.
The anomaly scores per day/entity/parameter were calculated by calculating the distance of the
current parameter value from Q3, and comparing this distance to the Inter Quartile Range (IQR, the
difference between Q3 and Q1). Because an analog anomaly score was preferred over a simple
binary outlier test, the score was calculated as a ratio minus a threshold value t:
𝑛𝑜𝑚𝑎𝑙𝑦 𝑠𝑐𝑜𝑟𝑒𝑑𝑎𝑦,𝑒 𝑡 𝑡𝑦,𝑝𝑎𝑟𝑎𝑚𝑒𝑡𝑒𝑟 = 𝑚𝑎𝑥 (𝐶𝑢𝑟𝑟𝑒𝑛𝑡 𝑣𝑎𝑙𝑢𝑒 − 𝑄3
𝑄3 − 𝑄1− 𝑡𝑝𝑎𝑟𝑎𝑚𝑒𝑡𝑒𝑟 , 0) (𝑄3 > 𝑄1)
In line with common practice the value of the threshold was initially set at 1.5 for all parameters. For
values below this point the anomaly score was set at zero. Only upward deviations were calculated.
A special measure had to be taken to account for divisions by zero. The first anomaly calculation
attempt returned a number of infinite values. Analysis showed that these were caused by
parameters that remained constant (often zero) for enough days for Q3 to become equal to Q1,
resulting in an inter-quartile range of zero. After some experimentation and analysis of data
samples, a new variable z was introduced to prevent these exceptions from muddying the overall
scores:
𝑛𝑜𝑚𝑎𝑙𝑦 𝑠𝑐𝑜𝑟𝑒𝑑𝑎𝑦,𝑒 𝑡 𝑡𝑦,𝑝𝑎𝑟𝑎𝑚𝑒𝑡𝑒𝑟 = 𝑚𝑎𝑥 ((𝐶𝑢𝑟𝑟𝑒𝑛𝑡 𝑣𝑎𝑙𝑢𝑒 − 𝑄3) · 𝑧𝑝𝑎𝑟𝑎𝑚𝑒𝑡𝑒𝑟 , 0) (𝑄3 = 𝑄1)
Total anomaly scores per day/entity were calculated by taking the sum of the products of the
parameter-anomaly scores and their weight factors w:
𝑛𝑜𝑚𝑎𝑙𝑦 𝑠𝑐𝑜𝑟𝑒𝑑𝑎𝑦,𝑒 𝑡 𝑡𝑦 = 𝑛𝑜𝑚𝑎𝑙𝑦 𝑠𝑐𝑜𝑟𝑒𝑑𝑎𝑦,𝑒 𝑡 𝑡𝑦,𝑝𝑎𝑟𝑎𝑚𝑒𝑡𝑒𝑟 ∙ 𝑝𝑎𝑟𝑎𝑚𝑒𝑡𝑒𝑟𝑝𝑎𝑟𝑎𝑚𝑒𝑡𝑒𝑟𝑠
The resulting model has three sets of variables for each parameter that can be tuned to optimize
model performance: the threshold t, weight factor w and parameter z that determines how steps
after a period of stability are scored.

A GENERIC APPROACH FOR DETECTING SECURITY ANOMALIES IN ISP INFRASTRUCTURES
JAAP MOOIJ 38 26-1-2017
5.9 Results
To determine the initial values of the values in the model, some pragmatic choices were made:
- Sliding window size was set at 14 days.
- The threshold value in the IQR anomaly detection was set at t=1.5 for al parameters, in line
with common practice.
- A more complex puzzle was how to score the exceptional cases were IQR=0. After some trial
and error, a pragmatic choice was made: The values of z were chosen in such a way that the
highest “exception” anomaly score was awarded twice the value of the highest observed
“normal” score for each parameter3. The reasoning behind this heuristic is that sudden steps
are important, but should not entirely dominate the overall outcome.
- The weight factors were determined in two steps: First, the values of w were chosen in such a
way that all parameters in the vector contributed evenly to the overall anomaly score4.
Second, five parameters that were considered specifically relevant by domain experts5 were
awarded a double weighting in the over-all score.
5.9.1 User anomaly scores
The over-all user anomaly scores, calculated with the system parameters initialized as described in the previous paragraph, are shown in Figure 29. After the initial 2-week training period, the week pattern is clearly recognizable (there are fewer anomalies in the weekends, because only upward deviations are scored). The rising peaks at first resemble an artefact, but on closer inspection seem plausible when the trends in the source data are considered (see Figure 17 and Figure 21). Especially the peak on day 51 in the process start/stop data is clearly recognizable.
Figure 30 shows the breakdown of the over-all anomaly score to the contributing scores per
parameter. Some interesting peaks are observed, that could serve as a starting point for further
investigation. As an example, an analysis was made based on the interesting observation that there
was a peak of failed logon anomalies on day 43. It turns out that 21 users generate the same,
maximum anomaly score for that day. Their feature vector histories were extracted; Figure 31 shows
the logon history for two of them. User U1040 has a regular pattern of successful logon attempts,
3 This required two pre-detection runs: one where the anomaly scores of all “normal” cases were set at zero and z=1 (giving the maximum “steps” after a period of stability), and one where the exception values were set at zero (giving the values for “normal” scores). The value of z for each parameter was determined by dividing the two. 4 This was done by first calculating anomalies with all weight factors at w=1. The total of all anomaly scores over all users and all day was then calculated for each parameter. Finally, the weight factors were determined by taking the inverse of this value. 5 uv_a_ddoms_fail, uv_a_newdcomps, uv_a_fails, uv_p_newcomps and uv_p_newprocs
Figure 29. Total user anomaly score with 14 day sliding window
0
2000
4000
6000
8000
10000
1 3 5 7 9 11 13 15 17 19 21 23 25 27 29 31 33 35 37 39 41 43 45 47 49 51 53 55 57
Total user anomaly socre

A GENERIC APPROACH FOR DETECTING SECURITY ANOMALIES IN ISP INFRASTRUCTURES
JAAP MOOIJ 39 26-1-2017
until on day 42/43 the volume drops and the success rate drops to near, but not totally, zero. U6242
has a more erratic history, but also drops both in volume and success rate on day 42. The dotted line
shows that the percentage of Kerberos logons drops to zero on the same day.
Without access to more detailed logs or operational staff it is impossible to determine whether this
behaviour indicates a security issue or is simply the result of e.g. a configuration error. Still, this
example demonstrate that this way of modelling offers a quick method of zooming in from global
observations to the details of the underlying data.
In regular operation, this model could be used to generate a daily top x of users that are eligible for
manual analysis. For instance, on day 25, the ten users with the most anomalous behaviour are
U1464, U1560, U1582, U1678, U4510, U4732, U583, U8373, U849 and U927. Figure 32 shows
selected parameters for two of those users. User U4510 the anomaly score is determined by a peak
in new destination computers. U1464 is more interesting: on day 24 there is a peak in new
processes, followed by a sudden rise in the percentage of failed logon attempt on day 25. Somewhat
disappointingly, the users that were targeted by the Red Team did not appear among the top scores
for the days they occurred.
Figure 30. Normalized user anomaly scores per parameter, totalled over all users.
“new credentials” logon
failed logon attempts
(new) processes
Microsoftauthentication
“new credentials” logon
Figure 31. Logon history for two users contributing to the observed peak in failed logon anomalies on day 43
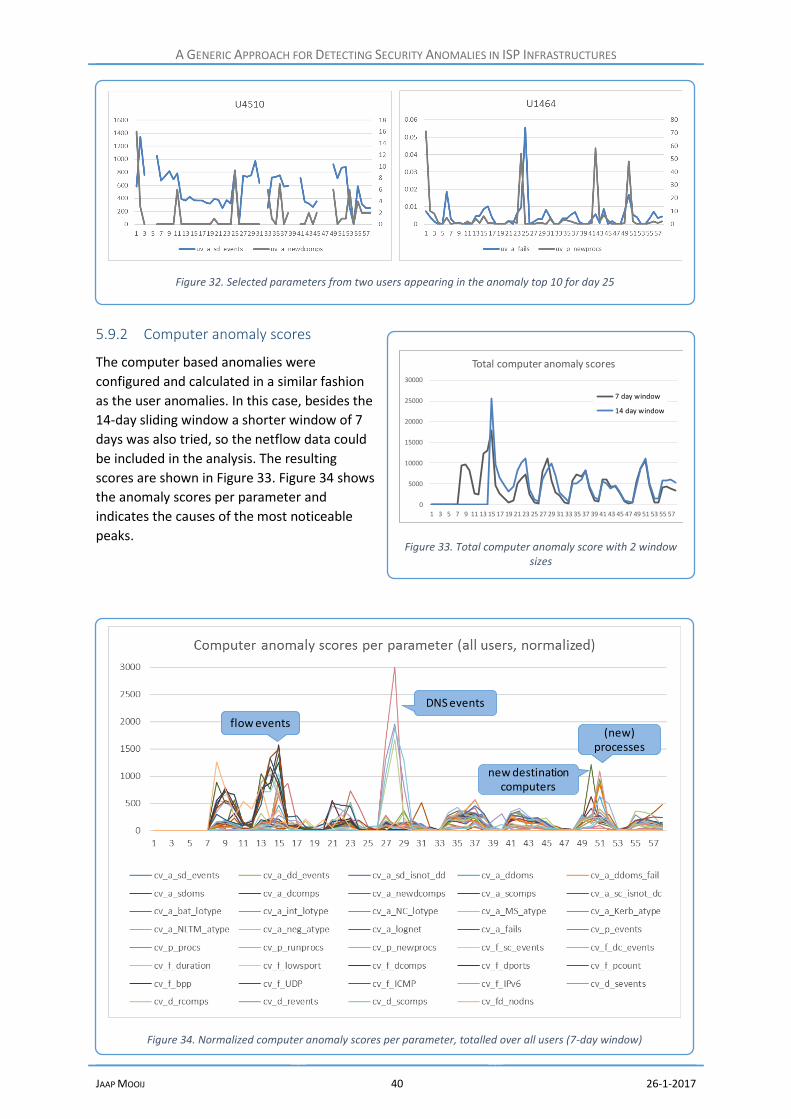
A GENERIC APPROACH FOR DETECTING SECURITY ANOMALIES IN ISP INFRASTRUCTURES
JAAP MOOIJ 40 26-1-2017
5.9.2 Computer anomaly scores
The computer based anomalies were
configured and calculated in a similar fashion
as the user anomalies. In this case, besides the
14-day sliding window a shorter window of 7
days was also tried, so the netflow data could
be included in the analysis. The resulting
scores are shown in Figure 33. Figure 34 shows
the anomaly scores per parameter and
indicates the causes of the most noticeable
peaks.
Figure 33. Total computer anomaly score with 2 window sizes
0
5000
10000
15000
20000
25000
30000
1 3 5 7 9 11 13 15 17 19 21 23 25 27 29 31 33 35 37 39 41 43 45 47 49 51 53 55 57
Total computer anomaly scores
7 day window
14 day window
Figure 34. Normalized computer anomaly scores per parameter, totalled over all users (7-day window)
DNS events
(new) processes
flow events
new destination computers
Figure 32. Selected parameters from two users appearing in the anomaly top 10 for day 25

A GENERIC APPROACH FOR DETECTING SECURITY ANOMALIES IN ISP INFRASTRUCTURES
JAAP MOOIJ 41 26-1-2017
5.10 Computational impact
For the proposed anomaly detection to work, the available computing power must be able to
process the data at least as fast as it comes in. Even though the code has not been optimized for
performance, this presented no problem for the test implementation.
Data priming involves reading and parsing the text data and performing some simple operations.
This was done per source file. The authentication file is by far the largest source; priming it took
nearly four hours (13.905 seconds) or 4 minutes per day of data. All other sources took less than an
hour to process.
In the test implementation, results were kept in memory until all the parsing was done, but if
necessary this could easily be changed to reading and writing line by line, resulting in minimal
memory requirements. Of course the Los Alamos data is already pre-processed; in real-life
implementations parsing will be more complicated, external sources and data dictionaries may need
to be accessed and routines should be implemented to handle missing or corrupted data. However,
since there are no interdependencies between variables, processing time will grow linear with the
number of events and the number of parameters and should scale well. Network and storage
requirements may be significant given the amount of data involved, but should also scale linear with
data volume.
Buffering mainly leads to storage requirements. The test implementation was optimized for code
transparency and data retrieval speed, not for data volume. This led to binary output that was only
~20% smaller that the text original. This could easily be condensed if storage space is limited.
However, in real life implementation data volume typically grows with about a factor 2 after data
priming, since the normalized parameters are added as tags to the raw data, which itself is also kept
for later reference.
Calculating the user vectors is by far the most computing intensive, since the number of events has
not been reduced at this point in the test set-up (in real implementations, data priming may of
course include filtering). Significant processing is required for aggregating the data and determining
the feature vector parameters. Since parameter calculations can combine input from different
datasets, all five sets are processed in parallel. Building the user feature vectors for the entire period
took 18:48 hours (67.698 seconds), or 19 minutes per day of data. Computer vectors took 26:22
hours, or 27 minutes per day.
Resource requirements obviously depend heavily on the number of vector parameters and the way
they are defined. A parameter that contains the number of times a certain type of event occurred
requires only a simple counter per entity, while a parameter like “the number of processes started
that have not been started before in the last n days” requires maintaining a sliding window for each
computer that contains the sets of distinct processes started during this period. Still, because there
are no interdependencies between entities, resource demand grows linear with the number of
users/computers.
Maintaining profiles and detecting anomalies is considerably less resource intensive, because at
this point the volume of data has been significantly reduced. The original dataset contains 12.9
billion individual parameters, the computer feature vectors “only” 34.5 million, a reduction by a
factor of 373. Assuming an average of 8 bytes per parameter, storing the profile and the current
parameters requires 34.5·106 /58·(14+1)·8 = 72MB of memory, which is hardly impressive. The user
feature vectors are even smaller.

A GENERIC APPROACH FOR DETECTING SECURITY ANOMALIES IN ISP INFRASTRUCTURES
JAAP MOOIJ 42 26-1-2017
Detecting anomalies using the quartile approach is quick, and because scoring is done per
parameter, scales linear with the numbers of users and parameters. Updating profiles and
calculating anomalies for the user vectors takes less than 30 minutes. Computing the computer
anomalies takes about twice that time, which is in line with expectations considering that there are
more computers and more parameters in the computer vector to process.
5.11 Discussion of the results
Several suspected anomalies were indicated in the data, both by taking a top down approach and by
starting from the individual entities. Unfortunately, the correctness of these suspicions could not be
confirmed, as no labelled data is available and there is no way to further analyse events.
The test implementation re-enforced the awareness that access to domain knowledge is essential to
achieve an effective solution. Access to subject matter experts from another organization, however
valuable, is no substitute for true understanding of the data. This is an inherent limitation when
using public, anonymized data sets. With in-company data and access to the domains that generate
it, much deeper understanding would be possible, enabling a much more targeted implementation.
This being said: The Los Alamos dataset is of high quality and deserves more research. This thesis
only scratched the surface of what can undoubtedly be found in that trove of data!

A GENERIC APPROACH FOR DETECTING SECURITY ANOMALIES IN ISP INFRASTRUCTURES
JAAP MOOIJ 43 26-1-2017
6 Conclusions and recommendations for further study
This study has addressed an important challenge for Internet Service Providers: detecting cyber
security anomalies in growing streams of heterogeneous logfiles. After discussing the proposed
model with domain experts and applying it to a realistic dataset with over 1.6 billion records, it can
be concluded that it is a promising approach to complement existing tooling. The model proved
straightforward to implement, intuitively links high level overviews to specific details and scales well.
It is also flexible in the sense that there are many ways to gradually augment and improve it as
experience with the tooling and the data grows.
It is evident that working with an anonymized test-dataset, without access to infrastructure details
or domain experts, has severe limitations. To bring the model to the next level, it should be applied
in a real operational setting. Once access to real data has been achieved, many improvements and
follow-up experiments are possible:
- Further experimentation with intervals, sliding window sizes and other parameters should
help to find optimum values. This can be accomplished with historical data, but should be
done in close cooperation with operational staff from both security (SOC and CERT) and the
domains that generate the data.
- As a next step, the model can be applied to (near) real-time data. Processes should be
implemented to systematically monitor and optimize the model over a longer test period. This
should eventually lead to a smarter definition of the feature vectors.
- In ISP infrastructures there are many clusters of appliances that share the same function, and
therefore can be expected to behave similarly. Group profiling could easily be applied to these
clusters to detect any deviations from standard behaviour.
- Applications and processes generate significant amounts of logging, and should be candidates
for both historic-and group-profiling. These entities will only become more important as
virtualization and Software Defined Networks accelerate the functionality shift from hardware
to software.
- Optimization of the code is certainly possible, which should lead to improvements in both
storage requirements and processing speed. There is a subfield in data mining called “mining
data steams” that has developed extremely fast and memory efficient algorithms to calculate
statistics from streaming data (Leskovec, Rajaraman, & Ullman, 2014). Applying these
techniques to the model should drastically improve performance and scalability.
- An important area for follow-up research should be the anomaly detection itself. The simple
interquartile range based approach deployed in this study can be supplemented by other,
more refined, models to detect anomalies (statistical- or other). This can be applied per
parameter, but multi-dimensional approaches should also be investigated if they can be built
to scale.
- Including anomaly scores in the feature vectors could create a way to monitor the propagation
of anomalies through the network.
- Using contextual knowledge to correlate anomalies in different types of entities could
significantly improve resolution.
Given the dynamics in the field of both big data and its application to security, it can be expected
that security anomaly detection will see rapid developments during the coming years or even
months. This progress will be closely monitored by the ISP community.

A GENERIC APPROACH FOR DETECTING SECURITY ANOMALIES IN ISP INFRASTRUCTURES
JAAP MOOIJ 44 26-1-2017
7 Bibliography
Barbará, D., & Jajodia, S. (2002). Applications of Data Mining in Cyber Security. Kluwer Academic
Publishers.
Bhattacharyya, D. K., & Kalita, J. K. (2014). Network Anomaly Detection - A Machine Learning
Perspective. Boca Raton, FL: CRC Press.
Bhattacharyya, S., Jha, S., Tharakunnel, K., & Westland, C. (2011). Data mining for credit card fraud:
A comparative study. Decision Support Systems, 602-613.
Brause, R., Langsdorf, T., & Hepp, M. (1999). Neural Data Mining for Credit Card Fraud Detection.
Proceedings 11th IEEE International Conference on Tools with Artificial Intelligence. IEEE.
Buczak, A. L., & Guven, E. (2016). A Survey of Data Mining and Machine Learning Methods for Cyber
Security Intrusion Detection. IEEE COMMUNICATIONS SURVEYS & TUTORIALS VOL. 18, NO. 2,
SECOND QUARTER 2016.
Chandola, V., Banerjee, A., & Kumar, V. (September 2009). Anomaly Detection : A Survey. ACM
Computing Surveys.
Dua, S., & Du, X. (2016). Data mining and machine learning in cybersecurity. CRC Press.
Eskin, E., Arnold, A., Prerau, M., Portnoy, L., & Stolfo, S. J. (2016). Patent No. US9306966 B2. U.S.
Goldstein, M., & Dengel, A. (2012). Histogram-based Outlier Score (HBOS): A fast Unsupervised
Anomaly Detection Algorithm. Poster and Demo Track of the 35th German Conference on
Artificial Intelligence (KI-2012), (pp. 59-63).
Goldstein, M., & Seiichi, U. (2016). A Comparative Evaluation of Unsupervised Anomaly Detection
Algorithms for Multivariate Data. PLoS ONE 11(4).
Hajamydeen, A. I., Udzir, N. I., Mahmod, R., & Abdul Ghania, A. A. (2016). An unsupervised
heterogeneous log-based framework for anomaly detection. Turkish Journal of Electrical
Engineering & Computer Sciences, 24: 1117 { 1134.
HDF5 Home Page. (2016). Retrieved from https://support.hdfgroup.org/HDF5/
Hevner, A. R., March, S. T., Park, J., & Ram, S. (2004). Design Science in Information Systems
Research. MIS Quarterly Vol. 28 No. 1,, 75-105.
Hilas, C. S., Mastorocostas, P. A., & Rekanos, I. T. (2015). Clustering of Telecommunications User
Profiles for. Applied Mathematics & Information Sciences 9., 1709-1718.
Holtmanns, S., & Miettinen, M. ( 2008). Patent No. US20080022404 A1. US.
Hu, W., Liao, Y., & Vemuri, R. (2003). Robust Support Vector Machines for Anomaly. International
Conference on Machine Learning.
Hutchins, E. M., Cloppert, M. J., & Amin, R. M. (2011). Intelligence-Driven Computer Network
Defense Informed by Analysis of Adversary Campaigns and Intrusion Kill Chains. In Leading
Issues in Information Warfare & Security Research 1 (p. 80). Retrieved from
http://www.lockheedmartin.com/content/dam/lockheed/data/corporate/documents/LM-
White-Paper-Intel-Driven-Defense.pdf
IBM. (2016). Retrieved from http://www-03.ibm.com/security/cognitive/
Kavanagh, K. M., Rochford, O., & Bussa, T. (2016). Magic Quadrant for Security Information and
Event Management. Gartner.
kdnuggets. (2014). Retrieved from http://www.kdnuggets.com/polls/2014/analytics-data-mining-
data-science-methodology.html
Kent, A. D. (2015). Comprehensive, Multi-Source Cybersecurity Events. Retrieved from Los Alamos
National Laboratory: http://csr.lanl.gov/data/cyber1/
Lee, W., & Stolfo, S. J. (1998). Data Mining Approaches for Intrusion Detection. 7th USENIX Security
Symposium.

A GENERIC APPROACH FOR DETECTING SECURITY ANOMALIES IN ISP INFRASTRUCTURES
JAAP MOOIJ 45 26-1-2017
Lee, W., Stolfo, S. J., & Mok, K. W. (1999). A Data Mining Framework for Building Intrusion Detection
Models. Proceedings of the 1999 IEEE Symposium on Security and Privacy.
Leskovec, J., Rajaraman, A., & Ullman, J. (2014). Mining of Massive Datasets. Retrieved from
http://infolab.stanford.edu/~ullman/mmds/ch4.pdf
Lin, D. (2015). Patent No. US9112895 B1. U.S.
Makanju, A., Zincir-Heywood, A. N., & Milios, E. E. (2013). Investigating Event Log Analysis with
Minimum Apriori Information. IFIP/IEEE International Symposium on Integrated Network
Management (IM2013), (pp. 962-968).
Mandiant Consulting. (2016). M-Trends. Retrieved from https://www.fireeye.com/current-
threats/annual-threat-report/mtrends.html
Mendenhall, W., & Sincich, T. L. (1995). Statistics for Engineering and the Sciences (4th Edition).
Prentice-Hall.
National Cyber Security Center. (2016). Cyber Security Assessment Netherlands 2016. Ministry of
Security and Justice.
National Institute of Standards and Technology. (2014). Framework for Improving Critical
Infrastructure Cybersecurity.
Ngai, E., Hu, Y., Wong, Y., Chen , Y., & Sun, X. (February 2011). The application of data mining
techniques in financial fraud detection: A classification framework and an academic review
of literature. Decision Support Systems, Volume 50, Issue 3, Pages 559–569.
Phua, C., Alahakoon, D., & Lee, V. (2004 ). Minority Report in Fraud Detection: Classification of
Skewed Data. Acm sigkdd explorations newsletter, Volume 6, Issue 1 , 50-59.
Phua, C., Lee, V., Smith, K., & Gayler, R. (2010). A Comprehensive Survey of Data Mining-based Fraud
Detection Research. arXiv preprint, arXiv 1009.6119.
Portnoy, L., Eskin, E., & Stolfo, S. (2001). Intrusion detection with unlabeled data using clustering
(2001). In Proceedings of ACM CSS Workshop on Data Mining Applied to Security .
Shavlik, J., & Shavlik, M. (2004). Selection, Combination, and Evaluation of Effective Software Sensors
for Detecting Abnormal Computer Usage. KDD '04: Proceedings of the tenth ACM SIGKDD
International Conference on Knowledge Discovery and Data Mining (pp. 276-285). New York:
ACM.
Stanford. (2014). Data Mining for Cyber Security. Retrieved from
http://web.stanford.edu/class/cs259d/
Wiens, A., Wiens, T., & Massoth, M. (2014). A new Unsupervised User Profiling Approach for
Detecting Toll Fraud in VoIP. AICT2014 : The Tenth Advanced International Conference on
Telecommunications, 63-69.
Wikipedia. (2016). Retrieved from https://en.wikipedia.org/wiki/Los_Alamos_National_Laboratory
Wirth, R., & Hipp, J. (2000). CRISP-DM: Towards a Standard Process Model for Data. Proceedings of
the 4th international conference on the practical applications of knowledge discovery and
data mining.
Wurzenberger, M., Skopik, l., Settanni, G., & Scherrer, W. (2016). Complexlog file
synthesisforrapidsandbox-benchmarking of security-andcomputernetworkanalysistools.
Information Systems 60, 13–33.
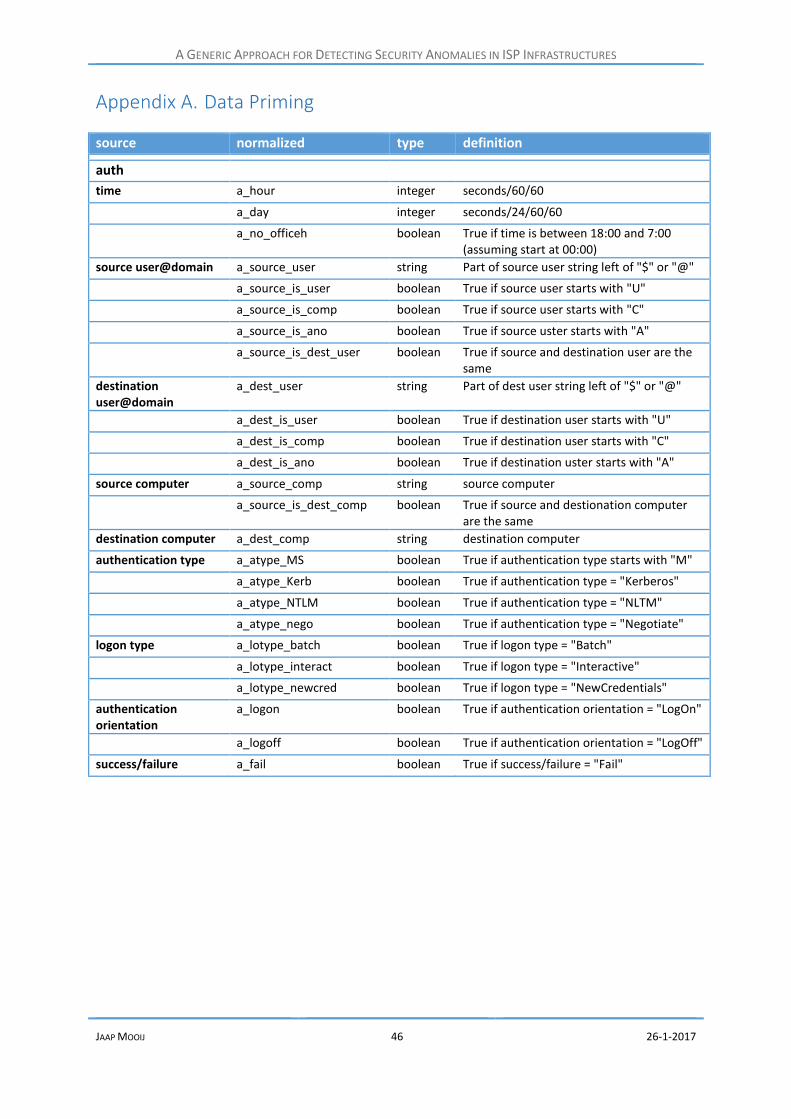
A GENERIC APPROACH FOR DETECTING SECURITY ANOMALIES IN ISP INFRASTRUCTURES
JAAP MOOIJ 46 26-1-2017
Data Priming
source normalized type definition
auth
time a_hour integer seconds/60/60
a_day integer seconds/24/60/60
a_no_officeh boolean True if time is between 18:00 and 7:00 (assuming start at 00:00)
source user@domain a_source_user string Part of source user string left of "$" or "@"
a_source_is_user boolean True if source user starts with "U"
a_source_is_comp boolean True if source user starts with "C"
a_source_is_ano boolean True if source uster starts with "A"
a_source_is_dest_user boolean True if source and destination user are the same
destination user@domain
a_dest_user string Part of dest user string left of "$" or "@"
a_dest_is_user boolean True if destination user starts with "U"
a_dest_is_comp boolean True if destination user starts with "C"
a_dest_is_ano boolean True if destination uster starts with "A"
source computer a_source_comp string source computer
a_source_is_dest_comp boolean True if source and destionation computer are the same
destination computer a_dest_comp string destination computer
authentication type a_atype_MS boolean True if authentication type starts with "M"
a_atype_Kerb boolean True if authentication type = "Kerberos"
a_atype_NTLM boolean True if authentication type = "NLTM"
a_atype_nego boolean True if authentication type = "Negotiate"
logon type a_lotype_batch boolean True if logon type = "Batch"
a_lotype_interact boolean True if logon type = "Interactive"
a_lotype_newcred boolean True if logon type = "NewCredentials"
authentication orientation
a_logon boolean True if authentication orientation = "LogOn"
a_logoff boolean True if authentication orientation = "LogOff"
success/failure a_fail boolean True if success/failure = "Fail"
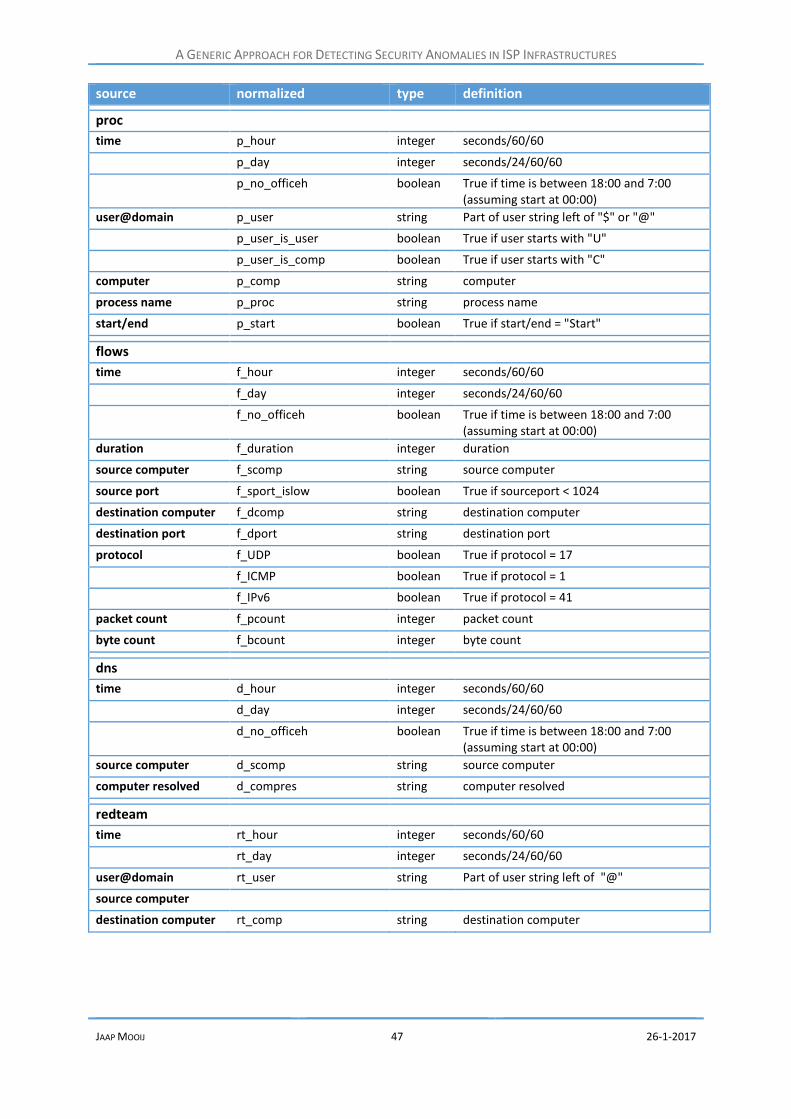
A GENERIC APPROACH FOR DETECTING SECURITY ANOMALIES IN ISP INFRASTRUCTURES
JAAP MOOIJ 47 26-1-2017
source normalized type definition
proc
time p_hour integer seconds/60/60
p_day integer seconds/24/60/60
p_no_officeh boolean True if time is between 18:00 and 7:00 (assuming start at 00:00)
user@domain p_user string Part of user string left of "$" or "@"
p_user_is_user boolean True if user starts with "U"
p_user_is_comp boolean True if user starts with "C"
computer p_comp string computer
process name p_proc string process name
start/end p_start boolean True if start/end = "Start"
flows
time f_hour integer seconds/60/60
f_day integer seconds/24/60/60
f_no_officeh boolean True if time is between 18:00 and 7:00 (assuming start at 00:00)
duration f_duration integer duration
source computer f_scomp string source computer
source port f_sport_islow boolean True if sourceport < 1024
destination computer f_dcomp string destination computer
destination port f_dport string destination port
protocol f_UDP boolean True if protocol = 17
f_ICMP boolean True if protocol = 1
f_IPv6 boolean True if protocol = 41
packet count f_pcount integer packet count
byte count f_bcount integer byte count
dns
time d_hour integer seconds/60/60
d_day integer seconds/24/60/60
d_no_officeh boolean True if time is between 18:00 and 7:00 (assuming start at 00:00)
source computer d_scomp string source computer
computer resolved d_compres string computer resolved
redteam
time rt_hour integer seconds/60/60
rt_day integer seconds/24/60/60
user@domain rt_user string Part of user string left of "@"
source computer
destination computer rt_comp string destination computer
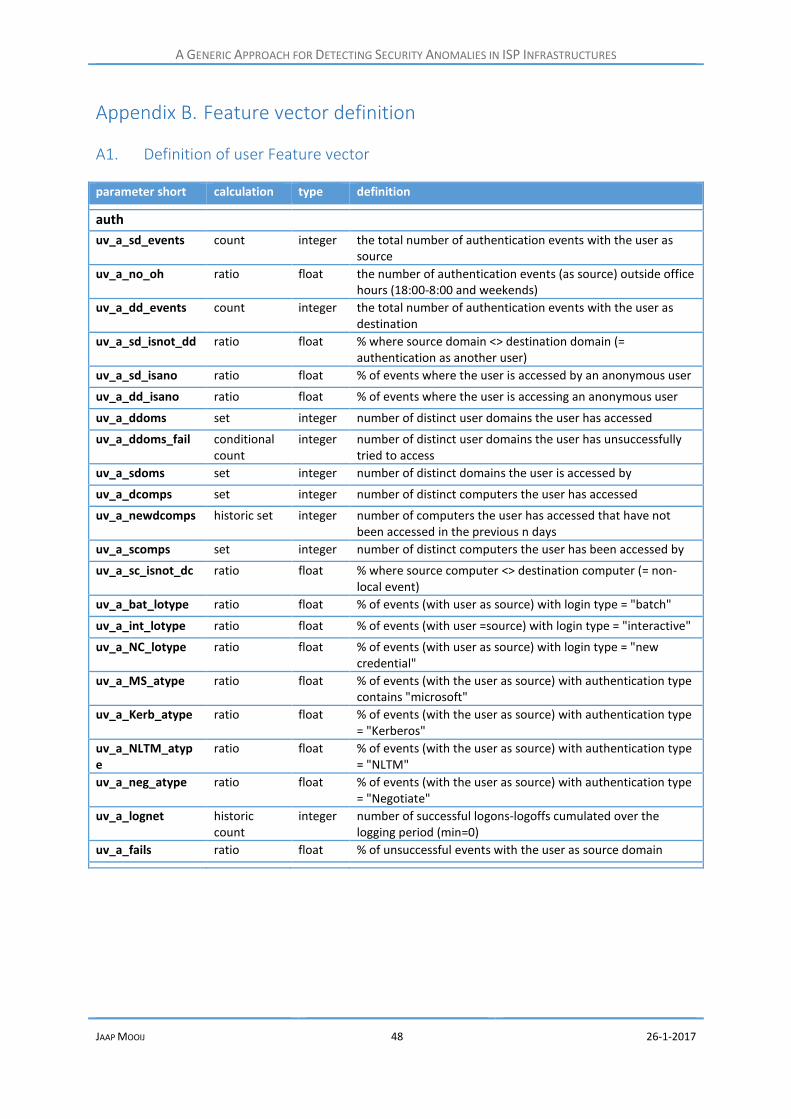
A GENERIC APPROACH FOR DETECTING SECURITY ANOMALIES IN ISP INFRASTRUCTURES
JAAP MOOIJ 48 26-1-2017
Feature vector definition
A1. Definition of user Feature vector
parameter short calculation type definition
auth
uv_a_sd_events count integer the total number of authentication events with the user as source
uv_a_no_oh ratio float the number of authentication events (as source) outside office hours (18:00-8:00 and weekends)
uv_a_dd_events count integer the total number of authentication events with the user as destination
uv_a_sd_isnot_dd ratio float % where source domain <> destination domain (= authentication as another user)
uv_a_sd_isano ratio float % of events where the user is accessed by an anonymous user
uv_a_dd_isano ratio float % of events where the user is accessing an anonymous user
uv_a_ddoms set integer number of distinct user domains the user has accessed
uv_a_ddoms_fail conditional count
integer number of distinct user domains the user has unsuccessfully tried to access
uv_a_sdoms set integer number of distinct domains the user is accessed by
uv_a_dcomps set integer number of distinct computers the user has accessed
uv_a_newdcomps historic set integer number of computers the user has accessed that have not been accessed in the previous n days
uv_a_scomps set integer number of distinct computers the user has been accessed by
uv_a_sc_isnot_dc ratio float % where source computer <> destination computer (= non-local event)
uv_a_bat_lotype ratio float % of events (with user as source) with login type = "batch"
uv_a_int_lotype ratio float % of events (with user =source) with login type = "interactive"
uv_a_NC_lotype ratio float % of events (with user as source) with login type = "new credential"
uv_a_MS_atype ratio float % of events (with the user as source) with authentication type contains "microsoft"
uv_a_Kerb_atype ratio float % of events (with the user as source) with authentication type = "Kerberos"
uv_a_NLTM_atype
ratio float % of events (with the user as source) with authentication type = "NLTM"
uv_a_neg_atype ratio float % of events (with the user as source) with authentication type = "Negotiate"
uv_a_lognet historic count
integer number of successful logons-logoffs cumulated over the logging period (min=0)
uv_a_fails ratio float % of unsuccessful events with the user as source domain

A GENERIC APPROACH FOR DETECTING SECURITY ANOMALIES IN ISP INFRASTRUCTURES
JAAP MOOIJ 49 26-1-2017
parameter short calculation type definition
proc
uv_p_events count integer the total number of proc events with the user as source
uv_p_comps set integer number of distinct computers the user initiated processes on
uv_p_newcomps historic set integer number of computers the user started processes on for the first time in n days
uv_p_procs set integer number of distinct process types initiated by the user
uv_p_runprocs historic count
integer number of processes started cumulated over the logging period (min=0)
uv_p_newprocs historic set integer number of processes the user started for the first time in n days
red team
uv_rt_hacked boolean boolean = True when user has been involved in RedTeam event
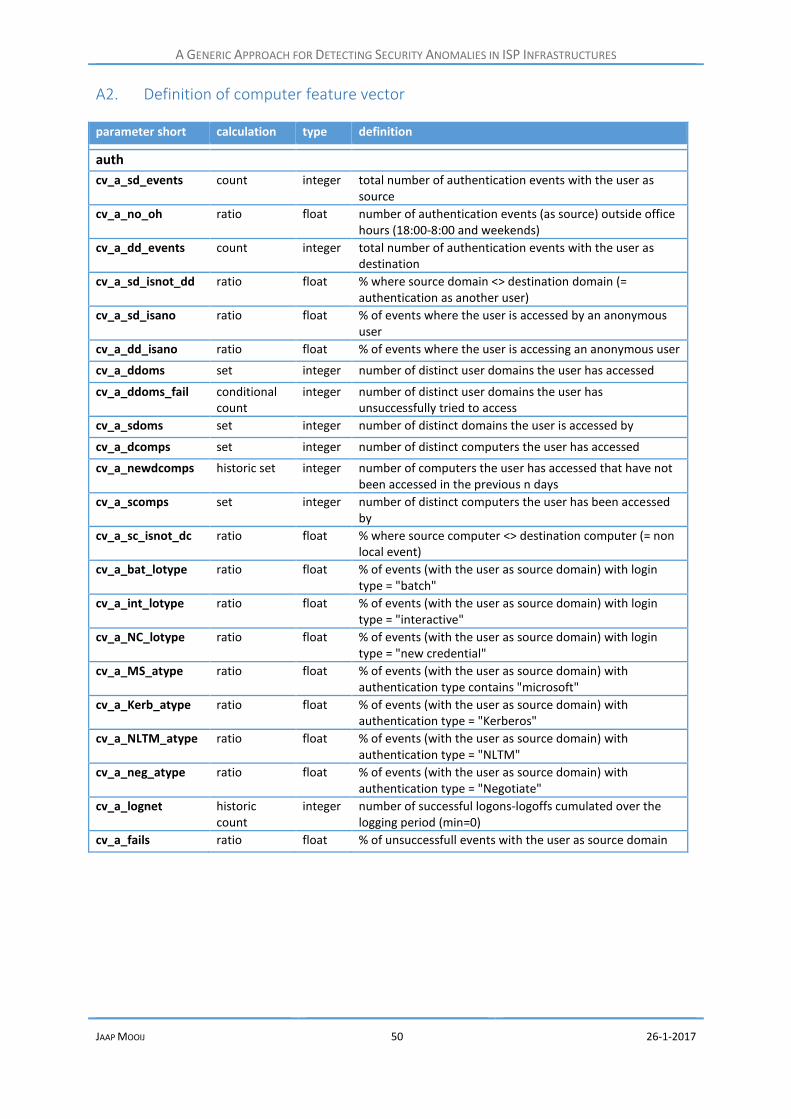
A GENERIC APPROACH FOR DETECTING SECURITY ANOMALIES IN ISP INFRASTRUCTURES
JAAP MOOIJ 50 26-1-2017
A2. Definition of computer feature vector
parameter short calculation type definition
auth
cv_a_sd_events count integer total number of authentication events with the user as source
cv_a_no_oh ratio float number of authentication events (as source) outside office hours (18:00-8:00 and weekends)
cv_a_dd_events count integer total number of authentication events with the user as destination
cv_a_sd_isnot_dd ratio float % where source domain <> destination domain (= authentication as another user)
cv_a_sd_isano ratio float % of events where the user is accessed by an anonymous user
cv_a_dd_isano ratio float % of events where the user is accessing an anonymous user
cv_a_ddoms set integer number of distinct user domains the user has accessed
cv_a_ddoms_fail conditional count
integer number of distinct user domains the user has unsuccessfully tried to access
cv_a_sdoms set integer number of distinct domains the user is accessed by
cv_a_dcomps set integer number of distinct computers the user has accessed
cv_a_newdcomps historic set integer number of computers the user has accessed that have not been accessed in the previous n days
cv_a_scomps set integer number of distinct computers the user has been accessed by
cv_a_sc_isnot_dc ratio float % where source computer <> destination computer (= non local event)
cv_a_bat_lotype ratio float % of events (with the user as source domain) with login type = "batch"
cv_a_int_lotype ratio float % of events (with the user as source domain) with login type = "interactive"
cv_a_NC_lotype ratio float % of events (with the user as source domain) with login type = "new credential"
cv_a_MS_atype ratio float % of events (with the user as source domain) with authentication type contains "microsoft"
cv_a_Kerb_atype ratio float % of events (with the user as source domain) with authentication type = "Kerberos"
cv_a_NLTM_atype ratio float % of events (with the user as source domain) with authentication type = "NLTM"
cv_a_neg_atype ratio float % of events (with the user as source domain) with authentication type = "Negotiate"
cv_a_lognet historic count
integer number of successful logons-logoffs cumulated over the logging period (min=0)
cv_a_fails ratio float % of unsuccessfull events with the user as source domain

A GENERIC APPROACH FOR DETECTING SECURITY ANOMALIES IN ISP INFRASTRUCTURES
JAAP MOOIJ 51 26-1-2017
parameter short calculation type definition
flows
cv_f_sc_events count integer number of events where the computer is the source computer
cv_f_dc_events count integer number of events where the computer is the destination computer
cv_f_duration ratio float the average duration of a flow
cv_f_lowsport conditional count
integer number of events initiated by the computer with a low port number <1024
cv_f_dcomps set integer number of distinct destination computers accessed by the computer
cv_f_dports set integer number of distinct destination ports accessed by the computer
cv_f_pcount ratio float average packet count of sessions initiated by the computer
cv_f_bpp ratio float average byte per packet of sessions initiated by the computer
cv_f_UDP ratio float % of UDP traffic in sessions initiated by the computer
cv_f_ICMP ratio float % of ICMP traffic in sessions initiated by the computer
cv_f_IPv6 ratio float % of IPv6 traffic in sessions initiated by the computer
proc
cv_p_events count integer total number of proc events with the user as source
cv_p_comps set integer the number of distinct computers the user initiated processes on
cv_p_newcomps historic set integer number of distinct computers the user started processes on for the first time in n days
cv_p_procs set integer number of distinct process types initiated by the user
cv_p_runprocs historic count
integer number of processes started cumulated over the logging period (min=0)
cv_p_newprocs historic set integer number of processes the user started for the first time in n days
dns
cv_d_sevents count integer number of events initiated from the computer
cv_d_rcomps set integer number of distinct destinations resolved
cv_d_revents count integer number of events where the computer was resolved as a destination address
cv_d_scomps set integer number of distinct source computers that initiated a request that resolved to the computer
cv_fd_nodns set integer number of computers that have been communicated with without a dns request
red team
cv_rt_hacked boolean boolean = True when user has been involved in a Red Team event
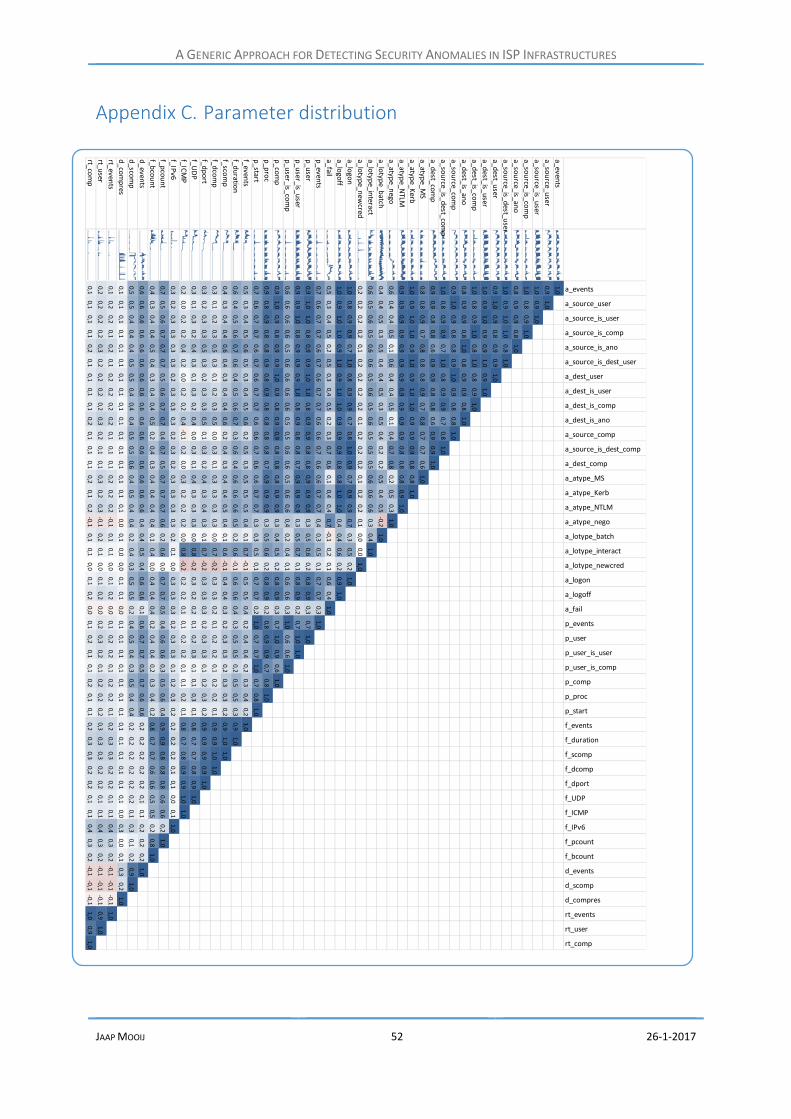
A GENERIC APPROACH FOR DETECTING SECURITY ANOMALIES IN ISP INFRASTRUCTURES
JAAP MOOIJ 52 26-1-2017
Parameter distribution
a_events
a_source_user
a_source_is_user
a_source_is_comp
a_source_is_ano
a_source_is_dest_user
a_dest_user
a_dest_is_user
a_dest_is_comp
a_dest_is_ano
a_source_comp
a_source_is_dest_comp
a_dest_comp
a_atype_MS
a_atype_Kerb
a_atype_NTLM
a_atype_nego
a_lotype_batch
a_lotype_interact
a_lotype_newcred
a_logon
a_logoff
a_fail
p_events
p_user
p_user_is_user
p_user_is_comp
p_comp
p_proc
p_start
f_events
f_duration
f_scomp
f_dcomp
f_dport
f_UDP
f_ICMP
f_IPv6
f_pcount
f_bcount
d_events
d_scomp
d_compres
rt_events
rt_user
rt_comp
a_events
1,0
a_sou
rce_user
0,9
1,0
a_sou
rce_is_user
1,0
0,9
1,0
a_sou
rce_is_com
p1
,00
,80
,91
,0
a_sou
rce_is_ano
0,8
0,9
0,9
0,8
1,0
a_sou
rce_is_dest_u
ser1
,00
,91
,01
,00
,81
,0
a_dest_u
ser0
,91
,00
,90
,80
,90
,91
,0
a_dest_is_u
ser1
,00
,91
,00
,90
,91
,00
,91
,0
a_dest_is_co
mp
1,0
0,8
0,9
1,0
0,8
1,0
0,8
0,9
1,0
a_dest_is_an
o0
,80
,90
,90
,81
,00
,80
,90
,90
,81
,0
a_sou
rce_com
p0
,91
,00
,90
,80
,80
,91
,00
,90
,80
,81
,0
a_sou
rce_is_dest_co
mp
1,0
0,8
0,9
0,9
0,7
1,0
0,8
0,9
0,9
0,7
0,8
1,0
a_dest_co
mp
0,9
0,9
0,8
0,8
0,6
0,9
0,9
0,8
0,8
0,6
0,9
0,9
1,0
a_atype_M
S0
,80
,80
,90
,70
,80
,80
,80
,90
,70
,80
,70
,70
,61
,0
a_atype_K
erb1
,00
,91
,01
,00
,91
,00
,91
,01
,00
,90
,90
,90
,80
,81
,0
a_atype_N
TLM0
,90
,90
,90
,90
,90
,90
,90
,90
,90
,90
,90
,80
,80
,80
,91
,0
a_atype_n
ego0
,60
,40
,40
,50
,10
,60
,40
,40
,50
,10
,40
,70
,80
,20
,50
,31
,0
a_lotyp
e_batch
0,4
0,4
0,5
0,3
0,5
0,4
0,4
0,5
0,3
0,5
0,4
0,2
0,2
0,5
0,4
0,5
-0,2
1,0
a_lotyp
e_interact
0,6
0,5
0,6
0,5
0,6
0,6
0,5
0,6
0,5
0,6
0,5
0,5
0,5
0,6
0,6
0,6
0,3
0,4
1,0
a_lotyp
e_new
cred0
,20
,20
,20
,20
,10
,20
,20
,20
,20
,10
,20
,20
,20
,10
,20
,20
,10
,00
,01
,0
a_logo
n1
,00
,80
,90
,90
,71
,00
,80
,90
,90
,70
,81
,00
,90
,70
,90
,90
,70
,30
,50
,21
,0
a_logo
ff1
,00
,91
,01
,00
,91
,00
,91
,01
,00
,90
,90
,90
,80
,81
,01
,00
,40
,40
,60
,20
,91
,0
a_fail0
,50
,30
,40
,50
,20
,50
,30
,40
,50
,20
,30
,70
,60
,10
,40
,40
,7-0
,10
,20
,10
,60
,41
,0
p_even
ts0
,70
,60
,70
,70
,60
,70
,60
,70
,70
,60
,60
,70
,60
,60
,70
,70
,40
,30
,50
,10
,70
,70
,31
,0
p_u
ser0
,91
,01
,00
,80
,90
,91
,01
,00
,80
,90
,90
,80
,80
,90
,90
,90
,30
,50
,60
,20
,80
,90
,30
,71
,0
p_u
ser_is_user
0,9
0,9
1,0
0,8
0,9
0,9
0,9
1,0
0,8
0,9
0,8
0,8
0,7
0,9
0,9
0,9
0,3
0,5
0,7
0,1
0,8
0,9
0,2
0,7
1,0
1,0
p_u
ser_is_com
p0
,60
,60
,60
,60
,50
,60
,60
,60
,60
,50
,50
,60
,60
,50
,60
,60
,40
,20
,40
,10
,60
,60
,31
,00
,60
,61
,0
p_co
mp
0,9
1,0
0,9
0,8
0,9
0,9
1,0
0,9
0,8
0,9
0,9
0,8
0,8
0,8
0,9
0,9
0,3
0,4
0,5
0,2
0,8
0,9
0,3
0,7
1,0
0,9
0,6
1,0
p_p
roc
0,9
0,8
0,9
0,8
0,8
0,9
0,8
0,9
0,8
0,8
0,8
0,8
0,7
0,9
0,9
0,9
0,3
0,5
0,6
0,2
0,8
0,9
0,2
0,8
0,9
0,9
0,7
0,8
1,0
p_start
0,7
0,6
0,7
0,7
0,6
0,7
0,6
0,7
0,7
0,6
0,6
0,7
0,6
0,6
0,7
0,7
0,3
0,3
0,5
0,1
0,7
0,7
0,2
1,0
0,7
0,7
1,0
0,7
0,81,0
f_events
0,5
0,3
0,4
0,5
0,6
0,5
0,3
0,4
0,5
0,6
0,2
0,5
0,3
0,5
0,5
0,5
0,4
0,1
0,7
-0,1
0,5
0,5
0,4
0,2
0,4
0,4
0,2
0,3
0,40,2
1,0
f_du
ration
0,6
0,4
0,5
0,6
0,7
0,6
0,4
0,5
0,6
0,7
0,3
0,6
0,4
0,6
0,6
0,6
0,5
0,2
0,6
-0,1
0,6
0,6
0,4
0,3
0,5
0,5
0,2
0,5
0,50,3
0,9
1,0
f_scom
p0
,40
,30
,40
,40
,60
,40
,30
,40
,40
,60
,20
,40
,30
,40
,40
,50
,40
,10
,6-0
,10
,40
,40
,30
,20
,30
,30
,20
,30,3
0,20
,91,0
1,0
f_dco
mp
0,3
0,1
0,2
0,3
0,5
0,3
0,1
0,2
0,3
0,5
0,0
0,3
0,1
0,3
0,3
0,3
0,3
0,0
0,7
-0,2
0,3
0,3
0,2
0,1
0,2
0,2
0,1
0,2
0,20,1
0,9
0,91,0
1,0
f_dp
ort
0,3
0,2
0,3
0,3
0,5
0,3
0,2
0,3
0,3
0,5
0,1
0,3
0,2
0,4
0,3
0,4
0,3
0,1
0,7
-0,2
0,3
0,3
0,3
0,2
0,3
0,3
0,1
0,2
0,30,2
0,9
0,90,9
0,91,0
f_UD
P0
,30
,10
,30
,20
,40
,30
,10
,30
,20
,40
,00
,30
,10
,40
,30
,30
,30
,00
,8-0
,20
,30
,20
,20
,10
,20
,30
,10
,10,3
0,10
,80,7
0,70,8
0,91,0
f_ICM
P0
,20
,00
,20
,20
,40
,20
,00
,20
,20
,4-0
,10
,20
,00
,30
,20
,20
,20
,00
,8-0
,20
,20
,20
,10
,10
,20
,20
,10
,10,2
0,10
,80,7
0,80,9
0,91,0
1,0
f_IPv6
0,3
0,2
0,3
0,3
0,3
0,3
0,2
0,3
0,3
0,3
0,2
0,3
0,2
0,3
0,3
0,3
0,3
0,2
0,1
0,0
0,3
0,3
0,3
0,2
0,3
0,3
0,1
0,2
0,30,2
0,2
0,20,2
0,10,1
0,00,1
1,0
f_pco
un
t0
,70
,50
,60
,70
,70
,70
,50
,60
,70
,70
,40
,70
,50
,70
,70
,70
,60
,20
,60
,00
,70
,70
,50
,40
,60
,60
,30
,50,6
0,40
,90,9
0,80,8
0,80,6
0,60,2
1,0
f_bco
un
t0
,40
,30
,40
,40
,50
,40
,30
,40
,40
,50
,20
,40
,30
,40
,40
,40
,40
,10
,40
,00
,40
,40
,40
,20
,40
,40
,20
,30,4
0,20
,80,7
0,70,6
0,60,5
0,50,2
0,81,0
d_even
ts0
,60
,60
,60
,60
,60
,60
,60
,60
,60
,60
,60
,60
,60
,60
,60
,60
,40
,40
,50
,40
,60
,60
,10
,60
,70
,70
,50
,70,6
0,60
,20,2
0,20,2
0,20,1
0,10,2
0,20,2
1,0
d_sco
mp
0,5
0,5
0,4
0,4
0,4
0,5
0,5
0,4
0,4
0,4
0,5
0,5
0,6
0,4
0,5
0,4
0,4
0,2
0,4
0,3
0,5
0,5
0,2
0,4
0,5
0,4
0,3
0,5
0,40,4
0,2
0,20,2
0,20,2
0,20,1
0,30,1
0,20,9
1,0
d_co
mp
res0
,10
,10
,10
,10
,10
,10
,10
,10
,10
,10
,10
,10
,10
,10
,10
,10
,00
,10
,00
,00
,10
,10
,00
,10
,10
,10
,10
,10,1
0,10
,10,1
0,10,1
0,10,1
0,00,3
0,00,1
0,30
,21
,0
rt_events
0,1
0,2
0,2
0,1
0,2
0,1
0,2
0,2
0,2
0,2
0,1
0,1
0,1
0,2
0,2
0,2
-0,1
0,1
0,1
0,0
0,1
0,2
0,0
0,1
0,2
0,2
0,1
0,2
0,20,1
0,2
0,30,3
0,20,2
0,10,1
0,40,3
0,2-0
,1-0,1
-0,11,0
rt_user
0,2
0,2
0,2
0,2
0,3
0,2
0,2
0,2
0,2
0,3
0,2
0,1
0,1
0,3
0,2
0,3
-0,1
0,2
0,1
0,0
0,1
0,2
0,0
0,2
0,3
0,2
0,1
0,2
0,20,2
0,3
0,30,3
0,20,2
0,10,1
0,40,3
0,2-0
,1-0,1
-0,10,9
1,0
rt_com
p0
,10
,10
,10
,10
,20
,10
,10
,10
,10
,20
,10
,10
,10
,20
,10
,2-0
,10
,10
,10
,00
,10
,20
,00
,10
,20
,10
,10
,20,1
0,10
,20,3
0,30,2
0,20,1
0,10,4
0,30,2
-0,1
-0,1-0,1
1,00,9
1,0
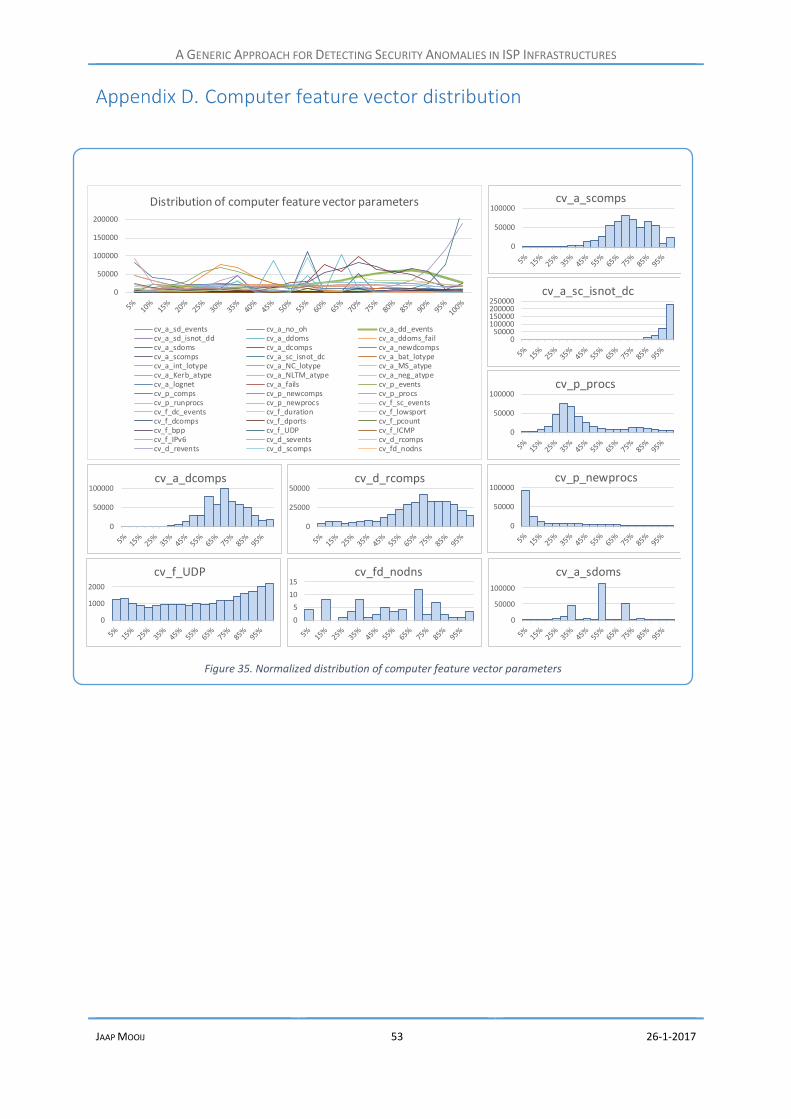
A GENERIC APPROACH FOR DETECTING SECURITY ANOMALIES IN ISP INFRASTRUCTURES
JAAP MOOIJ 53 26-1-2017
Computer feature vector distribution
Figure 35. Normalized distribution of computer feature vector parameters
0
50000
100000
150000
200000
Distribution of computer feature vector parameters
cv_a_sd_events cv_a_no_oh cv_a_dd_eventscv_a_sd_isnot_dd cv_a_ddoms cv_a_ddoms_failcv_a_sdoms cv_a_dcomps cv_a_newdcompscv_a_scomps cv_a_sc_isnot_dc cv_a_bat_lotypecv_a_int_lotype cv_a_NC_lotype cv_a_MS_atypecv_a_Kerb_atype cv_a_NLTM_atype cv_a_neg_atypecv_a_lognet cv_a_fails cv_p_eventscv_p_comps cv_p_newcomps cv_p_procscv_p_runprocs cv_p_newprocs cv_f_sc_eventscv_f_dc_events cv_f_duration cv_f_lowsportcv_f_dcomps cv_f_dports cv_f_pcountcv_f_bpp cv_f_UDP cv_f_ICMPcv_f_IPv6 cv_d_sevents cv_d_rcompscv_d_revents cv_d_scomps cv_fd_nodns
050000
100000150000200000250000
cv_a_sc_isnot_dc
0
50000
100000cv_a_scomps
0
50000
100000cv_p_procs
0
50000
100000cv_p_newprocs
0
25000
50000cv_d_rcomps
0
50000
100000cv_a_dcomps
0
1000
2000
cv_f_UDP
0
5
10
15cv_fd_nodns
0
50000
100000
cv_a_sdoms


![Detecting Carbon Monoxide Poisoning Detecting Carbon ...2].pdf · Detecting Carbon Monoxide Poisoning Detecting Carbon Monoxide Poisoning. ... the patient’s SpO2 when he noticed](https://img.pdfslide.net/doc/110x75/5a78e09b7f8b9a21538eab58/detecting-carbon-monoxide-poisoning-detecting-carbon-2pdfdetecting-carbon.jpg)


![Detecting Carbon Monoxide Poisoning Detecting Carbon ...2].pdf · Detecting Carbon Monoxide Poisoning Detecting Carbon Monoxide Poisoning. Detecting Carbon Monoxide Poisoning C arbon](https://img.pdfslide.net/doc/110x75/5f551747b859172cd56bb119/detecting-carbon-monoxide-poisoning-detecting-carbon-2pdf-detecting-carbon.jpg)