Embed Size (px)
DESCRIPTION
A Genetic Algorithm Approach to K -Means Clustering. Craig Stanek CS401 November 17, 2004. What Is Clustering?. “partitioning the data being mined into several groups (or clusters) of data instances, in such a way that: - PowerPoint PPT Presentation
Citation preview

A Genetic Algorithm Approach A Genetic Algorithm Approach to to KK-Means Clustering-Means Clustering
Craig StanekCS401November 17, 2004

What Is Clustering?
“partitioning the data being mined into several groups (or clusters) of data instances, in such a way that:
a) Each cluster has instances that are very similar (or “near”) to each other, and
b) The instances in each cluster are very different (or “far away”) from the instances in the other clusters”
--Alex A. Freitas, “Data Mining and Knowledge Discovery with Evolutionary Algorithms”

Age vs. Income
0
20,000
40,000
60,000
80,000
100,000
120,000
0 10 20 30 40 50 60 70
Age
Inco
me
Why Cluster?
Segmentation and Differentiation

Age vs. Income
0
500,000
1,000,000
1,500,000
2,000,000
2,500,000
0 10 20 30 40 50 60 70
Age
Inco
me
Why Cluster?
Outlier Detection
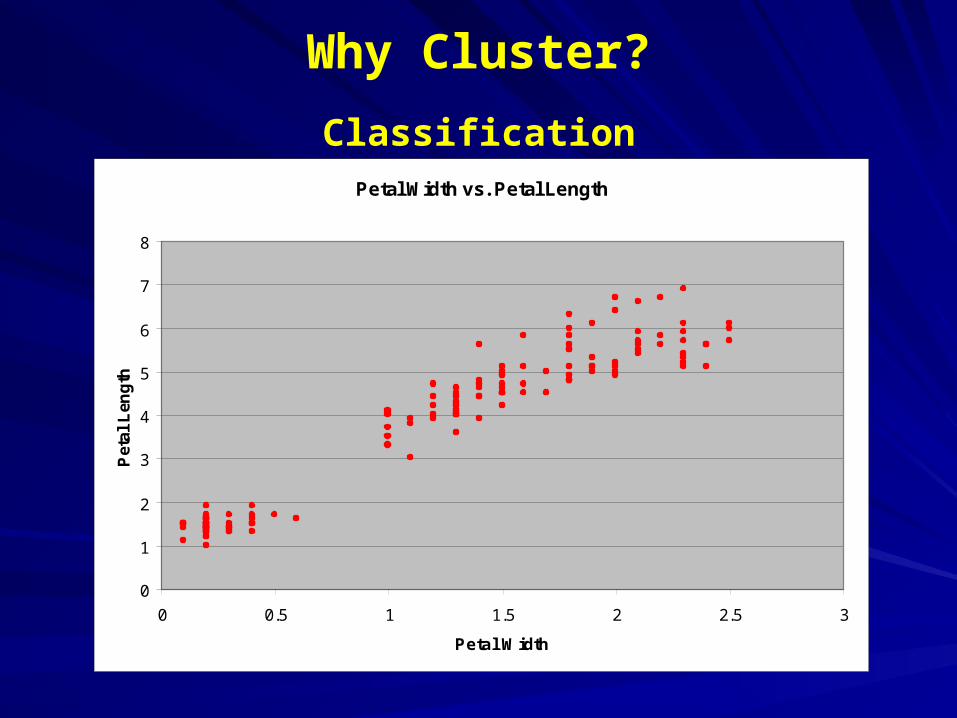
Why Cluster?
ClassificationPetal Width vs. Petal Length
0
1
2
3
4
5
6
7
8
0 0.5 1 1.5 2 2.5 3
Petal Width
Pet
al L
eng
th

K-Means Clustering
1) Specify K clusters
2) Randomly initialize K “centroids”
3) Classify each data instance to closest cluster according to distance from centroid
4) Recalculate cluster centroids
5) Repeat steps (3) and (4) until no data instances move to a different cluster

Drawbacks of K-Means Algorithm
• Local rather than global optimum
• Sensitive to initial choice of centroids
• K must be chosen apriori
• Minimizes intra-cluster distance but does not consider inter-cluster distance

Problem Statement
• Can a Genetic Algorithm approach do better than standard K-means Algorithm?
• Is there an alternative fitness measure that can take into account both intra-cluster similarity and inter-cluster differentiation?
• Can a GA be used to find the optimum number of clusters for a given data set?

• Randomly generated number of clusters
• Medoid-based integer string (each gene is a distinct data instance)
Example:
Representation of Individuals
58 11316223244

Age vs. Income
0
500,000
1,000,000
1,500,000
2,000,000
2,500,000
0 10 20 30 40 50 60 70
Age
Inco
me
Genetic Algorithm Approach
Why Medoids?
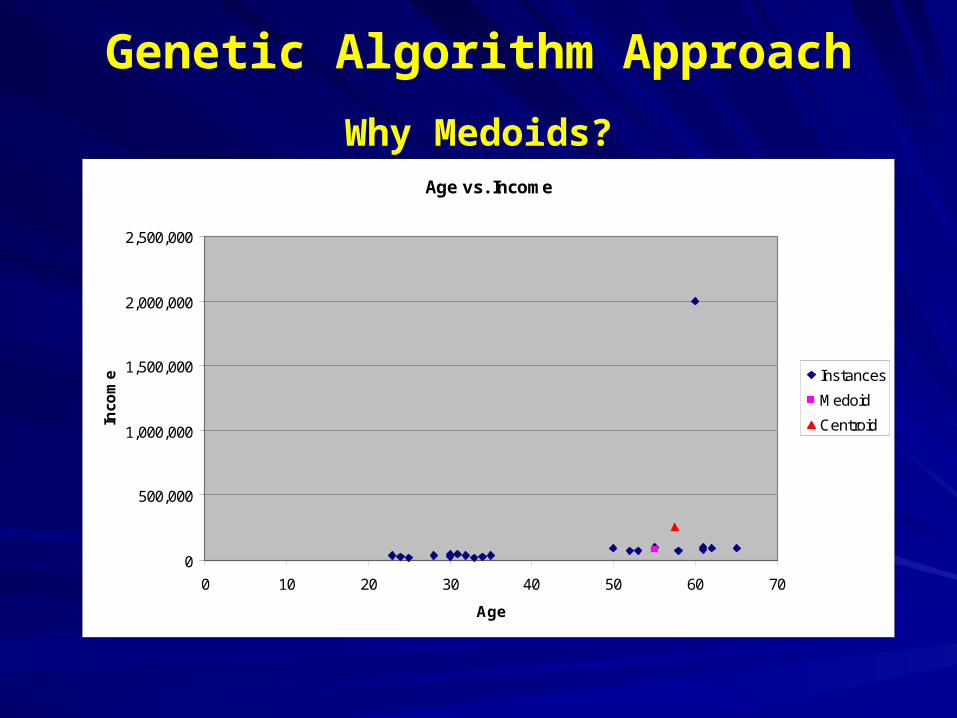
Genetic Algorithm Approach
Why Medoids?Age vs. Income
0
500,000
1,000,000
1,500,000
2,000,000
2,500,000
0 10 20 30 40 50 60 70
Age
Inco
me Instances
Medoid
Centroid

Age vs. Income
0
50,000
100,000
150,000
200,000
250,000
300,000
0 10 20 30 40 50 60 70
Age
Inco
me Instances
Medoid
Centroid
Genetic Algorithm Approach
Why Medoids?

Recombination
5 8280
36 682147108
36 82108
5 1088214780 6
Parent #1:
Parent #2:
Child #1:
Child #2:

Let rij represent the jth data instance of the ith cluster and Mi be the medoid of the ith cluster
Let X =
Let Y =
Fitness = Y / X
)1(
,1 1 1
K
MrDistK
i
n
j
K
kkijki
i
Fitness Function
K
i
n
jiij
i
MrDist1 1
,

• 150 data instances
• 4 dimensions
• Known classifications
3 classes
50 instances of each
Experimental Setup
Iris Plant Data (UCI Repository)

Experimental Setup
Iris Data SetSepal Width vs. Sepal Length
0
1
2
3
4
5
6
7
8
9
0 1 2 3 4 5
Sepal Width
Sep
al L
eng
th
Iris-setosa
Iris-versicolor
Iris-virginica

Experimental Setup
Iris Data SetPetal Width vs. Petal Length
0
1
2
3
4
5
6
7
8
0 0.5 1 1.5 2 2.5 3
Petal Width
Pet
al L
eng
th
Iris-setosa
Iris-versicolor
Iris-virginica

Standard K-Means vs. Medoid-Based EA
KK-Means-Means EAEA
Total TrialsTotal Trials 3030 3030
Avg. CorrectAvg. Correct 120.1120.1 134.9134.9
Avg. % CorrectAvg. % Correct 80.1%80.1% 89.9%89.9%
Min. CorrectMin. Correct 7777 133133
Max. CorrectMax. Correct 134134 135135
Avg. FitnessAvg. Fitness 78.9478.94 84.0084.00

Standard K-Means Clustering
Iris Data Set
Petal Width vs. Petal Length
0
1
2
3
4
5
6
7
8
0 0.5 1 1.5 2 2.5 3
Petal Width
Pet
al L
eng
th Iris-setosa
Iris-versicolor
Iris-virginica
Petal Width vs. Petal Length
0
1
2
3
4
5
6
7
8
0 0.5 1 1.5 2 2.5 3
Petal Width
Pet
al L
eng
th Cluster 1
Cluster 2
Cluster 3

Medoid-Based EA
Iris Data Set
Petal Width vs. Petal Length
0
1
2
3
4
5
6
7
8
0 0.5 1 1.5 2 2.5 3
Petal Width
Pet
al L
eng
th Iris-setosa
Iris-versicolor
Iris-virginica
Petal Width vs. Petal Length
0
1
2
3
4
5
6
7
8
0 0.5 1 1.5 2 2.5 3
Petal Width
Pet
al L
eng
th Cluster 1
Cluster 2
Cluster 3

Standard Fitness EA vs. Proposed Fitness EA
StandardStandard ProposedProposed
Total TrialsTotal Trials 3030 3030
Avg. CorrectAvg. Correct 134.9134.9 134.0134.0
Avg. % CorrectAvg. % Correct 89.9%89.9% 89.3%89.3%
Min. CorrectMin. Correct 133133 134134
Max. CorrectMax. Correct 135135 134134
Avg. GenerationsAvg. Generations 82.782.7 24.924.9

Fixed vs. Variable Number of Clusters EA
Fixed #Fixed # Variable #Variable #
Total TrialsTotal Trials 3030 3030
Avg. CorrectAvg. Correct 134.0134.0 134.0134.0
Avg. % CorrectAvg. % Correct 89.3%89.3% 89.3%89.3%
Min. CorrectMin. Correct 134134 134134
Max. CorrectMax. Correct 134134 134134
Avg. # of ClustersAvg. # of Clusters 33 77

Variable Number of Clusters EA
Iris Data Set
Petal Width vs. Petal Length
0
1
2
3
4
5
6
7
8
0 0.5 1 1.5 2 2.5 3
Petal Width
Pet
al L
eng
th Iris-setosa
Iris-versicolor
Iris-virginica
Petal Width vs. Petal Length
0
1
2
3
4
5
6
7
8
0 0.5 1 1.5 2 2.5 3
Petal Width
Pet
al L
eng
th
Cluster 1
Cluster 2
Cluster 3
Cluster 4
Cluster 5
Cluster 6
Cluster 7
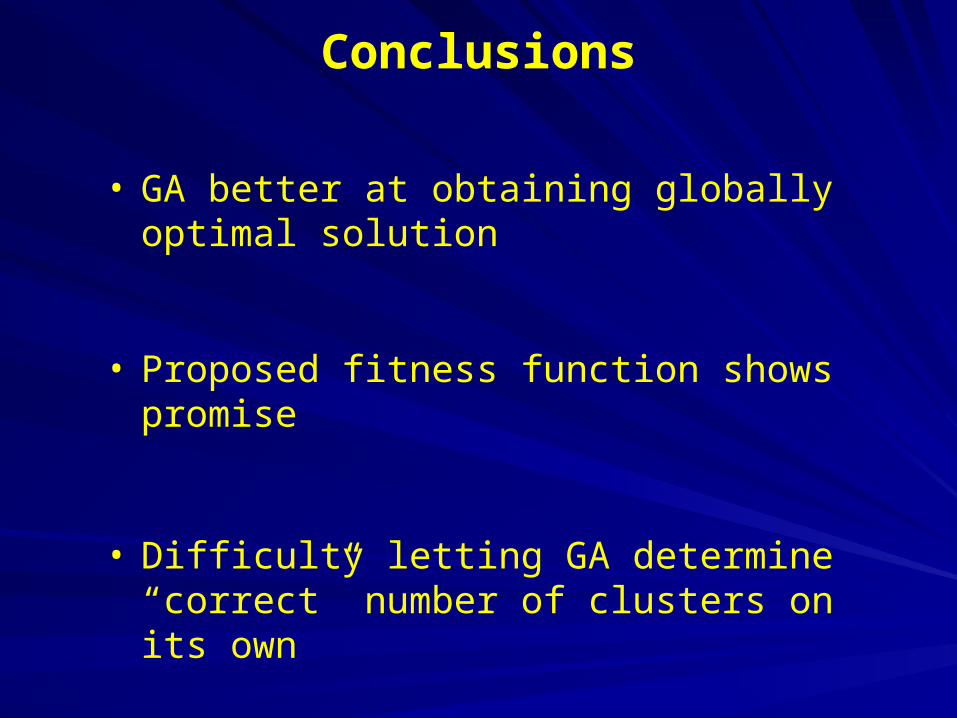
Conclusions
• GA better at obtaining globally optimal solution
• Proposed fitness function shows promise
• Difficulty letting GA determine “correct” number of clusters on its own

Future Work
• Other data sets
• Alternative fitness function
• Scalability
• GA comparison to simulated annealing


![An Application of Genetic Algorithm with Iterative ...ijcsi.org/papers/IJCSI-9-1-1-60-67.pdf · Clustering Algorithm Using Simple Partitioning [20]. The Genetic algorithm described](https://img.pdfslide.net/doc/110x75/5edac4befa3b3a5ad216922b/an-application-of-genetic-algorithm-with-iterative-ijcsiorgpapersijcsi-9-1-1-60-67pdf.jpg)