Embed Size (px)
Citation preview
A Genetic Framework for Grain Size and ShapeVariation in Wheat C W
Vasilis C. Gegas,a,b Aida Nazari,b,1 Simon Griffiths,a James Simmonds,a Lesley Fish,a Simon Orford,a Liz Sayers,a
John H. Doonan,b,1 and John W. Snapea,2
a Department of Crop Genetics, John Innes Centre, Norwich NR4 7UH, United KingdombDepartment of Cell and Developmental Biology, John Innes Centre, Norwich NR4 7UH, United Kingdom
Grain morphology in wheat (Triticum aestivum) has been selected and manipulated even in very early agrarian societies and
remains a major breeding target. We undertook a large-scale quantitative analysis to determine the genetic basis of the
phenotypic diversity in wheat grain morphology. A high-throughput method was used to capture grain size and shape
variation in multiple mapping populations, elite varieties, and a broad collection of ancestral wheat species. This analysis
reveals that grain size and shape are largely independent traits in both primitive wheat and in modern varieties. This
phenotypic structure was retained across the mapping populations studied, suggesting that these traits are under the
control of a limited number of discrete genetic components. We identified the underlying genes as quantitative trait loci that
are distinct for grain size and shape and are largely shared between the different mapping populations. Moreover, our
results show a significant reduction of phenotypic variation in grain shape in the modern germplasm pool compared with
the ancestral wheat species, probably as a result of a relatively recent bottleneck. Therefore, this study provides the genetic
underpinnings of an emerging phenotypic model where wheat domestication has transformed a long thin primitive grain to a
wider and shorter modern grain.
INTRODUCTION
Wheat epitomizes the effectiveness of artificial selection and
breeding in shaping a crop to suit human social and historical
circumstances as well as economical incentives. The domesti-
cation ofwild einkorn and emmerwheat around 10,000 years ago
marked the transition from a hunter-gatherer society to an
agrarian one with considerable effects on the evolution of human
civilization. Moreover, the emergence of hexaploid, common or
bread wheat, followed by further selection and extensive breed-
ing, led to a crop species of significant financial and nutritional
importance since it provides one-fifth of the calories consumed
by humans today (Dubcovsky and Dvorak, 2007).
One of the main components of the domestication syndrome
in cereals (i.e., the set of characters that distinguishes the
domesticated species from its wild ancestors) is an increase in
grain size (Fuller, 2007; Brown et al., 2009). Archaeobotanical
evidence from around the Fertile Crescent region indicates that
the transition from the diploid wild einkorn (Triticum monococ-
cum ssp aegilopoides; AmAm) and tetraploid emmer wheat
(Triticum turgidum ssp dicoccoides; BBAA) to the domesticated
forms (T. monococcum ssp monococcum and T. turgidum ssp
dicoccum, respectively) was associated with a trend toward
larger grains (Feldman, 2001; Fuller, 2007). This phenomenon is
thought to have occurred relatively quickly and preceded the
transition to nonshattering/free-threshing (two of the most im-
portant components of the domestication syndrome) wheat
forms (Fuller, 2007). Mainly because of its effect on yield,
increasing grain size continues to be a major selection and
breeding target inmodern tetraploid (T. turgidum ssp durum) and
hexaploid wheat (Triticum aestivum ssp aestivum; BBAADD).
Grain shape does not appear to have been a major compo-
nent of the wheat domestication syndrome, in contrast with
other cereal species, such as rice (Oryza sativa), where the
domestication process involved strong selection both for grain
size and shape (Kovach et al., 2007), but has been a relatively
recent breeding target dictated by the market and industry
requirements. Indeed, grain shape (and size), density, and
uniformity are important attributes for determining the market
value of wheat grain since they influence the milling perfor-
mance (i.e., flour quality and yield). Theoretical models predict
that milling yield could be increased by optimizing grain shape
and sizewith large and spherical grains being the optimumgrain
morphology (Evers et al., 1990). Several other quality criteria
used by the industry are influenced by grain morphology.
Specific weight (kilograms of mass per liter bulk grain) is used
extensively to grade wheat before milling, and it is thought to be
related to the grain shape or size since these parameters
determine the way the individual grain packs. Grain size was
also found to be associated with various characteristics of flour,
such as protein content and hydrolytic enzymes activity, which
1Current address: Institute of Biological Science, University of Malaya,50603 Kuala Lumpur, Malaysia.2 Address correspondence to [email protected] authors responsible for distribution of materials integral to thefindings presented in this article in accordance with the policy describedin the Instructions for Authors (www.plantcell.org) are: John H. Doonan([email protected]) and John W. Snape ([email protected]).CSome figures in this article are displayed in color online but in blackand white in the print edition.WOnline version contains Web-only data.www.plantcell.org/cgi/doi/10.1105/tpc.110.074153
The Plant Cell, Vol. 22: 1046–1056, April 2010, www.plantcell.org ã 2010 American Society of Plant Biologists
in turn determine baking quality and end-use suitability (Millar
et al., 1997; Evers, 2000).
Though genetically and developmentally important, the phe-
notypic and genetic variation of wheat grain morphology is
surprisingly understudied mainly due to the difficulty in quanti-
fying this trait. Previous studies used a limited number of metrics
that were analyzed discretely largely in single mapping popula-
tions (Giura and Saulescu, 1996; Campbell et al., 1999; Dholakia
et al., 2003; Breseghello and Sorrels, 2007; Sun et al., 2009). This
approach identifies only pairwise associations between traits
and single-trait genetic effects; therefore, it is limited in providing
a comprehensivemodel for the phenotypic and genetic structure
of the quantitative traits. One approach is to integrate the
different metrics into a low dimensional framework (i.e., a few
variables that capture most of the trait variation) and subse-
quently use this to identify the genetic basis of the phenotypic
relationship between grain size and shape. Another problem is
that the use of single biparental mapping populations reveals
only part of the genetic architecture of the traits and restrains
identification of background-specific alleles. The inference
power of quantitative analysis to determine the genetic archi-
tecture of a trait could be enhanced by analyzing, in the same
experiment, multiple populations that represent a wider sample
of genetic variation present (Holland, 2007).
Therefore, to gain deeper insights into the genetic basis of
grain size and shape variation, several different populations of
recombinant doubled haploids (DH) that capture a broad spec-
trum of the phenotypic variation present in the elite winter wheat
germplasm pool were exploited. Furthermore, grain material
from accessions of primitive wheat species and modern elite
varieties were measured to determine the phenotypic structure
of the traits and assess the extent of variation retained in
domesticated wheat. We show that grain size is largely inde-
pendent of grain shape both in the DH populations and in the
primitivewheat species and that there is a significant reduction of
phenotypic variation in grain shape in the breeding germplasm
pool probably as a result of relatively recent bottleneck. This
phenotypic structure is attributed to a distinct genetic architec-
ture where common genetic components are involved in the
control of those traits in different wheat varieties.
RESULTS
Variation and Heritability of Grain Size and Shape in
DH Populations
Six morphometric parameters, 1000-grain weight (TGW), grain
area, width (W), length (L), L/W ratio, and factor form density
(FFD), which efficiently and reproducibly capture grain size and
shape variation, weremeasured in a collection of six DHmapping
populations (Table 1, Figure 1). All the measurements were
performed using a digital grain analyzer assisted by an automatic
image analysis suite that allowed high-throughput data collec-
tion from a large number of grains and lines. There were no
significant differences between the parental lines for most of the
traits (see Supplemental Table 1 online) with the exception of
Beaver and Soissons that differ for area and L/W, Avalon and
Cadenza that differ for length and L/W, and Savannah and Rialto
that differ for TGW and FFD (see Supplemental Tables 1A, 1C,
and 1E online). However, extensive transgressive segregation
exists in the DH populations, with lines showing higher and lower
phenotypic values from the parents for all traits (see Supple-
mental Figures 1 and 2 online). This indicates the polygenic
inheritance of the traits with both parents contributing increasing
and decreasing trait alleles. The genotypic and environmental
effects both within and between different years were calculated
for all populations and traits. Significant differences among DH
lines (for each individual population) were found for all six traits (P
< 0.001). Broad sense heritability wasmoderate to high for all the
traits, ranging between 0.51 and 0.95 with grain length and L/W
showing the highest heritability across all populations (see Sup-
plemental Table 1 online).
Phenotypic Structure of Grain Size and Shape Variation
Simple linear correlation coefficients (Spearman’s rho) were
calculated between the morphological traits studied (see Sup-
plemental Table 2 online). TGW is highly positively correlated
with grain area, width, and FFD in all populations and years (r $
0.75, P < 0.001) and moderately correlated with grain length (r$
0.23, P < 0.001). The only exception is BxS, where TGW is not
significantly correlated with grain length. Interestingly, the L/W
ratio shows no significant or a very weak correlation (see Sup-
plemental Table 2 online) with either of the two main grain size
variables (TGW and grain area), suggesting that the relative
proportions of the main growth axes of the grain, which largely
describe grain shape, is independent of grain size.
A principal component analysis (PCA) was performed to
identify the major sources of variation in the morphometric
data sets of each DH population (Figure 2) and on the popula-
tion-wide data set (see Supplemental Table 3A online). PCA does
that by identifying orthogonal directions, namely principal com-
ponents (PCs), along which the trait variance is maximal (Jolliffe,
2002). The substantive importance of a given variable for a given
factor can be gauged by the relative weight of the component
loadings (Field, 2005). In this study, only variables with loading
values of >0.4 were consider important and therefore used for
interpretation following the criteria proposed by Stevens (2009)
that take into account both the sample size and the percentage
of shared variance between the variable and the component
(Stevens, 2009). Two significant PCs, PC1 and PC2, were
Table 1. DH Mapping Populations Studied
Population Abbreviation No Lines Environmentsa
Avalon 3 Cadenza A 3 C 202 DH CF07, CF08
Beaver 3 Soissons B 3 S 65 DH CF07, CF08
Shamrock 3 Shango S 3 S 76 DH CF06, CF07
Spark 3 Rialto Sp 3 R 112 DH CF07
Savannah 3 Rialto Sa 3 R 98 DH CF08
Malacca 3 Charger M 3 C 100 DH CF07
CF, Church Farm, Norwich, UK.aNumerical suffixes show the years of which each experiment was
carried out.
Genetic Analysis of Wheat Grain Morphology 1047
extracted for each DH population that capture 88.7 to 90.9% of
the variation apparent in these populations (see Supplemental
Table 3 online). Both PCs showed analogous organization in all
six populations (Figure 2), with PC1 (55.6 to 67.1%) and PC2
(23.8 to 30.1%) capturing primarily variation in grain size and
grain shape, respectively. Furthermore, PCA on a population-
wide data set also identified two PCs, comparable to the ones
identified for the individual DH populations, each of which
explained 68.7 and 23.3% of the variation, respectively (see
Supplemental Table 3A online). Therefore, PC1 describes grain
size differences, where a proportional increase along both the
longitudinal (length) and proximodistal (width) axes positively
associates with an increase in grain area and subsequently grain
weight (Figure 2C). On the other hand, PC2 captures primarily
grain shape differences with L/W ratio and grain length being the
main explanatory factors (Figure 2C).
Genetic Architecture Is Consistent with the Phenotypic
Structure for Grain Size and Shape Variation
The phenotypic model for the grain size and shape parameters
(Figure 2) suggests that these two traits are probably under the
control of distinct genetic components. To address this question,
we identified the genetic basis underlying all six morphometric
traits studied. Quantitative trait loci (QTL) analysis was per-
formed on six DH populations for either two consecutive years
(AxC, SxS, and BxS) or for 1 year only (SpxR, MxC, and SaxR).
Consistent with the extensive transgressive segregation ap-
parent in the morphometric data (see Supplemental Figures 1
and 2 online), numerous QTL with dispersed effects between the
parents were identified (see Supplemental Figure 3 and Supple-
mental Tables 4 to 6 online). Specifically, 54 QTL were identified
in AxC, 18QTL in BxS, 10QTL in SpxR, 10QTL inMxC, 12QTL in
SaxR, and 13 QTL in SxS. The LOD scores and variation
explained by each of these QTL range between 3.0 and 18.1,
and 6.6 to 50.2%, respectively. In the AxC and BxS populations,
where the broad sense heritability is very high for all the traits,
most of the QTL are common between years for any given
population (see Supplemental Figures 3A and 3C online). The
strong positive correlations between the grain size variables (i.e.,
TGW, area, width, and FFD) and between the grain shape
variables (i.e., L/W and length) can be attributed to cosegregat-
ingQTLwith the same allelic effect. Indeed, QTL for the grain size
variables cosegregated consistently in all populations and years.
The same holds true for the QTL for grain length and L/W (see
Supplemental Text 1 online).
These findings are consistent with the phenotypic architecture
of the morphometric traits studied, where grain size is largely
independent of grain shape in the individual populations as well
as in the population-wide data set. To further substantiate this,
QTL analysis was performed on the principal components (i.e.,
PC1 and PC2) extracted from each DH population (Figure 2).
Similar approaches have been used before for the study of organ
morphology in other species (Langlade et al., 2005; Feng et al.,
2009).
A total of 25 QTL for PC1 and PC2 were identified in the six DH
mapping populations with LOD scores ranging between 2.9 and
10.6, and the amount of variation explainedwas between 9.2 and
36.4% (see Supplemental Table 7 online). The majority of the
QTL identified are located on five chromosomes, 1A, 3A, 4B, 5A,
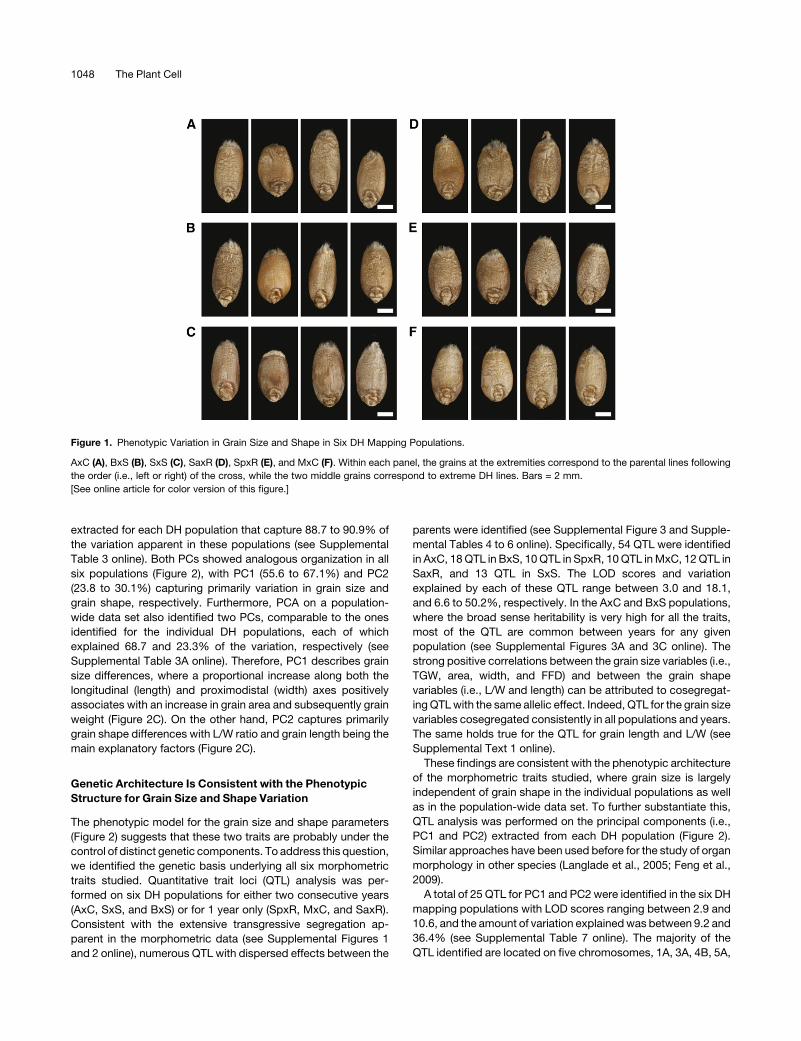
Figure 1. Phenotypic Variation in Grain Size and Shape in Six DH Mapping Populations.
AxC (A), BxS (B), SxS (C), SaxR (D), SpxR (E), and MxC (F). Within each panel, the grains at the extremities correspond to the parental lines following
the order (i.e., left or right) of the cross, while the two middle grains correspond to extreme DH lines. Bars = 2 mm.
[See online article for color version of this figure.]
1048 The Plant Cell
and 6A (two colocated QTL or more). Three QTL for PC2 were
detected in the BxS, SpxR, and SaxR on chromosome 1A, each
of which explained 29.2, 11.3, and 18.5% of the variation in grain
shape, respectively (Figure 3; see Supplemental Figure 4 online).
Meta-analysis identified two QTL at close proximity to each
other, MQTL1 between markers psp3027 and wPt5374 and
MQTL2 between GluA1 and s12/m25.6 on the consensus map
for 1A (Figure 3, Table 2). Significant effects both for PC1 and
PC2 were identified in AxC, BxS, and SpxR on chromosome 3A.
Specifically, two QTL for PC2 were detected in AxC and SpxR
populations around markers barc19 and wmc264, respectively,
while one QTL for PC1 was identified in BxS around marker
gwm2 (Figure 3). Meta-analysis revealed one meta-QTL that
spanned the interval s635ACAG-barc19 (Figure 3, Table 2). Two
QTL for PC1 were detected in BxS and AxC populations on
chromosome 4B, around markers s14/m15.6 and wmc349,
respectively (Figure 3). One meta-QTL was identified between
the markers gwm149 and wmc47 on the wheat consensus map
(Figure 3, Table 2).
QTL both for PC1 and PC2 were identified in AxC, SxS, SpxR,
and SaxR populations on chromosome 5A (Figure 3). Meta-
analysis identified three meta-QTL in the intervals wPt4131-
gwm293, wmc492-gwm666, and cfa2185-wmc727 (Figure 3,
Table 2). Effects for PC1 were identified in AxC, MxC, and SaxR
in the middle of chromosome 6A, whereas a QTL for PC2 was
detected in AxC on the long arm of 6A (Figure 3). Two meta-QTL
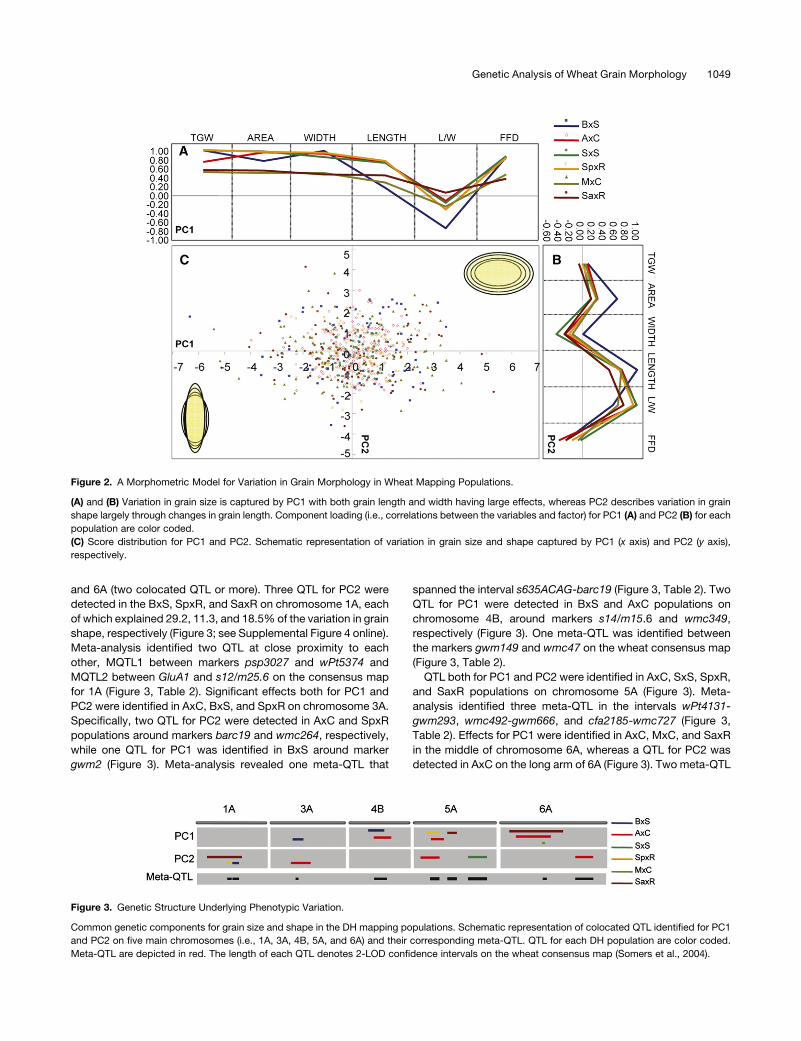
Figure 2. A Morphometric Model for Variation in Grain Morphology in Wheat Mapping Populations.
(A) and (B) Variation in grain size is captured by PC1 with both grain length and width having large effects, whereas PC2 describes variation in grain
shape largely through changes in grain length. Component loading (i.e., correlations between the variables and factor) for PC1 (A) and PC2 (B) for each
population are color coded.
(C) Score distribution for PC1 and PC2. Schematic representation of variation in grain size and shape captured by PC1 (x axis) and PC2 (y axis),
respectively.
Figure 3. Genetic Structure Underlying Phenotypic Variation.
Common genetic components for grain size and shape in the DH mapping populations. Schematic representation of colocated QTL identified for PC1
and PC2 on five main chromosomes (i.e., 1A, 3A, 4B, 5A, and 6A) and their corresponding meta-QTL. QTL for each DH population are color coded.
Meta-QTL are depicted in red. The length of each QTL denotes 2-LOD confidence intervals on the wheat consensus map (Somers et al., 2004).
Genetic Analysis of Wheat Grain Morphology 1049
were identified: MQTL8 corresponds to the PC1-specific QTL
between psp3029 and wmc179, and MQTL9 corresponds to
PC2 QTL between wPt5549 and wPt5480 (Figure 3, Table 2).
Changes in Grain Size and Shape through Domestication
and Breeding
Wheat domestication led predominantly to an increase in grain
size, a phenomenon that has been further intensified by contin-
uous breeding of hexaploidwheat. However, it is still unclear how
these processes impacted on grain shape and how much of the
grain size/shape variation apparent in the wild wheat species still
remains in the modern wheat varieties and breeding germplasm.
To address these questions, ancestral wheat species origi-
nating from the broader Fertile Crescent regionwere analyzed for
variation in grain size and shape (Figure 4). The collection that
was analyzed includes all the known species of the genus
Triticum based on the most commonly accepted taxonomic
and phylogenetic classification for wheat (Feldman, 2001;
Golovnina et al., 2007). Moreover, to assess the variation within
each species, a comprehensive sampling and analysis of differ-
ent accessions of each species was performed, each of which
corresponded to a distinct geographical locale or country of
origin (http://data.jic.bbsrc.ac.uk/cgi-bin/germplasm/triticeae/).
Extensive variation exists for grain area (mean6 SD=22.8mm263.6, range = 18.4 mm2), length (mean 6 SD = 8.5 6 1.1 mm,
range = 5.6 mm), and L/W (mean6 SD = 2.66 0.6, range = 2.64;
see Supplemental Figure 5 and Supplemental Table 8 online),
whereas grain width is the least variable trait (mean6 SD = 3.360.4 mm, range = 1.94 mm). Similar to the results from the DH
populations, grain size appeared largely independent from grain
shape in the primitive wheat species. Indeed, grain area showed
no significant correlation with L/W (r = 0.13, P = 0.335), whereas
length and width were significantly correlated with both area (r =
0.67, r = 0.45, P < 0.001, respectively) and L/W (r = 0.67, r =
20.75, P < 0.001, respectively).
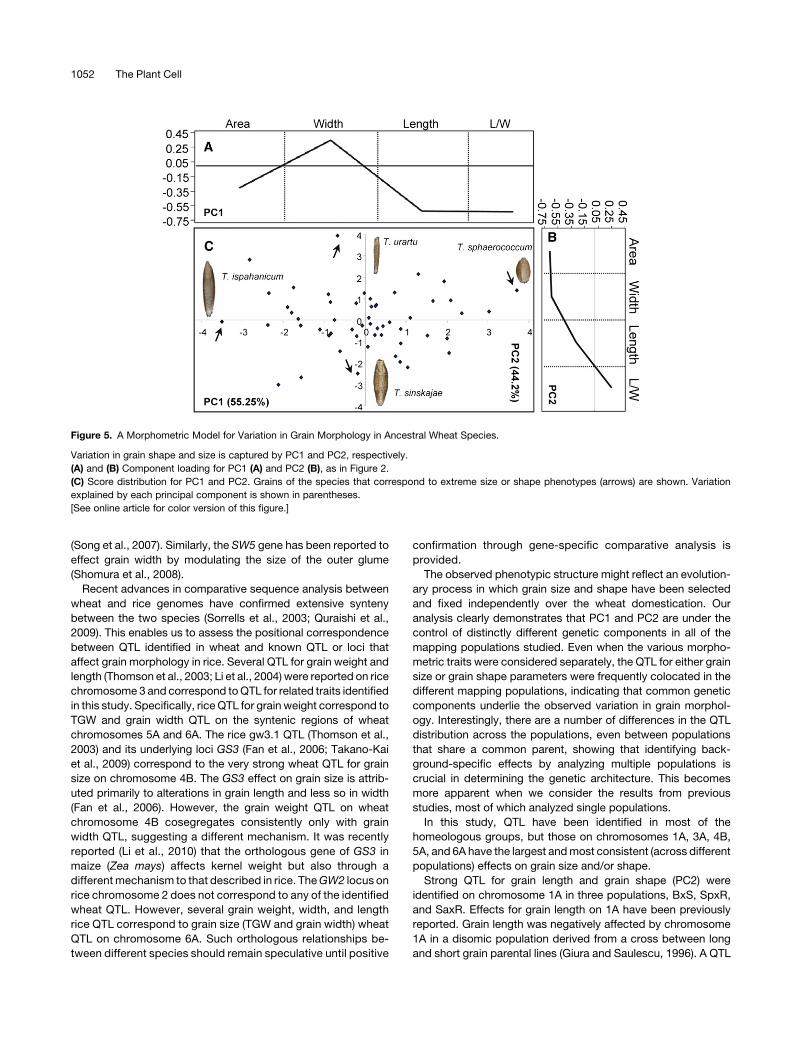
PCA identified two significant PCs that collectively explained
99.5% of the total variation of the traits in primitive wheat (Figure
5). For PC1 (55.25%), themain explanatory factors were L/W and
grain length, whereas for PC2 (44.2%), grain area andwidth were
themain explanatory factors (Figures 5A and 5B). Therefore, PC1
captured variation in grain shape primarily through changes in
grain length, and PC2 captured variation in grain size through
changes in width.
Triticum sphaerococcum and Triticum ispahanicum corre-
spond to the two extreme grain shape phenotypes along PC1,
with the latter having approximately twofold longer (L/W = 3.4)
but almost as wide grains as T. sphaerococcum (L/W = 1.5)
(Figure 5C). On the other hand, Triticum urartu and Triticum
sinskajae represent the two extreme phenotypes in terms of grain
size along PC2 (Figure 5C), with T. sinskajae having approxi-
mately twice the grain size (;25mm2 versus 14.6mm2) primarily
due to increased grain width (;4 mm versus 2.2 mm). Thus, it is
evident that broad variation both in grain size and shape exists in
the primitive wheat species in contrast with the DH populations
andmodern varieties where grain shape variation is considerably
reduced. Indeed,;70% of the variation captured by PC1 in the
DH population data sets is attributed primarily to grain size
differences with only;24%attributed to variation in grain shape
(Figure 2) as opposed to ;44 and ;55% in the wild species,
respectively. Much of the grain shape variation present in the
primitive wheat species has been lost in the modern breeding
germplasm probably due to selection for more uniform grain
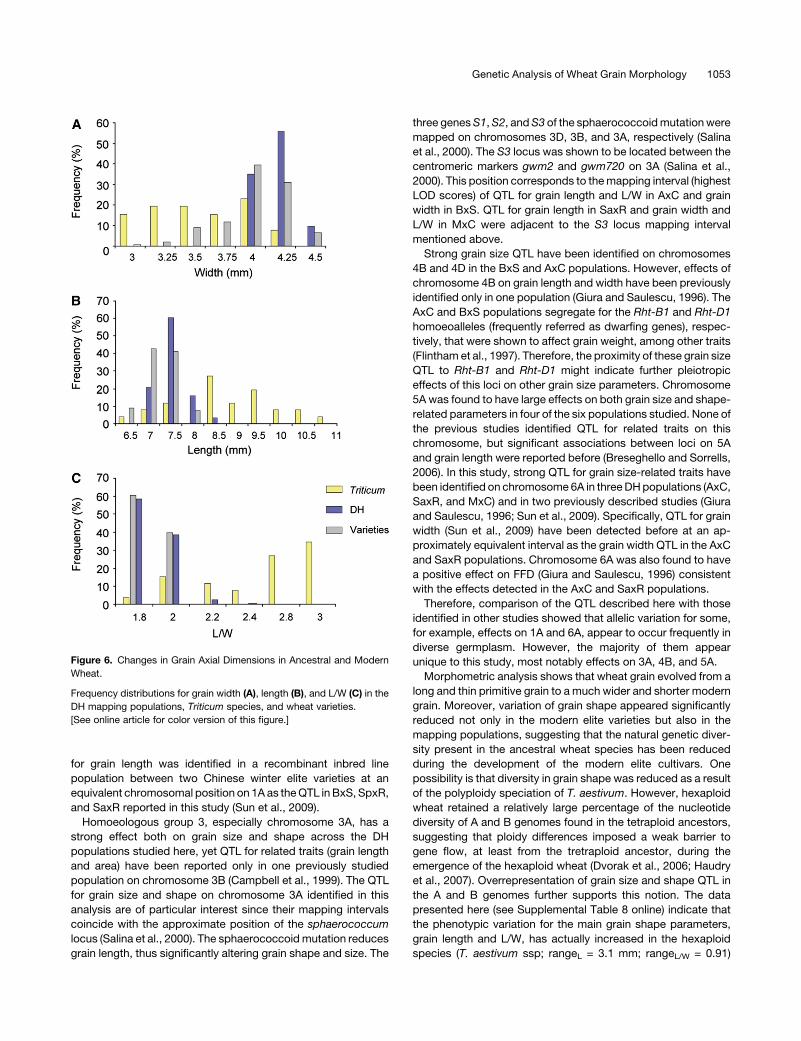
shape in the elite varieties. Figures 6A to 6C illustrate how grain
dimensions (i.e., length and width) and their relative proportions
(i.e., L/W) have changed during domestication and breeding.
Specifically, grain width appeared markedly increased in the DH
populations and in the collection of elite varieties examined
(mean = 4.08 mm; see Supplemental Table 9 online), whereas
grain length is decreased (mean = 7.3 mm) compared with the
wild species (mean = 3.3 and 8.52 mm, respectively) (see
Supplemental Table 8 online). These changes in grain axial
dimensions resulted in grain shape modifications that led from
a predominant long and thin primitive grain (meanL/W = 2.63)
to a much shorter and wider grain in the DH populations and
elite varieties (meanL/W = 1.78). Moreover, there is a much
wider spectrum of grain shape phenotypes in the wild species
(rangeL/W = 2.64, minimum = 1.54, maximum = 4.2) compared
with the DH populations and elite varieties (rangeL/W ;0.4,
minimum ;1.6, maximum;2.0).
DISCUSSION
We used high-throughput morphometric analysis to quantify
grain size and shape variation and determine its underlying
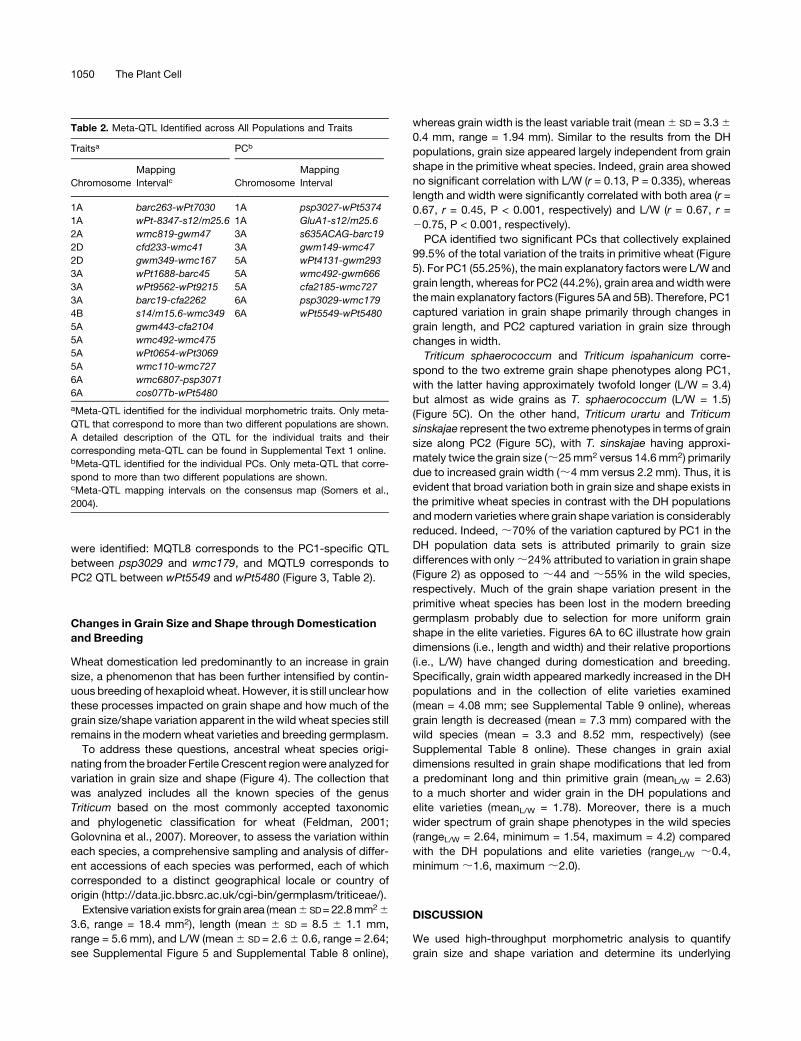
Table 2. Meta-QTL Identified across All Populations and Traits
Traitsa PCb
Chromosome
Mapping
Intervalc Chromosome
Mapping
Interval
1A barc263-wPt7030 1A psp3027-wPt5374
1A wPt-8347-s12/m25.6 1A GluA1-s12/m25.6
2A wmc819-gwm47 3A s635ACAG-barc19
2D cfd233-wmc41 3A gwm149-wmc47
2D gwm349-wmc167 5A wPt4131-gwm293
3A wPt1688-barc45 5A wmc492-gwm666
3A wPt9562-wPt9215 5A cfa2185-wmc727
3A barc19-cfa2262 6A psp3029-wmc179
4B s14/m15.6-wmc349 6A wPt5549-wPt5480
5A gwm443-cfa2104
5A wmc492-wmc475
5A wPt0654-wPt3069
5A wmc110-wmc727
6A wmc6807-psp3071
6A cos07Tb-wPt5480
aMeta-QTL identified for the individual morphometric traits. Only meta-
QTL that correspond to more than two different populations are shown.
A detailed description of the QTL for the individual traits and their
corresponding meta-QTL can be found in Supplemental Text 1 online.bMeta-QTL identified for the individual PCs. Only meta-QTL that corre-
spond to more than two different populations are shown.cMeta-QTL mapping intervals on the consensus map (Somers et al.,
2004).
1050 The Plant Cell
genetic basis in an extensive collection that included DH map-
ping populations, ancestral wheat species, and commercial
varieties.
Quantitative analyses of the morphometric data revealed that
grain size and shape are largely independent traits. This is
unlikely to be the result of artificial selection during breeding
since size and shape are also independent variables in primitive
wheat. At the developmental level, this phenomenon may reflect
differential modulation in growth (or growth arrest) along themain
axes of the grain at different developmental stages. In tomato
(Solanum lycopersicum), for example, loci have been identified
that affect fruit shape but not size and vice versa (Frary et al.,
2000; Tanksley, 2004). Specifically, the fw2.2 genewas shown to
be amajor determinant for fruit size but not shape variation (Frary
et al., 2000), whereas the ovate (Liu et al., 2002) and sun (van der
Knaap and Tanksley, 2001) loci alter fruit shape with little effect
on size due to asymmetric growth in the longitudinal axis of the
carpels and young fruit, respectively. The notion that certain
developmental constraints during fruit or grain growth could lead
to morphological changes is further corroborated by recent
studies on grain size/shape genes in rice (Fan et al., 2006;
Song et al., 2007; Shomura et al., 2008; Takano-Kai et al., 2009).
The GS3 locus was found to have major effects on grain length
and weight and smaller effects on grain width (Fan et al., 2006),
and the longer grains can be attributed to relaxed constraints
during grain elongation (Takano-Kai et al., 2009). The GW2 gene
was shown to alter grain width and weight and to lesser extend
grain length owing to changes in the width of the spikelet hull
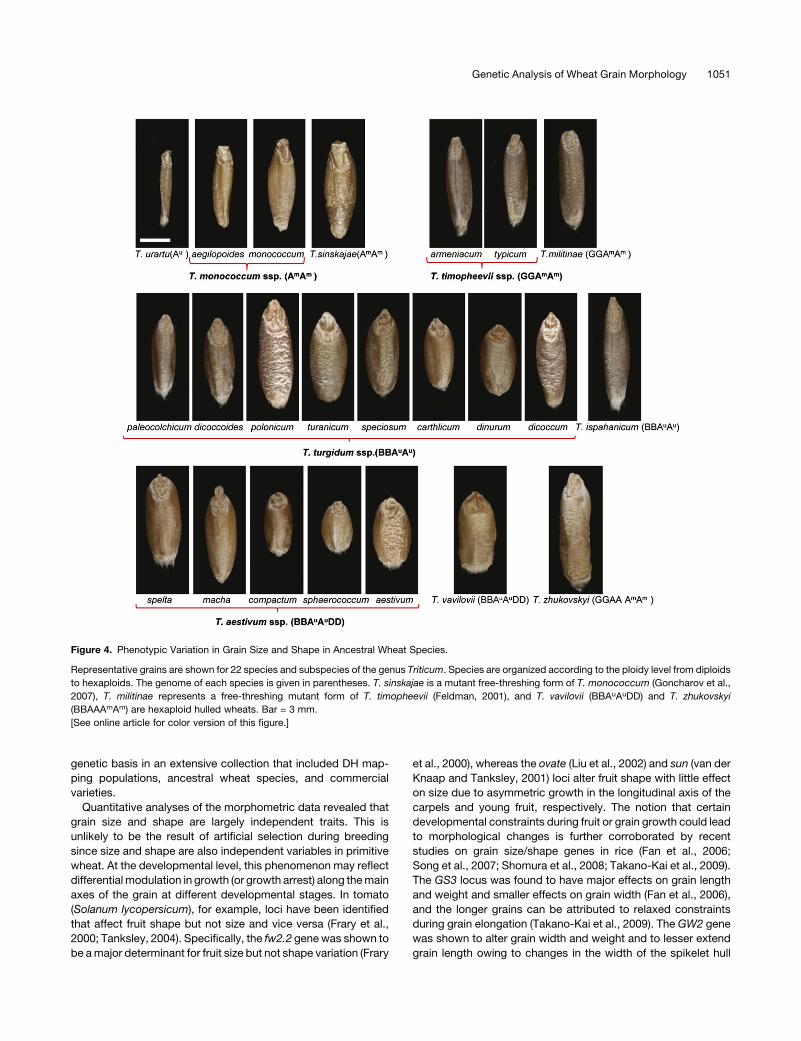
Figure 4. Phenotypic Variation in Grain Size and Shape in Ancestral Wheat Species.
Representative grains are shown for 22 species and subspecies of the genus Triticum. Species are organized according to the ploidy level from diploids
to hexaploids. The genome of each species is given in parentheses. T. sinskajae is a mutant free-threshing form of T. monococcum (Goncharov et al.,
2007), T. militinae represents a free-threshing mutant form of T. timopheevii (Feldman, 2001), and T. vavilovii (BBAuAuDD) and T. zhukovskyi
(BBAAAmAm) are hexaploid hulled wheats. Bar = 3 mm.
[See online article for color version of this figure.]
Genetic Analysis of Wheat Grain Morphology 1051
(Song et al., 2007). Similarly, the SW5 gene has been reported to
effect grain width by modulating the size of the outer glume
(Shomura et al., 2008).
Recent advances in comparative sequence analysis between
wheat and rice genomes have confirmed extensive synteny
between the two species (Sorrells et al., 2003; Quraishi et al.,
2009). This enables us to assess the positional correspondence
between QTL identified in wheat and known QTL or loci that
affect grain morphology in rice. Several QTL for grain weight and
length (Thomson et al., 2003; Li et al., 2004) were reported on rice
chromosome 3 and correspond toQTL for related traits identified
in this study. Specifically, rice QTL for grain weight correspond to
TGW and grain width QTL on the syntenic regions of wheat
chromosomes 5A and 6A. The rice gw3.1 QTL (Thomson et al.,
2003) and its underlying loci GS3 (Fan et al., 2006; Takano-Kai
et al., 2009) correspond to the very strong wheat QTL for grain
size on chromosome 4B. The GS3 effect on grain size is attrib-
uted primarily to alterations in grain length and less so in width
(Fan et al., 2006). However, the grain weight QTL on wheat
chromosome 4B cosegregates consistently only with grain
width QTL, suggesting a different mechanism. It was recently
reported (Li et al., 2010) that the orthologous gene of GS3 in
maize (Zea mays) affects kernel weight but also through a
differentmechanism to that described in rice. TheGW2 locus on
rice chromosome 2 does not correspond to any of the identified
wheat QTL. However, several grain weight, width, and length
rice QTL correspond to grain size (TGW and grain width) wheat
QTL on chromosome 6A. Such orthologous relationships be-
tween different species should remain speculative until positive
confirmation through gene-specific comparative analysis is
provided.
The observed phenotypic structure might reflect an evolution-
ary process in which grain size and shape have been selected
and fixed independently over the wheat domestication. Our
analysis clearly demonstrates that PC1 and PC2 are under the
control of distinctly different genetic components in all of the
mapping populations studied. Even when the various morpho-
metric traits were considered separately, the QTL for either grain
size or grain shape parameters were frequently colocated in the
different mapping populations, indicating that common genetic
components underlie the observed variation in grain morphol-
ogy. Interestingly, there are a number of differences in the QTL
distribution across the populations, even between populations
that share a common parent, showing that identifying back-
ground-specific effects by analyzing multiple populations is
crucial in determining the genetic architecture. This becomes
more apparent when we consider the results from previous
studies, most of which analyzed single populations.
In this study, QTL have been identified in most of the
homeologous groups, but those on chromosomes 1A, 3A, 4B,
5A, and 6A have the largest andmost consistent (across different
populations) effects on grain size and/or shape.
Strong QTL for grain length and grain shape (PC2) were
identified on chromosome 1A in three populations, BxS, SpxR,
and SaxR. Effects for grain length on 1A have been previously
reported. Grain length was negatively affected by chromosome
1A in a disomic population derived from a cross between long
and short grain parental lines (Giura and Saulescu, 1996). A QTL
Figure 5. A Morphometric Model for Variation in Grain Morphology in Ancestral Wheat Species.
Variation in grain shape and size is captured by PC1 and PC2, respectively.
(A) and (B) Component loading for PC1 (A) and PC2 (B), as in Figure 2.
(C) Score distribution for PC1 and PC2. Grains of the species that correspond to extreme size or shape phenotypes (arrows) are shown. Variation
explained by each principal component is shown in parentheses.
[See online article for color version of this figure.]
1052 The Plant Cell
for grain length was identified in a recombinant inbred line
population between two Chinese winter elite varieties at an
equivalent chromosomal position on 1A as theQTL inBxS, SpxR,
and SaxR reported in this study (Sun et al., 2009).
Homoeologous group 3, especially chromosome 3A, has a
strong effect both on grain size and shape across the DH
populations studied here, yet QTL for related traits (grain length
and area) have been reported only in one previously studied
population on chromosome 3B (Campbell et al., 1999). The QTL
for grain size and shape on chromosome 3A identified in this
analysis are of particular interest since their mapping intervals
coincide with the approximate position of the sphaerococcum
locus (Salina et al., 2000). The sphaerococcoidmutation reduces
grain length, thus significantly altering grain shape and size. The
three genesS1,S2, andS3 of the sphaerococcoidmutationwere
mapped on chromosomes 3D, 3B, and 3A, respectively (Salina
et al., 2000). The S3 locus was shown to be located between the
centromeric markers gwm2 and gwm720 on 3A (Salina et al.,
2000). This position corresponds to themapping interval (highest
LOD scores) of QTL for grain length and L/W in AxC and grain
width in BxS. QTL for grain length in SaxR and grain width and
L/W in MxC were adjacent to the S3 locus mapping interval
mentioned above.
Strong grain size QTL have been identified on chromosomes
4B and 4D in the BxS and AxC populations. However, effects of
chromosome 4B on grain length and width have been previously
identified only in one population (Giura and Saulescu, 1996). The
AxC and BxS populations segregate for the Rht-B1 and Rht-D1
homoeoalleles (frequently referred as dwarfing genes), respec-
tively, that were shown to affect grain weight, among other traits
(Flintham et al., 1997). Therefore, the proximity of these grain size
QTL to Rht-B1 and Rht-D1 might indicate further pleiotropic
effects of this loci on other grain size parameters. Chromosome
5A was found to have large effects on both grain size and shape-
related parameters in four of the six populations studied. None of
the previous studies identified QTL for related traits on this
chromosome, but significant associations between loci on 5A
and grain length were reported before (Breseghello and Sorrells,
2006). In this study, strong QTL for grain size-related traits have
been identified on chromosome 6A in threeDHpopulations (AxC,
SaxR, and MxC) and in two previously described studies (Giura
and Saulescu, 1996; Sun et al., 2009). Specifically, QTL for grain
width (Sun et al., 2009) have been detected before at an ap-
proximately equivalent interval as the grain width QTL in the AxC
and SaxR populations. Chromosome 6A was also found to have
a positive effect on FFD (Giura and Saulescu, 1996) consistent
with the effects detected in the AxC and SaxR populations.
Therefore, comparison of the QTL described here with those
identified in other studies showed that allelic variation for some,
for example, effects on 1A and 6A, appear to occur frequently in
diverse germplasm. However, the majority of them appear
unique to this study, most notably effects on 3A, 4B, and 5A.
Morphometric analysis shows that wheat grain evolved from a
long and thin primitive grain to a much wider and shorter modern
grain. Moreover, variation of grain shape appeared significantly
reduced not only in the modern elite varieties but also in the
mapping populations, suggesting that the natural genetic diver-
sity present in the ancestral wheat species has been reduced
during the development of the modern elite cultivars. One
possibility is that diversity in grain shape was reduced as a result
of the polyploidy speciation of T. aestivum. However, hexaploid
wheat retained a relatively large percentage of the nucleotide
diversity of A and B genomes found in the tetraploid ancestors,
suggesting that ploidy differences imposed a weak barrier to
gene flow, at least from the tretraploid ancestor, during the
emergence of the hexaploid wheat (Dvorak et al., 2006; Haudry
et al., 2007). Overrepresentation of grain size and shape QTL in
the A and B genomes further supports this notion. The data
presented here (see Supplemental Table 8 online) indicate that
the phenotypic variation for the main grain shape parameters,
grain length and L/W, has actually increased in the hexaploid
species (T. aestivum ssp; rangeL = 3.1 mm; rangeL/W = 0.91)
Figure 6. Changes in Grain Axial Dimensions in Ancestral and Modern
Wheat.
Frequency distributions for grain width (A), length (B), and L/W (C) in the
DH mapping populations, Triticum species, and wheat varieties.
[See online article for color version of this figure.]
Genetic Analysis of Wheat Grain Morphology 1053
compared with that of the tetraploid ones (T. turgidum ssp;
rangeL = 2.0 mm; rangeL/W = 0.6). The other possible explana-
tions are that the reduction in grain shape variation apparent in
the modern germplasm and elite varieties might have appeared
either at very early stages of the evolution of commonwheat (ssp
aestivum) or at later stages after the emergence of the subspe-
cies.
T. aestivum ssp spelta and ssp macha represent hexaploid
hulled wheats (Feldman, 2001) and were very similar to the
tetraploid species in terms of grain shape (see Supplemental
Table 8 online). It is believed that T. aestivum ssp spelta, at least
the Asiatic type, gave rise to nonhulled or free-threshing common
wheat (ssp aestivum) (Feldman, 2001). Therefore, the reduced
variation in grain shape observed in common wheat may have
been the result of a bottleneck that occurred during the transition
from the hulled to free-threshing form. The lowest trait value in
the hexaploid species is provided by T. aestivum ssp sphaer-
occocum, which is thought to have emerged from T. aestivum
ssp aestivum as a result of mutation at the S gene and imposed a
significant alteration in grain shape (Salina et al., 2000). Thus,
part of the grain shape diversity found in hexaploid wheat (T.
aestivum ssp) has risen relatively recently and most likely after
the emergence of common wheat (ssp aestivum). This then
suggests that strong mutations, such as the sphaeroccocum,
were selected against at the early stages of wheat breeding
possibly because of undesirable pleiotropic effects on other
traits. Further selection at later stages for certain grain morphol-
ogy and greater uniformity among the different varieties could
have limited the genetic variation in the gene pool evenmore and
subsequently resulted in the predominant grain shape found in
the modern elite varieties.
The present genetic and phenotypic structure supports an
emerging model for grain size and shape variation, where grain
size has progressively increased through alterations both in grain
width and length, followed at later stages by modifications in
grain shape largely through changes in grain length. Elucidating
the genetic basis of variation in grain size and shape in wheat is
instrumental to the effort to improve yield potential and process-
ing performance, especially in the current climate where food
security is at the epicenter of crop research worldwide.
METHODS
Genetic Resources and Field Trials
TheDHpopulations and geneticsmaps used in this studywere generated
as was described previously (Snape et al., 2007; Griffiths et al., 2009) and
summarized in Table 1. Specifically, they are as follows: Avalon 3
Cadenza (AxC), Beaver 3 Soissons (BxS), Shamrock 3 Shango (SxS),
Spark3Rialto (SpxR), Malacca3Charger (MxC), and Savannah3Rialto
(SaxR). The populations were grown in randomized, replicated field trials
(three replicates) at Church Farm, Norwich, UK, over two consecutive
years: 2007 and 2008 (AxC and BxS), and 2006 and 2007 (SxS). The
SpxR, MxC, and SaxR populations were grown only in 2007 and 2008,
respectively. The lines were grown in large-yield plots (13 5m2) following
standard agronomic practices. Grain material of primitive wheat acces-
sions was provided by the John Innes Centre Triticeae Collection. The
accession numbers of the species studied are given in Supplemental
Table 8 online, and further information can be found at http://data.jic.
bbsrc.ac.uk/cgi-bin/germplasm/triticeae/.
Morphometric Analysis
Morphometric measurements were performed on 200 to 250 grains/line
using the MARVIN grain analyzer (GTA; Sensorik). Specifically, TGW,
grain width (W), length (L), and grain area were measured. The ratio L/W
and the FFD were calculated. FFD describes the differences in grain
density and the deviation of a shape from a cylindrical form and is given
by: grain weight/(grain length * grain width) (Giura and Saulescu, 1996).
Statistical Analysis
Descriptive statistics and normality tests on the quantitative data were
performed using GenStat v 11. Analysis of variance was performed to
estimate the relative genetic contribution to trait variation for each
population and year. Broad sense heritability was calculated by h2 =
1 2 M2/M1, where M1 and M2 are the mean square values for genotype
and genotype3 environment (for the two years trials), respectively (Knap
et al., 1985). Mean values of the three replicates for each year were used
to calculate the correlation coefficients (Pearson’s correlation and
Spearman’s rho) and for the QTL mapping. PCA was performed on
each population (mean values for each year) and on a population-wide
(P-W) data set using SPPS 12.0. For the extraction of PCs, the correlation
matrix method was used. Only the factors with an eigenvalue $1
according to Kaiser’s criterion were retained (Field, 2005).
QTL and Meta-QTL Analysis
The MapQTL 5.0 software (Van Ooijen, 2004) was used for the analysis of
the quantitative data. Single-interval mapping was initially used to identify
QTL followed by an automatic cofactor selection process (Van Ooijen,
2004). The resulted set of cofactors was then used in composite-interval
mapping. A genome-wide threshold LOD value for significant QTL was
set at 3.1 (P < 0.05) by performing 10,000 permutations of the original
data.
Meta-QTL analysis was performed using Biomercator software v. 2.1.
The published consensus map (Somers et al., 2004) was used as a
reference map upon which the genetic linkage maps of the six popula-
tions were subsequently projected. QTL and 2-LOD confidence intervals
were projected together with the genetic linkage maps. Meta-analysis
was conducted initially for each population and chromosome followed by
a population-wide analysis for meta-QTL across all the traits and years.
The number of meta-QTL present was determined as the model that
minimized the Akaike criterion (Arcade et al., 2004).
Author Contributions
V.C.G., J.W.S., J.H.D., and S.G. conceived and designed the experi-
ments. V.C.G. and A.N. performed the experiments. V.C.G. analyzed the
data. J.S., L.F., L.S., and S.O. provided technical support. V.C.G., J.W.S.,
and J.H.D. wrote the article.
Supplemental Data
The following materials are available in the online version of this article.
Supplemental Figure 1. Frequency Distributions of the Morphomet-
ric Traits for AxC, BxS, and SxS.
Supplemental Figure 2. Frequency Distributions of the Morphomet-
ric Traits for Spark 3 Rialto, Savannah 3 Rialto, and Malacca 3
Charger.
Supplemental Figure 3. QTL Identified for the Morphometric Param-
eters in the Six Mapping Populations.
Supplemental Figure 4. Common Genetic Components for Grain
Size and Shape in the DH Mapping Populations.
1054 The Plant Cell
Supplemental Figure 5. Morphometric Traits for Triticum Species.
Supplemental Table 1. Trait Variation and Heritability in the Parental
Lines and DH Mapping Populations.
Supplemental Table 2. Spearman Rank Correlation Coefficients
between Morphometric Traits.
Supplemental Table 3. Principal Component Analysis on the Map-
ping Populations.
Supplemental Table 4. QTL for the Morphometric Traits in the AxC
Population.
Supplemental Table 5. QTL for the Morphometric Traits in the SxS
and BxS Populations.
Supplemental Table 6. QTL for the Morphometric Traits in the SpxR,
MxC, and SaxR Populations.
Supplemental Table 7. QTL for the Principal Components in the AxC,
SxS, BxS, SpxR, MxC, and SaxR Populations.
Supplemental Table 8. Morphometric Data on Triticum Species.
Supplemental Table 9. Morphometric Data on 61 Commercial
Varieties.
Supplemental Text 1. Details of the QTL Locations and Effects on
Each Homoeologous Group.
ACKNOWLEDGMENTS
We thank Peter Shaw for helpful discussion and comments on the
manuscript and Luzie Wingen for advice on QTL meta-analysis. We also
thank Andrew Davis for photography. This work was supported by
funding from the Biotechnology and Biological Sciences Research
Council through the Crop Science Initiative (Grant BB/E00721x/1).
Received January 19, 2010; revised February 24, 2010; accepted March
18, 2010; published April 2, 2010.
REFERENCES
Arcade, A., Labourdette, A., Falque, M., Mangin, B., Chardon, F.,
Charcosset, A., and Joets, J. (2004). BioMercator: Integrating ge-
netic maps and QTL towards discovery of candidate genes. Bio-
informatics 20: 2324–2326.
Breseghello, F., and Sorrells, M.E. (2006). Association mapping of
kernel size and milling quality in wheat (Triticum aestivum L.) cultivars.
Genetics 172: 1165–1177.
Breseghello, F., and Sorrels, M.E. (2007). QTL analysis of kernel size
and shape in two hexaploid wheat mapping populations. Field Crops
Res. 101: 172–179.
Brown, T.A., Jones, M.K., Powell, W., and Allaby, R.G. (2009). The
complex origins of domesticated crops in the Fertile Crescent. Trends
Ecol. Evol. 24: 103–109.
Campbell, K.G., Bergman, C.J., Gualberto, D.G., Anderson, J.A.,
Giroux, M.J., Hareland, G., Fulcher, R.G., Sorrells, M.E., and
Finney, P.L. (1999). Quantitative trait loci associated with kernel traits
in a soft x hard wheat cross. Crop Sci. 39: 1184–1195.
Dholakia, B.B., Ammiraju, J.S.S., Singh, H., Lagu, M.D., Roder, M.S.,
Rao, V.S., Dhaliwal, H.S., Ranjekar, P.K., Gupta, V.S., and Weber,
W.E. (2003). Molecular marker analysis of kernel size and shape in
bread wheat. Plant Breed. 122: 392–395.
Dubcovsky, J., and Dvorak, J. (2007). Genome plasticity a key factor in
the success of polyploid wheat under domestication. Science 316:
1862–1866.
Dvorak, J., Akhunov, E.D., Akhunov, A.R., Deal, K.R., and Luo, M.C.
(2006). Molecular characterization of a diagnostic DNA marker for
domesticated tetraploid wheat provides evidence for gene flow from
wild tetraploid wheat to hexaploid wheat. Mol. Biol. Evol. 23: 1386–
1396.
Evers, A.D. (2000). Grain size and morphology: Implications for quality.
In Wheat Structure, Biochemistry and Functionality, D. Schofield, ed
(London: Royal Society of Chemistry), pp. 19–24.
Evers, A.D., Cox, R.I., Shaheedullah, M.Z., and Withey, R.P. (1990).
Predicting milling extraction rate by image analysis of wheat grains.
Asp. Appl. Biol. 25: 417–426.
Fan, C., Xing, Y., Mao, H., Lu, T., Han, B., Xu, C., Li, X., and Zhang, Q.
(2006). GS3, a major QTL for grain length and weight and minor QTL
for grain width and thickness in rice, encodes a putative transmem-
brane protein. Theor. Appl. Genet. 112: 1164–1171.
Feldman, M. (2001). Origin of cultivated wheat. In The World Wheat
Book: A History of Wheat Breeding, A.P. Bonjean, ed (Andover, UK:
Intercept), pp. 3–56.
Feng, X., Wilson, Y., Bowers, J., Kennaway, R., Bangham, A.,
Hannah, A., Coen, E., and Hudson, A. (2009). Evolution of allometry
in antirrhinum. Plant Cell 21: 2999–3007.
Field, A. (2005). Exploratory factors analysis. In Discovering Statistics
Using SPSS, D.B. Wright, ed (London: SAGE Publications), pp.
619–680.
Flintham, J.E., Borner, A., Worland, A.J., and Gale, M.D. (1997).
Optimizing wheat grain yield: Effects of Rht (gibberellin-insensitive)
dwarfing genes. J. Agric. Sci. 128: 11–25.
Frary, A., Nesbitt, T.C., Grandillo, S., Knaap, E., Cong, B., Liu, J.,
Meller, J., Elber, R., Alpert, K.B., and Tanksley, S.D. (2000). fw2.2:
A quantitative trait locus key to the evolution of tomato fruit size.
Science 289: 85–88.
Fuller, D.Q. (2007). Contrasting patterns in crop domestication and
domestication rates: Recent archaeobotanical insights from the Old
World. Ann. Bot. (Lond.) 100: 903–924.
Giura, A., and Saulescu, N.N. (1996). Chromosomal location of genes
controlling grain size in a large grained selection of wheat (Triticum
aestivum L.). Euphytica 89: 77–80.
Golovnina, K.A., Glushkov, S.A., Blinov, A.G., Mayorov, V.I.,
Adkison, L.R., and Goncharov, N.P. (2007). Molecular phylogeny
of the genus Triticum L. Plant Syst. Evol. 264: 195–216.
Goncharov, N.P., Kondratenko, E., Bannikova, S.V., Konovalov,
A.A., and Golovnina, K.A. (2007). Comparative genetic analysis of
diploid naked wheat Triticum sinskajae and the progenitor T. mono-
coccum accession. Russ. J. Genet. 43: 1248–1256.
Griffiths, S., et al. (2009). Meta-QTL analysis of the genetic control of
ear emergence in elite European winter wheat germplasm. Theor.
Appl. Genet. 119: 383–395.
Haudry, A., Cenci, A., Ravel, C., Bataillon, T., Brunel, D., Poncet, C.,
Hochu, I., Poirier, S., Santoni, S., Glemin, S., and David, J. (2007).
Grinding up wheat: A massive loss of nucleotide diversity since
domestication. Mol. Biol. Evol. 24: 1506–1517.
Holland, J.B. (2007). Genetic architecture of complex traits in plants.
Curr. Opin. Plant Biol. 10: 156–161.
Jolliffe, I.T. (2002). Principal Component Analysis. (New York: Springer).
Knap, S.J., Stroup, W.W., and Ross, W.M. (1985). Exact confidence
intervals for heritability on a progeny mean basis. Crop Sci. 25:
192–194.
Kovach, M.J., Sweeney, M.T., and McCouch, S.R. (2007). New
insights into the history of rice domestication. Trends Genet. 23:
578–587.
Langlade, N.B., Feng, X., Dransfield, T., Copsey, L., Hanna, A.I.,
Genetic Analysis of Wheat Grain Morphology 1055
Thebaud, C., Bangham, A., Hudson, A., and Coen, E. (2005).
Evolution through genetically controlled allometry space. Proc. Natl.
Acad. Sci. USA 102: 10221–10226.
Li, J., Thomson, M., and McCouch, S.R. (2004). Fine mapping of a
grain-weight quantitative trait locus in the pericentromeric region of
rice chromosome 3. Genetics 168: 2187–2195.
Li, Q., Yang, X., Bai, G., Warburton, M.L., Mahuku, G., Gore, M., Dai,
J., Li, J., and Yan, J. (2010). Cloning and characterization of a
putative GS3 ortholog involved in maize kernel development. Theor.
Appl. Genet. 120: 753–763.
Liu, J., Van Eck, J., Cong, B., and Tanksley, S.D. (2002). A new class
of regulatory genes underlying the cause of pear-shaped tomato fruit.
Proc. Natl. Acad. Sci. USA 99: 13302–13306.
Millar, S.J., Whitworth, M.B., and Evers, A.D. (1997). Image analysis:
The prediction and assessment of wheat quality and milling proper-
ties. In Proceedings of the International Wheat Quality Conference,
J.L. Steele and K.O. Chung, eds (Manhattan, KS: Grain Industry
Alliance), pp. 141–151.
Quraishi, U.M., Abrouk, M., Bolot, S., Pont, C., Throude, M., Guilhot,
N., Confolent, C., Bortolini, F., Praud, S., Murigneux, A., Charmet,
G., and Salse, J. (2009). Genomics in cereals: From genome-wide
conserved orthologous set (COS) sequences to candidate genes for
trait dissection. Funct. Integr. Genomics 9: 473–484.
Salina, E., Borner, A., Leonova, I., Korzun, V., Laikova, L.,
Maystrenko, O., and Roder, M.S. (2000). Microsatellite mapping
of the induced sphaerococcoid mutation genes in Triticum aestivum.
Theor. Appl. Genet. 100: 686–689.
Shomura, A., Izawa, T., Ebana, K., Ebitani, T., Kanegae, H., Konishi,
S., and Yano, M. (2008). Deletion in a gene associated with grain size
increased yields during rice domestication. Nat. Genet. 40: 1023–
1028.
Snape, J., Foulkes, M., Simmonds, J., Leverington, M., Fish, L.,
Wang, Y., and Ciavarrella, M. (2007). Dissecting gene 3 environ-
mental effects on wheat yields via QTL and physiological analysis.
Euphytica 154: 401–408.
Somers, D.J., Isaac, P., and Edwards, K. (2004). A high-density
microsatellite consensus map for bread wheat (Triticum aestivum L.).
Theor. Appl. Genet. 109: 1105–1114.
Song, X.J., Huang, W., Shi, M., Zhu, M.Z., and Lin, H.X. (2007). A QTL
for rice grain width and weight encodes a previously unknown RING-
type E3 ubiquitin ligase. Nat. Genet. 39: 623–630.
Sorrells, M.E., et al. (2003). Comparative DNA sequence analysis of
wheat and rice genomes. Genome Res. 13: 1818–1827.
Stevens, J.P. (2009). Exploratory and confirmatory factor analysis. In
Applied Multivariate Statistics for the Social Sciences (New York:
Routledge, Taylor & Francis Group), pp. 325–381.
Sun, X.-Y., Wu, K., Zhao, Y., Kong, F.-M., Han, G.-Z., Jiang, H.-M.,
Huang, X.-J., Li, R.-J., Wang, H.-G., and Li, S.-S. (2009). QTL
analysis of kernel shape and weight using recombinant inbred lines in
wheat. Euphytica 165: 615–624.
Takano-Kai, N., Jiang, H., Kubo, T., Sweeney, M., Matsumoto,
T., Kanamori, H., Padhukasahasram, B., Bustamante, C.,
Yoshimura, A., Doi, K., and McCouch, S. (2009). Evolutionary
history of GS3, a gene conferring grain length in rice. Genetics 182:
1323–1334.
Tanksley, S.D. (2004). The genetic, developmental, and molecular
bases of fruit size and shape variation in tomato. Plant Cell 16:
S181–S189.
Thomson, M.J., Tai, T.H., McClung, A.M., Lai, X.H., Hinga, M.E.,
Lobos, K.B., Xu, Y., Martinez, C.P., and McCouch, S.R. (2003).
Mapping quantitative trait loci for yield, yield components and mor-
phological traits in an advanced backcross population between Oryza
rufipogon and the Oryza sativa cultivar Jefferson. Theor. Appl.
Genet.107: 479–493.
van der Knaap, E., and Tanksley, S.D. (2001). Identification and
characterization of a novel locus controlling early fruit development
in tomato. Theor. Appl. Genet. 103: 353–358.
Van Ooijen, J.W. (2004). MapQTL: Software for the Mapping of Quan-
titative Trait Loci in Experimental Populations. (Wageningen, The
Netherlands: Kyazma).
1056 The Plant Cell
DOI 10.1105/tpc.110.074153; originally published online April 2, 2010; 2010;22;1046-1056Plant Cell
Sayers, John H. Doonan and John W. SnapeVasilis C. Gegas, Aida Nazari, Simon Griffiths, James Simmonds, Lesley Fish, Simon Orford, Liz
A Genetic Framework for Grain Size and Shape Variation in Wheat
This information is current as of February 12, 2018
Supplemental Data /content/suppl/2010/04/02/tpc.110.074153.DC2.html /content/suppl/2010/04/02/tpc.110.074153.DC1.html
References /content/22/4/1046.full.html#ref-list-1
This article cites 38 articles, 7 of which can be accessed free at:
Permissions https://www.copyright.com/ccc/openurl.do?sid=pd_hw1532298X&issn=1532298X&WT.mc_id=pd_hw1532298X
eTOCs http://www.plantcell.org/cgi/alerts/ctmain
Sign up for eTOCs at:
CiteTrack Alerts http://www.plantcell.org/cgi/alerts/ctmain
Sign up for CiteTrack Alerts at:
Subscription Information http://www.aspb.org/publications/subscriptions.cfm
is available at:Plant Physiology and The Plant CellSubscription Information for
ADVANCING THE SCIENCE OF PLANT BIOLOGY © American Society of Plant Biologists