Embed Size (px)
Citation preview
A Geochemical Approach to DetermineSources and Movement of Saline Groundwaterin a Coastal Aquiferby Robert Anders1, Gregory O. Mendez2, Kiyoto Futa3, and Wesley R. Danskin2
AbstractGeochemical evaluation of the sources and movement of saline groundwater in coastal aquifers can aid in the initial mapping
of the subsurface when geological information is unavailable. Chloride concentrations of groundwater in a coastal aquifer near SanDiego, California, range from about 57 to 39,400 mg/L. On the basis of relative proportions of major-ions, the chemical compositionis classified as Na-Ca-Cl-SO4, Na-Cl, or Na-Ca-Cl type water. δ2H and δ18O values range from −47.7‰ to −12.8‰ and from−7.0‰ to −1.2‰, respectively. The isotopically depleted groundwater occurs in the deeper part of the coastal aquifer, and theisotopically enriched groundwater occurs in zones of sea water intrusion. 87Sr/86Sr ratios range from about 0.7050 to 0.7090, anddiffer between shallower and deeper flow paths in the coastal aquifer. 3H and 14C analyses indicate that most of the groundwaterwas recharged many thousands of years ago. The analysis of multiple chemical and isotopic tracers indicates that the sourcesand movement of saline groundwater in the San Diego coastal aquifer are dominated by: (1) recharge of local precipitation inrelatively shallow parts of the flow system; (2) regional flow of recharge of higher-elevation precipitation along deep flow pathsthat freshen a previously saline aquifer; and (3) intrusion of sea water that entered the aquifer primarily during premodern times.Two northwest-to-southeast trending sections show the spatial distribution of the different geochemical groups and suggest thesubsurface in the coastal aquifer can be separated into two predominant hydrostratigraphic layers.
IntroductionWorld population centers tend to concentrate in
coastal areas, and many of these population centersrely on groundwater to supplement their surface-watersupplies for domestic and agricultural consumption. Theoccurrence of saline groundwater in coastal aquifers,however, can limit the use of this local resource. Manystudies in coastal aquifers have focused on sea waterintrusion as the source of high-salinity groundwater, andthe process and mechanism of sea water intrusion are wellunderstood (Richter and Kreitler 1993; Bear et al. 1999).Although saline groundwater can result from recent seawater intrusion induced by groundwater pumping, othersources of salinity in coastal aquifers are not directlyrelated to sea water intrusion. These other sources includeleakage of water from contaminated shallow aquifers
1Corresponding author: USGS California Water ScienceCenter, 4165 Spruance Rd., Ste. 200, San Diego, CA 92101;[email protected]
2USGS California Water Science Center, 4165 Spruance Rd.,Ste. 200, San Diego, CA 92101.
3USGS Denver Federal Center, Box 25046, MS 963, Bldg. 21,Denver, CO 80225.
Received June 2012, accepted July 2013.© 2013, National Ground Water Association.doi: 10.1111/gwat.12108
through failed well casings, agricultural return flows,saline water entrapped in clay layers, connate saline waterfrom poorly flushed aquifers, and upconing of underlyingbrines (Jones et al. 1999; Vengosh et al. 2002). Theimpact of these other sources often is not consideredand consequently, the source zones, movement, andcomposition of saline groundwater may be misinterpretedor not fully understood.
Like other coastal areas throughout the world (Ven-gosh et al. 1999, 2005; Fakir et al. 2002; Capaccioni et al.2005; Chen and Jiao 2007) where the presence of salinegroundwater degrades the quality of water in aquifers,future development of the local groundwater resourcesin the San Diego area of southern California is limitedby the presence of saline groundwater in some parts ofthe coastal aquifer (Danskin and Church 2005). Unlike inother areas with significant oil, gas, or water resources,investigations of groundwater in the San Diego area havebeen sporadic (California Department of Water Resources1967) and the state of knowledge about this coastal aquiferrelies mostly on mapping of surficial geology (Ellis andLee 1919; Abbott 1999).
Therefore, in contrast to most groundwater studieswhich start with known subsurface geology and thenanalyze groundwater quality to better define groundwaterflow paths and hydrogeologic units, this study uses
NGWA.org Groundwater 1
geochemistry as an aid in the initial mapping of thesubsurface. In particular, this study uses a chemical andisotopic approach to determine the sources and movementof saline groundwater in the San Diego coastal aquifer.Chemical and isotopic data were collected from sevenmultiple-depth monitoring-well sites near the San Diegocoastline at discrete intervals to depths of more than600 m. The groundwater samples were analyzed formajor and minor ions; the stable isotopes of hydrogen,oxygen, and strontium; and the radioactive isotopes oftritium and carbon-14. Each chemical and isotopic tracerpreserves some aspect of the hydrologic history of thegroundwater ranging from the chemical composition ofthe groundwater (major and minor ions), to the sourceof water (stable isotopes of oxygen and hydrogen), to thetypes of rock encountered in the groundwater flow system(strontium isotopes), to time-since-recharge (tritium andcarbon-14). No single tracer provides all the neededinformation to define the source and movement of salinegroundwater, but when used together these geochemicaltracers can aid local water agencies in mapping thesubsurface and constructing a conceptual hydrogeologicframework of a coastal aquifer.
Hydrogeologic SettingThe study area consists of five major rivers (San
Dieguito, San Diego, Sweetwater, Otay, and Tijuana) thatstart in 2000-m high mountains, flow across the coastalhills and terraces, and empty into the ocean (Figure 1). Thearea extends from the drainage-basin divide formed by theLaguna Mountains, to the western edge of the continentalshelf beneath the Pacific Ocean. The northern and south-ern boundaries also correspond to drainage-basin divides.
The climate in the coastal San Diego area generallyis mild, with temperatures averaging 18 ◦C and averageannual precipitation ranging from 25 to 33 cm (Wrightand Belitz 2011). What precipitation does fall, mostlyas rain and nearly all during the winter months, quicklyruns off to the Pacific Ocean. Several small reservoirsin the area capture some local runoff, but they are usedprimarily to store imported water. On average, San Diegomust import nearly 90% of its water from other areas,specifically northern California and the Colorado River(City of San Diego 2011).
Much of the coastal San Diego area overlies a pull-apart structural basin formed by strike-slip faulting, withnormal faulting on the lateral margins (Keller and Ward2001). The major rivers cut obliquely across these tec-tonically active features, creating narrow valleys that aresuccessively eroded and refilled with sediment in responseto uplift and sea-level changes (Hanson et al. 2009).
The largest volume of groundwater recharge withinthe study area occurs east of a band of metavolcanics thatdivide the coastal sediment from the higher elevation hardrock (Flint et al. 2012). Although some groundwater isextracted from low-capacity wells in the hard rock, mostpotable groundwater in the San Diego area is extractedfrom wells in the coastal sediment. These wells range
in depth from about 50 to 250 m, and are believed toextract water from the Pliocene San Diego Formationand overlying Quaternary deposits. Groundwater with agreater salinity is found in some parts of the San DiegoFormation and the underlying Eocene sediment; however,the distribution and source of the saline water are notknown (Huntley et al. 1998). Similarly, only limitedinformation is available about the areal and verticaldistribution of aquifer characteristics. Even the boundariesbetween the Quaternary deposits and the San DiegoFormation, and between the San Diego Formation andunderlying older sediment, are uncertain.
ApproachIn 2001, local water agencies and the United States
Geological Survey (USGS) began a comprehensive geo-logic, hydrologic, and geochemical investigation of thegroundwater resources in the coastal San Diego area(http://ca.water.usgs.gov/sandiego). An integral part of theinvestigation was the installation of 11 USGS multiple-depth monitoring-well sites, each with as many as 6monitoring wells, for the collection of groundwater sam-ples from discrete intervals to depths of more than 600m. The seven USGS multiple-depth monitoring-well siteswhere water-quality samples were collected for this studyare listed in Table S1 (Supporting Information). The loca-tions of these seven multiple-depth monitoring-well siteswere chosen to define the hydrogeologic setting of thecoastal aquifer (refer to Figure 1). The six domestic wellswhere groundwater samples were collected are located inthe fractured crystalline rock in the eastern part of SanDiego County.
Data CollectionGroundwater samples were collected using a variable-
speed submersible Bennett sampling pump (BennettSample Pumps, Inc., Amarillo, Texas) and processedin the field following USGS field-sampling procedures(U.S. Geological Survey, variously dated). Water sampleswere analyzed for major and minor ions at the USGSNational Water-Quality Laboratory (NWQL) in Denver,Colorado, using methods described generally by Fishmanand Friedman (1989) and Fishman (1993).
Deuterium (2H) and oxygen-18 (18O) are stableisotopes that were used in this study to identify differentsources of recharge to the coastal aquifer (Clark andFritz 1997). 2H and 18O values are expressed as δ2Hand δ18O in per mil (‰) deviation from the 2H/1H and18O/16O ratios in a standard known as the Vienna StandardMean Ocean Water (VSMOW), which is assigned δ2Hand δ18O values of zero ‰ (Gat and Gonfiantini 1981).δ2H and δ18O samples were analyzed at the USGS StableIsotope Laboratory in Reston, Virginia, with a precision(two-sigma) of 2 and 0.2 ‰, respectively, using methodsdescribed by Epstein and Mayeda (1953), Coplen et al.(1991), and Coplen (1994).
2 R. Anders et al. Groundwater NGWA.org

Figure 1. Map showing study area and the location of the five major coastal rivers (San Dieguito, San Diego, Sweetwater,Otay, and Tijuana) in the San Diego area, California.
Strontium (Sr) is an alkaline-earth element withsimilar geochemical behavior to calcium in naturalsystems and has four natural stable isotopes: 84Sr, 86Sr,87Sr, and 88Sr (Shand et al. 2009). Some of the 87Sr havebeen formed by the beta decay of 87Rb with a half-life of48.8 billion years. Sr isotopic fractionation during mostgeochemical reactions is small, making Sr concentrationsand strontium isotope (87Sr/86Sr) ratios particularly usefulfor detecting mixing among waters of different sources,as well as in characterizing the effects of water-rockinteraction (Jørgensen et al. 2008). Sr and 87Sr/86Sranalyses were done in the USGS Yucca Mountain ProjectBranch Strontium Isotope Laboratory (now located in theCrustal Geophysics and Geochemistry Science Centerin Denver, Colorado). Sr samples were analyzed usingmethods described by Garbarino (1999). For 87Sr/86Sranalyses, samples were evaporated on rhenium (Re)filaments following ion-exchange and analyzed on anupgraded (Spectromat) Finnigan MAT262, thermo-ionization mass spectrometer (TIMS). For instrumentfractionation, Sr isotope ratios were normalized to an87Sr/86Sr value of 0.1194 and 87Sr/86Sr values wereadjusted accordingly by a power law. The average87Sr/86Sr value, the NIST standard SRM-987, was0.710280 during this study with a 2-sigma internalprecision of 0.000015.
Tritium (3H) is the radioactive isotope of hydrogen;it has a half-life of 12.32 years (Lucas and Unterweger2000). Because of its short half-life, tritium is useful foridentifying water that has been in the hydrologic cyclemore or less than about 60 years (Clark and Fritz 1997).Tritium samples were analyzed at the USGS Isotope
Tracers Laboratory in Menlo Park, California, by liquidscintillation after electrolytic enrichment as described byThatcher et al. (1977). Tritium is reported as an activity(pico-Curies per liter; pCi/L) and related to tritium units(TUs) by the conversion factor: 1 TU = 3.2 pCi/L; eachTU equals one 3H atom in 1018 atoms of hydrogen. Theactivity of tritium is reported with a two-sigma estimateof precision.
Carbon-14 (14C), the naturally occurring radioactiveisotope of carbon, has a half-life of 5730 years and canbe used to determine the age (time since recharge) ofgroundwater on scales ranging from recent to tens ofthousands of years (Clark and Fritz 1997). Carbon-13and carbon-14 analyses were performed at the WoodsHole Oceanographic Institution, National Ocean SciencesAccelerator Mass Spectrometry Facility using methodsdescribed by Karlen et al. (1964), Olsson (1970), Stuiverand Polach (1977), Stuiver (1980), and Beukins (1992).The reference material for carbon-13 is Vienna Pee DeeBelemnite (VPDB), which is assigned a δ13C value of0‰ (Coplen 1994). The activity of carbon-14, expressedas percent modern carbon (pmc), is reported with a one-sigma estimate of precision relative to the 1950 NationalBureau of Standards oxalic acid standard (Stuiver andPolach 1977; Wigley and Muller 1981).
Results
Major- and Minor-Ion ChemistryChemical data collected from the seven USGS
multiple-depth monitoring-well sites and six domestic
NGWA.org R. Anders et al. Groundwater 3
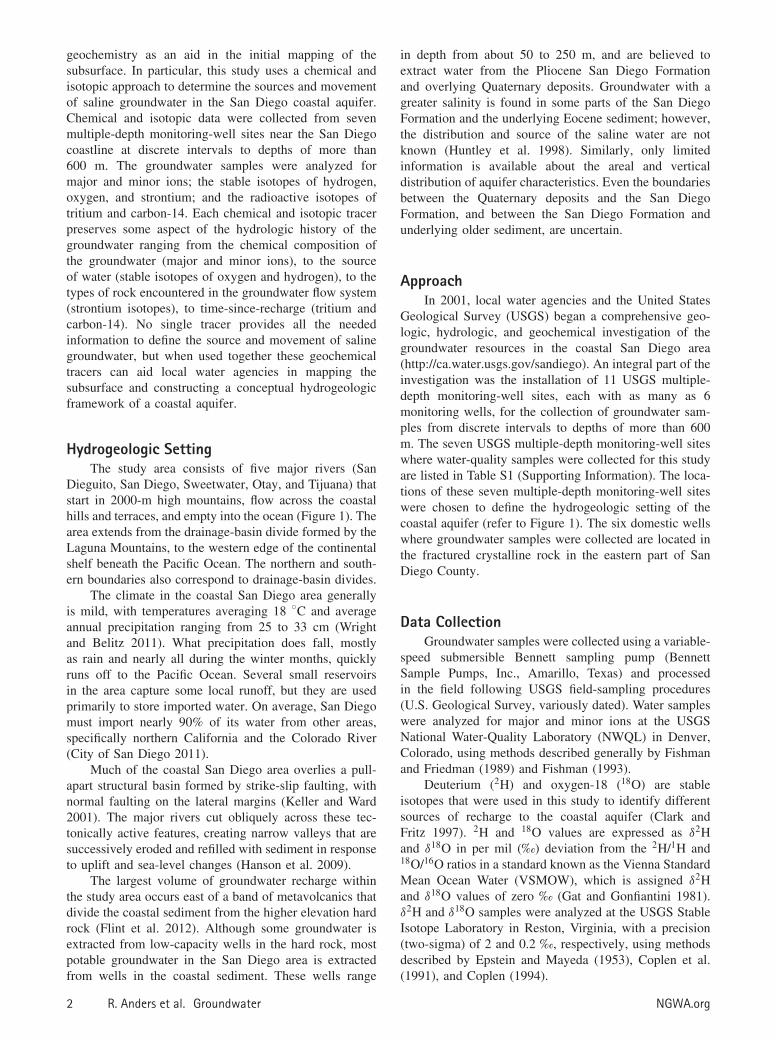
wells in San Diego County, California, are presentedin Table S2. The major-ion chemistry of groundwatersamples in the coastal San Diego area is shown bythe trilinear diagram in Figure 2. A trilinear diagramdepicts the relative proportions of major ions on a charge-equivalent basis for comparison and classification of watersamples independent of total analyte concentrations (Hem1985). On the basis of the major-ion data, the chemicalcomposition of groundwater samples from the sevenmultiple-depth monitoring-well sites and six domesticwells can be classified into three groups.
Relative proportions of major ions in group 1indicate the chemical composition can be classified assodium-calcium-chloride-sulfate (Na-Ca-Cl-SO4) typewater. Group 1 is represented by 14 monitoring wells(SDCC6; SDEP3-5; SDMC5; SDNB2; SDOR3, 5;SDOT3-5; SDSW4-6; Table S2). The chemical composi-tion of group 2 is classified as Na-Cl type water and isrepresented by 12 monitoring wells (SDCC1-5; SDEP1,2; SDOR1, 2; SDSW1-3; Table S2). Samples which plotin the bottom-right portion of the diamond in Figure 2 areconsidered a subset of group 2 and are represented by twomonitoring wells (SDOT1, 2; Table S2). The chemicalcomposition of group 3 can be classified as primarily aNa-Ca-Cl type water and is represented by eight mon-itoring wells (SDMC1-4; SDNB1, 3-5; Table S2). Therelative proportions of major ions in group 3 resemble
the major-ion composition of sea water (Hem 1985). Thesix domestic well samples located in the eastern part ofthe study area have compositions most similar to group1, but have slightly greater proportions of Ca and HCO3.
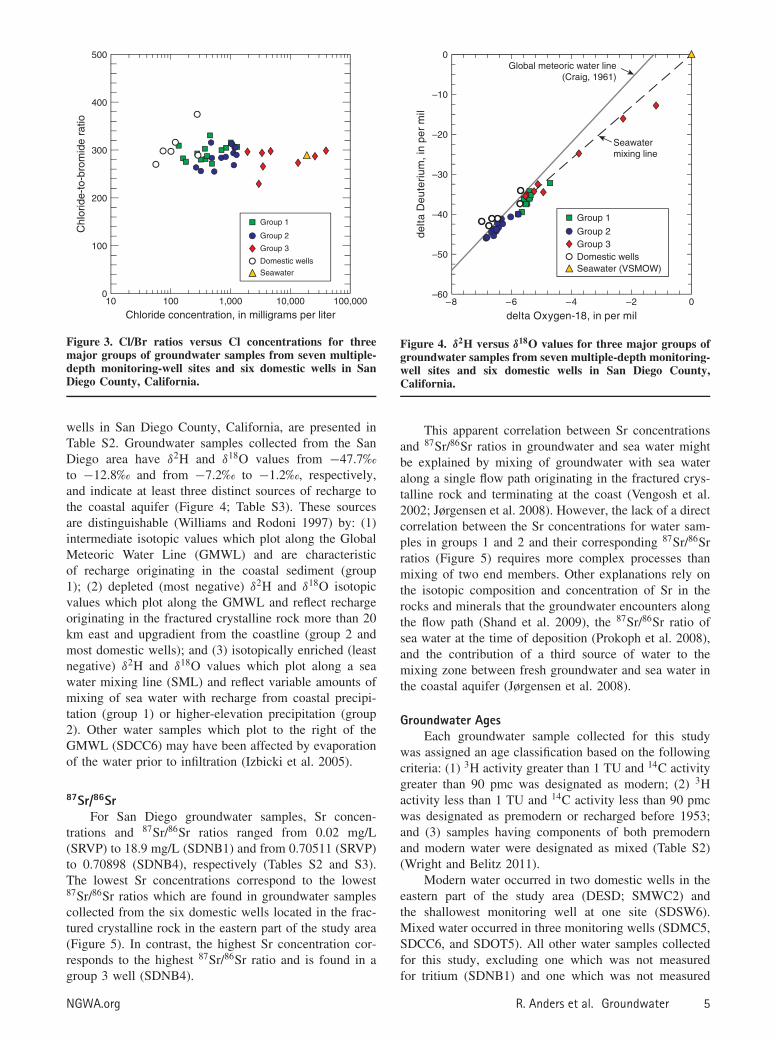
The chloride/bromide mass (Cl/Br) ratio in sea wateris about 285 so most natural waters have a ratio close tothis value; typical Cl/Br ratios in coastal groundwater areclose to 290 (Davis et al. 1998). Although Cl and Br arehighly soluble, and both halides are typically conservativeduring subsurface transport (Jones et al. 1999), Br isslightly more soluble than Cl. As a result, during theevaporation process the insoluble residue (evaporite salt)is preferentially enriched in Cl and the residual solutionis enriched in Br. The net result is that the Cl/Br ratio ingroundwater samples affected by dissolution of halite insalt beds can be higher than 4000 (Davis et al. 1998). Theaverage Cl/Br ratio for groundwater samples in groups1 and 2 is about 294 (s.d. = 22.8) (Figure 3; Table S2).The Cl/Br ratio for groundwater samples close to the seawater value indicates that chloride concentrations greaterthan sea water (SDNB3, 4) likely result from evaporatedsea water rather than dissolution of halites (Davis et al.1998; Faye et al. 2005).
Stable IsotopesThe isotopic data collected from the seven USGS
multiple-depth monitoring-well sites and six domestic
Figure 2. Trilinear diagram showing the relative proportions of major ions for three major groups of groundwater samplesfrom seven multiple-depth monitoring-well sites and six domestic wells in San Diego County, California.
4 R. Anders et al. Groundwater NGWA.org
Group 1
Group 2
Group 3
Domestic wells
Seawater
Chl
orid
e-to
-bro
mid
e ra
tio
0
100
200
300
400
500
Chloride concentration, in milligrams per liter10 100 1,000 10,000 100,000
Figure 3. Cl/Br ratios versus Cl concentrations for threemajor groups of groundwater samples from seven multiple-depth monitoring-well sites and six domestic wells in SanDiego County, California.
wells in San Diego County, California, are presented inTable S2. Groundwater samples collected from the SanDiego area have δ2H and δ18O values from −47.7‰to −12.8‰ and from −7.2‰ to −1.2‰, respectively,and indicate at least three distinct sources of recharge tothe coastal aquifer (Figure 4; Table S3). These sourcesare distinguishable (Williams and Rodoni 1997) by: (1)intermediate isotopic values which plot along the GlobalMeteoric Water Line (GMWL) and are characteristicof recharge originating in the coastal sediment (group1); (2) depleted (most negative) δ2H and δ18O isotopicvalues which plot along the GMWL and reflect rechargeoriginating in the fractured crystalline rock more than 20km east and upgradient from the coastline (group 2 andmost domestic wells); and (3) isotopically enriched (leastnegative) δ2H and δ18O values which plot along a seawater mixing line (SML) and reflect variable amounts ofmixing of sea water with recharge from coastal precipi-tation (group 1) or higher-elevation precipitation (group2). Other water samples which plot to the right of theGMWL (SDCC6) may have been affected by evaporationof the water prior to infiltration (Izbicki et al. 2005).
87Sr/86SrFor San Diego groundwater samples, Sr concen-
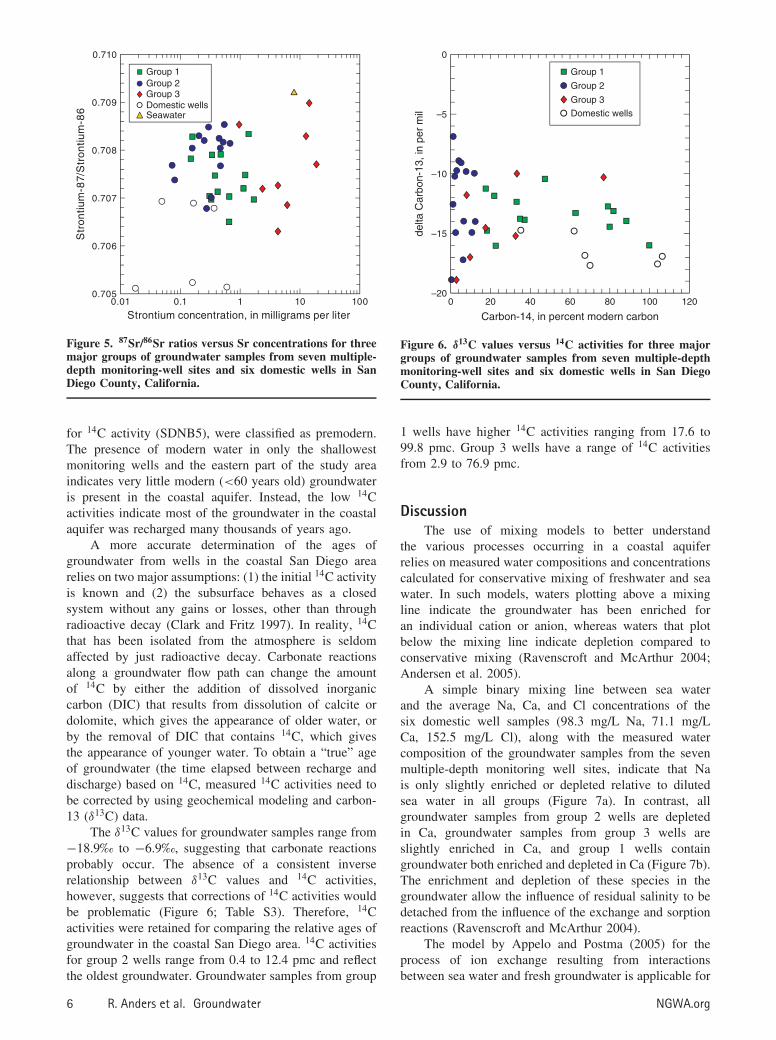
trations and 87Sr/86Sr ratios ranged from 0.02 mg/L(SRVP) to 18.9 mg/L (SDNB1) and from 0.70511 (SRVP)to 0.70898 (SDNB4), respectively (Tables S2 and S3).The lowest Sr concentrations correspond to the lowest87Sr/86Sr ratios which are found in groundwater samplescollected from the six domestic wells located in the frac-tured crystalline rock in the eastern part of the study area(Figure 5). In contrast, the highest Sr concentration cor-responds to the highest 87Sr/86Sr ratio and is found in agroup 3 well (SDNB4).
Seawatermixing line
Global meteoric water line(Craig, 1961)
delta
Deu
teri
um, i
n pe
r m
il
0
–10
–20
–30
–40
–50
–60–8 –6 –4 –2 0
delta Oxygen-18, in per mil
Group 1
Group 2Group 3Domestic wellsSeawater (VSMOW)
Figure 4. δ2H versus δ18O values for three major groups ofgroundwater samples from seven multiple-depth monitoring-well sites and six domestic wells in San Diego County,California.
This apparent correlation between Sr concentrationsand 87Sr/86Sr ratios in groundwater and sea water mightbe explained by mixing of groundwater with sea wateralong a single flow path originating in the fractured crys-talline rock and terminating at the coast (Vengosh et al.2002; Jørgensen et al. 2008). However, the lack of a directcorrelation between the Sr concentrations for water sam-ples in groups 1 and 2 and their corresponding 87Sr/86Srratios (Figure 5) requires more complex processes thanmixing of two end members. Other explanations rely onthe isotopic composition and concentration of Sr in therocks and minerals that the groundwater encounters alongthe flow path (Shand et al. 2009), the 87Sr/86Sr ratio ofsea water at the time of deposition (Prokoph et al. 2008),and the contribution of a third source of water to themixing zone between fresh groundwater and sea water inthe coastal aquifer (Jørgensen et al. 2008).
Groundwater AgesEach groundwater sample collected for this study
was assigned an age classification based on the followingcriteria: (1) 3H activity greater than 1 TU and 14C activitygreater than 90 pmc was designated as modern; (2) 3Hactivity less than 1 TU and 14C activity less than 90 pmcwas designated as premodern or recharged before 1953;and (3) samples having components of both premodernand modern water were designated as mixed (Table S2)(Wright and Belitz 2011).
Modern water occurred in two domestic wells in theeastern part of the study area (DESD; SMWC2) andthe shallowest monitoring well at one site (SDSW6).Mixed water occurred in three monitoring wells (SDMC5,SDCC6, and SDOT5). All other water samples collectedfor this study, excluding one which was not measuredfor tritium (SDNB1) and one which was not measured
NGWA.org R. Anders et al. Groundwater 5
0.010.705
0.706
0.707
0.708
0.709
0.710
0.1 1 10 100
Strontium concentration, in milligrams per liter
Str
ontiu
m-8
7/S
tron
tium
-86
Group 1Group 2Group 3Domestic wellsSeawater
Figure 5. 87Sr/86Sr ratios versus Sr concentrations for threemajor groups of groundwater samples from seven multiple-depth monitoring-well sites and six domestic wells in SanDiego County, California.
for 14C activity (SDNB5), were classified as premodern.The presence of modern water in only the shallowestmonitoring wells and the eastern part of the study areaindicates very little modern (<60 years old) groundwateris present in the coastal aquifer. Instead, the low 14Cactivities indicate most of the groundwater in the coastalaquifer was recharged many thousands of years ago.
A more accurate determination of the ages ofgroundwater from wells in the coastal San Diego arearelies on two major assumptions: (1) the initial 14C activityis known and (2) the subsurface behaves as a closedsystem without any gains or losses, other than throughradioactive decay (Clark and Fritz 1997). In reality, 14Cthat has been isolated from the atmosphere is seldomaffected by just radioactive decay. Carbonate reactionsalong a groundwater flow path can change the amountof 14C by either the addition of dissolved inorganiccarbon (DIC) that results from dissolution of calcite ordolomite, which gives the appearance of older water, orby the removal of DIC that contains 14C, which givesthe appearance of younger water. To obtain a “true” ageof groundwater (the time elapsed between recharge anddischarge) based on 14C, measured 14C activities need tobe corrected by using geochemical modeling and carbon-13 (δ13C) data.
The δ13C values for groundwater samples range from−18.9‰ to −6.9‰, suggesting that carbonate reactionsprobably occur. The absence of a consistent inverserelationship between δ13C values and 14C activities,however, suggests that corrections of 14C activities wouldbe problematic (Figure 6; Table S3). Therefore, 14Cactivities were retained for comparing the relative ages ofgroundwater in the coastal San Diego area. 14C activitiesfor group 2 wells range from 0.4 to 12.4 pmc and reflectthe oldest groundwater. Groundwater samples from group
Group 1
Group 2
Group 3
Domestic wells
0
–10
–15
–5
–200 20 40 60 80 100 120
delta
Car
bon-
13, i
n pe
r m
il
Carbon-14, in percent modern carbon
Figure 6. δ13C values versus 14C activities for three majorgroups of groundwater samples from seven multiple-depthmonitoring-well sites and six domestic wells in San DiegoCounty, California.
1 wells have higher 14C activities ranging from 17.6 to99.8 pmc. Group 3 wells have a range of 14C activitiesfrom 2.9 to 76.9 pmc.
DiscussionThe use of mixing models to better understand
the various processes occurring in a coastal aquiferrelies on measured water compositions and concentrationscalculated for conservative mixing of freshwater and seawater. In such models, waters plotting above a mixingline indicate the groundwater has been enriched foran individual cation or anion, whereas waters that plotbelow the mixing line indicate depletion compared toconservative mixing (Ravenscroft and McArthur 2004;Andersen et al. 2005).
A simple binary mixing line between sea waterand the average Na, Ca, and Cl concentrations of thesix domestic well samples (98.3 mg/L Na, 71.1 mg/LCa, 152.5 mg/L Cl), along with the measured watercomposition of the groundwater samples from the sevenmultiple-depth monitoring well sites, indicate that Nais only slightly enriched or depleted relative to dilutedsea water in all groups (Figure 7a). In contrast, allgroundwater samples from group 2 wells are depletedin Ca, groundwater samples from group 3 wells areslightly enriched in Ca, and group 1 wells containgroundwater both enriched and depleted in Ca (Figure 7b).The enrichment and depletion of these species in thegroundwater allow the influence of residual salinity to bedetached from the influence of the exchange and sorptionreactions (Ravenscroft and McArthur 2004).
The model by Appelo and Postma (2005) for theprocess of ion exchange resulting from interactionsbetween sea water and fresh groundwater is applicable for
6 R. Anders et al. Groundwater NGWA.org

10 100 1,000 10,000 100,000
100,000
10,000
1,000
100
10
Chloride concentration, in milligrams per liter
Group 1Group 2Group 3
Seawater
Binary mixingline
(a)
Domestic wells
Sod
ium
con
cent
ratio
n, in
mill
igra
ms
per
liter
(b)
10 100 1,000 10,000 100,000
10,000
1,000
100
10
1
Chloride concentration, in milligrams per liter
Cal
cium
con
cent
ratio
n, in
mill
igra
ms
per
liter
Binarymixingline
Group 1Group 2Group 3
SeawaterDomestic wells
Figure 7. Na and Ca concentrations versus Cl concentra-tions for three major groups of groundwater samples fromseven multiple-depth monitoring-well sites in the San Diegoarea: (a) Na concentrations; (b) Ca concentrations. Alsoshown is the average concentration for the six domestic wellsamples.
understanding the processes responsible for the presenceof saline groundwater in the San Diego coastal aquifer.In sea water, Na and Cl are the dominant ions. Whensea water intrudes into a freshwater aquifer where Cais the dominant absorbed cation, Na is taken up by theexchanger, while Ca is released:
Na+ + 1/2 Ca − X2 → Na − X + 1/2 Ca2+ (1)
where X indicates the soil exchanger. In this case, thedominant anion Cl remains the same, a depletion of Naand an enrichment of Ca in groundwater relative to seawater occur, and the sodium-to-calcium mass (Na/Ca)ratio decreases from the Na/Ca ratio for sea water (25.6).
The reverse process takes place when fresh ground-water flushes a previously saline aquifer:
1/2 Ca2+ + Na − X → 1/2 Ca − X2 + Na+. (2)
The sediment now absorbs Ca while Na is released, anenrichment of Na and a depletion of Ca in groundwaterrelative to diluted sea water occur, and the Na/Ca ratioexceeds the sea water Na/Ca ratio.
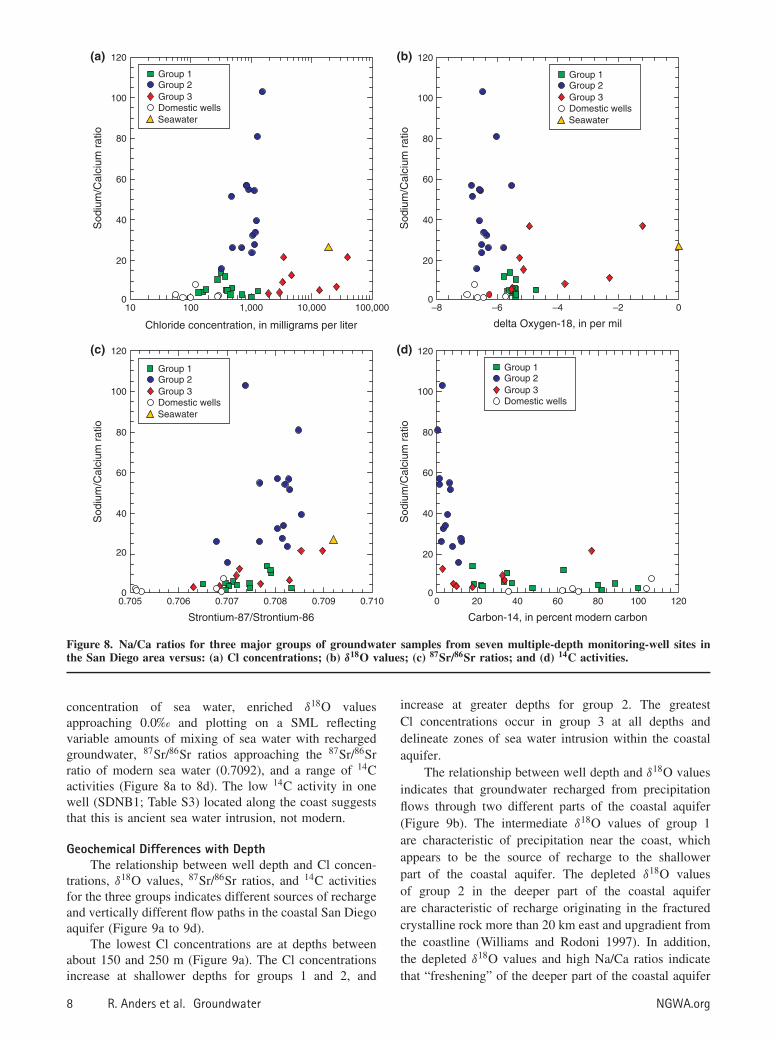
Geochemical Tracers of Saline GroundwaterGeochemical tracers (Na/Ca ratios, Cl concentrations,
δ18O values, 87Sr/86Sr ratios, and 14C activities) aid indefining the source and movement of saline groundwaterin the coastal San Diego area (Tables S2 and S3).Groundwater from group 1 wells is characterized by lowNa/Ca ratios with low to intermediate Cl concentrations,intermediate δ18O values, 87Sr/86Sr ratios between 0.7070and 0.7083, and relatively high 14C activities (Figure 8ato 8d). Groundwater from group 1 wells is consideredto be the most representative of the potable groundwaterin the San Diego area, much of which is believed to beextracted from the San Diego Formation. The chemicalcomposition of the groundwater from group 1 wellsreflects slight enrichment of Ca owing to dissolution ofreadily soluble minerals such as calcite near the sourceof recharge (youngest groundwater) or slight depletionof Ca as aluminosilicate minerals are weathered and (or)calcium is exchanged for sodium on clay minerals thatare present along the groundwater flow path (Ravenscroftand McArthur 2004).
In contrast, the chemical and isotopic compositionof groundwater from group 2 wells is characterizedby high Na/Ca ratios, intermediate Cl concentrations,depleted δ18O values, 87Sr/86Sr ratios between 0.7068 and0.7085, and the lowest 14C activities in the coastal aquifer(Figure 8a to 8d). One explanation for the high Na/Caratios in group 2 groundwater is a depletion of Ca dueto a decrease in the solubility of calcium carbonate asa consequence of microbial sulfate reduction (Andersenet al. 2005). Some group 2 samples containing lowsulfate concentrations appear to be influenced by sulfatereduction, although this process is limited to groundwatersamples from two wells (SDOT1, 2) and is not widespreadin the coastal aquifer (refer to Figure 2). The moreplausible explanation is that the high Na/Ca ratios reflecta depletion of Ca as a result of “freshening” of apreviously saline aquifer by the reverse ion-exchangeprocess depicted in Equation 2 (Appelo and Postma2005; Capaccioni et al. 2005; Russak and Sivan 2010).Because reverse exchange of Ca should not affect the87Sr/86Sr ratios, the maximum 87Sr/86Sr ratios of group2 groundwater may reflect the 87Sr/86Sr ratio of seawater at about the time of deposition of the geologicformation (Prokoph et al. 2008) and the smaller valuesreflect variable amounts of mixing of modern water withancient water (Figure 8c).
The group 3 samples have Na/Ca ratios less than thesea water Na/Ca ratio resulting from the ion-exchangeprocess depicted by Equation 1, consistent with sea waterintrusion as the source of saline groundwater to thesewells (Appelo and Postma 2005; Chen and Jiao 2007).These groundwaters are characterized by the highestCl concentrations with a few samples exceeding the Cl
NGWA.org R. Anders et al. Groundwater 7
Chloride concentration, in milligrams per liter
Sod
ium
/Cal
cium
rat
io
0
20
40
60
80
100
120
Group 1Group 2Group 3Domestic wellsSeawater
(a)
10 100 1,000 10,000 100,000
0
20
40
60
80
100
120
Sod
ium
/Cal
cium
rat
io
(c)
Strontium-87/Strontium-86
Group 1Group 2Group 3Domestic wellsSeawater
0.705 0.706 0.707 0.708 0.709 0.710
0
20
40
60
80
100
120
–8 –6 –4 –2 0
delta Oxygen-18, in per mil
Sod
ium
/Cal
cium
rat
io
(b)Group 1Group 2Group 3Domestic wellsSeawater
0
20
40
60
80
100
120(d)
Sod
ium
/Cal
cium
rat
io
0 20 40 60 80 100 120
Carbon-14, in percent modern carbon
Group 1Group 2Group 3Domestic wells
Figure 8. Na/Ca ratios for three major groups of groundwater samples from seven multiple-depth monitoring-well sites inthe San Diego area versus: (a) Cl concentrations; (b) δ18O values; (c) 87Sr/86Sr ratios; and (d) 14C activities.
concentration of sea water, enriched δ18O valuesapproaching 0.0‰ and plotting on a SML reflectingvariable amounts of mixing of sea water with rechargedgroundwater, 87Sr/86Sr ratios approaching the 87Sr/86Srratio of modern sea water (0.7092), and a range of 14Cactivities (Figure 8a to 8d). The low 14C activity in onewell (SDNB1; Table S3) located along the coast suggeststhat this is ancient sea water intrusion, not modern.
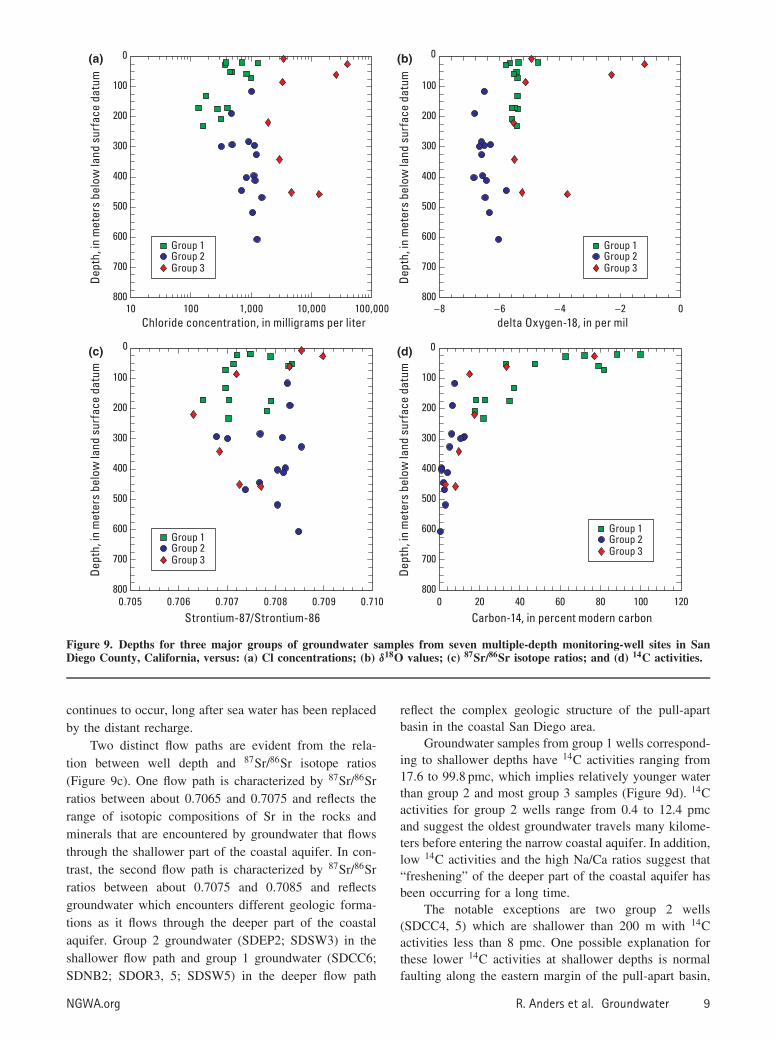
Geochemical Differences with DepthThe relationship between well depth and Cl concen-
trations, δ18O values, 87Sr/86Sr ratios, and 14C activitiesfor the three groups indicates different sources of rechargeand vertically different flow paths in the coastal San Diegoaquifer (Figure 9a to 9d).
The lowest Cl concentrations are at depths betweenabout 150 and 250 m (Figure 9a). The Cl concentrationsincrease at shallower depths for groups 1 and 2, and
increase at greater depths for group 2. The greatestCl concentrations occur in group 3 at all depths anddelineate zones of sea water intrusion within the coastalaquifer.
The relationship between well depth and δ18O valuesindicates that groundwater recharged from precipitationflows through two different parts of the coastal aquifer(Figure 9b). The intermediate δ18O values of group 1are characteristic of precipitation near the coast, whichappears to be the source of recharge to the shallowerpart of the coastal aquifer. The depleted δ18O valuesof group 2 in the deeper part of the coastal aquiferare characteristic of recharge originating in the fracturedcrystalline rock more than 20 km east and upgradient fromthe coastline (Williams and Rodoni 1997). In addition,the depleted δ18O values and high Na/Ca ratios indicatethat “freshening” of the deeper part of the coastal aquifer
8 R. Anders et al. Groundwater NGWA.org
(a)
(c)
(b)
(d)
Figure 9. Depths for three major groups of groundwater samples from seven multiple-depth monitoring-well sites in SanDiego County, California, versus: (a) Cl concentrations; (b) δ18O values; (c) 87Sr/86Sr isotope ratios; and (d) 14C activities.
continues to occur, long after sea water has been replacedby the distant recharge.
Two distinct flow paths are evident from the rela-tion between well depth and 87Sr/86Sr isotope ratios(Figure 9c). One flow path is characterized by 87Sr/86Srratios between about 0.7065 and 0.7075 and reflects therange of isotopic compositions of Sr in the rocks andminerals that are encountered by groundwater that flowsthrough the shallower part of the coastal aquifer. In con-trast, the second flow path is characterized by 87Sr/86Srratios between about 0.7075 and 0.7085 and reflectsgroundwater which encounters different geologic forma-tions as it flows through the deeper part of the coastalaquifer. Group 2 groundwater (SDEP2; SDSW3) in theshallower flow path and group 1 groundwater (SDCC6;SDNB2; SDOR3, 5; SDSW5) in the deeper flow path
reflect the complex geologic structure of the pull-apartbasin in the coastal San Diego area.
Groundwater samples from group 1 wells correspond-ing to shallower depths have 14C activities ranging from17.6 to 99.8 pmc, which implies relatively younger waterthan group 2 and most group 3 samples (Figure 9d). 14Cactivities for group 2 wells range from 0.4 to 12.4 pmcand suggest the oldest groundwater travels many kilome-ters before entering the narrow coastal aquifer. In addition,low 14C activities and the high Na/Ca ratios suggest that“freshening” of the deeper part of the coastal aquifer hasbeen occurring for a long time.
The notable exceptions are two group 2 wells(SDCC4, 5) which are shallower than 200 m with 14Cactivities less than 8 pmc. One possible explanation forthese lower 14C activities at shallower depths is normalfaulting along the eastern margin of the pull-apart basin,
NGWA.org R. Anders et al. Groundwater 9
(a)
(b)
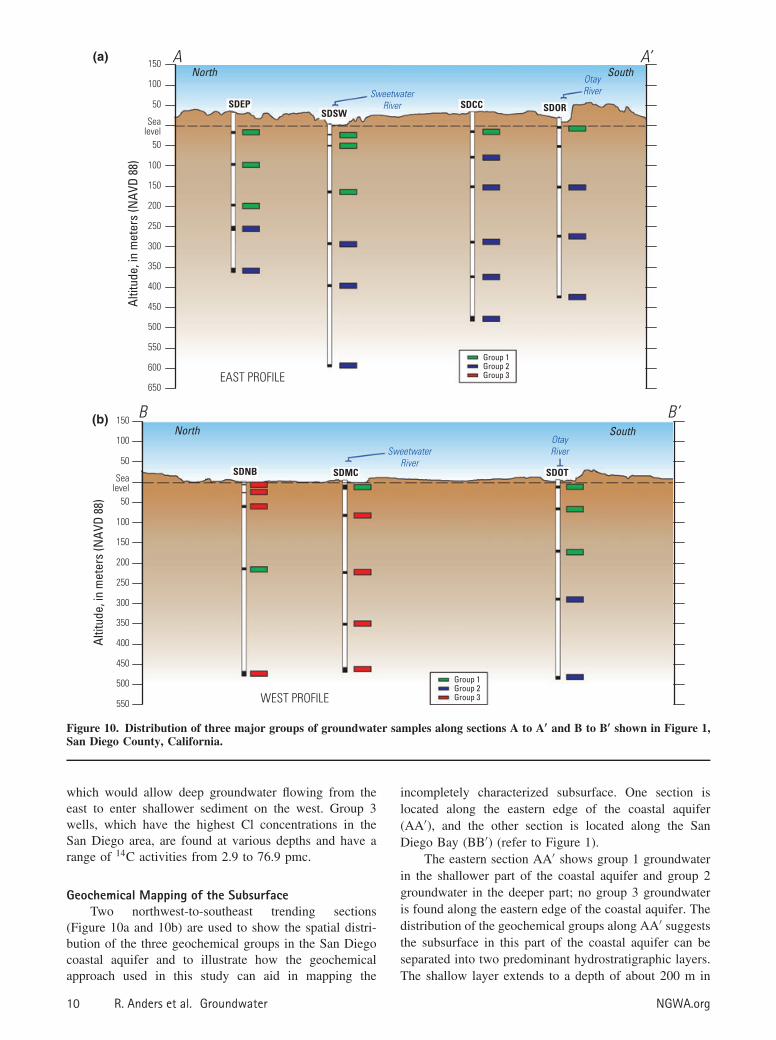
Figure 10. Distribution of three major groups of groundwater samples along sections A to A′ and B to B′ shown in Figure 1,San Diego County, California.
which would allow deep groundwater flowing from theeast to enter shallower sediment on the west. Group 3wells, which have the highest Cl concentrations in theSan Diego area, are found at various depths and have arange of 14C activities from 2.9 to 76.9 pmc.
Geochemical Mapping of the SubsurfaceTwo northwest-to-southeast trending sections
(Figure 10a and 10b) are used to show the spatial distri-bution of the three geochemical groups in the San Diegocoastal aquifer and to illustrate how the geochemicalapproach used in this study can aid in mapping the
incompletely characterized subsurface. One section islocated along the eastern edge of the coastal aquifer(AA′), and the other section is located along the SanDiego Bay (BB′) (refer to Figure 1).
The eastern section AA′ shows group 1 groundwaterin the shallower part of the coastal aquifer and group 2groundwater in the deeper part; no group 3 groundwateris found along the eastern edge of the coastal aquifer. Thedistribution of the geochemical groups along AA′ suggeststhe subsurface in this part of the coastal aquifer can beseparated into two predominant hydrostratigraphic layers.The shallow layer extends to a depth of about 200 m in
10 R. Anders et al. Groundwater NGWA.org
the northern part of the aquifer and thins to less than 100m in the southern part. On the basis of surficial geologicmaps, the shallow layer represents Quaternary depositsand some or all of the underlying San Diego Formation.
The western section BB′ shows that the two predom-inant hydrostratigraphic layers extend to the coastline andget deeper in the south. The deepening of both groups 1and 2 groundwater in the south may indicate structuraldeepening of the pull-apart basin and (or) significant ero-sion from the Tijuana River, the largest in San DiegoCounty. In contrast to an absence on section AA′, group3 groundwater is present along section BB′ and depictszones of sea water intrusion in the northern part of aquiferand adjacent to the Sweetwater River. The occurrence ofsea water intrusion along the San Diego Bay may reflectnearby groundwater pumping, a decrease in precipitation,or a rise in sea level.
ConclusionThe chemical and isotopic composition of groundwa-
ter from the San Diego area in southern California wasinvestigated in order to determine the sources and move-ment of saline groundwater in the coastal aquifer and toaid in the initial mapping of the subsurface. Cl concentra-tions range from about 57 to 39,400 mg/L, with the lowestconcentrations at depths between about 150 and 250 m,suggesting the greatest quantity of recharged groundwa-ter may flow through this part of the coastal aquifer. Onthe basis of relative proportions of major-ions, the chem-ical composition of groundwater in the coastal aquiferis classified as Na-Ca-Cl-SO4, Na-Cl, or Na-Ca-Cl typewaters. δ2H and δ18O values indicate that groundwater inthe coastal aquifer originates from at least three sources:(1) groundwater with intermediate isotopic values, char-acteristic of precipitation originating on coastal sediment,which flows in the shallower part of the coastal aquifer;(2) isotopically depleted groundwater, originating in thefractured crystalline rock more than 20 km east and upgra-dient from the coastline, which flows in the deeper part ofthe coastal aquifer; and (3) isotopically enriched ground-water, which reflects areas of sea water intrusion alongthe San Diego Bay.
87Sr/86Sr ratios range from about 0.7050 to 0.7090and indicate that the groundwater encounters differentgeologic formations as it flows through the shallower anddeeper parts of the coastal aquifer. 3H and 14C analy-ses indicate most groundwater in the coastal aquifer wasrecharged many thousands of years ago; very little ground-water in the coastal aquifer is modern (<60 years old).By using Na/Ca ratios, in combination with Cl concen-trations, δ18O values, 87Sr/86Sr ratios, and 14C activities,we were able to identify groundwater considered to be themost representative of potable groundwater in the coastalSan Diego area (group 1), saline groundwater resultingfrom “freshening” of a previously-saline aquifer (group2), and saline groundwater resulting from sea water intru-sion (group 3).
The geochemical approach used in this study wasremarkably helpful, even in the absence of detailed sub-surface geology, to determine the sources and movementof saline groundwater in a coastal aquifer. The manyspatial and depth-dependent geochemical findings are aid-ing researchers and local water managers in mappingthe subsurface, in developing a conceptual hydrogeologicframework, and in planning for additional desalination ofbrackish groundwater.
AcknowledgmentsFunding for this study was provided by the Sweet-
water Authority, the City of San Diego, the Otay WaterDistrict, the State of California via water bonds, and theUnited States Federal Government via appropriations forthe USGS and for this study in particular. The authors aregrateful to many individuals for their technical insights aswell as to many USGS colleagues for their assistance inidentifying, collecting, collating, reviewing, and preparingthe data presented here. Their collective contribution tothe study cannot be overstated. We also wish to thank thethree anonymous reviewers for their helpful comments,which contributed significantly to the improvement of thismanuscript.
Supporting InformationSupporting Information, including a list of the sevenUSGS multiple-depth monitoring-well sites and sixdomestic wells where water-quality samples were col-lected in San Diego County, California, and all the chem-ical and isotopic data for these sites, may be found in theonline version of this article:
Table S1. List of the seven USGS multiple-depthmonitoring-well sites and six domestic wells where water-quality samples were collected in San Diego County,California.Table S2. Chemical data collected from the seven USGSmultiple-depth monitoring-well sites and six domesticwells in San Diego County, California.Table S3. Isotopic data collected from the seven USGSmultiple-depth monitoring-well sites and six domesticwells in San Diego County, California.
ReferencesAbbott, P.L. 1999. The Rise and Fall of San Diego. San Diego,
California: Sunbelt Publications.Andersen, M.S., V. Nyvang, R. Jakobsen, and D. Postma.
2005. Geochemical processes and solute transport atthe seawater/freshwater interface of a sandy aquifer.Geochimica et Cosmochimica Acta 69, no. 16: 3979–3994.
Appelo, C.A.J., and D. Postma. 2005. Geochemistry, Ground-water and Pollution , 2nd ed. Rotterdam, The Netherlands:A.A. Balkema Publishers.
Bear, J., A.H. Cheng, S. Sorek, D. Ouazar, and I. Herrers (Eds).1999. Seawater Intrusion in Coastal Aquifer Concepts,Methods, and Practices . London, UK: Kluwer AcademicPublishers.
NGWA.org R. Anders et al. Groundwater 11
Beukins, R.P. 1992. Radiometric accelerator mass spectrometry:Background, precision, and accuracy. In Radiocarbon AfterFour Decades , ed. R.E. Taylor, A. Long, and R.S. Kra.New York: Springer-Verlag.
California Department of Water Resources. 1967. Ground WaterOccurrence and Quality. San Diego Region. Bulletin No.106–2.
Capaccioni, B., M. Didero, C. Paletta, and L. Didero. 2005.Saline intrusion and refreshening in a multilayer coastalaquifer in the Catania Plain (Sicily, Southern Italy): dynam-ics of degradation processes according to the hydrochemicalcharacteristics of groundwater. Journal of Hydrology 307:1–16.
Chen, K.P., and J.J. Jiao. 2007. Seawater intrusion and aquiferfreshening near reclaimed coastal area near Shenzhen.Water Science and Technology 7: 137–145.
City of San Diego. 2011. 2010 Urban Water Management Plan .San Diego: City of San Diego.
Clark, I.D., and P. Fritz. 1997. Environmental Isotopes inHydrogeology . Boca Raton, Florida: Lewis Publishers.
Coplen, T.B. 1994. Reporting of stable hydrogen, carbon, andoxygen isotopic abundances. Pure and Applied Chemistry66: 273–276.
Coplen, T.B., J.D. Wildman, and J. Chen. 1991. Improve-ments in the gaseous hydrogen-water equilibrium techniquefor hydrogen isotope analysis. Analytical Chemistry 63:910–912.
Danskin, W.R., and C.D. Church. 2005. Determining age andvertical contribution of ground water pumped from wells ina small coastal river basin. A case study in the SweetwaterRiver Valley, San Diego County, California. USGS Open-File Report 2005-1032. Reston, Virginia: USGS.
Davis, S.N., D.O. Whittemore, and J. Fabryka-Martin. 1998.Uses of chloride/bromide ratios in studies of potable water.Ground Water 36, no. 2: 338–350.
Ellis, A.J., and C.H. Lee. 1919. Geology and ground waters ofthe western part of San Diego County, California. USGSWater-Supply Paper 446. Reston, Virginia: USGS.
Epstein, S., and T.K. Mayeda. 1953. Variation of O-18 content ofwater from natural sources. Geochimica et CosmochimicaActa 4: 213–224.
Fakir, Y., M. El Mernissi, T. Kreuser, and B. Berjami. 2002.Natural tracer approach to characterize groundwater inthe coastal Sahel of Oualidia (Morocco). EnvironmentalGeology 43: 197–202.
Faye, S., P. Maloszewski, W. Stichler, P. Trimborn, S.C.Faye, and C.B. Gaye. 2005. Groundwater salinization inthe Saloum (Senegal) delta aquifer: minor elements andisotopic indicators. Science of the Total Environment 343:243–259.
Fishman, M.J. 1993. Methods of analysis by the U.S. GeologicalSurvey National Water Quality Laboratory—Determinationof inorganic and organic constituents in water and fluvialsediments. ISGS Open-File Report 93–125. Reston, Vir-ginia: USGS.
Fishman, M.J., and L.C. Friedman. 1989. Methods for deter-mination of inorganic substances in water and flu-vial sediments. USGS Techniques of Water-ResourcesInvestigations, book 5, chap. A1. Reston, Virginia: USGS.
Flint, L.E., A.L. Flint, B.J. Stolp, and W.R. Danskin. 2012.A basin-scale approach for assessing water resources ina semiarid environment: San Diego region, Californiaand Mexico. Hydrology and Earth System Sciences 16:3817–3833.
Garbarino, J.R. 1999. Methods of analysis by theU.S. Geological Survey National Water QualityLaboratory—Determination of dissolved arsenic, boron,lithium, selenium, strontium, thallium, and vanadium usinginductively coupled plasma-mass spectrometry. USGSOpen-File Report 99-093. Reston, Virginia: USGS.
Gat, J.R., and R. Gonfiantini. 1981. Stable isotope hydrology,deuterium and oxygen-18 in the water cycle. TechnicalReports Series No. 210. Vienna, Austria: IAEA.
Hanson, R.T., J.A. Izbicki, E.G. Reichard, B.D. Edwards, M.Land, and P. Martin. 2009. Comparison of Groundwaterflow in Southern California coastal aquifers. In EarthScience in the Urban Ocean: The Southern ContinentalBorderland . Geological Society of America Special Paper454 , ed. H.J. Lee, and W.R. Normark, 345–373. Boulder,Colorado: GSA.
Hem, J.D. 1985. Study and interpretation of the chemicalcharacteristics of natural water. USGS Water-Supply Paper2254, 3rd ed. Reston, Virginia: USGS.
Huntley, D., S. Bickler, and C.M. Marshall. 1998. Distributionand hydrogeologic properties of the San Diego Formation,Southwestern San Diego County. San Diego County WaterAuthority, San Diego Formation Task Force, Report ofInvestigation.
Izbicki, J.A., A.H. Christensen, M.W. Newhouse, and G.R.Aiken. 2005. Inorganic, isotopic, and organic compositionof high-chloride water from wells in a coastal southernCalifornia aquifer. Applied Geochemistry 20: 1496–1517.
Jones, B.F., A. Vengosh, E. Rosenthal, and Y. Yechiele.1999. Geochemical investigation. In Seawater Intrusion inCoastal Aquifer Concepts, Methods, and Practices , ed. J.Bear, A.H. Cheng, S. Sorek, D. Ouazar, and I. Herrers.London, UK: Kluwer Academic Publishers.
Jørgensen, N.O., M.S. Andersen, and P. Engesgaard. 2008.Investigation of a dynamic seawater intrusion event usingstrontium isotopes (87Sr/86Sr). Journal of Hydrology 348:257–269.
Karlen, I., I.U. Olsson, P. Kallburg, and S. Kilici. 1964. Absolutedetermination of the activity of two 14C dating standards.Arkiv Geofysik 4: 465–471.
Keller, B., and A. Ward. 2001. Tectonic setting of the San Diegoformation aquifer, considered for conjunctive use storage.Journal of South American Earth Science 14: 533–540.
Lucas, L.L., and M.P. Unterweger. 2000. Comprehensive reviewand critical evaluation of the half-life of tritium. Journalof Research of the National Institutes of Standards andTechnology 105, no. 4: 541–549.
Olsson, I.U. 1970. The use of Oxalic acid as a Standard. InRadiocarbon Variations and Absolute Chronology , ed. I.U.Olsson. New York: Wiley Interscience Division Publisher.
Prokoph, A., G.A. Sheilds, and J. Veized. 2008. Compilationand time-series analysis of a marine carbonate δ18O, δ13C,87Sr/86Sr, and δ34S database through earth history. Earth-Science Reviews 87: 113–133.
Ravenscroft, P., and J.M. McArthur. 2004. Mechanisms ofregional enrichment of groundwater by boron: the examplesof Bangladesh and Michigan, USA. Applied Geochemistry19: 1413–1430.
Richter, B.C., and C.W. Kreitler. 1993. Geochemical Techniquesfor Identifying Sources of Ground-Water Salinization . BocaRaton, Florida: C.R.C. Press, Inc.
Russak, A., and O. Sivan. 2010. Hydrogeochemical tool toidentify salinization or freshening of coastal aquifersdetermined from combined field work, experiments, andmodeling. Environmental Science and Technology v. 44:4096–4102.
Shand, P., D.P.F. Darbyshire, A.J. Love, and W.M. Edmunds.2009. Sr isotopes in natural waters: Applications to sourcecharacterization and water-rock interaction in contrastinglandscapes. Applied Geochemistry 24: 574–586.
Stuiver, M. 1980. Workshop on 14C data reporting. Radiocarbon22: 964–966.
Stuiver, M., and H.A. Polach. 1977. Discussion: Reporting of14C data. Radiocarbon 19: 355–363.
Thatcher, L.L., V.J. Janzer, and K.W. Edwards. 1977. Methodsfor the determination of radioactive substances in water.
12 R. Anders et al. Groundwater NGWA.org
USGS Techniques of Water-Resources Investigations, book5, chap. A5. Reston, Virginia: USGS.
U.S. Geological Survey. Variously dated. National field manualfor the collection of water-quality data. USGS Techniquesof Water-Resources Investigations, book 9, chap. A1–A9,Reston, Virginia: USGS. http://pubs.water.usgs.gov/twri9A.
Vengosh, A., A.J. Spivack, Y. Artzi, and A. Ayalon. 1999.Geochemical and boron, strontium, and oxygen isotopicconstraints on the origin of the salinity in groundwaterfrom the Mediterranean coast of Israel. Water ResourcesResearch 35: 1877–1894.
Vengosh, A., J. Gill, M.L. Davisson, and G.B. Hudson. 2002.A multi-isotope (B, Sr, O, H, and C) and age dating (3H-3He and 14C) study of groundwater from Salinas Valley,California: Hydrochemistry, dynamics, and contaminationprocesses. Water Resources Research 38, no. 1: 1008.DOI:10.1029/2001WR000517.
Vengosh, A., W. Kloppmann, A. Marei, Y. Livshitz, A.Gutierrez, M. Banna, C. Guerrot, I. Pankratov, and H.Raanan. 2005. Sources of salinity and boron in theGaza strip: natural contaminant flow in the southernMediterranean coastal aquifer. Water Resources Research41: W01013. DOI:10.1029/2004WR003344.
Wigley, T.M.L., and A.B. Muller. 1981. Fractionation cor-rections in radiocarbon dating. Radiocarbon 23, no. 2:173–190.
Williams, A.E., and D.P. Rodoni. 1997. Regional isotopeeffects and application to hydrologic investigations insouthwestern California. Water Resources Research 33, no.7: 1721–1729.
Wright, M.T., and K. Belitz. 2011. Status and understandingof groundwater quality in the San Diego DrainagesHydrogeologic Province, 2004–California GAMA PriorityBasin Project. USGS Scientific Investigations Report 2011-5154. Reston, Virginia: USGS.
NGWA.org R. Anders et al. Groundwater 13