Embed Size (px)
Citation preview
A GIS-BASED MULTICRITERIA DECISION ANALYSIS APPROACH ON WIND POWER
DEVELOPMENT; THE CASE OF NOVA SCOTIA, CANADA
Dissertation in partial fulfillment of the requirements for the degree of
MASTER OF SCIENCE WITH A MAJOR IN WIND POWER
PROJECT MANAGEMENT
Uppsala University
Department of Earth Sciences, Campus Gotland
Senteles Athanasios
24 September 2018
ii
A GIS-BASED MULTICRITERIA DECISION ANALYSIS APPROACH ON WIND POWER
DEVELOPMENT; THE CASE OF NOVA SCOTIA, CANADA
Dissertation in partial fulfillment of the requirements for the degree of
MASTER OF SCIENCE WITH A MAJOR IN WIND POWER
PROJECT MANAGEMENT
Uppsala University
Department of Earth Sciences, Campus Gotland
Approved by:
Supervisor, Dr. Heracles Polatidis
Examiner, Dr. Jens Sorensen
Date 24 September 2018
iii
ABSTRACT
The growing need for reducing the negative impacts of climate change and ensuring a
constant and environmentally friendly energy supply, led the way to the exploitation of renewable
energy sources. Canada has already acknowledged this trend by incorporating more power from
renewables on its energy mix. Similarly, Nova Scotia has started an ambitious energy program in
which the substitution of most of the fossil fuels by wind energy, will play a significant factor.
The purpose of this research is to investigate all suitable locations for wind energy
development in the province of Nova Scotia, under the scope of minimizing environmental
impacts, increasing social acceptance and maximizing energy production. This spatial analysis is
performed through the combination of Geographical Information Systems (GIS) and a Multi
Criteria Decision Analysis (MCDA).
The analysis of the province was based on the preferences of wind experts and
administration authorities, which formed the weights assigned on eight (8) evaluation criteria. The
extract of the relative weights was succeeded by using the Analytical Hierarchy Process (AHP),
while their spatial dimensions were expressed by GIS software. The above procedure was possible
through the application of a methodology where exclusion areas were found on the first place and
the remaining areas were assessed on their level of suitability.
The implementation of the GIS-MCDA methodological framework indicates that, despite
the exclusion of a significant part of the province, there is still enough space to develop wind
energy. The applied methodology and relevant results could be used as a Decision-Making tool by
planning authorities, wind developers, and stakeholders.
Keywords: GIS, MCDA, AHP, wind energy, suitability, Nova Scotia

iv
ACKNOWLEDGEMENTS
This Thesis would not be able to be conducted without the contribution of important people to who
I would like to express my gratitude.
First of all, I would like to thank my supervisor Dr. Heracles Polatidis for his guidance and support
that were endless from the beginning of this research. Except his valuable knowledge, which he
willingly gave to me, he also offered me a great experience and a priceless friendship.
To this end, I would like to thank all professors and guest lecturers of the Department of Earth
Sciences, in Uppsala University, for their academic contribution and insight. You are the reason
that boosts up my passion for wind energy!
I would, also, like to personally thank professor James Boxall and PhD candidate Caitlin
Cunningham, from the GIS Center of Dalhousie University Halifax, NS, for supporting and
assisting me with all technical details, while providing me with all necessary data. In addition, I
would like to express my appreciation for professor David Colville, in Nova Scotia Community
College, who provided me with wind data. Your contribution was crucial for this Thesis and
without you it would not be possible to write these very words!
Moreover, I would like to express my gratitude for all wind developers and municipalities that
provided me with their feedback and willingness to help me on every aspect of this research. I
would like to personally thank the planning department of West Hants Municipality, and wind
developers in IFE Project Management, Natural Forces, Minas Energy, and Stantec.
Furthermore, I would like to express my gratitude to my family who always supports me
emotionally and practically to pursue my goals and dreams.
Finally, I would like to say a huge THANK YOU to my wife, Despoina, who showed so much
patience all this time, from the beginning of this Master Program till the end, and who always
supported and boosted me up. You know how much I love you!
This Thesis is dedicated to the memory of my beloved grandpas and grandma, Κώστας, Θανάσης
and Βάγια who taught me how important is to struggle for your dreams.
v
NOMENCLATURE
AHP Analytical Hierarchy Process
CI Consistency Index
CR Consistency Ratio
GIS Geographical Information Systems
GWh Giga Watt hour
IBAs Important Bird Areas
kV kilo Volt
kW kilo Watt
MCDA Multi Criteria Decision Analysis
MW Mega Watt
PJ Peta Joule
RES Renewable Energy Sources
RI Random Index
TWh Tera Watt hour
WLC Weighted Linear Combination
vi
TABLE OF CONTENTS
Page
ABSTRACT .................................................................................................................................. iii
ACKNOWLEDGEMENTS ..........................................................................................................iv
NOMENCLATURE ....................................................................................................................... v
LIST OF FIGURES .................................................................................................................... viii
LIST OF TABLES.........................................................................................................................ix
LIST OF EQUATIONS ................................................................................................................. x
1. Introduction ................................................................................................................................ 1
2. Literature Review ....................................................................................................................... 4
3. Methodology ............................................................................................................................... 9
3.1 Introduction .............................................................................................................................. 9
3.2 The Methodology steps ........................................................................................................... 9
3.2.1 Step 1: Study Goal Definition ............................................................................................ 11
3.2.2 Step 2: Constraint Criteria and Map Creation .................................................................. 11
Collecting and Processing GIS Data ................................................................................... 11
Constraint Criteria Definition ............................................................................................. 11
Wind Potential ....................................................................................................................... 12
Slopes ..................................................................................................................................... 12
Distance from Urban Areas ................................................................................................. 13
Infrastructure (Roads, Transmission Lines, Railways, and Airports) .............................. 13
Environmental Protected Areas ........................................................................................... 14
Cultural Areas (Archaeological Sites, Crown Lands, Indian Reserve, and Tourism) ..... 15
Land Use (High Productivity Lands and Military Areas) ................................................. 16
Creation of Constraint Layers and Map on GIS ................................................................ 16
3.2.3 Step 3: Evaluation Criteria ................................................................................................. 16
Definition of the Evaluation Criteria .................................................................................. 16
Wind Potential ....................................................................................................................... 17
Slopes ..................................................................................................................................... 18
Indian Reserve Lands ........................................................................................................... 18
Distance from Urban Areas ................................................................................................. 19
vii
Distance from High Productivity Lands .............................................................................. 20
Road Network ........................................................................................................................ 21
Transmission Lines-Electrical Grids ................................................................................... 22
Distance from Protected Areas ............................................................................................ 23
Evaluation Layer Creation ................................................................................................... 24
3.2.4 Step 4: Priority vector calculation through AHP .............................................................. 24
3.2.5 Step 5: Evaluation Map Creation ....................................................................................... 27
3.2.6 Step 6: Individual Suitability Map Creation ..................................................................... 28
3.2.7 Step 7: Sensitivity Analysis ............................................................................................... 28
4. Case Study ................................................................................................................................ 30
4.1 Introduction ............................................................................................................................ 30
4.2 Demographic Characteristics of Nova Scotia ...................................................................... 30
4.3 The Landscape and Environment of Nova Scotia ............................................................... 31
4.4 Nova Scotia’s Energy Overview ........................................................................................... 31
4.5 RES and Wind Energy in Nova Scotia ................................................................................. 32
4.6 Conclusions ............................................................................................................................ 34
5. Results ....................................................................................................................................... 36
5.1 Constraint Layers and Map ................................................................................................... 36
5.2 Standardized Evaluation Criteria .......................................................................................... 37
5.3 Analytical Hierarchy Process Results .................................................................................. 37
5.4 Creation of Evaluation Maps ................................................................................................ 38
5.5 Creation of Suitability Maps ................................................................................................. 39
5.6 Sensitivity Analysis Results .................................................................................................. 40
5.7 Comparison with areas of existing wind farms of Nova Scotia ......................................... 42
6. Discussion ................................................................................................................................. 43
6.1 Constraint Areas Analysis ..................................................................................................... 43
6.2 Standardized and Evaluation Areas Analysis ...................................................................... 45
6.3 Suitability Areas Analysis ..................................................................................................... 47
6.4 Sensitivity Analysis ............................................................................................................... 48
6.5 Limitations .............................................................................................................................. 50
7. Conclusions .............................................................................................................................. 51
viii
REFERENCES ............................................................................................................................. 53
APPENDIX A - Figures ............................................................................................................... 65
APPENDIX B – Map Inventory .................................................................................................. 68
APPENDIX C – Decision Matrices ............................................................................................ 78
APPENDIX D – Data Catalogue and Tables ............................................................................. 82
APPENDIX E - Questionnaire .................................................................................................... 87
LIST OF FIGURES
Page
Figure 1 The Methodological Framework ........................................................................... 10
Figure 2 Constraint Areas for wind power in Nova Scotia. ................................................. 37
Figure 3 Suitability map for Wind Developer 1 .................................................................. 39
Figure 4 Suitability percentages for each participated DM. ................................................ 40
Figure 5 Sensitivity map for Aggregated Weights Scenario. ............................................... 41
Figure 6 Sensitivity percentages for the four (4) sensitivity scenarios. ............................... 41
Figure 7 Spatial Coincidence Map with the existing wind farms. ....................................... 42
Figure A1 The Province of Nova Scotia. ............................................................................ 65
Figure A2 The Atlantic Provinces. ..................................................................................... 65
Figure A3 Land use percentages of Nova Scotia ................................................................. 66
Figure A4 Energy Mix of Nova Scotia. .............................................................................. 66
Figure A5 Green House Emissions in National and Provincial level ................................... 67
Figure A6 Large scale wind farms and Community Based Feed In Tariff Programs ........... 67
Figure B1 Environmental Protection Standardized map. ..................................................... 68
Figure B2 Indian Reserve Lands Standardized map. ........................................................... 68
Figure B3 Road Network Standardized map. ...................................................................... 69
Figure B4 High Productivity Lands Standardized map. ...................................................... 69
Figure B5 Slopes Standardized map. .................................................................................. 70
Figure B6 Transmission Network Standardized map. ......................................................... 70
Figure B7 Urban Areas Standardized map. ......................................................................... 71
Figure B8 Wind Potential Standardized map. ..................................................................... 71
Figure B9 Evaluation map for Wind Developer 1. .............................................................. 72
ix
Figure B10 Evaluation map for Wind Developer 2. ............................................................ 72
Figure B11 Evaluation Map for Wind Developer 3. ............................................................ 73
Figure B12 Evaluation map for Wind Developer 4. ............................................................ 73
Figure B13 Evaluation Map for Municipality. .................................................................... 74
Figure B14 Suitability Map for Wind Developer 2. ............................................................ 74
Figure B15 Suitability Map for Wind Developer 3. ............................................................ 75
Figure B16 Suitability Map for Wind Developer 4. ............................................................ 75
Figure B17 Suitability map for Municipality. ..................................................................... 76
Figure B18 Sensitivity Map for Case 2 Scenario. ............................................................... 76
Figure B19 Sensitivity Map for Case 3 Scenario. ............................................................... 77
Figure B20 Sensitivity Map for Equal Weights Scenario. ................................................... 77
LIST OF TABLES
Page
Table 1 Setback distances for the Environmental Protected Areas. ............................................. 15
Table 2 The Standardized Wind Potential Criterion. .................................................................... 18
Table 3 The Standardized Slopes Criterion .................................................................................. 18
Table 4 The Standardized Indian Reserve Lands Criterion. ......................................................... 19
Table 5 The Standardized Urban Areas Criterion. ........................................................................ 20
Table 6 The Standardized High Productivity Lands Criterion. .................................................... 21
Table 7 The Standardized Road Network Criterion. .................................................................... 22
Table 8 The Standardized Transmission Lines Criterion. ............................................................ 22
Table 9 The Standardized Protected Areas Criteria. ..................................................................... 24
Table 10 The fundamental scale of Saaty and RI for different n. ................................................. 26
Table 11 Suitability classes. Source: Höfer et al., 2016. .............................................................. 28
Table 12 Restricted and Available areas for wind power in Nova Scotia. ................................... 36
Table 13 Decision Matrix for Wind Developer 1. ........................................................................ 38
Table C1 The pairwise comparison matrix for Wind Developer 1 ...................................... 78
Table C2.1 The pairwise comparison matrix for Wind Developer 2 ............................................ 78
Table C2.2 Decision Matrix for Wind Developer 2 ..................................................................... 78
x
Table C3.1 The pairwise comparison matrix for Wind Developer 3 ............................................ 79
Table C3.2 Decision Matrix for Wind Developer 3 ..................................................................... 79
Table C4.1 The pairwise comparison matrix for Wind Developer 4 ............................................ 79
Table C4.2 Decision Matrix for Wind Developer 4 ..................................................................... 80
Table C5.1 The pairwise comparison matrix for the Municipality ............................................... 80
Table C5.2 Decision Matrix for the Municipality ....................................................................... 80
Table C6 List of Abbreviations used in the Decision Matrices .................................................... 81
Table D1 GIS Data Catalogue. ........................................................................................... 82
Table D2 Setback distances used in research papers. ................................................................... 83
Table D3 Setback distances suggested by the Municipal By-Laws. ............................................ 84
Table D4 Constraint Criteria Catalogue ....................................................................................... 86
LIST OF EQUATIONS
Page
Equation 1………………………………………………………………………………….....26
Equation 2………..………………………………………………………………….…..........27
1
1. Introduction
Apparent effects of climate change, due to Green House Emissions, in combination with increasing
prices of fossil fuels and the elimination of oil reserves, have triggered the development of
worldwide skepticism regarding the future of energy supply and achievement of environmental
sustainability. Yet, the first oil crisis of the early 70s, enhanced the conviction that new power
sources could be exploited to adverse these negative impacts. The development of Renewable
Energy Sources (RES) could be the answer to that energy and environmental problem, leading, in
that way, to a more viable consuming pattern and energy production.
The commitment of altering the previous energy production patterns, can be achieved through
major environmental agreements, ratified on an international level. Canada is a country committed
to reduce Green House Emissions by 30% of the documented 2005 levels by 2030. That energy
plan is to be achieved under the Paris Agreement provision. That commitment was legislated
through ‘’The Pan Canadian Framework on Clean Growth and Climate Change’’ document, which
describes ways for the alteration to become possible, while specific goals are being set and tools
to support this pursuit are being introduced (National Energy Board of Canada, 2017a;
Government of Canada, 2016).
Phasing out old-thermal stations and substituting them with Renewable projects could allow
Canada to contribute more towards a low-carbon future. However, the majority of the energy
produced (66% on 2016) derives from Renewable sources, including hydro power, -(that would
be a major energy production contributor)-, wind power, solar power, and biomass (National
Energy Board of Canada, 2017b). According to ‘’Canada’s Renewable Landscape-Energy
Analysis 2017’’ report, published by the National Energy Board of Canada on 2017b, RES
(excluding hydro power) contributes 11.5% to the country’s energy capacity. At the same time,
hydro power accounts for 54.8% of Canada’s energy capacity. Overall, in 2016, RES projects
increased by 8.2%, adding more value to the sustainable transformation of Canada.
As for wind power, it has been indicated to generate 4.7% of the total electricity production in
Canada, equal to 30462 GWh in 2016 (National Energy Board of Canada, 2017b). In 2015, this
contribution was estimated to be 4.4%, which announced Canada the 7th largest wind energy
producer worldwide (National Energy Board of Canada, 2016a).
Despite the energy commitments of a national scale, provinces have, also, set their sustainable
energy goals to be achieved in the years to come. As a result, they form and implement their energy
2
plans individually, which set tools, ways, production and energy focus, and various milestones to
be accomplished over time.
Nova Scotia, the objective of this research, has made significant steps towards a more sustainable
and Green House Emissions-free future. That can be accomplished though the development of
various RES projects. Wind power will be the major electricity production contributor coming
from RES, accounting for 10.6% of the total electricity generation of 2016 (National Energy Board
of Canada, 2017b). Nevertheless, the majority of electricity production in Nova Scotia is based on
fossil fuels and particularly coil and natural gas. For that reason, and by acknowledging the
necessity of changing the existing production model, the province has published a number of
legislative documents to regulate that shift towards a cleaner energy production by developing
more RES projects and gradually phasing out of coil-based power plants (Nova Scotia Department
of Energy, 2015).
Wind power can play a significant role to that energy production pattern. However, that cannot be
achieved without recognizing factors that would affect Nova Scotia on four (4) categories; society,
environment, economy, and technical feasibility. It is of high importance to address all negative
influence factors that could reduce social acceptance and increase the possibility of reducing the
sensitive environment quality. Some of those negatives affects, will be the wind farm visual
intrusion to surrounding settlements and urban areas, the noise propagation due to wind turbine
operation in a close distance from houses, the possible bird collision, the reduction on properties’
prices etc. (Nova Scotia Department of Energy, undated).
In this study, GIS will be used to identify suitable areas for wind power development in Nova
Scotia, Canada. The analysis of the area will be based on a number of evaluation and constraint
criteria. Then, these areas can be assessed based on preferences of wind power experts and
administration authorities while a Multi Criteria Decision Analysis (MCDA) method can be used
to incorporate different opinions and reach a possible consensus. The MCDA technique to be
implemented on this research, would be the Analytical Hierarchy Process (AHP) as it is the most
straight forward and is being used within various research papers (Malczewski, 2006).
The author of this Thesis recognizes the effort Nova Scotia has made to alter its production model
towards a sustainable one and highly supports wind energy as an important shifter. Furthermore,
he realizes various challenges that wind energy may impose to development areas, mainly seen on
the social, environmental, economic, and technical sphere.
3
The goal of this study is to identify areas suitable for wind power development in the province of
Nova Scotia and assess them using weighted preferences of five (5) decision makers. Moreover, it
is our purpose to highlight different approaches that wind developers are expressing regarding the
development of wind farms, similarly to the study of Höfer et al. (2016).
Based on the criteria formed for this study, the following research questions were structured;
• Which are the suitable wind power development areas of Nova Scotia with the minimum
social and environmental impacts, as well as the highest power production?
• How are those areas being assessed based on the subjective preferences of five (5) decision
makers?
That being said, a further analysis of those questions allowed us to hypothesize that areas found
available and appraised as suitable would coincide with existing wind farms.
This research is organized as follows. In Chapter 2, a Literature Review is performed to present
and examine the different methodological perspectives regarding the determination of areas
available for wind power, using GIS-MCDA based tools. In Chapter 3, the developed methodology
is described, and various methodological procedures get analyzed and illustrated. In Chapter 4, an
overview of current demographic and environmental conditions is given, and the energy profile of
Nova Scotia is highlighted. In Chapter 5, results of the applied methodological framework are
presented. In Chapter 6, a discussion of the results is performed, and the limitations of the study
are described. Finally, in Chapter 7, basic conclusions are derived.
4
2. Literature Review
The energy planning sector should fulfill its most urgent need; the constant energy supply modern
society requires. Traditional energy sources (i.e. fossil fuels) get depleted, energy demands are
growing, and negative climate change effects become more prevalent (Aydin et al., 2010). The
transition from the existing energy production model to a more sustainable one, has significant
challenges to be recognized and resolved with new methods and decision tools (Diakoulaki et al.,
2005).
At the same time, RES projects (i.e. wind farms) are facing spatial restrictions. Identification of
areas considered suitable for planning and wind farm development combine a spatial problem with
interlocking factors (Felber and Stoeglehner, 2014). Some wind farm spatial planning issues are
wind turbine impacts on birds, noise and shadow flickering, visual impacts, and electromagnetic
interference (Latinopoulos and Kechagia, 2015; Tegou et al., 2010; Baban and Parry, 2001; Aydin
et al., 2010). In general, these issues fall into four (4) categories; environmental, social, technical,
and economical (San Cristobal Mateo, 2012; Tegou et al., 2010; Polatidis and Haralambopoulos,
2007). Additionally, spatial and energy planners should consider of the legal and legislative
framework, as far as wind farm planning of the area is concerned (Weiss et al., 2018; Felber and
Stoeglehner, 2014).
The energy planning procedure could include numerous participants, (i.e. decision makers), that
can influence decisions concerning a project execution. That is highlighted when decision makers
express different preferences. As a result, energy planning is a complex decision-making problem
(Loken, 2007). According, to Kumar et al. (2017) and Haralambopoulos and Polatidis (2003),
achieving the best compromise among decision makers’ preferences would be a crucial objective
of energy planning.
Tools used in energy planning and decision-making problems, are best known as Multi Criteria
Decision Analysis (MCDA) or Multi Criteria Decision Aid methods (Kumar et al 2017; Diakoulaki
et al. 2005). MCDA tools support decision makers to evaluate their preferences and reach the best
compromise among the various energy scenarios. However, approaching the best possible solution
is more likely a trade-off of decision makers’ preferences (Munda, 2004).
An MCDA method would compare and rank different scenarios by evaluating various criteria. At
the same time, each decision maker’s preference gets assessed by utilizing a certain methodology
and algorithm (Polatidis and Morales, 2016; Kumar et al., 2017).
5
MCDA methods have been applied on energy planning problem solving for at least thirty (30)
years, while various techniques have been formed and implemented (Diakoulaki et al., 2005).
Those techniques could be identified within three (3) categories; (1) value measurement models,
(2) goal, aspiration, reference level models, and (3) outranking methods (Kumar et al., 2017). Each
method selection depends on the validity level that decision makers pursue, their methodological
procedure challenges, and the difficulty of each technique, among others. As a result to the
selection of a specific MCDA method, different proposals could be indicated (Loken, 2007).
Techniques formed and applied to solve issues related to RES projects are; Analytical Hierarchy
Process (AHP) developed by Saaty in 1980, Analytical Network Process (ANP) proposed by Saaty
in 1996, Weighted Sum Method, Weighted Product Method, Preference Ranking Organization
Method for Enrichment Evaluation (PROMETHEE) I, II, III, IV, V, VI , introduced by Brans,
Vincke and Mareschal in 1986, ELimination Et Choix Traduisant la REalité (ELECTRE) III and
IV developed by Roy in 1968, Technique for Order Preference by Similarity to Ideal Solutions
(TOPSIS) formed by Hwang and Yoon in 1981, Compromise Ranking Method or VIKOR
(VlseKriterijumska Optimizacija I Kompromisno Resenje, translated into Multicriteria
Optimization and Compromise Solution), Multi Criteria Data Envelopment Analysis consisting of
parametric Stochastic Frontier Analysis (SFA) and non-parametric Data Envelopment Analysis
(DEA), Multi Attribute Utility Theory (MAU) (Keeney, 1982), Fuzzy Set Theory introduced by
Zadeh in 1965 that could be applied on other MCDA techniques such as PROMETHEE and AHP
(Fuzzy PROMETHEE and Fuzzy AHP), and Shapley Value formed by Shapley in 1953 and is
incorporated into Fuzzy Set Methods (San Cristobal Mateo, 2012).
RES project area designation is an energy planning problem with spatial dimensions. Geographical
Information Systems (GIS) create a powerful tool for decision makers’ spatial decisions by
analyzing and combining geographical data. A GIS software is many times associated with an
MCDA technique, to properly form the decision problem and help identify, appraise, and structure
possible alternatives (Malczewski, 2006). In other words, MCDA methods provide a theoretical
background for GIS platforms to scrutinize and solve decision problems with a variety of
methodologies (Malczewski and Rinner, 2015).
According to Malczewski (2006) and Malczewski and Rinner (2015), GIS-MCDA methods could
be divided into two (2) categories; the Multi Objective Decision Analysis (MODA) and the Multi
Attribute Decision Analysis (MADA). Possible alternatives for MODA methods are limitless
6
comparing to MADA methods, where possible solutions are finite. GIS-MCDA methods could be
divided into discrete and continuous according to the definition of decision variables. Moreover,
the decision maker goal-preference structure is divided into individual and group-decision making
methods (Malczewski and Rinner, 2015:64).
GIS-MCDA methods have been implemented in a variety of spatial decision problems and energy
planning issues including waste management (Ferreti., 2011; Leao et al., 2004), hydrology, water
resource management (Chen et al., 2011), environmental planning and management (Hessburg et
al., 2013), urban and regional planning (Plata-Rocha et al., 2011), power generation sites
(Omitaomu et al., 2012), and planning of biogas facilities (Sultana and Kumar, 2012; Höhn et al.,
2014) etc.
Academic papers have examined the wind energy planning nature. Their focus was the
identification and evaluation of the best suitable wind farm location. By using GIS software and
MCDA methods they evaluated certain criteria and proceeded to relevant cartographical results.
More specifically, Höfer et al. (2016) performed a GIS based analysis combined with AHP MCDA
methodology, applied in the Städteregion Aachen. The purpose of the study was to identify and
assess areas that were wind-farm-development-suitable by evaluating nine (9) criteria, and
maximize social acceptance. Relative weights derived from questionnaires of twenty-two (22)
stakeholders and wind experts. Results indicated that only a small area was highly suitable for
wind power development.
Tegou et al. (2010) conducted a study identifying best wind power areas in Lesvos, Greece, by
using GIS software with an AHP approach. After producing constraint criteria for wind energy,
they assigned weights to eight (8) evaluation criteria. A suitability map was produced by adding
the constraint to the evaluation map. The final map indicated that only a few areas were wind-
farm-development-suitable.
Similarly, Georgiou et al. (2012) performed a GIS based MCDA analysis, using AHP method, for
Larnaca, Cyprus. After the implementation of five (5) methodological steps, they found that only
0,1% of the region was suitable for wind power development.
Van Haaren and Fthenakis (2011) formed a Spatial Multi Criteria Analysis (SMCA) methodology
for suitable site identification for wind energy development, in New York, USA. This method,
using GIS software, consists of three (3) stages aiming to find areas where the cost-revenue
7
relationship is optimal, by using Net Present Value index. The results validity was established
through the comparison with already existing wind farms.
Kazak et al. (2017) implemented a Multi Criteria Spatial Decision Support model with GIS
software, for wind turbine location on the settlement of Wroclaw, Poland. That paper was aiming
at creating an open platform, using the CommunityViz tool of ArcGIS, in which decision makers
were changing values of thirteen (13) parameters (social, economical, and environmental).
Depending on the ‘’nature’’ of decision makers and their interaction with the platform, different
alternatives were produced.
Sanchez-Lozano (2016) conducted a study in Murcia, Spain. They incorporated GIS systems and
Fuzzy Multi Criteria Decision Analysis methodology. They combined different MCDA
techniques, such as the Fuzzy AHP and the Fuzzy TOPSIS, to determine and evaluate criteria
weights. They, then, used GIS software to define alternatives and produce their relative maps.
Finally, a sensitivity analysis validated their results. In 2014, the same researchers performed a
GIS-MCDA analysis for the same region using two (2) different methods. These methods would
be lexicographic order and ELECTRE-TRI. By comparing results, authors were able to conclude
that different techniques may result in different possible alternatives (Sanchez-Lozano, 2014).
Atici et al. (2015) implemented a GIS-MCDA methodology for two areas, the Belikisr and
Canakkale, Turkey to define suitable sites of wind power development. The methodology consists
of two (2) steps and includes the application of three (3) MCDA techniques; ELECTREE- III,
ELECTRE-TRI and Stochastic Multiobjective Acceptability Analysis (SMAA-TRI). Results of
MCDA methods were compared and showed consistency. Finally, researchers discussed on how
the proposed methodology could be used by stakeholders and decision makers.
Aydin et al. (2010) formed a decision support framework for wind energy in Turkey, using a GIS
platform and two (2) MCDA methods; Fuzzy sets and Ordered Weighted Averaging (OWA).
Fuzzy sets were used to describe environmental objectives of the study, whereas the OWA method
was used to aggregate environmental objectives satisfaction degree.
Latinopoulos and Kechagia (2015) created a methodology to determine suitable wind power
locations in the region of Kozani, Greece. Researchers implemented Fuzzy Sets by making good
use of GIS systems. Results showed that 12% of the area was suitable for wind energy forming a
valuable decision base for planners and decision makers.
8
Baban and Pary (2001) performed a GIS analysis for identifying suitable wind power development
areas in Lancashire, UK. Criteria used on the methodology, were formed by using questionnaires,
intended for developers and public bodies. Two (2) methodologies were implemented; on the first
one, equal weights were assigned to criteria. On the second one a pairwise analysis was applied,
which turned out to be more efficient.
Ramírez-Rosado et al. (2008) investigated possible wind farm locations in La Rioja, Spain. A
methodological framework was created in a GIS environment using two (2) steps; a criteria map
that was formed based on stakeholders’ preferences and a production of tolerance maps for each
stakeholder. The later, produced different maps for different stakeholders and not an aggregated
one. Nevertheless, unanimity was partly reached.
Weiss et al. (2018) applied a wind power development suitability analysis of coastal Southern
Brazil areas. DELPHI and AHP methods were used with a GIS platform. The methodology
includes the determination of constraint and exclusion areas and was completed by producing
suitability maps.
Azizi et al. (2014) performed a study for suitable wind energy development sites for Ardabil, Iran.
This research incorporated two (2) MCDA methods, ANP and Decision-Making Trial and
Evaluation Laboratory (DEMATEL) that were implemented through a GIS environment. Study
results indicated that only 6.68% could be identified as suitable. Finally, a sensitivity analysis was
conducted and proved the applied method to be wind-farm-spatial-planning-adequate.
It is becoming clearer that multiple GIS-MCDA methods exist in literature for a variety of sites.
The selection of each methodology is based on factors related to minimization of decision makers’
preferences subjectivity, validity of the results, and user ability to understand methodological
procedures (Atici and Ulucan, 2011). Many studies incorporated more than one MCDA technique
to check the validity of their results.
According to the author’s knowledge, this kind of research, concerning Nova Scotia, Canada, has
not been conducted yet. As it was mentioned, a GIS based MCDA approach will be applied, to
define suitable wind power development areas for that Atlantic region. During the next Chapter 3,
the methodological framework of this study will be presented.
9
3. Methodology
3.1 Introduction
The identification of wind power development suitable areas involves analysis and consideration
of criteria with their combination including, environmental, social, economical, and technical
factors. Meanwhile, different parties may express preferences to be taken into account in siting
process, to minimize social resistance and protect sensitive areas (e.g. urban areas, natural
landscapes). Moreover, stakeholders may perceive different satisfactory locations (alternatives)
for wind farm installation (Tegou et al., 2010). It is noticeable that wind farm planning forms an
MCDA problem that needs to be resolved by reaching a consensus among decision makers
(Ramirez-Rosado et al., 2008). The implementation of GIS systems offers necessary tools to
analyze components of that spatial decision problem, while MCDA theory, if incorporated with
GIS, has the ability to offer comprehensive solutions (Malczewski and Rinner, 2015).
A very important step in the GIS MCDA approach for solving a spatial dimension problem, is the
criteria selection that are used as inputs. It is of high significance that criteria should fully describe
the decision problem and be quantifiable (Malczewski and Rinner, 2015; Eastman et al., 1993). In
this study, two (2) types of criteria are used; constraint criteria that determine areas excluded for
wind power development, using Boolean Logic (True/False), and evaluation criteria which assess
the whole study area based on decision maker’s preferences.
The MCDA technique utilized in this study, will be the Simple Additive Weighting approach. AHP
helps to assign weights on the evaluation criteria based on decision makers preferences. The
combination of GIS systems with AHP is very common among researches, due to advantages that
it offers in Decision Making process (Malczewski, 2006).
Finally, the determination of areas suitable for wind energy development is based on the Weighted
Linear Combination (WLC), also known as Weighted Overlay (Malczewski, 2006).
3.2 The Methodology steps
The Methodology followed, was based on the methodological procedure proposed by Tegou et al.
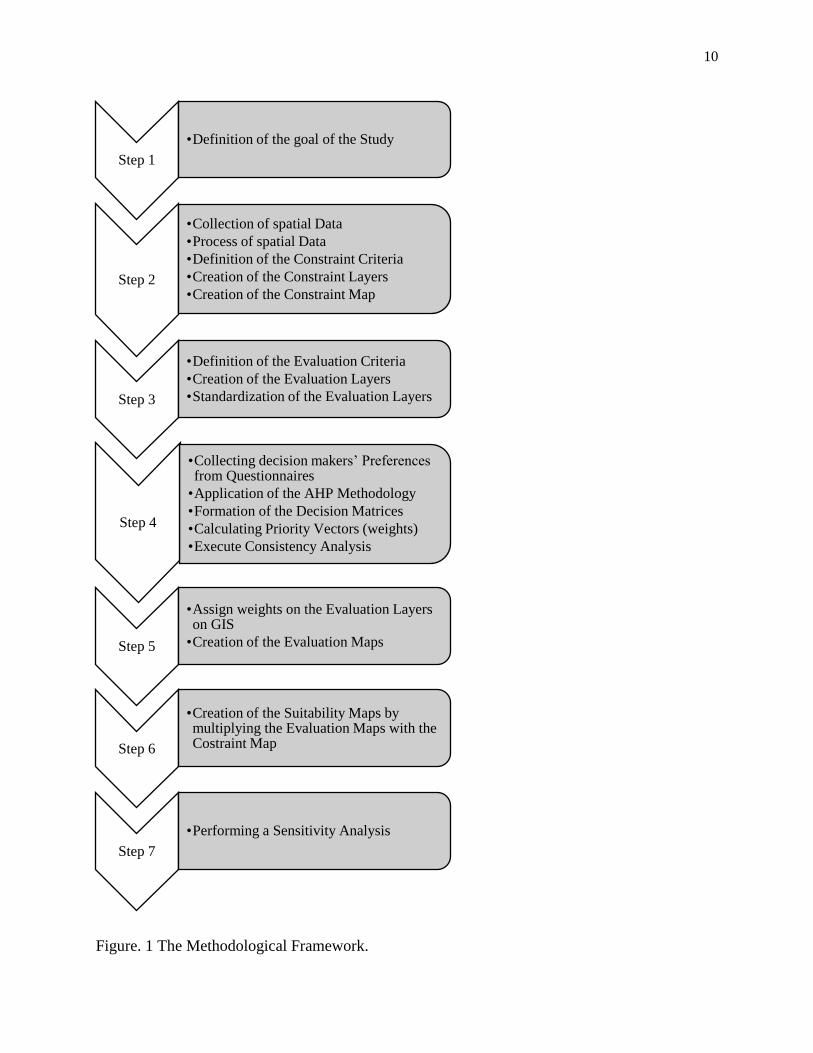
(2010) and Höfer et al. (2016). It follows seven (7) distinctive steps, the implementation of which
leads to the formation of the respective cartographical results and relative conclusions. The flow
chart below (Figure. 1) illustrates the methodological framework of this study.
10
Figure. 1 The Methodological Framework.
Step 1
•Definition of the goal of the Study
Step 2
•Collection of spatial Data
•Process of spatial Data
•Definition of the Constraint Criteria
•Creation of the Constraint Layers
•Creation of the Constraint Map
Step 3
•Definition of the Evaluation Criteria
•Creation of the Evaluation Layers
•Standardization of the Evaluation Layers
Step 4
•Collecting decision makers’ Preferences from Questionnaires
•Application of the AHP Methodology
•Formation of the Decision Matrices
•Calculating Priority Vectors (weights)
•Execute Consistency Analysis
Step 5
•Assign weights on the Evaluation Layers on GIS
•Creation of the Evaluation Maps
Step 6
•Creation of the Suitability Maps by multiplying the Evaluation Maps with the Costraint Map
Step 7
•Performing a Sensitivity Analysis
11
3.2.1 Step 1: Study Goal Definition
The main study goal will be the identification of the areas suitable for wind energy development
in the province of Nova Scotia. The necessity of finding these areas, derives from the fact that the
province has committed to incorporate more RES on its energy mix and reduce the level of Green
House Emissions in upcoming years. Moreover, wind is the primary RES mostly contributing to
this alteration, while Nova Scotia, according to its size, seems capable of hosting more wind
development projects. However, this development should minimize the environmental impact and
increase public acceptance. The result of this research would be the relative map creation for the
final suitable areas where wind power could be depicted and assessed.
3.2.2 Step 2: Constraint Criteria and Map Creation
The constraint criteria are identified based on the relative literature and existing legislation of Nova
Scotia and Canada. Then, the necessary spatial data are collected and processed accordingly, in
order to create the Constraint criteria layers. The formation of the Constraint map will be the result
of the multiplication of the previously formed Constraint layers.
Collecting and Processing GIS Data
For the implementation of step 2, the ArcGIS 10.5.1 Software is utilized, using a student license
provided by Uppsala University. The data needed for the analysis of the study area and the process
both of Constraint and Evaluation criteria were provided under a license of Dalhousie University
(GIS Center-Killam Memorial Library), Halifax, Nova Scotia, Canada (Appendix D, Table D1).
The data collected were both shapefiles (Feature Data) and Raster Data.
The ArcToolbox, provided on ArcGIS, will be used to further process the data, calculate, and
create the relative maps. The steps followed on GIS for the creation of the Constraint, the
Evaluation, and the Suitability map will be presented in the subchapters that follow.
Constraint Criteria Definition
In order to define the areas that should be considered as the ones excluded from the wind power
development, a number of Constraint criteria will be determined. These criteria should be able to
describe the environmental, social, technical, cultural etc. characteristics of Nova Scotia that need
12
to be preserved. The Constraint criteria that are to be used will be extracted by an extensive
research on the planning documents of eighteen (18) province municipalities, known as Municipal
Land-Use Bylaws, on the planning documents of other Provinces such as Ontario, Alberta, and
New Brunswick, on the guideline documents for wind farm planning prepared for the
Municipalities of Nova Scotia known as ‘’Model Wind Turbine By-laws and Best Practices for
Nova Scotia Municipalities’’, and the relative scientific literature (Tables D2, D3).
A total number of twenty-six (26) Constraint criteria, divided into seven (7) categories, (Appendix
D, Table D4) will be identified and used as an input on the GIS software to create and calculate
the Constraint map. These criteria are discussed and presented below.
Wind Potential
The areas considered as unsuitable for wind power development would be the ones where average
wind speed will be inadequate for a wind farm to produce energy in a cost-effective way. This
criterion will be of the highest importance for wind farm planning and areas with low wind speeds
would not be taken into account. Different research papers use different wind speed thresholds.
Tegou et al. (2010) uses a limit of 4 m/s; Latinopoulos and Kechagia (2015) uses a limit of 4.5
m/s. In this study, the areas with average wind speeds less than 6 m/s will be considered unsuitable
for wind power, same as in Höfer et al., 2016 and Villacreses et al., 2017. Moreover, the power
curve from the Enercon E-92 2,35 MW wind turbine was also advised to decide on the wind speed
limit. (Enercon, 2015), which will be our reference. This wind turbine is utilized by the majority
of forty-five (45) wind farms in Nova Scotia.
Slopes
As slopes are expressing alterations in elevation of earth’s surface, we decided to use them as a
technical criterion to decide on the surface study area availability (DiBiase, 2018). Slopes is an
important technical criterion as it denotes areas of construction related challenges, such as crane’s
possibility to be installed and used for the assembly of wind turbines (Van Haaren and Fthenakis,
2011).Various thresholds were proposed on the relative literature ranging from 7% to 30% (Höfer
et al., 2016; Van Haaren and Fthenakis, 2011; Tegou et al., 2010; Latinopoulos and Kechagia,
2015; Gigovic et al., 2017; Atici et al., 2010). In this study a threshold of 25% will be used,
meaning that areas with slopes higher than 25% will be excluded.
13
Distance from Urban Areas
The purpose of this criterion is to mitigate the negative impacts of wind power on settled areas.
These impacts are intertwined with noise and visual disturbances, leading to an appropriate setback
distance that will be kept from urban areas and dwellings, able to smooth and adverse the negative
affects of these impacts. Nova Scotia Municipal By-Laws propose different setback distance for
this criterion. For instance, the majority of municipalities require a 1000 m distance from urban
areas where others suggest 500 m to 700 m or a distance equal to three (3) times the height of the
wind turbine (Halifax Regional Municipality, 2013; Annapolis County, 2011; County of
Antigonish, 2009; Municipality of the County of Colchester, 2013; Municipality of Cumberland,
2016; County of Inverness, 2012; County of Kings, 2012; Municipality of the County of Pictou,
2007, County of Richmond, 2010; County of Victoria, 2014; Municipality of Argyle, 2016;
Municipality of the District of Barrigton, 2013; Municipality of the District of Digby, 2010;
Municipality of the District of Shelburne, 2015). Accordingly, the Best Practices for Nova Scotia
Municipalities Report suggest a setback distance between 1000 m to 1600 m (Union of Nova
Scotia Municipalities, 2008), while, in academic literature, setback distances vary from 500 m to
5000 m (Höfer et al., 2016; Van Haaren and Fthenakis, 2011; Tegou et al., 2010; Latinopoulos and
Kechagia, 2015; Gigovic et al., 2017; Atici et al., 2010; Tsoutsos et al., 2015). In this study, a
buffer zone of 1000 m will be used. Areas found inside the buffer zone will be excluded.
Infrastructure (Roads, Transmission Lines, Railways, and Airports)
This category consists of three (3) individual criteria; the road network, the transmission lines, and
the railways. The importance of these criteria is relevant to safety issues related to technical failures
that could jeopardize public safety such as blade/rotor runaway, turbine structural failure, and ice-
thrown (CanWEA, 2007; Union of Nova Scotia Municipalities, 2008). Moreover, the proximity of
investigated areas for wind power to the electrical network could significantly reduce connection
costs (i.e constructing substations and connection lines). The setback distances from road network
and railway proposed by the Municipal By-Laws will be mostly one (1) to two (2) times the height
of wind turbine (Annapolis County, 2011; County of Antigonish, 2009; Municipality of the County
of Colchester, 2013; Municipality of Cumberland, 2016; Municipality of the District of
Guysborough, 2013; Municipality of the District of Yarmouth, 2011). Another approach is
14
suggested by the Canadian Wind Energy Association (2007) for the province of Ontario, where
setback distance will be equal to the length of one blade plus 10 m. As far as transmission lines
are concerned, Atici et al. (2015), uses a 250 m setback distance. In this study a 200 m distance
from roads and railways will be used, equal to two (2) times the relevant height of the reference
wind turbine that will be 100 m. For transmission lines a distance equal to 250 m will be used.
Another important criterion will be Airports and an appropriate setback distance will be kept. The
importance of this criterion is highlighted by the fact that wind farms may block aviation routes
emerging the danger of potential collision. Despite the use of special lighting and blade painting
to adverse this possibility, keeping a safety distance from airports is a prerequisite for wind farm
development in Nova Scotia (Union of Nova Scotia Municipalities, 2008). The suggested distance
from main airports, in this case the Stanfield International Halifax Airport, will be 10 km. As a
result, a buffer zone of 10 km will be created around the Airport.
Environmental Protected Areas
The protection of the environmentally sensitive areas including landscapes, local and migrate
fauna (birds, deer, mooses, etc.), and flora, as well as natural habitats, wetlands, and institutionally
protected areas etc., is of high significance for the development of wind energy. In order to do so,
appropriate setback distances will be preserved. There is a great variety of setback distances used
in relative research papers and the type of environmental areas to be protected. The constraint
areas for this criterion will be:
• National and Provincial Parks
• Wetlands and watercourses (RAMSAR areas, Rivers, and Heritage Rivers)
• Lakes
• Wildlife Areas and Sanctuaries
• Important Bird Areas (IBAs)
• Special Places including Natural Reserves
• Deer and Moose migratory corridors
• Forests, including Old Forest Communities
Different setback distances are used for the various types of environmental areas. Table. 1 presents
protection distances for each category. The setback distances selection will be based on various
documents and existing literature (Halifax Regional Municipality, 2013; Region of Queens
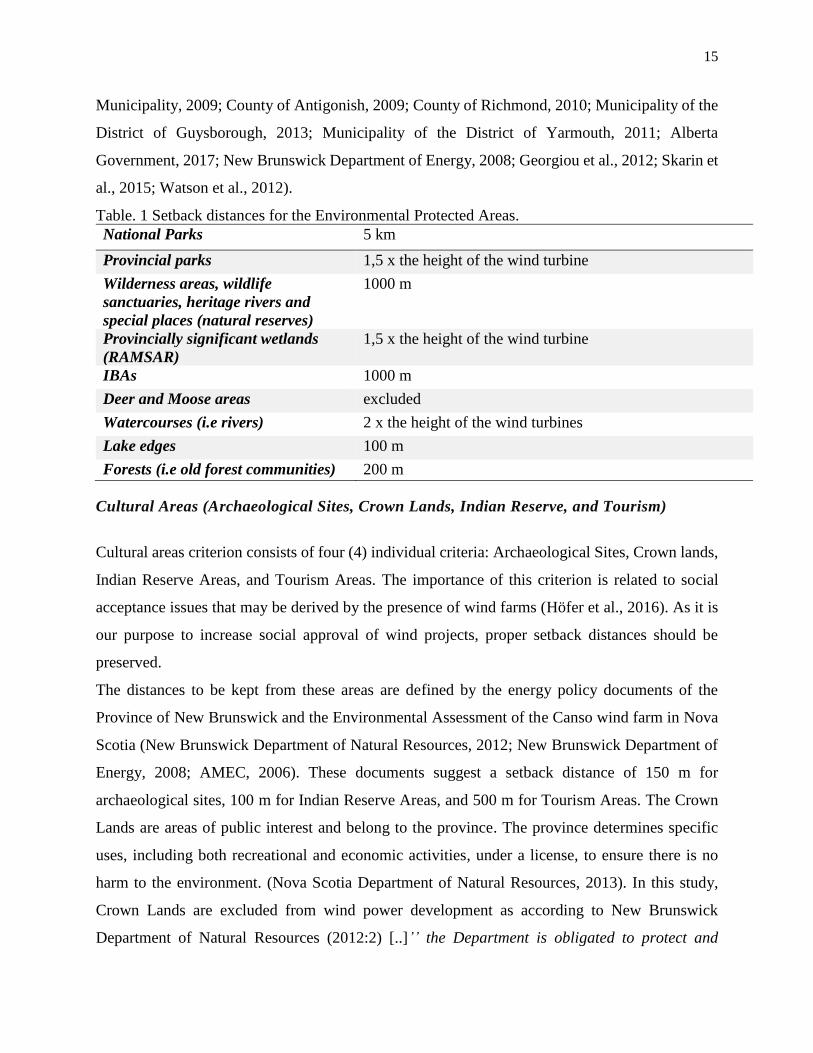
15
Municipality, 2009; County of Antigonish, 2009; County of Richmond, 2010; Municipality of the
District of Guysborough, 2013; Municipality of the District of Yarmouth, 2011; Alberta
Government, 2017; New Brunswick Department of Energy, 2008; Georgiou et al., 2012; Skarin et
al., 2015; Watson et al., 2012).
Table. 1 Setback distances for the Environmental Protected Areas.
National Parks 5 km
Provincial parks 1,5 x the height of the wind turbine
Wilderness areas, wildlife
sanctuaries, heritage rivers and
special places (natural reserves)
1000 m
Provincially significant wetlands
(RAMSAR)
1,5 x the height of the wind turbine
IBAs 1000 m
Deer and Moose areas excluded
Watercourses (i.e rivers) 2 x the height of the wind turbines
Lake edges 100 m
Forests (i.e old forest communities) 200 m
Cultural Areas (Archaeological Sites, Crown Lands, Indian Reserve, and Tourism)
Cultural areas criterion consists of four (4) individual criteria: Archaeological Sites, Crown lands,
Indian Reserve Areas, and Tourism Areas. The importance of this criterion is related to social
acceptance issues that may be derived by the presence of wind farms (Höfer et al., 2016). As it is
our purpose to increase social approval of wind projects, proper setback distances should be
preserved.
The distances to be kept from these areas are defined by the energy policy documents of the
Province of New Brunswick and the Environmental Assessment of the Canso wind farm in Nova
Scotia (New Brunswick Department of Natural Resources, 2012; New Brunswick Department of
Energy, 2008; AMEC, 2006). These documents suggest a setback distance of 150 m for
archaeological sites, 100 m for Indian Reserve Areas, and 500 m for Tourism Areas. The Crown
Lands are areas of public interest and belong to the province. The province determines specific
uses, including both recreational and economic activities, under a license, to ensure there is no
harm to the environment. (Nova Scotia Department of Natural Resources, 2013). In this study,
Crown Lands are excluded from wind power development as according to New Brunswick
Department of Natural Resources (2012:2) [..]’’ the Department is obligated to protect and
16
enhance the value of Crown Lands, and to manage these lands in a sustainable manner’’.
However, that does not mean that Crown Lands should not be used by wind developers. As Crown
Lands are considered to be public space, it is the main goal of this study to protect them,
minimizing public resistance (Nova Scotia Department of Natural Resources, 2013).
Land Use (High Productivity Lands and Military Areas)
This criterion consists of three (3) individual criteria; Agriculture areas, Forestry areas, and
Military areas. Our purpose is to protect High Productivity Lands and, more specifically,
Agriculture and Forestry activities, from the expansion of wind development, as it is incorporated
in the methodology proposed by Tegou et al. 2010. Agriculture and Forestry areas are valuable
sources of wealth that may be decreased by the development of wind farms, an activity requires
space. Moreover, it is also very important to keep distances from Military areas mainly for reasons
relevant to military telecommunications disruption (Union of Nova Scotia Municipalities, 2008).
Nevertheless, no setback distance is kept from High Productivity Lands and Military areas in this
study, but they were excluded altogether. In general, High Productivity Lands could be used for
wind power development and defining safe distances is a case-by-case study. On the other hand,
as it was impossible to identify Military Radars in the area, Military areas were simply denoted as
sites restricted for wind power.
Creation of Constraint Layers and Map on GIS
Every Constraint criterion, described previously, is represented on GIS by a unique layer that we
called Constraint layer. All Constraint layers take the value of zero (0) when considered unsuitable
for wind power and the value of one (1) when suitable.
The final Constraint map will be created by multiplying Constraint layers using the Spatial Analyst
toolbox, that performs ‘’a single Map Algebra based on Python Syntax’’ (Esri Tool Help, 2017).
The final Constraint map is presented on Chapter. 5 Results.
3.2.3 Step 3: Evaluation Criteria
Definition of the Evaluation Criteria
17
The assessment of suitable areas for wind power development will be achieved by determining the
Evaluation criteria. Their purpose is to assess the whole area of Nova Scotia based on the
preferences of decision makers. This assessment will be possible through a procedure called
standardization. Standardization is necessary to compare and combine criteria with different
characteristics (distance, percentages, speed etc.). In the standardization procedure, score values
will be accredited to criteria. The most common method, as identified in Tegou et al. (2010) and
Baban and Parry (2001), will be the maximum score method, a technique elaborated in Malczewski
(1999). In this study, a simplest method for standardizing Evaluation criteria will be applied as it
was implemented on Harrison (2012).
The first step will be to assign grading values to criteria. This is possible by dividing the maximum
grading value to be assigned, in this case one (1), by the number of classes formed on each
criterion. Then, this number is subtracted from each class, starting from the class considering
having the highest grading value to the one considering having the lowest. The formed grading
values will, then, be multiplied by ten (10) to get value scores.
The number of criteria to be used for the evaluation of Nova Scotia will be eight (8). These criteria
derived from the analysis of criteria used on the relevant research papers (Appendix D, Table D2).
A description of those Evaluation criteria is provided below.
Wind Potential
Wind Potential will be the most important criterion for the assessment of the study area, as it
denotes the places with the maximum energy output potential (Tegou et al., 2010). The wind data
used for this assessment will be the Wind Atlas of Nova Scotia measured eighty (80) meters above
the ground with a spatial resolution of 100 m. The Wind Atlas represents the average wind speeds
existing in the province and was measured using more than 5-years weather data from a total of
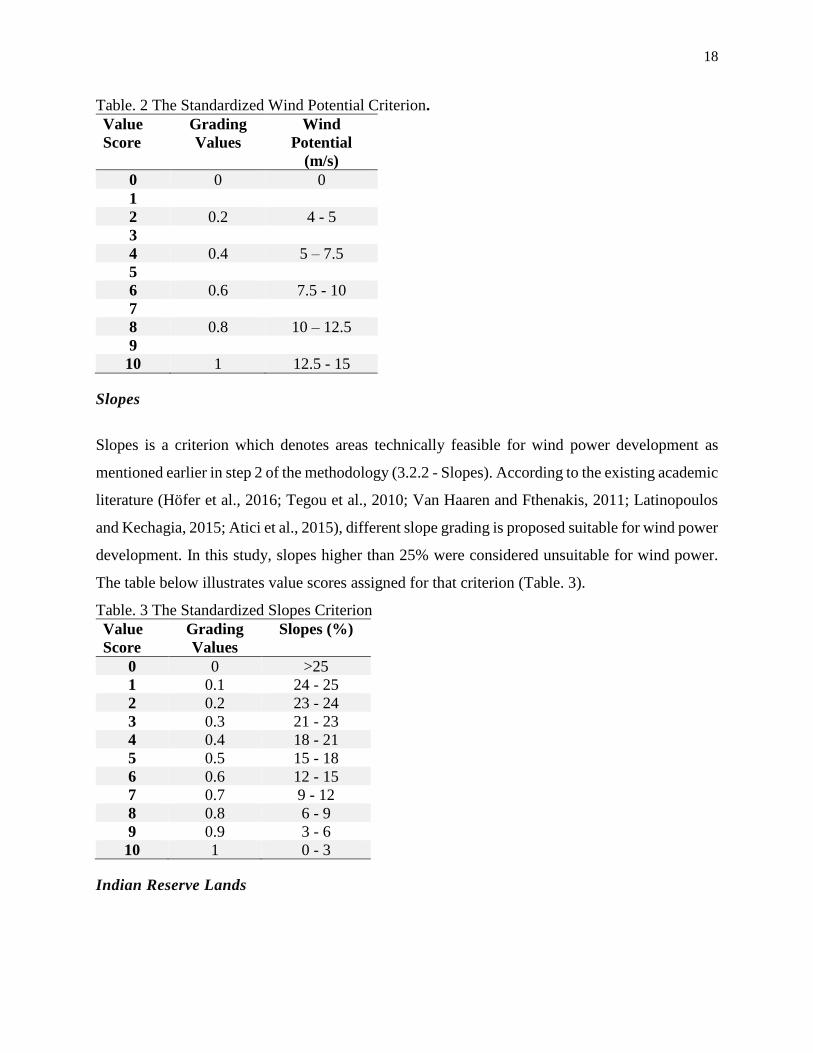
forty-eight (48) weather stations (Nova Scotia Department of Natural Resources, 2017). Value
scores, Wind Potential classes, and their corresponding grading values, were assigned to this
criterion based on the power curve of the reference wind turbine (Enercon E-92) (Enercon, 2015)
as the table below depicts (Table. 2).
18
Table. 2 The Standardized Wind Potential Criterion.
Value
Score
Grading
Values
Wind
Potential
(m/s)
0 0 0
1
2 0.2 4 - 5
3
4 0.4 5 – 7.5
5
6 0.6 7.5 - 10
7
8 0.8 10 – 12.5
9
10 1 12.5 - 15
Slopes
Slopes is a criterion which denotes areas technically feasible for wind power development as
mentioned earlier in step 2 of the methodology (3.2.2 - Slopes). According to the existing academic
literature (Höfer et al., 2016; Tegou et al., 2010; Van Haaren and Fthenakis, 2011; Latinopoulos
and Kechagia, 2015; Atici et al., 2015), different slope grading is proposed suitable for wind power
development. In this study, slopes higher than 25% were considered unsuitable for wind power.
The table below illustrates value scores assigned for that criterion (Table. 3).
Table. 3 The Standardized Slopes Criterion
Value
Score
Grading
Values
Slopes (%)
0 0 >25
1 0.1 24 - 25
2 0.2 23 - 24
3 0.3 21 - 23
4 0.4 18 - 21
5 0.5 15 - 18
6 0.6 12 - 15
7 0.7 9 - 12
8 0.8 6 - 9
9 0.9 3 - 6
10 1 0 - 3
Indian Reserve Lands
19
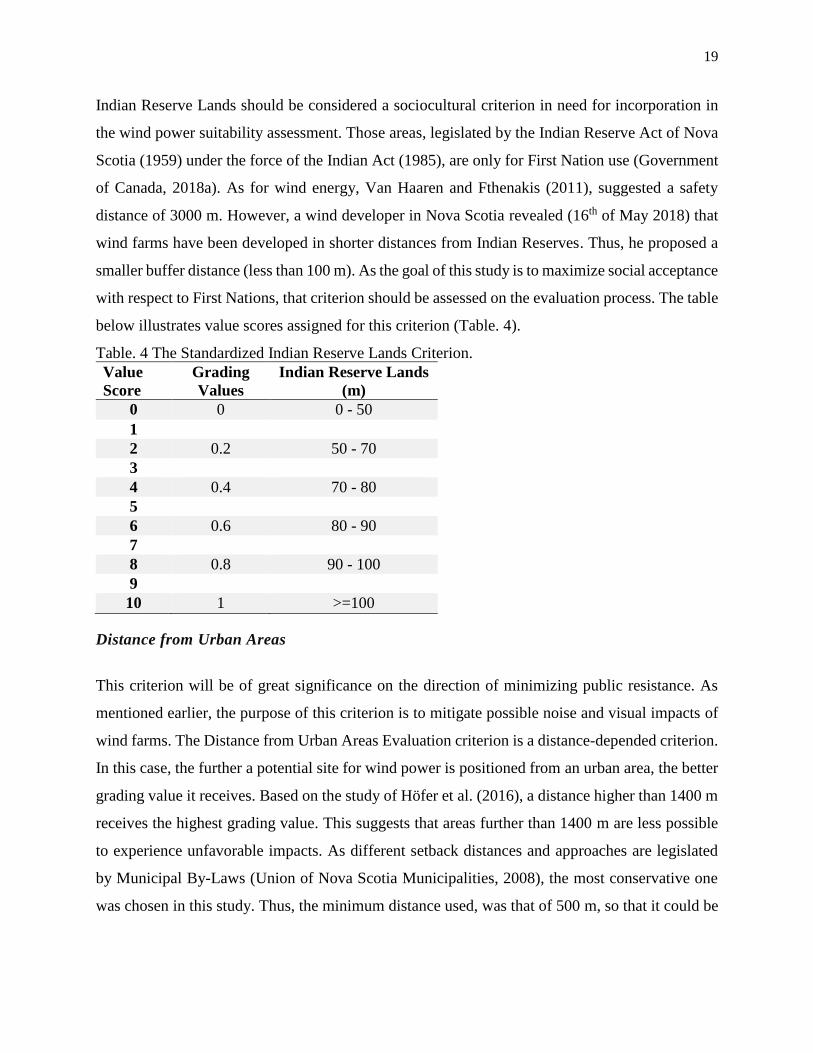
Indian Reserve Lands should be considered a sociocultural criterion in need for incorporation in
the wind power suitability assessment. Those areas, legislated by the Indian Reserve Act of Nova
Scotia (1959) under the force of the Indian Act (1985), are only for First Nation use (Government
of Canada, 2018a). As for wind energy, Van Haaren and Fthenakis (2011), suggested a safety
distance of 3000 m. However, a wind developer in Nova Scotia revealed (16th of May 2018) that
wind farms have been developed in shorter distances from Indian Reserves. Thus, he proposed a
smaller buffer distance (less than 100 m). As the goal of this study is to maximize social acceptance
with respect to First Nations, that criterion should be assessed on the evaluation process. The table
below illustrates value scores assigned for this criterion (Table. 4).
Table. 4 The Standardized Indian Reserve Lands Criterion.
Value
Score
Grading
Values
Indian Reserve Lands
(m)
0 0 0 - 50
1
2 0.2 50 - 70
3
4 0.4 70 - 80
5
6 0.6 80 - 90
7
8 0.8 90 - 100
9
10 1 >=100
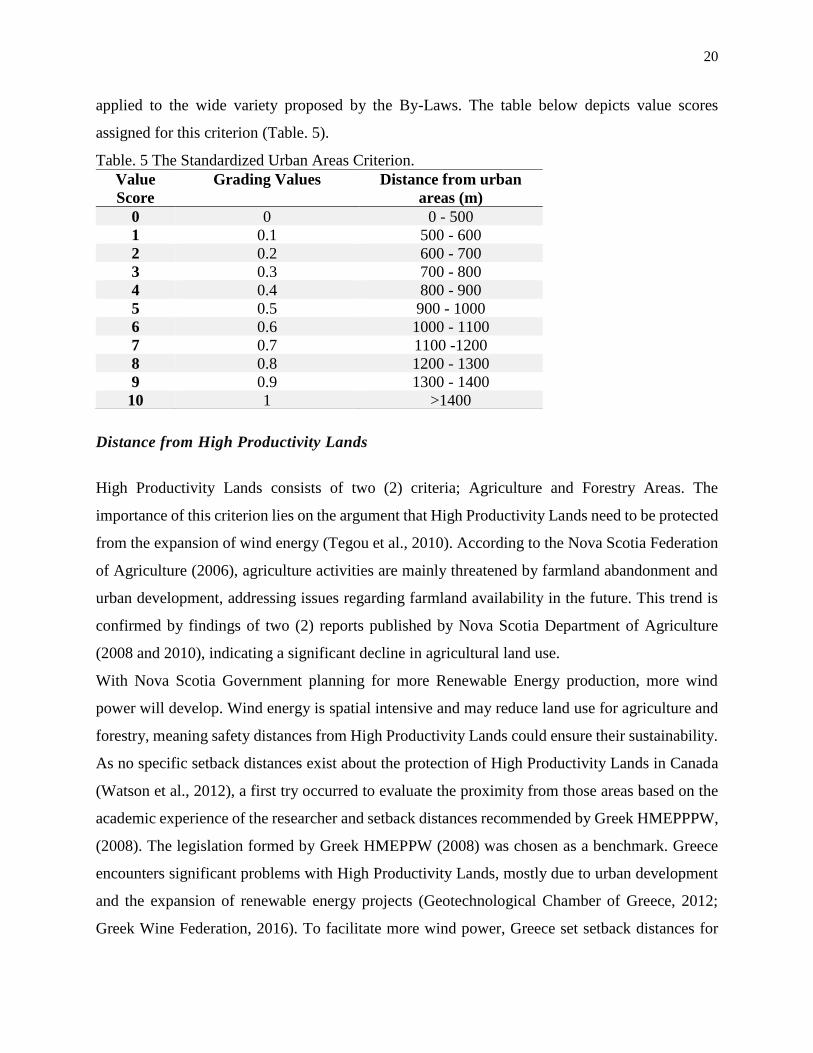
Distance from Urban Areas
This criterion will be of great significance on the direction of minimizing public resistance. As
mentioned earlier, the purpose of this criterion is to mitigate possible noise and visual impacts of
wind farms. The Distance from Urban Areas Evaluation criterion is a distance-depended criterion.
In this case, the further a potential site for wind power is positioned from an urban area, the better
grading value it receives. Based on the study of Höfer et al. (2016), a distance higher than 1400 m
receives the highest grading value. This suggests that areas further than 1400 m are less possible
to experience unfavorable impacts. As different setback distances and approaches are legislated
by Municipal By-Laws (Union of Nova Scotia Municipalities, 2008), the most conservative one
was chosen in this study. Thus, the minimum distance used, was that of 500 m, so that it could be
20
applied to the wide variety proposed by the By-Laws. The table below depicts value scores
assigned for this criterion (Table. 5).
Table. 5 The Standardized Urban Areas Criterion.
Distance from High Productivity Lands
High Productivity Lands consists of two (2) criteria; Agriculture and Forestry Areas. The
importance of this criterion lies on the argument that High Productivity Lands need to be protected
from the expansion of wind energy (Tegou et al., 2010). According to the Nova Scotia Federation
of Agriculture (2006), agriculture activities are mainly threatened by farmland abandonment and
urban development, addressing issues regarding farmland availability in the future. This trend is
confirmed by findings of two (2) reports published by Nova Scotia Department of Agriculture
(2008 and 2010), indicating a significant decline in agricultural land use.
With Nova Scotia Government planning for more Renewable Energy production, more wind
power will develop. Wind energy is spatial intensive and may reduce land use for agriculture and
forestry, meaning safety distances from High Productivity Lands could ensure their sustainability.
As no specific setback distances exist about the protection of High Productivity Lands in Canada
(Watson et al., 2012), a first try occurred to evaluate the proximity from those areas based on the
academic experience of the researcher and setback distances recommended by Greek HMEPPPW,
(2008). The legislation formed by Greek HMEPPW (2008) was chosen as a benchmark. Greece
encounters significant problems with High Productivity Lands, mostly due to urban development
and the expansion of renewable energy projects (Geotechnological Chamber of Greece, 2012;
Greek Wine Federation, 2016). To facilitate more wind power, Greece set setback distances for
Value
Score
Grading Values Distance from urban
areas (m)
0 0 0 - 500
1 0.1 500 - 600
2 0.2 600 - 700
3 0.3 700 - 800
4 0.4 800 - 900
5 0.5 900 - 1000
6 0.6 1000 - 1100
7 0.7 1100 -1200
8 0.8 1200 - 1300
9 0.9 1300 - 1400
10 1 >1400
21
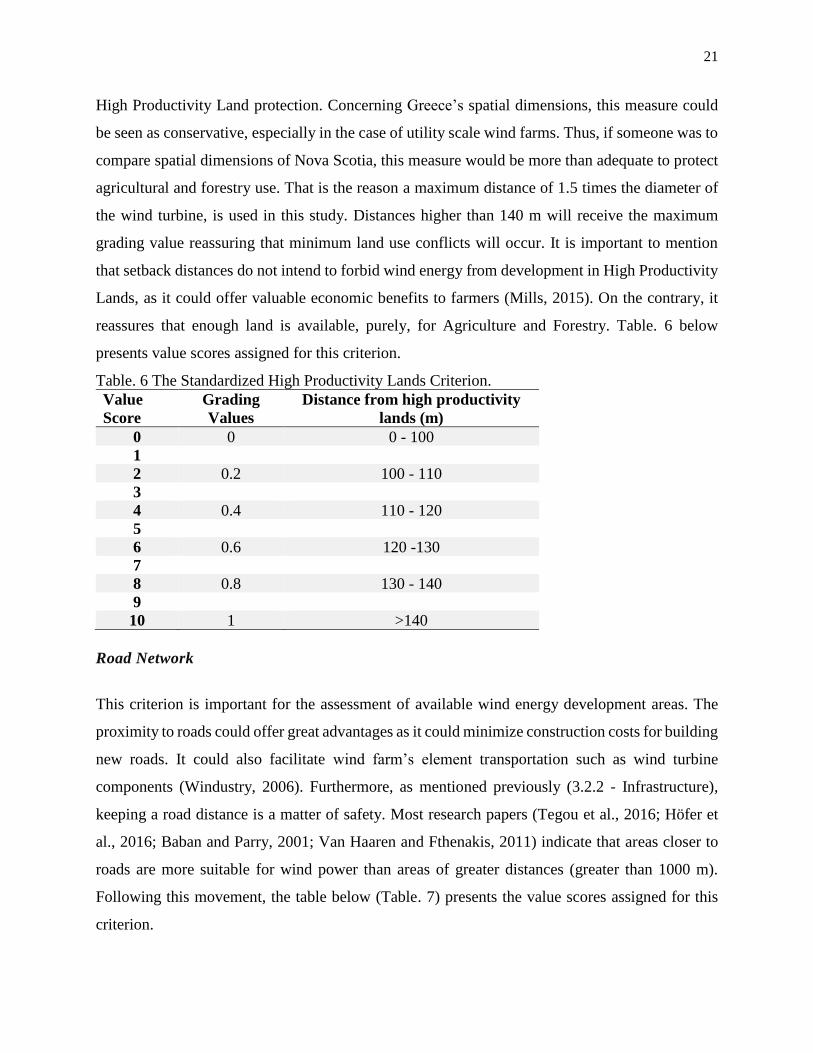
High Productivity Land protection. Concerning Greece’s spatial dimensions, this measure could
be seen as conservative, especially in the case of utility scale wind farms. Thus, if someone was to
compare spatial dimensions of Nova Scotia, this measure would be more than adequate to protect
agricultural and forestry use. That is the reason a maximum distance of 1.5 times the diameter of
the wind turbine, is used in this study. Distances higher than 140 m will receive the maximum
grading value reassuring that minimum land use conflicts will occur. It is important to mention
that setback distances do not intend to forbid wind energy from development in High Productivity
Lands, as it could offer valuable economic benefits to farmers (Mills, 2015). On the contrary, it
reassures that enough land is available, purely, for Agriculture and Forestry. Table. 6 below
presents value scores assigned for this criterion.
Table. 6 The Standardized High Productivity Lands Criterion.
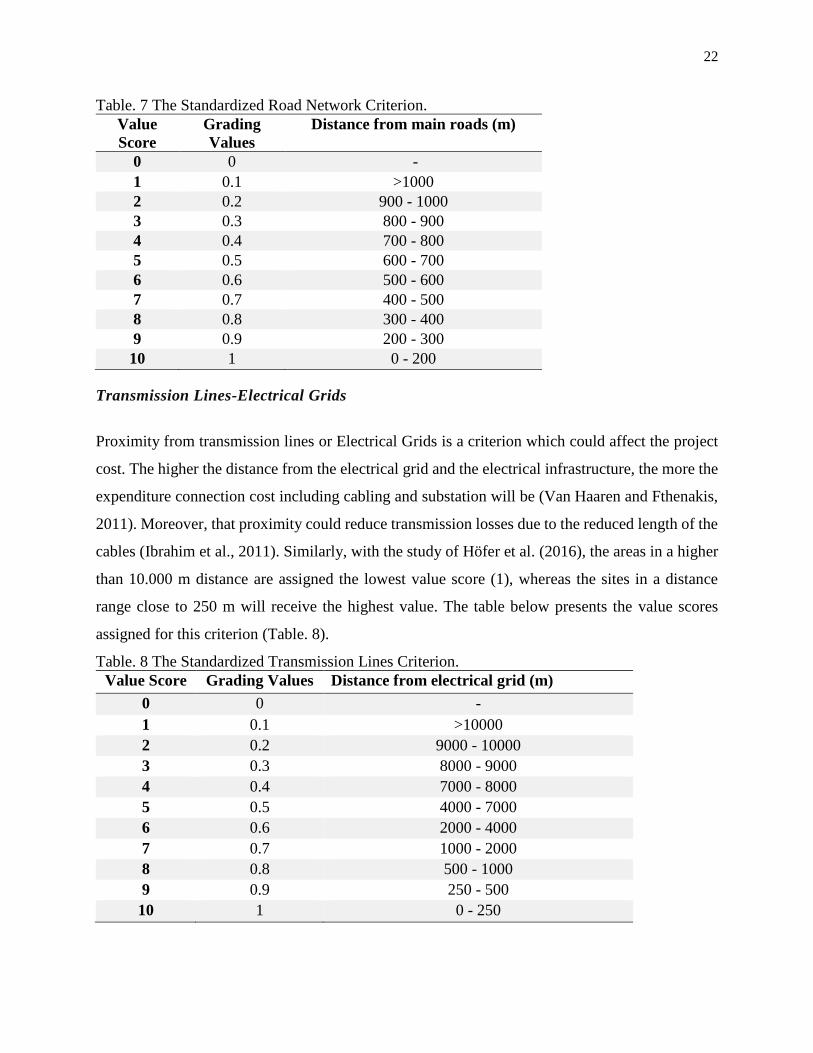
Road Network
This criterion is important for the assessment of available wind energy development areas. The
proximity to roads could offer great advantages as it could minimize construction costs for building
new roads. It could also facilitate wind farm’s element transportation such as wind turbine
components (Windustry, 2006). Furthermore, as mentioned previously (3.2.2 - Infrastructure),
keeping a road distance is a matter of safety. Most research papers (Tegou et al., 2016; Höfer et
al., 2016; Baban and Parry, 2001; Van Haaren and Fthenakis, 2011) indicate that areas closer to
roads are more suitable for wind power than areas of greater distances (greater than 1000 m).
Following this movement, the table below (Table. 7) presents the value scores assigned for this
criterion.
Value
Score
Grading
Values
Distance from high productivity
lands (m)
0 0 0 - 100
1
2 0.2 100 - 110
3
4 0.4 110 - 120
5
6 0.6 120 -130
7
8 0.8 130 - 140
9
10 1 >140
22
Table. 7 The Standardized Road Network Criterion.
Value
Score
Grading
Values
Distance from main roads (m)
0 0 -
1 0.1 >1000
2 0.2 900 - 1000
3 0.3 800 - 900
4 0.4 700 - 800
5 0.5 600 - 700
6 0.6 500 - 600
7 0.7 400 - 500
8 0.8 300 - 400
9 0.9 200 - 300
10 1 0 - 200
Transmission Lines-Electrical Grids
Proximity from transmission lines or Electrical Grids is a criterion which could affect the project
cost. The higher the distance from the electrical grid and the electrical infrastructure, the more the
expenditure connection cost including cabling and substation will be (Van Haaren and Fthenakis,
2011). Moreover, that proximity could reduce transmission losses due to the reduced length of the
cables (Ibrahim et al., 2011). Similarly, with the study of Höfer et al. (2016), the areas in a higher
than 10.000 m distance are assigned the lowest value score (1), whereas the sites in a distance
range close to 250 m will receive the highest value. The table below presents the value scores
assigned for this criterion (Table. 8).
Table. 8 The Standardized Transmission Lines Criterion.
Value Score Grading Values Distance from electrical grid (m)
0 0 -
1 0.1 >10000
2 0.2 9000 - 10000
3 0.3 8000 - 9000
4 0.4 7000 - 8000
5 0.5 4000 - 7000
6 0.6 2000 - 4000
7 0.7 1000 - 2000
8 0.8 500 - 1000
9 0.9 250 - 500
10 1 0 - 250
23
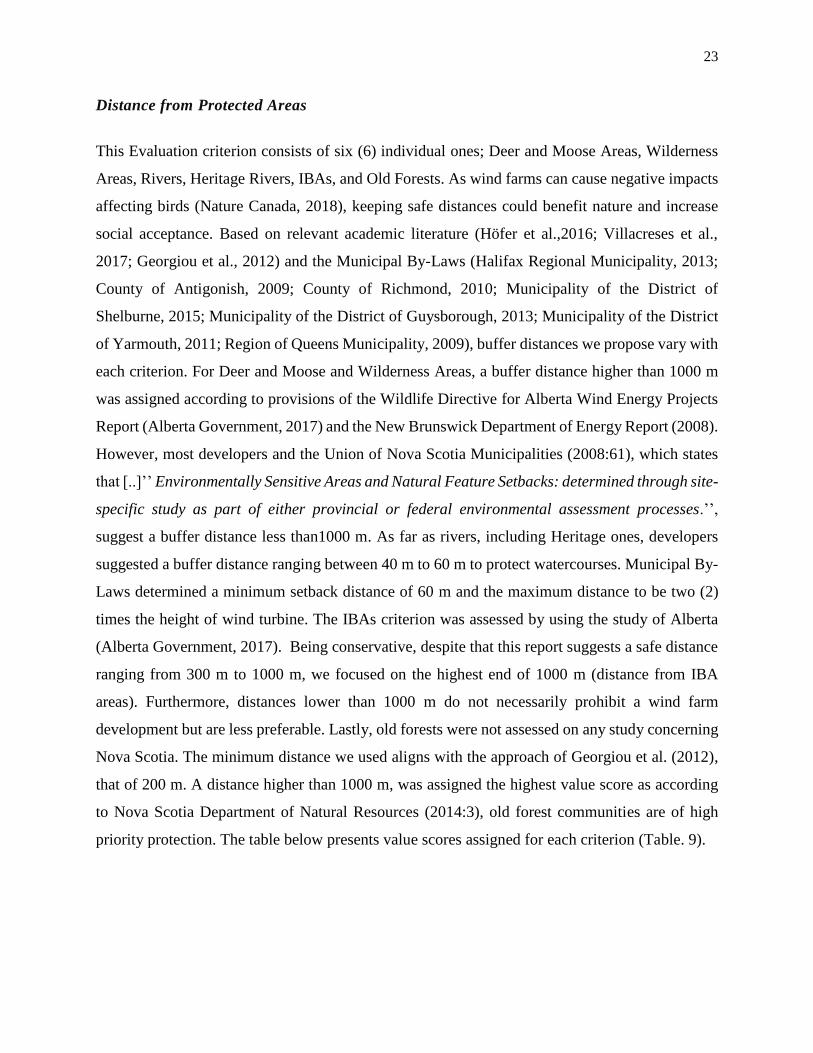
Distance from Protected Areas
This Evaluation criterion consists of six (6) individual ones; Deer and Moose Areas, Wilderness
Areas, Rivers, Heritage Rivers, IBAs, and Old Forests. As wind farms can cause negative impacts
affecting birds (Nature Canada, 2018), keeping safe distances could benefit nature and increase
social acceptance. Based on relevant academic literature (Höfer et al.,2016; Villacreses et al.,
2017; Georgiou et al., 2012) and the Municipal By-Laws (Halifax Regional Municipality, 2013;
County of Antigonish, 2009; County of Richmond, 2010; Municipality of the District of
Shelburne, 2015; Municipality of the District of Guysborough, 2013; Municipality of the District
of Yarmouth, 2011; Region of Queens Municipality, 2009), buffer distances we propose vary with
each criterion. For Deer and Moose and Wilderness Areas, a buffer distance higher than 1000 m
was assigned according to provisions of the Wildlife Directive for Alberta Wind Energy Projects
Report (Alberta Government, 2017) and the New Brunswick Department of Energy Report (2008).
However, most developers and the Union of Nova Scotia Municipalities (2008:61), which states
that [..]’’ Environmentally Sensitive Areas and Natural Feature Setbacks: determined through site-
specific study as part of either provincial or federal environmental assessment processes.’’,
suggest a buffer distance less than1000 m. As far as rivers, including Heritage ones, developers
suggested a buffer distance ranging between 40 m to 60 m to protect watercourses. Municipal By-
Laws determined a minimum setback distance of 60 m and the maximum distance to be two (2)
times the height of wind turbine. The IBAs criterion was assessed by using the study of Alberta
(Alberta Government, 2017). Being conservative, despite that this report suggests a safe distance
ranging from 300 m to 1000 m, we focused on the highest end of 1000 m (distance from IBA
areas). Furthermore, distances lower than 1000 m do not necessarily prohibit a wind farm
development but are less preferable. Lastly, old forests were not assessed on any study concerning
Nova Scotia. The minimum distance we used aligns with the approach of Georgiou et al. (2012),
that of 200 m. A distance higher than 1000 m, was assigned the highest value score as according
to Nova Scotia Department of Natural Resources (2014:3), old forest communities are of high
priority protection. The table below presents value scores assigned for each criterion (Table. 9).
24
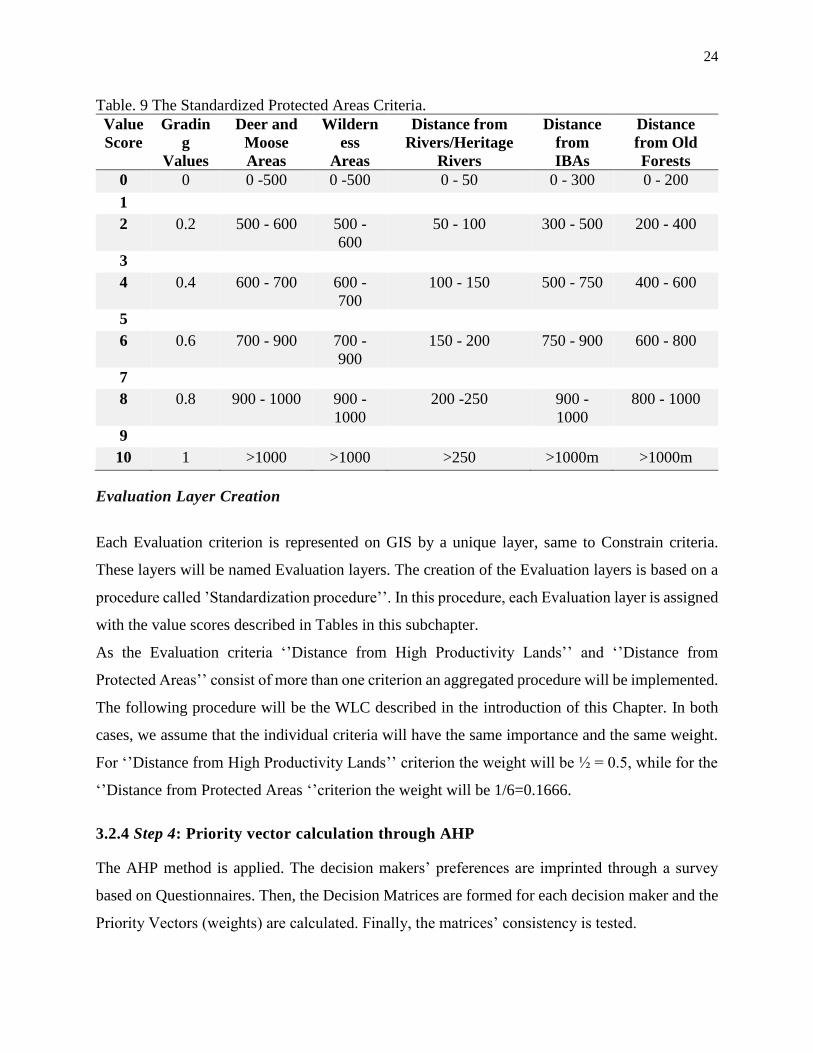
Table. 9 The Standardized Protected Areas Criteria.
Value
Score
Gradin
g
Values
Deer and
Moose
Areas
Wildern
ess
Areas
Distance from
Rivers/Heritage
Rivers
Distance
from
IBAs
Distance
from Old
Forests
0 0 0 -500 0 -500 0 - 50 0 - 300 0 - 200
1
2 0.2 500 - 600 500 -
600
50 - 100 300 - 500 200 - 400
3
4 0.4 600 - 700 600 -
700
100 - 150 500 - 750 400 - 600
5
6 0.6 700 - 900 700 -
900
150 - 200 750 - 900 600 - 800
7
8 0.8 900 - 1000 900 -
1000
200 -250 900 -
1000
800 - 1000
9
10 1 >1000 >1000 >250 >1000m >1000m
Evaluation Layer Creation
Each Evaluation criterion is represented on GIS by a unique layer, same to Constrain criteria.
These layers will be named Evaluation layers. The creation of the Evaluation layers is based on a
procedure called ’Standardization procedure’’. In this procedure, each Evaluation layer is assigned
with the value scores described in Tables in this subchapter.
As the Evaluation criteria ‘’Distance from High Productivity Lands’’ and ‘’Distance from
Protected Areas’’ consist of more than one criterion an aggregated procedure will be implemented.
The following procedure will be the WLC described in the introduction of this Chapter. In both
cases, we assume that the individual criteria will have the same importance and the same weight.
For ‘’Distance from High Productivity Lands’’ criterion the weight will be ½ = 0.5, while for the
‘’Distance from Protected Areas ‘’criterion the weight will be 1/6=0.1666.
3.2.4 Step 4: Priority vector calculation through AHP
The AHP method is applied. The decision makers’ preferences are imprinted through a survey
based on Questionnaires. Then, the Decision Matrices are formed for each decision maker and the
Priority Vectors (weights) are calculated. Finally, the matrices’ consistency is tested.
25
For the creation of the Suitability map, the AHP approach will be implemented in the GIS
environment. The contribution of this MCDA technique is to identify the suitable sites for wind
energy development. This, will be found on the basis of assigning weights to the Evaluation layers
using a pair-wise comparison of the decision makers’ preferences. The popularity of this method,
combined with the GIS systems, is described in Malczewski (2006) who performed a literature
review on the GIS-MCDA research papers existing at the time. Malczewski and Rinner (2015),
comment on GIS-AHP method being the most popular choice when decision making is required
for problems of spatial dimensions. Main reasons for the AHP popularity will be two (2); first,
AHP methods could be easily used in a GIS environment; secondly, AHP methodology could be
easily followed and interpreted by decision makers (Malczewski, 2006).
The Analytical Hierarchy Process is an MCDA method developed by Saaty (1980). Its purpose is
to identify and rank possible alternatives after all Evaluation criteria have been considered and
compared. Different application steps could be found on the implementation of this approach. The
first step will be to analyze and hierarchically structure the problem forming the goal. Then, the
decision criteria will be defined, and the possible alternatives will be determined (San Cristobal
Mateo, 2012). The second step will be the pairwise comparison of the criteria. That would be
possible by using a verbal scale with integer values (Saaty, 1987) ranging from one (1) to nine (9)
(Table. 10), helping decision makers express their preferences or judgements. Following, the
decision matrix will be formed based on the reciprocal ratio created by the comparison of all
decision makers’ preferences for each criterion. The size of the matrix depends on the number of
decision criteria (Tegou et al., 2010). After the format of the decision matrix, the priority vectors
will be calculated by denoting weights for each criterion. That will be possible, by creating the so-
called ‘’normalized matrix’’ (San Cristobal Mateo, 2012). In this procedure, each value of the
normalized matrix is equal to the value of the decision matrix divided by the sum of the column
that it belongs. The sum of each column of the normalized matrix should be equal to one (1). After
the creation of the normalized matrix, priority vectors are calculated for each decision criterion.
The priority vectors are equal to the average value of each row in the normalized matrix (San
Cristobal Mateo, 2012).
Last step of the AHP procedure will be to test the procedure for any inconsistencies. This is
possible by calculating the maximum eigen-value (λmax) and then calculate the Consistency Index
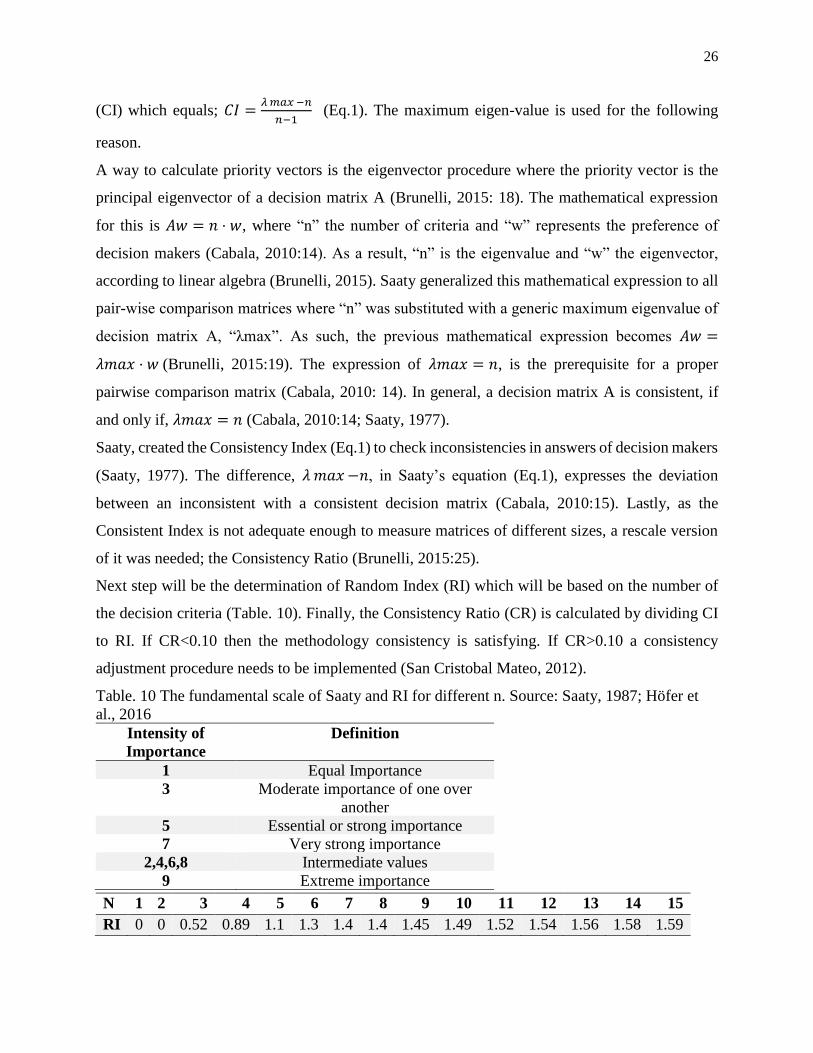
26
(CI) which equals; 𝐶𝐼 =𝜆 𝑚𝑎𝑥 −𝑛
𝑛−1 (Eq.1). The maximum eigen-value is used for the following
reason.
A way to calculate priority vectors is the eigenvector procedure where the priority vector is the
principal eigenvector of a decision matrix A (Brunelli, 2015: 18). The mathematical expression
for this is 𝐴𝑤 = 𝑛 ⋅ 𝑤, where “n” the number of criteria and “w” represents the preference of
decision makers (Cabala, 2010:14). As a result, “n” is the eigenvalue and “w” the eigenvector,
according to linear algebra (Brunelli, 2015). Saaty generalized this mathematical expression to all
pair-wise comparison matrices where “n” was substituted with a generic maximum eigenvalue of
decision matrix A, “λmax”. As such, the previous mathematical expression becomes 𝐴𝑤 =
𝜆𝑚𝑎𝑥 ⋅ 𝑤 (Brunelli, 2015:19). The expression of 𝜆𝑚𝑎𝑥 = 𝑛, is the prerequisite for a proper
pairwise comparison matrix (Cabala, 2010: 14). In general, a decision matrix A is consistent, if
and only if, 𝜆𝑚𝑎𝑥 = 𝑛 (Cabala, 2010:14; Saaty, 1977).
Saaty, created the Consistency Index (Eq.1) to check inconsistencies in answers of decision makers
(Saaty, 1977). The difference, 𝜆 𝑚𝑎𝑥 −𝑛, in Saaty’s equation (Eq.1), expresses the deviation
between an inconsistent with a consistent decision matrix (Cabala, 2010:15). Lastly, as the
Consistent Index is not adequate enough to measure matrices of different sizes, a rescale version
of it was needed; the Consistency Ratio (Brunelli, 2015:25).
Next step will be the determination of Random Index (RI) which will be based on the number of
the decision criteria (Table. 10). Finally, the Consistency Ratio (CR) is calculated by dividing CI
to RI. If CR<0.10 then the methodology consistency is satisfying. If CR>0.10 a consistency
adjustment procedure needs to be implemented (San Cristobal Mateo, 2012).
Table. 10 The fundamental scale of Saaty and RI for different n. Source: Saaty, 1987; Höfer et
al., 2016
Intensity of
Importance
Definition
1 Equal Importance
3 Moderate importance of one over
another
5 Essential or strong importance
7 Very strong importance
2,4,6,8 Intermediate values
9 Extreme importance
N 1 2 3 4 5 6 7 8 9 10 11 12 13 14 15
RI 0 0 0.52 0.89 1.1 1.3 1.4 1.4 1.45 1.49 1.52 1.54 1.56 1.58 1.59
27
In this study, the preferences or judgments to be used as inputs on the AHP methodology, described
above, will be collected from the answers that five (5) decision makers will give in a Questionnaire.
The Questionnaire includes four (4) questions which aim is to imprint experts’ knowledge on wind
power development issues concerning Nova Scotia and capture their preferences by filling out a
decision matrix based on eight (8) Evaluation criteria (Appendix E). The completed questionnaires
will be sent to the author by e-mail or will be filled out during an interview. There were four (4)
wind developers that participated and one (1) Municipality. A total of five (5) decision matrices
were created. The Microsoft Excel Software will be used to perform the AHP calculations while
the Super Decisions software will be incorporated to adjust inconsistencies. Finally, the number
of alternatives will be equal to the cell grid of the study area.
3.2.5 Step 5: Evaluation Map Creation
The weights are assigned to the Evaluation layers, and Evaluation maps are created (one for each
decision maker).
The creation of the evaluation maps will be based on two (2) steps; On the first step, the Evaluation
layers will be assigned with the weights calculated though the application of the AHP analysis. On
the second step, the Evaluation maps will be created by applying the Weighted Overlay technique
or WLC by using the Weighted Overlay tool on GIS. The mathematical expression (Eq.2) of the
WLC will be: 𝑆𝐼𝑗 = ∑ 𝑊𝑖𝑋𝑖𝑗
𝑛
𝑖=1 Eq.2
Where ‘’SIj’’ will be the Suitability Index for the cell j, ‘’Wi’’ is the weight for the evaluation
criterion i and ‘’Xij’’ the value score for the cell j for the evaluation criterion I (i=1, 2,…,8)
(Malczewski and Rinner, 2015).
There will be one Evaluation map created for each decision maker. The rationale behind this
decision can be summarized in the following:
• The creation of an individual Evaluation map, expressing the preferences of the individual
decision makers, permits a higher diversity in the research. Multiple opinions will be
expressed and imprinted cartographically.
• Through the creation of the individual Evaluation maps, the interests of the individual wind
developers, regarding the development of wind energy in Nova Scotia, will be captured
and assessed.
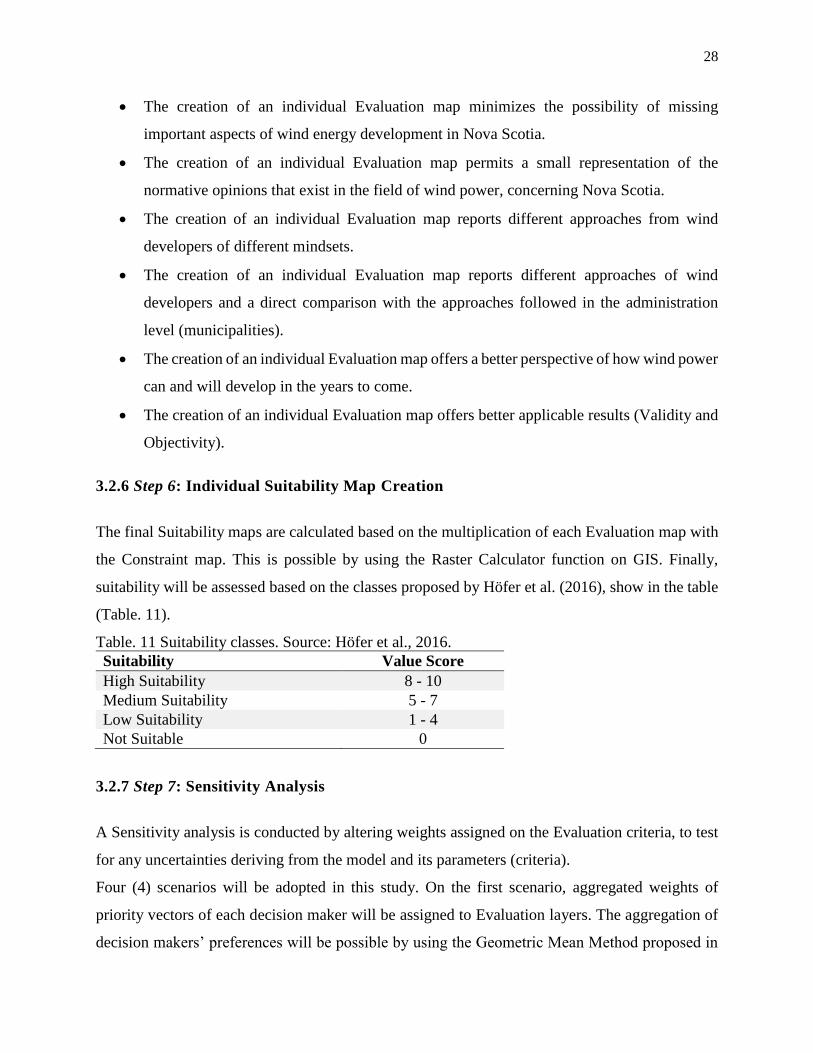
28
• The creation of an individual Evaluation map minimizes the possibility of missing
important aspects of wind energy development in Nova Scotia.
• The creation of an individual Evaluation map permits a small representation of the
normative opinions that exist in the field of wind power, concerning Nova Scotia.
• The creation of an individual Evaluation map reports different approaches from wind
developers of different mindsets.
• The creation of an individual Evaluation map reports different approaches of wind
developers and a direct comparison with the approaches followed in the administration
level (municipalities).
• The creation of an individual Evaluation map offers a better perspective of how wind power
can and will develop in the years to come.
• The creation of an individual Evaluation map offers better applicable results (Validity and
Objectivity).
3.2.6 Step 6: Individual Suitability Map Creation
The final Suitability maps are calculated based on the multiplication of each Evaluation map with
the Constraint map. This is possible by using the Raster Calculator function on GIS. Finally,
suitability will be assessed based on the classes proposed by Höfer et al. (2016), show in the table
(Table. 11).
Table. 11 Suitability classes. Source: Höfer et al., 2016.
Suitability Value Score
High Suitability 8 - 10
Medium Suitability 5 - 7
Low Suitability 1 - 4
Not Suitable 0
3.2.7 Step 7: Sensitivity Analysis
A Sensitivity analysis is conducted by altering weights assigned on the Evaluation criteria, to test
for any uncertainties deriving from the model and its parameters (criteria).
Four (4) scenarios will be adopted in this study. On the first scenario, aggregated weights of
priority vectors of each decision maker will be assigned to Evaluation layers. The aggregation of
decision makers’ preferences will be possible by using the Geometric Mean Method proposed in

29
Yadav and Jayswal (2013). On the second scenario, weights assigned on Evaluation layers will be
equal. On the third scenario, environmental criteria will be assigned with a value of zero (0) weight
as applied on Tegou et al. (2010) while on the fourth scenario, weights will change by using a
defined interval, in this case a ± 10% (Gorsevski et al., 2013). Finally, relevant cartographical
results will be compared with Suitability maps created on the previous step.
30
4. Case Study
4.1 Introduction
The purpose of this background study is to give an overview of Nova Scotia’s demographics,
environmental, and energy characteristics. That will help us assess the context that wind energy is
and can be developed in the future. It also provides a picture of the province’s energy goals and
the means to achieve it. Finally, it presents the contribution of wind power to the overall energy
model of Nova Scotia.
4.2 Demographic Characteristics of Nova Scotia
The province of Nova Scotia (Figure. A1, Appendix A) is geographically located at the South-
Eastern part of Canada. It belongs to the Atlantic region of Canada (Figure. A2, Appendix A),
which consists of four (4) provinces; Nova Scotia, Prince Edward Island, New Brunswick, and
NewFoundland and Labrador. Altogether, Atlantic provinces have a population of 2.333.322
people that represents 6.63% of Canada’s total population, according to the 2016 population
census, that covers an area of 500.531,19 square kilometers, representing 5.6 % of Canada’s total
region (Atlantic Canada Opportunities Agency, 2017; Statistics Canada, 2017).
Nova Scotia, in particular, has a population of 923.598 people, denoting a 0.2% increase from
2011 population census, that represents 39.6% of the Atlantic Provinces region’s total population
and 2.7% of Canada’s total population. It covers an area of 52.942,27 square kilometers that
represents 10.6% of the Atlantic Provinces region’s total area and 0.6% of Canada’s total area.
Nova Scotia is Canada’s second smallest Province after the province of Prince Edward Island. The
population density has been estimated to be 17.4 people per square kilometer, while the country
population density is 3.9 people per square kilometer (Historica Canada, 2017; Statistics Canada,
2017). Moreover, the capital of the province, identified in the metropolitan area of the city of
Halifax, consists of a population of 403.131 people, according to 2016 population census,
indicating a 3.3% increase since 2011 (Nova Scotia Department of Municipal Affairs, 2016).
Finally, Nova Scotia could be divided in two (2) parts; the mainland and the island of Cape Breton.
The mainland consists of an area of 34.400 square kilometers and Cape Breton island covers an
area of approximately 18.542 square kilometers (Nova Scotia Department of Environment, 2010).
31
4.3 The Landscape and Environment of Nova Scotia
The province of Nova Scotia is a peninsula situated in the North Temperate Zone, with 43 - 47o N
Latitude and 59 - 66.5o W Longitude. It includes a total length of approximately 13.300 km of
coastline including coastal islands, coastal rivers, coastal river islands, and the mainland’s coast.
Nova Scotia, also, includes a large number of small islands (5.490), mostly, located near the shore.
Moreover, a significant number of wetlands and lakes can be found in multiple sites and sizes,
creating the distinctive landscape characteristic of the province. It is very important to mention
that classifications of natural landscapes in Nova Scotia are eighty (80), consisting of various
ecosystems and natural communities (Nova Scotia Department of Environment, 2010; Nova Scotia
Department of Environment, 2002).
As far as the overall altitude of Nova Scotia’s landscape is concerned, it does not exceed 536 m
(Cape Breton Highlands), while lowest lands can be found under sea level (Bay of Fundy), due to
high tides (Nova Scotia Department of Environment, 2010).
According to Nova Scotia Department of Natural Resources (2016), the majority of the province
is covered by forests (75.8%), while the rest of it is classified as “Naturally non -forested”,
“agriculture intended”, “urban areas” etc. The graph (Figure. A3), placed in the Appendix A,
illustrates the land use percentages of Nova Scotia.
The pluralism of the geographical formation and natural environment of the province constitutes,
can be highlighted through different protection schemes that have been applied on a federal level,
as well as, on a provincial level. Numerous protection areas can be identified within the province
borders such as National Parks, Provincial Parks, Nature Reserves, Protected Forests, Wilderness
Areas, Protected Rivers institutionalized as Heritage Rives, RAMSAR wetlands, Important Bird
Areas (IBAs) etc. (Nova Scotia Department of Environment, 2017a; Government of Canada,
2018b; IBA Canada, 2015; Nova Scotia Department of Environment, 2017b; Nova Scotia
Department of Natural Resources, 2012).
4.4 Nova Scotia’s Energy Overview
In order to assess the necessity for wind energy development in Nova Scotia, it is of high
importance to look at the current energy consumption and demands, as well as, possible sources,
conventional and renewable.
32
To begin with, the energy demand of Nova Scotia (Figure. A4, Appendix A.) was 170 PJ for 2015,
according to National Energy Board of Canada (2015a), ranked as the 8th largest in the country.
Great energy consumers like transportation, residential, and industrial sector must be considered,
while the last proportion of energy consumption is that of the commercial sector. Refined
Petroleum Products (gasoline, diesel, and heating oil) are mostly consumed in the province,
followed by electricity, natural gas, and biofuels.
The demand for electricity is covered, on a local level, by four (4) power plants that use coal and
coke, as well as, oil and natural gas. Electricity production is also based on various renewable
sources such as tidal energy, wind power, and biomass. The Figure. A4, in the Appendix A,
justifies this comment. Furthermore, the electricity demand is facilitated through imports from
New Brunswick, using a transmission line, that enables Power Utility of Nova Scotia (Nova Scotia
Power) to cover the electricity deficit (National Energy Board of Canada, 2015a; Nova Scotia
Power, 2017). Another fact we should highlight, is that the residential sector was a major consumer
of electricity for 2015 (4 TWh), followed by the industrial and commercial sector (3.3 and 2.4
TWh respectively). In general, electricity consumption of Nova Scotia shows a significant decline
of 10% comparatively to 2005 (National Energy Board of Canada, 2015a).
The above trend could be imprinted in the Green House Emissions graph (Figure. A5, Appendix
A) for 2015, which indicates the ‘’green’’ path that Nova Scotia is following since 2005. The graph
clearly shows that the province is moving towards the national commitment of achieving a 30%
reduction in Green House Emissions by 2030, comparing to 2005 levels, as Paris Agreement
determines (National Energy Board of Canada, 2015b).
4.5 RES and Wind Energy in Nova Scotia
The province of Nova Scotia promotes the installation and incorporation of RES in the energy mix
through major Renewable Acts, that set specific targets for energy production and consumption in
the future. A major contribution to that direction, was given by the Renewable Electricity Plan,
introduced in 2010, which set the Renewable goals for the province to reach by 2020. Those goals
were the increase of RES’s contribution on electricity production of 25% by 2015 and 40% by
2020. Importantly enough, wind energy assigned a significant role contributing to the energy
transformation of Nova Scotia. The document states that the majority of electricity produced by
RES in 2020 should be derived by wind resources (Nova Scotia Department of Energy, 2010).
33
Nevertheless, the most important contribution of the Renewable Electricity Plan of 2010, was the
introduction of the Community Based Feed in Tariff Program, targeting to an increase of electricity
capacity from RES by 100 MW. Through this program, communities and municipalities were able
to implement small RES projects, such as wind farms, usually up to 6 MW. The program, except
from helping the province achieve its Renewable targets, indented to increase the profit for
developers, as well as, raising social acceptance. The program got terminated by the Government
of Nova Scotia on August 6th of 2015, as it had fulfilled its purpose. Under the program scheme,
numerous RES projects, usually small-scale wind farms, got accepted and developed, reaching a
total capacity of 204.65 MW (Nova Scotia Department of Energy, 2017).
According to a report prepared by the National Energy Board of Canada (2016b), Nova Scotia was
recorded as the second highest electricity producer of wind power of the country for the year of
2015, preceding Prince Edward Island. Furthermore, Nova Scotia operates the only tidal power
station of North America and is planning to develop more tidal stations in the future, as the Marine
Renewable Energy Strategy (2012) and Marine Renewable Energy Act (2015) state.
In 2015, a new Renewable Electricity Plan was introduced, setting goals for the period of 2015-
2040, including a significant reduction on Green House Emissions by 2050 of 80%, in comparison
to 2009 levels. In the period of 2020-2040, Nova Scotia plans to cover its energy demands, mostly,
by Renewable energy facilities such as tidal stations, wind farms, solar stations, natural gas
facilities, and hydro plants. In addition, tidal energy will play a crucial role to this direction, as the
province intends to export excess electricity (Nova Scotia Department of Energy, 2015).
The construction and completion of the maritime link, which will connect the province of
NewFoundland and Lambrador to Nova Scotia, will further facilitate the development of RES
projects, especially wind farms. The connection to the hydro plant in Muskrat Falls,
NewFoundland and Lambrador, through a 200 kV High Voltage Direct Current subsea cable, will
stabilize energy production deficits from wind farms caused by the intermittent nature of the wind,
while it will increase the capacity of the electrical grid by 500 MW (Emera, 2016).
From 2005 to 2016, the wind capacity installed in the province of Nova Scotia increased from
1.4% to 17.2% respectively. Overall, the total wind capacity installed in the province, by 2017,
will be 610 MW (National Energy Board of Canada, 2016b; CanWEA, 2017). The map
(Figure.A6) found in the Appendix A, highlights the position of already installed wind farms in
Nova Scotia. However, this map depicts utility scale wind farms only and not smaller ones.
34
The largest wind farms of Nova Scotia, with a rated power capacity over 50 MW, are located
throughout the province. Firstly, the Nuttby Mountain Wind Farm, placed on the Central-Northern
part of the province, lunched on 2010 that is operated by Nova Scotia Power with a capacity of
50,6 MW. Next, will be the Dalhousie Mountain Project, situated in the municipality of Pictou, in
a close distance from the Nutbby project, lunched on 2009 and operated by an Independent Power
Producer with a capacity of 51 MW. Finally, the South Canoe Wind Farm that is located in the
county of Lunenburg, lunched on 2015 and operated by an Independent Power Producer with a
capacity of 102 MW (CanWEA, 2018; Nova Scotia Department of Environment, 2017c).
The majority of wind farms developed, are classified as small-scale projects consisting of two (2)
or four (4) wind turbine generators (Nova Scotia Department of Environment, 2017c). Their power
capacity normally ranges from 66 kW to 10 MW. Nevertheless, there are projects consisting of a
single wind turbine that could be found in various sites throughout Nova Scotia and are dated back
in the early 2000s, when wind power development first started in the province. Last but not least,
medium scale wind projects can, also, be found with a power capacity that varies from 13 to 40
MW (CanWEA, 2018).
4.6 Conclusions
Nova Scotia is an area that imposes significant challenges for wind power developers. This is due
to the sensitive natural environment and landscape, high diffusion of wetlands, protection areas,
and, certainly, high dependence on fossil fuels.
As Canada moves toward a sustainable energy production pattern, Nova Scotia’s energy model is
adapting respectively. This movement is expressed through the formed Renewable Legislation that
recognizes and supports the need for alteration and the ways of achieving it.
The application of Community Based Feed in Tariff Program was a very important step, not only
in the direction of accomplishing the province’s energy goals, but, because it raised people’s
environmental consciousness through their participation in RES projects. As public acceptance is
a huge contributor for wind developers, Nova Scotians are now more aware and informed about
wind energy’s special issues, meaning that future projects may face less resistance.
The completion of the maritime link will further boost the development of RES projects, in the
years to come, leading Nova Scotia to a brighter future and broadening opportunities for wind
power developers.

35
As a result, it is of high significance, that Nova Scotia is prepared for the incorporation of more
wind power on its energy mix by identifying suitable locations for wind power development. That
is the contribution of this study; to prepare a strategic plan for wind power and brace future
decisions of decision makers. As Alexander Graham Bell once said: ‘’Before anything else,
preparation is the key to success’’.
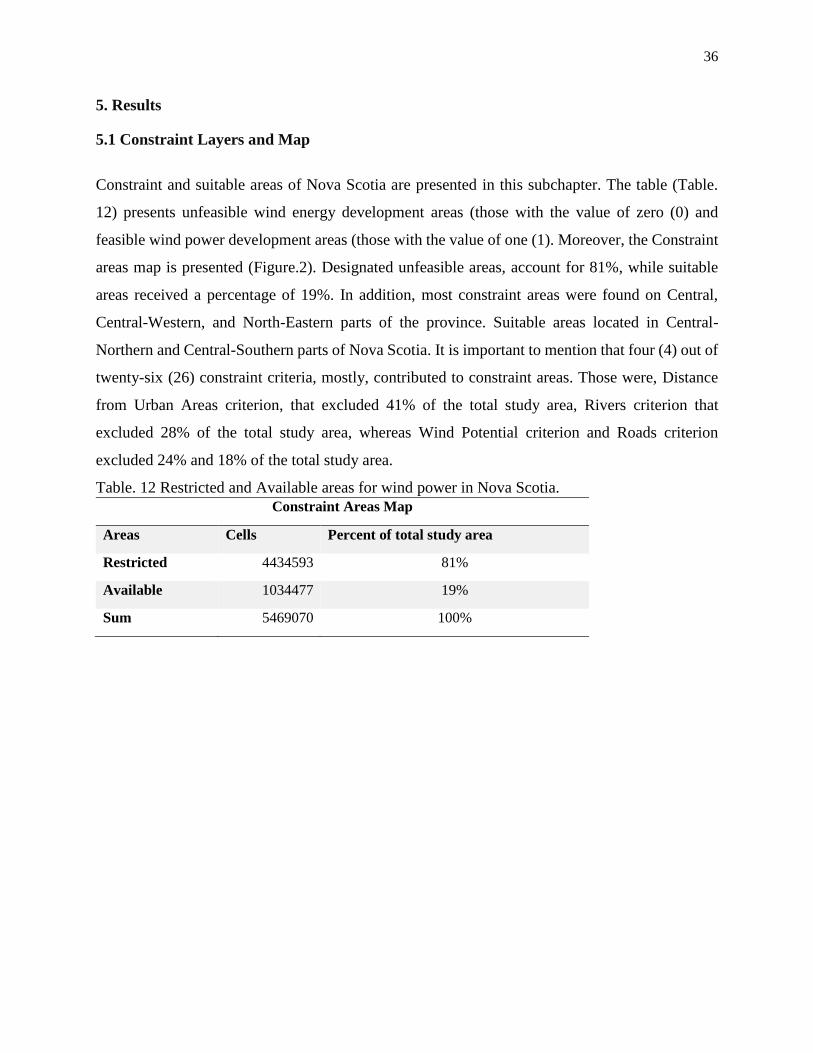
36
5. Results
5.1 Constraint Layers and Map
Constraint and suitable areas of Nova Scotia are presented in this subchapter. The table (Table.
12) presents unfeasible wind energy development areas (those with the value of zero (0) and
feasible wind power development areas (those with the value of one (1). Moreover, the Constraint
areas map is presented (Figure.2). Designated unfeasible areas, account for 81%, while suitable
areas received a percentage of 19%. In addition, most constraint areas were found on Central,
Central-Western, and North-Eastern parts of the province. Suitable areas located in Central-
Northern and Central-Southern parts of Nova Scotia. It is important to mention that four (4) out of
twenty-six (26) constraint criteria, mostly, contributed to constraint areas. Those were, Distance
from Urban Areas criterion, that excluded 41% of the total study area, Rivers criterion that
excluded 28% of the total study area, whereas Wind Potential criterion and Roads criterion
excluded 24% and 18% of the total study area.
Table. 12 Restricted and Available areas for wind power in Nova Scotia.
Constraint Areas Map
Areas Cells Percent of total study area
Restricted 4434593 81%
Available 1034477 19%
Sum 5469070 100%
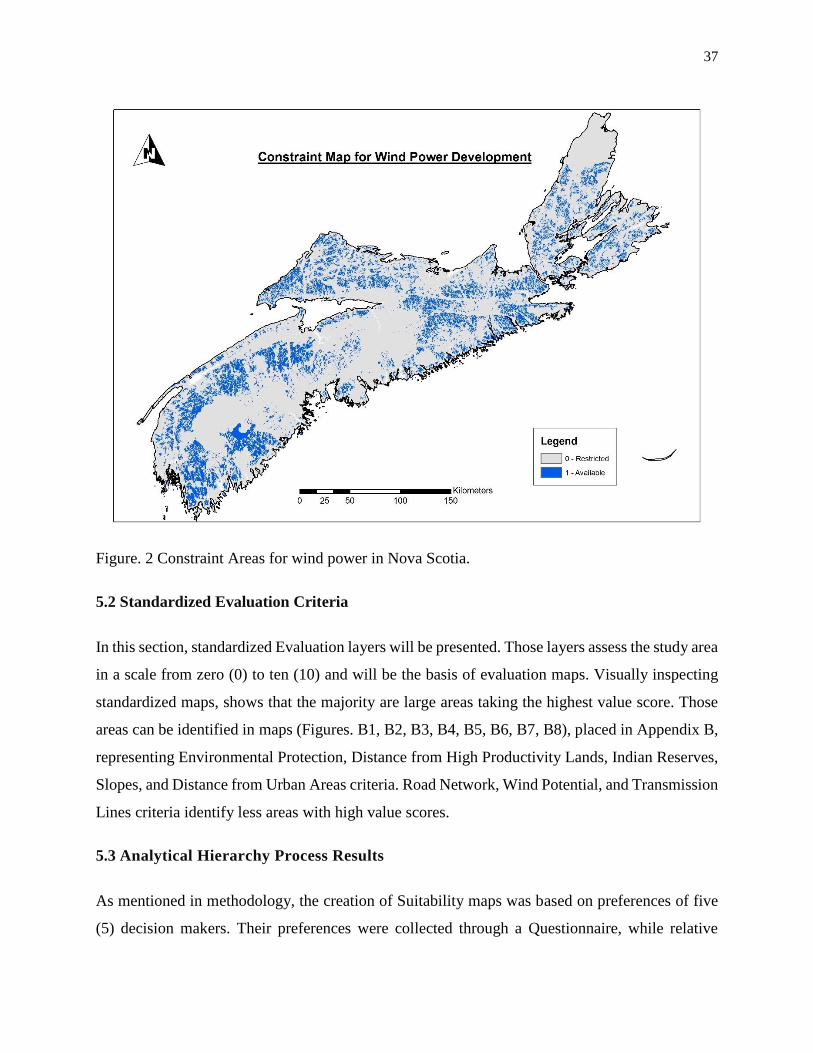
37
Figure. 2 Constraint Areas for wind power in Nova Scotia.
5.2 Standardized Evaluation Criteria
In this section, standardized Evaluation layers will be presented. Those layers assess the study area
in a scale from zero (0) to ten (10) and will be the basis of evaluation maps. Visually inspecting
standardized maps, shows that the majority are large areas taking the highest value score. Those
areas can be identified in maps (Figures. B1, B2, B3, B4, B5, B6, B7, B8), placed in Appendix B,
representing Environmental Protection, Distance from High Productivity Lands, Indian Reserves,
Slopes, and Distance from Urban Areas criteria. Road Network, Wind Potential, and Transmission
Lines criteria identify less areas with high value scores.
5.3 Analytical Hierarchy Process Results
As mentioned in methodology, the creation of Suitability maps was based on preferences of five
(5) decision makers. Their preferences were collected through a Questionnaire, while relative
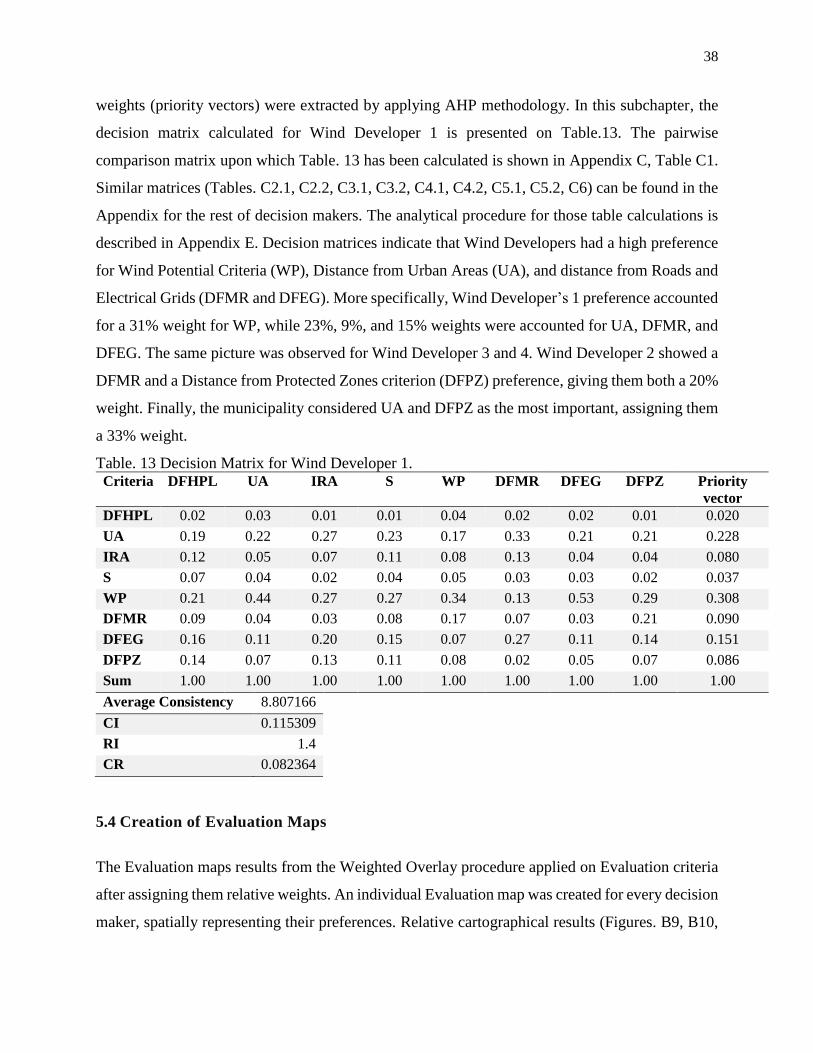
38
weights (priority vectors) were extracted by applying AHP methodology. In this subchapter, the
decision matrix calculated for Wind Developer 1 is presented on Table.13. The pairwise
comparison matrix upon which Table. 13 has been calculated is shown in Appendix C, Table C1.
Similar matrices (Tables. C2.1, C2.2, C3.1, C3.2, C4.1, C4.2, C5.1, C5.2, C6) can be found in the
Appendix for the rest of decision makers. The analytical procedure for those table calculations is
described in Appendix E. Decision matrices indicate that Wind Developers had a high preference
for Wind Potential Criteria (WP), Distance from Urban Areas (UA), and distance from Roads and
Electrical Grids (DFMR and DFEG). More specifically, Wind Developer’s 1 preference accounted
for a 31% weight for WP, while 23%, 9%, and 15% weights were accounted for UA, DFMR, and
DFEG. The same picture was observed for Wind Developer 3 and 4. Wind Developer 2 showed a
DFMR and a Distance from Protected Zones criterion (DFPZ) preference, giving them both a 20%
weight. Finally, the municipality considered UA and DFPZ as the most important, assigning them
a 33% weight.
Table. 13 Decision Matrix for Wind Developer 1. Criteria DFHPL UA IRA S WP DFMR DFEG DFPZ Priority
vector
DFHPL 0.02 0.03 0.01 0.01 0.04 0.02 0.02 0.01 0.020
UA 0.19 0.22 0.27 0.23 0.17 0.33 0.21 0.21 0.228
IRA 0.12 0.05 0.07 0.11 0.08 0.13 0.04 0.04 0.080
S 0.07 0.04 0.02 0.04 0.05 0.03 0.03 0.02 0.037
WP 0.21 0.44 0.27 0.27 0.34 0.13 0.53 0.29 0.308
DFMR 0.09 0.04 0.03 0.08 0.17 0.07 0.03 0.21 0.090
DFEG 0.16 0.11 0.20 0.15 0.07 0.27 0.11 0.14 0.151
DFPZ 0.14 0.07 0.13 0.11 0.08 0.02 0.05 0.07 0.086
Sum 1.00 1.00 1.00 1.00 1.00 1.00 1.00 1.00 1.00
Average Consistency 8.807166
CI 0.115309
RI 1.4
CR 0.082364
5.4 Creation of Evaluation Maps
The Evaluation maps results from the Weighted Overlay procedure applied on Evaluation criteria
after assigning them relative weights. An individual Evaluation map was created for every decision
maker, spatially representing their preferences. Relative cartographical results (Figures. B9, B10,
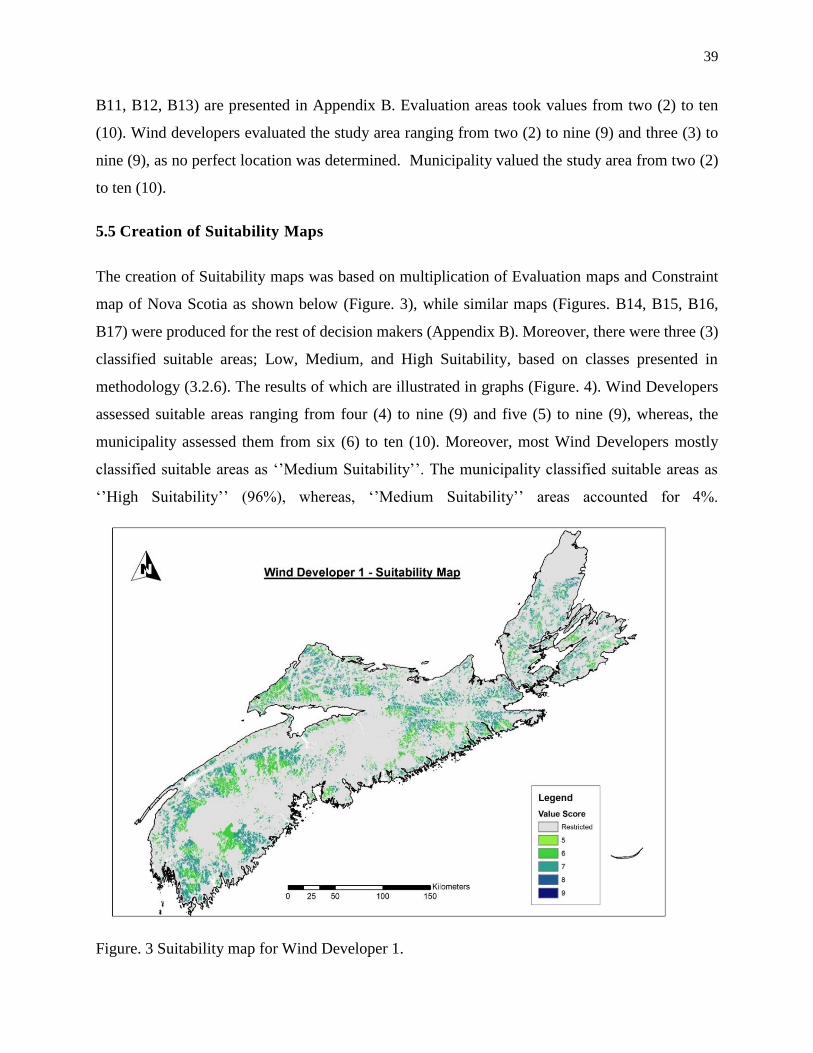
39
B11, B12, B13) are presented in Appendix B. Evaluation areas took values from two (2) to ten
(10). Wind developers evaluated the study area ranging from two (2) to nine (9) and three (3) to
nine (9), as no perfect location was determined. Municipality valued the study area from two (2)
to ten (10).
5.5 Creation of Suitability Maps
The creation of Suitability maps was based on multiplication of Evaluation maps and Constraint
map of Nova Scotia as shown below (Figure. 3), while similar maps (Figures. B14, B15, B16,
B17) were produced for the rest of decision makers (Appendix B). Moreover, there were three (3)
classified suitable areas; Low, Medium, and High Suitability, based on classes presented in
methodology (3.2.6). The results of which are illustrated in graphs (Figure. 4). Wind Developers
assessed suitable areas ranging from four (4) to nine (9) and five (5) to nine (9), whereas, the
municipality assessed them from six (6) to ten (10). Moreover, most Wind Developers mostly
classified suitable areas as ‘’Medium Suitability’’. The municipality classified suitable areas as
‘’High Suitability’’ (96%), whereas, ‘’Medium Suitability’’ areas accounted for 4%.
Figure. 3 Suitability map for Wind Developer 1.
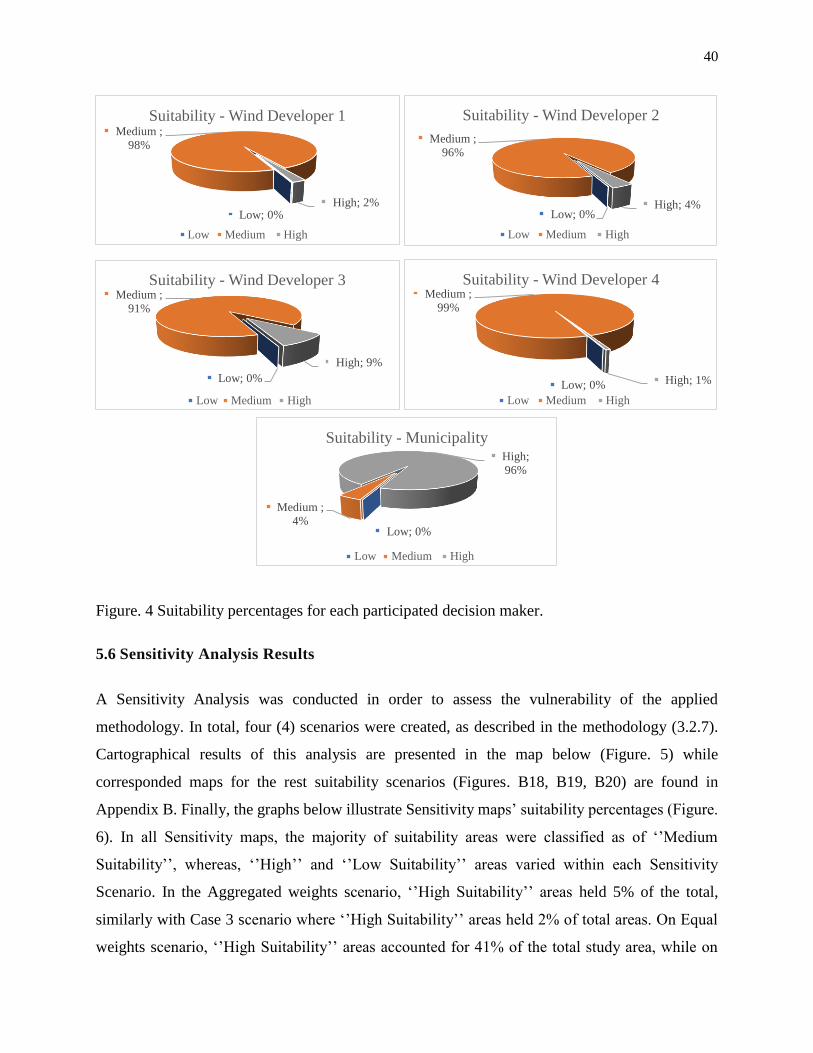
40
Figure. 4 Suitability percentages for each participated decision maker.
5.6 Sensitivity Analysis Results
A Sensitivity Analysis was conducted in order to assess the vulnerability of the applied
methodology. In total, four (4) scenarios were created, as described in the methodology (3.2.7).
Cartographical results of this analysis are presented in the map below (Figure. 5) while
corresponded maps for the rest suitability scenarios (Figures. B18, B19, B20) are found in
Appendix B. Finally, the graphs below illustrate Sensitivity maps’ suitability percentages (Figure.
6). In all Sensitivity maps, the majority of suitability areas were classified as of ‘’Medium
Suitability’’, whereas, ‘’High’’ and ‘’Low Suitability’’ areas varied within each Sensitivity
Scenario. In the Aggregated weights scenario, ‘’High Suitability’’ areas held 5% of the total,
similarly with Case 3 scenario where ‘’High Suitability’’ areas held 2% of total areas. On Equal
weights scenario, ‘’High Suitability’’ areas accounted for 41% of the total study area, while on
Low; 0%
Medium ;
98%
High; 2%
Suitability - Wind Developer 1
Low Medium High
Low; 0%
Medium ;
96%
High; 4%
Suitability - Wind Developer 2
Low Medium High
Low; 0%
Medium ;
91%
High; 9%
Suitability - Wind Developer 3
Low Medium High
Low; 0%
Medium ;
99%
High; 1%
Suitability - Wind Developer 4
Low Medium High
Low; 0%
Medium ;
4%
High;
96%
Suitability - Municipality
Low Medium High
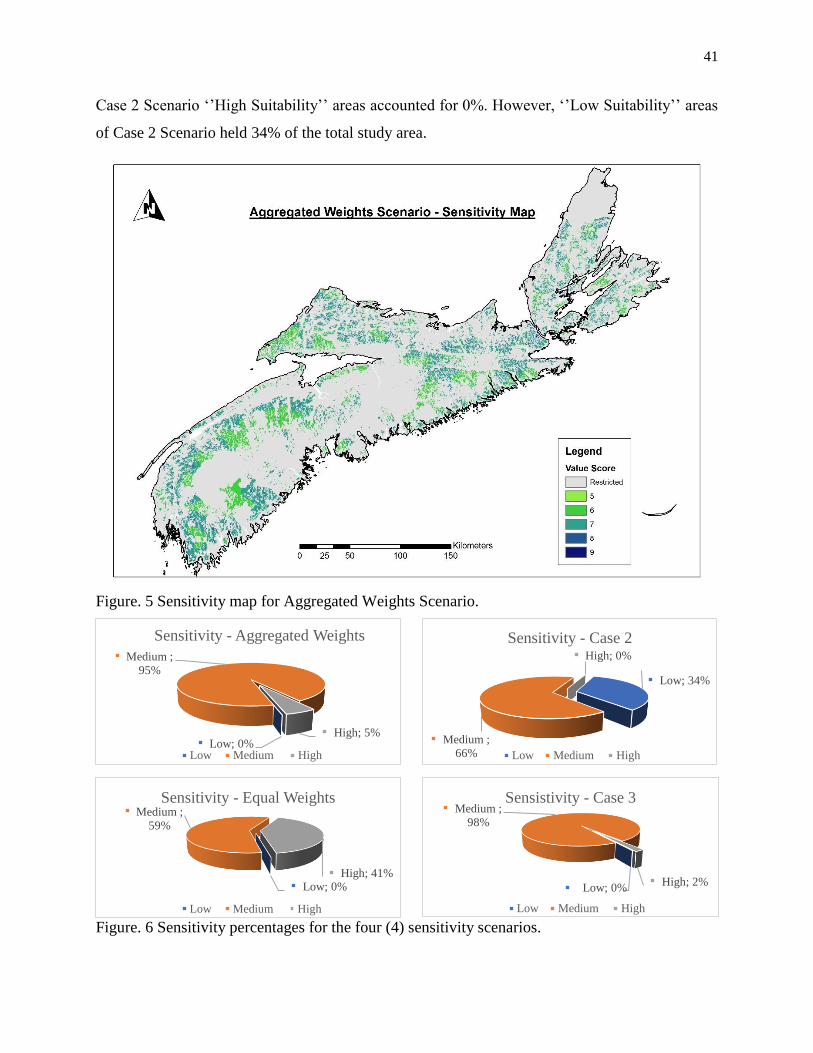
41
Case 2 Scenario ‘’High Suitability’’ areas accounted for 0%. However, ‘’Low Suitability’’ areas
of Case 2 Scenario held 34% of the total study area.
Figure. 5 Sensitivity map for Aggregated Weights Scenario.
Figure. 6 Sensitivity percentages for the four (4) sensitivity scenarios.
Low; 0%
Medium ;
95%
High; 5%
Sensitivity - Aggregated Weights
Low Medium High
Low; 34%
Medium ;
66%
High; 0%
Sensitivity - Case 2
Low Medium High
Low; 0%
Medium ;
59%
High; 41%
Sensitivity - Equal Weights
Low Medium High
Low; 0%
Medium ;
98%
High; 2%
Sensistivity - Case 3
Low Medium High
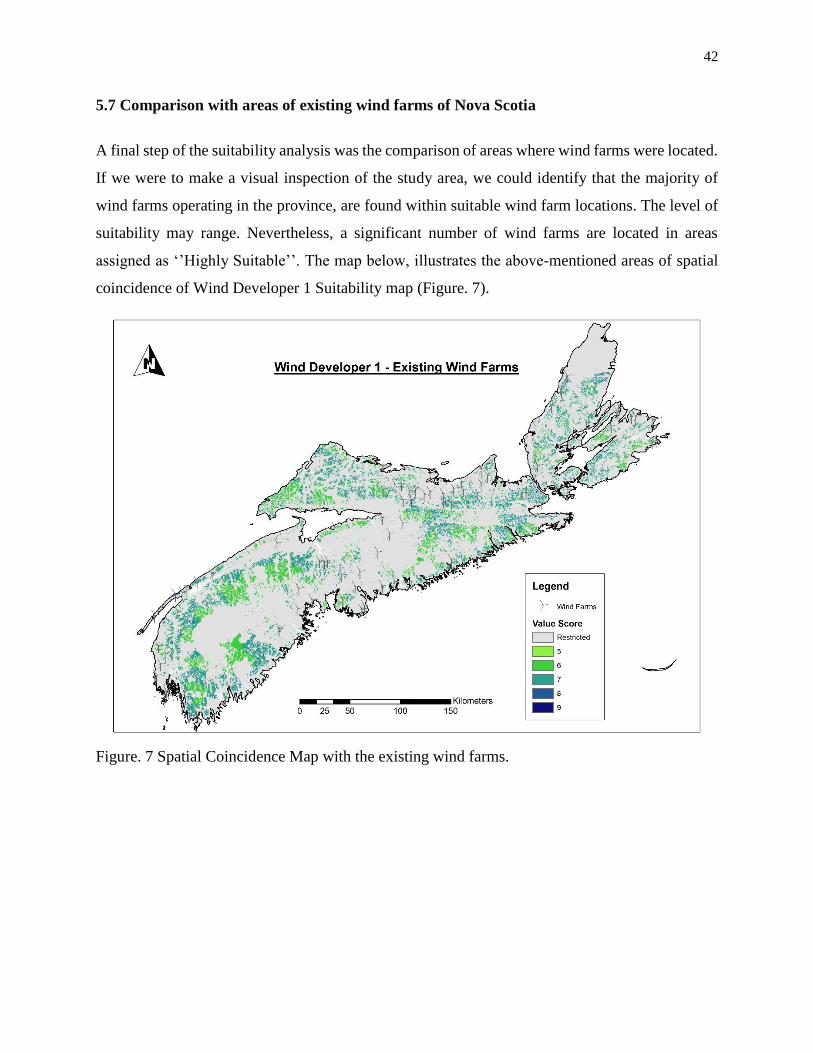
42
5.7 Comparison with areas of existing wind farms of Nova Scotia
A final step of the suitability analysis was the comparison of areas where wind farms were located.
If we were to make a visual inspection of the study area, we could identify that the majority of
wind farms operating in the province, are found within suitable wind farm locations. The level of
suitability may range. Nevertheless, a significant number of wind farms are located in areas
assigned as ‘’Highly Suitable’’. The map below, illustrates the above-mentioned areas of spatial
coincidence of Wind Developer 1 Suitability map (Figure. 7).
Figure. 7 Spatial Coincidence Map with the existing wind farms.
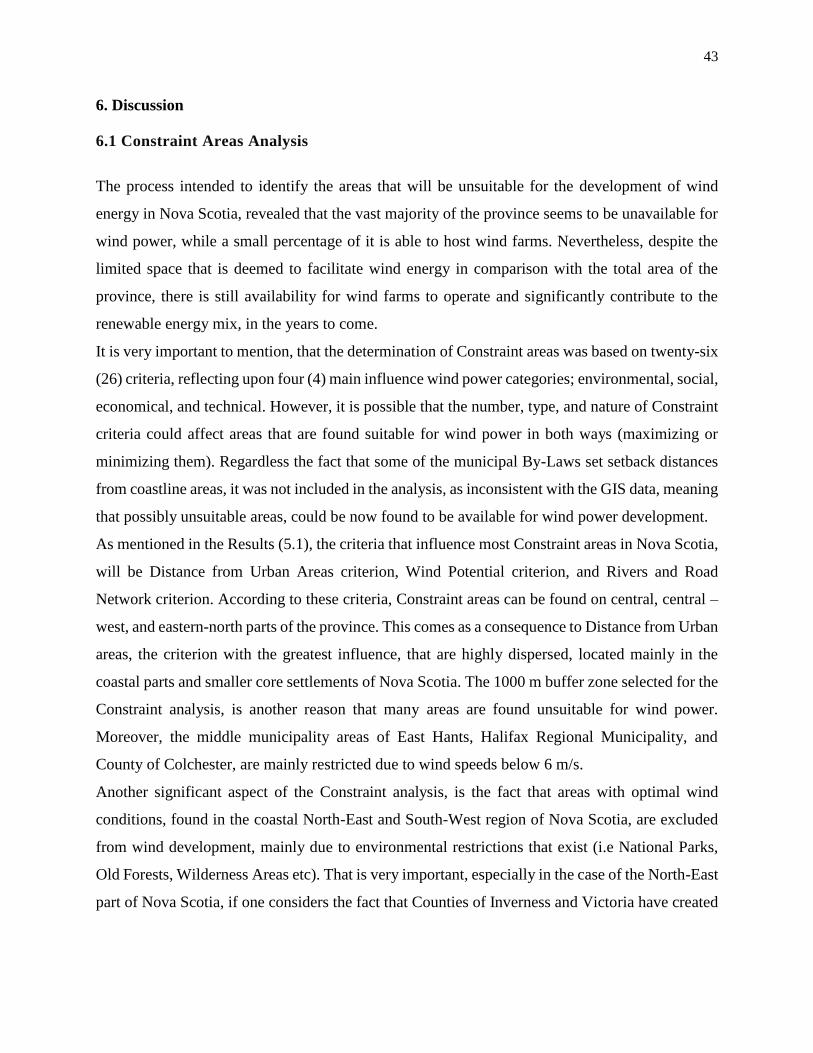
43
6. Discussion
6.1 Constraint Areas Analysis
The process intended to identify the areas that will be unsuitable for the development of wind
energy in Nova Scotia, revealed that the vast majority of the province seems to be unavailable for
wind power, while a small percentage of it is able to host wind farms. Nevertheless, despite the
limited space that is deemed to facilitate wind energy in comparison with the total area of the
province, there is still availability for wind farms to operate and significantly contribute to the
renewable energy mix, in the years to come.
It is very important to mention, that the determination of Constraint areas was based on twenty-six
(26) criteria, reflecting upon four (4) main influence wind power categories; environmental, social,
economical, and technical. However, it is possible that the number, type, and nature of Constraint
criteria could affect areas that are found suitable for wind power in both ways (maximizing or
minimizing them). Regardless the fact that some of the municipal By-Laws set setback distances
from coastline areas, it was not included in the analysis, as inconsistent with the GIS data, meaning
that possibly unsuitable areas, could be now found to be available for wind power development.
As mentioned in the Results (5.1), the criteria that influence most Constraint areas in Nova Scotia,
will be Distance from Urban Areas criterion, Wind Potential criterion, and Rivers and Road
Network criterion. According to these criteria, Constraint areas can be found on central, central –
west, and eastern-north parts of the province. This comes as a consequence to Distance from Urban
areas, the criterion with the greatest influence, that are highly dispersed, located mainly in the
coastal parts and smaller core settlements of Nova Scotia. The 1000 m buffer zone selected for the
Constraint analysis, is another reason that many areas are found unsuitable for wind power.
Moreover, the middle municipality areas of East Hants, Halifax Regional Municipality, and
County of Colchester, are mainly restricted due to wind speeds below 6 m/s.
Another significant aspect of the Constraint analysis, is the fact that areas with optimal wind
conditions, found in the coastal North-East and South-West region of Nova Scotia, are excluded
from wind development, mainly due to environmental restrictions that exist (i.e National Parks,
Old Forests, Wilderness Areas etc). That is very important, especially in the case of the North-East
part of Nova Scotia, if one considers the fact that Counties of Inverness and Victoria have created
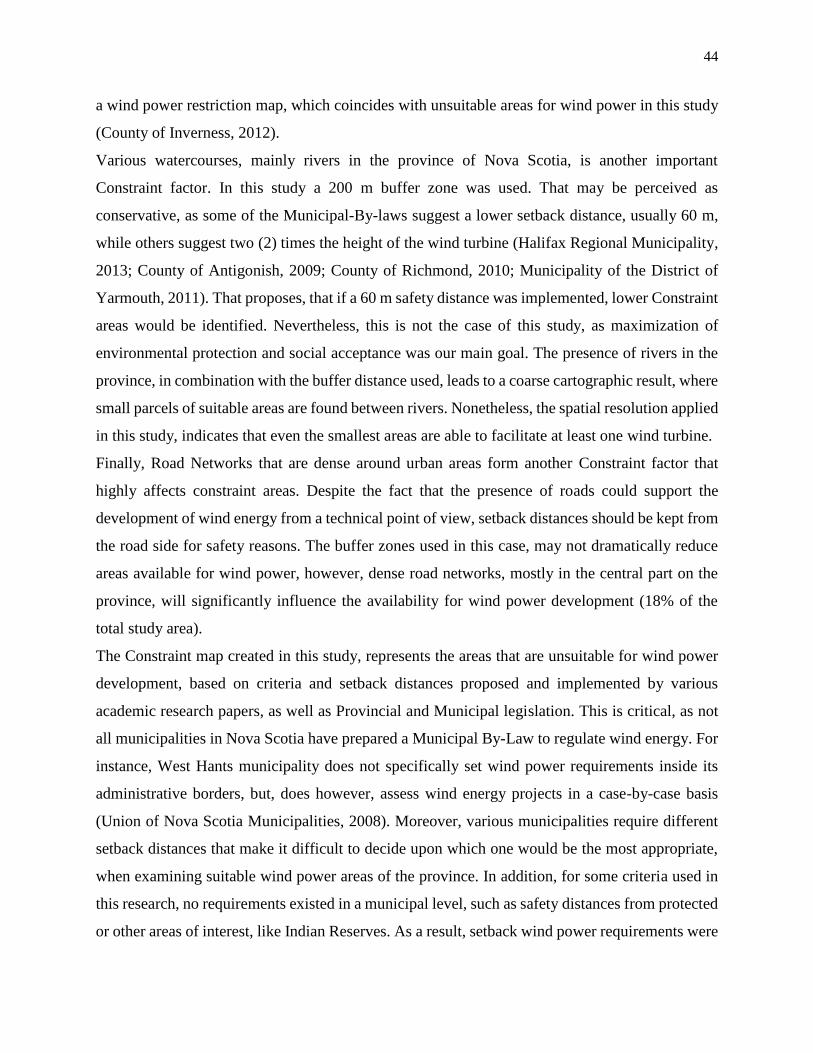
44
a wind power restriction map, which coincides with unsuitable areas for wind power in this study
(County of Inverness, 2012).
Various watercourses, mainly rivers in the province of Nova Scotia, is another important
Constraint factor. In this study a 200 m buffer zone was used. That may be perceived as
conservative, as some of the Municipal-By-laws suggest a lower setback distance, usually 60 m,
while others suggest two (2) times the height of the wind turbine (Halifax Regional Municipality,
2013; County of Antigonish, 2009; County of Richmond, 2010; Municipality of the District of
Yarmouth, 2011). That proposes, that if a 60 m safety distance was implemented, lower Constraint
areas would be identified. Nevertheless, this is not the case of this study, as maximization of
environmental protection and social acceptance was our main goal. The presence of rivers in the
province, in combination with the buffer distance used, leads to a coarse cartographic result, where
small parcels of suitable areas are found between rivers. Nonetheless, the spatial resolution applied
in this study, indicates that even the smallest areas are able to facilitate at least one wind turbine.
Finally, Road Networks that are dense around urban areas form another Constraint factor that
highly affects constraint areas. Despite the fact that the presence of roads could support the
development of wind energy from a technical point of view, setback distances should be kept from
the road side for safety reasons. The buffer zones used in this case, may not dramatically reduce
areas available for wind power, however, dense road networks, mostly in the central part on the
province, will significantly influence the availability for wind power development (18% of the
total study area).
The Constraint map created in this study, represents the areas that are unsuitable for wind power
development, based on criteria and setback distances proposed and implemented by various
academic research papers, as well as Provincial and Municipal legislation. This is critical, as not
all municipalities in Nova Scotia have prepared a Municipal By-Law to regulate wind energy. For
instance, West Hants municipality does not specifically set wind power requirements inside its
administrative borders, but, does however, assess wind energy projects in a case-by-case basis
(Union of Nova Scotia Municipalities, 2008). Moreover, various municipalities require different
setback distances that make it difficult to decide upon which one would be the most appropriate,
when examining suitable wind power areas of the province. In addition, for some criteria used in
this research, no requirements existed in a municipal level, such as safety distances from protected
or other areas of interest, like Indian Reserves. As a result, setback wind power requirements were
45
borrowed from other provinces’, to fill the gap which and, thus, may be unrepresentative of Nova
Scotia.
6.2 Standardized and Evaluation Areas Analysis
The standardization of Evaluation criteria was based on a simple method of assigning grading
values followed by that of relative value scores, which in turn provided an initial assessment of
the study area. The maps that were produced for the eight (8) standardized criteria, present, in their
vast majority, large areas assigned with the maximum value score of ten (10). Nevertheless, this
was not the case for three (3) distinctive criteria; Road Network, Transmission Lines, and Wind
Potential. Due to the nature of the distance dependent criterion, the area sites closer to it, were
more beneficial comparing to the sites further away. As for the Road Network and Transmission
Line criterion, areas that were closer to these, were assigned the highest value score, whereas, the
rest of the study area was classified with lower values, as the Euclidean distance was increasing.
As a result, the majority of the province is classified with values ranging from five (5) to one (1).
When the Wind Potential was considered, most areas in Nova Scotia were taking values that were
ranging between six (6) and four (4). Only a small area, located in the North-eastern part of the
province, was assigned higher values. It is important to mention, that only a few sites of that part,
were found to have the highest value score with average wind speeds higher than 15m/s.
Standardized criteria were used as an input for the creation of the Evaluation maps. That became
possible by assigning weights on each criterion by using the WLC approach. Weights derived from
the preferences expressed by five (5) decision makers through the application of the AHP MCDA
procedure. For each decision maker, an Evaluation map was formed that spatially represented their
preferences for the eight (8) standardized criteria.
In the case of wind power developers, the relative cartographical results revealed that, despite the
differences shown on their preferences, they evaluated the study area with value scores that ranged
between two (2) and nine (9) and three (3) and nine (9). Their main differences were found on the
way they evaluated Distance from Urban Areas criterion, Road Network criterion, and Distance
from Protected Zones criterion. Generally, Wind Developers 1, 3, and 4 assigned a similar weight
for all eight (8) criteria, expressing their interest mostly on Wind Potential criterion and Distance
from Urban Areas. That is the reason that developers evaluated sites where urban areas and high
average wind speeds had almost the same value scores. As for urban areas, value scores ranged
46
from four (4) to six (6), whereas high wind speed areas, located in the North-Eastern part of Nova
Scotia, were assigned value scores ranging from seven (7) to nine (9). This observation can be
generalized in Road Network and Distance from Protected Zones. For these criteria value scores
ranged from five (5) to six (6).
Wind Developer 2 moderately varied his/her preferences for these criteria. Distance from Urban
Areas got a value score equal to eight (8) and nine (9), as he/she believed it was not of high
importance, comparing to other developers. The same applies to Road Network and Distance from
Protected Zone criteria. The main reason behind those preferences would be the fact that Wind
Developer 2 participated on community-based programs, including First Nations and
municipalities that were developing small scale wind power projects. As a consequence, elements
like environmental protection, gain a significant value by increasing social acceptance. Moreover,
as the project scale was limited to a single or a few wind turbines, criteria gained more weight in
the case of a large-scale project, such as the visual impact on dwellings that now are of less
importance. This could, also, be highlighted by the fact that people who live in those areas are
involved in the project, meaning that potential visual impacts would be perceived as of low
significance.
As far as the Wind Potential Criterion is concerned, the difference that Wind Developer 3
expressed can be observed on the relative Evaluation map, as he/she assigned lower value scores
in high wind speed areas. In that case, these areas took a value score ranging between six (6) and
seven (7). Wind speed, for him/her, is still of high importance comparing to other criteria.
Finally, for the rest of criteria, including Distance from High Productivity Lands, Indian Reserve,
Slopes, and Distance from Electrical Grids, all Wind Developers expressed, more or less, similar
preferences. That trend is illustrated on each Evaluation map by assigning the same areas described
by these criteria, with a value score that ranges from four (4) to nine (9).
On the other hand, the Evaluation map prepared for the municipality revealed a different trend.
Important criteria were Distance from Urban Areas and Distance from Protected Zones. These
areas assigned low value scores ranging from two (2) to seven (7). That leaves the rest of the study
area to be assessed in the light of remaining criteria which were assigned high value scores that
ranged from eight (8) to ten (10). That was an expected result, when considering the fact that the
municipality was concerned about mainly protecting urban and environmentally sensitive areas
from the expansion of wind energy, disregarding all other important conditions. This means that
47
crucial criteria such as Road Networks and Distance from Electrical Grids get overlooked, by
evaluating areas with high value scores when they may not be good enough to facilitate wind
energy. This results to a contradiction with Wind Developers’ preferences that are oriented to wind
power development and may be modest on their estimates, based on their experience.
6.3 Suitability Areas Analysis
Suitability areas would be the cartographical result of Evaluation maps and the Constraint map.
As before, five (5) suitability maps were produced, one for each decision maker. Similarly to the
previous analysis and despite the differences found on the preferences expressed by the Wind
Developers, areas were identified as suitable for wind power development and were assigned the
same suitability index that ranged from five (5) to seven (7). That means, that the majority of the
study area can be described as of “Medium Suitability’’. That is consistent with the study of Höfer
et al. (2016), where the majority of areas recognized as of ‘’Medium Suitability’’, and with the
study of Tegou et al. (2010), where the majority of available areas in the island of Lesvos are
taking a ‘’Medium’’ suitability score ranging between six (6) to eight (8) representing almost 37%
of available areas.
Another important observation is the fact that, for all Wind Developers, there is no area in the
province that takes a value score of ten (10). Therefore, there are no sites that can be characterized
as ideal for wind power. That would be relevant to results like that of Höfer et al. (2016), who did
not identify areas that take a maximum value. However, there are many areas assigned a value
score between eight (8) and nine (9). These areas, according to the suitability classification used
in this study, are classified as of ‘’High Suitability’’. On the other hand, in the case of Municipality
Suitability map, there are areas taking a value score of ten (10). However, as mentioned in 6.2 of
this chapter, these areas may be deemed a lower suitability in reality.
Best sites for wind power development, meaning those classified as ‘’High Suitability’’, will count
only for a small part of the total study area for all Wind Developers. Those areas coincide with
sites where wind potential is significantly high, as this criterion receives a denoting weight.
Nevertheless, we should mention, that areas of high average wind speeds were excluded due to the
proximity or overlapping with urban and protected areas. That could, also, lead to the conclusion
that areas assigned the title of ‘’High’’, suitable for wind power, have been influenced from the
48
overlapping of other significant criteria and identifying sites where these criteria express the same
degree of high suitability.
Finally, no ‘’Low Suitability’’ areas were identified in Nova Scotia. The reason is relevant to the
fact that areas with significant impacts in social, environmental, technical, and economical level
had already been excluded as potential sites for wind development. For that reason, only areas of
realistic wind power development potential remained and were assessed. However, Evaluation
areas that were assessed but were excluded, due to the multiplication of Evaluation maps and the
Suitability map, could also be examined for wind power. Despite the fact that Deer and Moose
areas were deemed unsuitable for wind power in this study, and thus were excluded, in reality,
wind farms can be developed inside those areas, if all legislative, social, economic, environmental,
and technical requirements are fulfilled. It is on the intention of this research, to take the most
conservative stance against the development of wind power in order to maximize social and
environmental acceptance.
Overall, results depicted on suitability maps will be the outcome of the overlapping Evaluation
criteria using the WLC approach, relative weights, as well as, the cell size that was used to define
the spatial resolution of relevant results. Moreover, Evaluation criteria used may play a significant
role, meaning that a different number and type of criteria could probably lead to different results.
6.4 Sensitivity Analysis
In order to evaluate the sensitivity of the applied methodology to changes in weights of Evaluation
criteria that were chosen in this study, four (4) scenarios were created. That led to the production
of relevant cartographical results. These results were compared with Suitability maps to investigate
whether significant changes on suitability areas occurred.
In the first scenario, were decision makers’ weights were aggregated, results were similar to those
of Wind Developers. The purpose of this scenario was to ‘’merge’’ different opinions expressed
by decision makers in a single weight (i.e one (1) for each criterion). Suitable areas were similar
to those identified by Wind Developers and the main reason was that through aggregation, a
consensus among decision makers managed to be reached. As the majority of decision makers
expressed, more or less, the same preferences for Evaluation criteria, a consensus towards Wind
Developers’, but, not for the Municipality’s preferences was achieved. Therefore, we were glad to
notice that, since most of the decision makers’ preferences matched each other, most Aggregated
49
Sensitivity maps looked very similar to Wind Developers’ maps. Thus, we highlight the fact that
the differences in their preferences are barely noticeable from map to map, which proves our point.
In the Equal weight, second scenario, most areas took a value score from six (6) to eight (8),
indicating that, when equal weights were assigned, more areas close to ‘’High Suitability’’ were
determined. That is relevant to observations made from Höfer et al. (2016), where, in the Equal
weight, second scenario, they assessed the majority of suitable areas with value scores between six
(6) and eight (8).
In the Case 2 scenario, where environmental criteria were assigned a zero (0) weight, a significant
percentage of the study area was assessed as of ‘’Low Suitability’’. This was expected, as the
‘’absence’’ of environmental criteria would favor the assigning of lower value scores of areas that
coincide with other criteria, and, most importantly, Road Network criterion and Distance from
Electrical Grids. That would be due to the nature of these distance depended criteria, where areas
further away from them were assessed lower value scores.
Finally, in the Case 3 scenario, where evaluation criteria were assigned weights that were changing
within a defined interval, results were similar to those produced by Wind Developers. However,
despite the fact that the majority of suitability areas characterized as ‘’Medium Suitability’’, the
distribution of value scores would be different. This was expected, as Eevaluation criteria were
either maximized or minimized by 10% and influenced suitability results.
Overall, the sensitivity analysis performed in this study, indicates that the methodology used is
sensitive to changes and particularly Equal weights and the Case 2 scenario. That is consistent
with findings of Höfer et al. (2016) and Tegou et al., (2010), who both came to the same
conclusion.
A final step of this study was the comparison of Suitability areas and sites of existing wind farms.
Those results indicated that the majority of wind farm sites fell within areas determined as suitable
for wind power. Those areas were given a value score between six (6) and nine (9). Only a small
number of wind farms was placed on areas assigned the title of ‘’Excluded’’. Nevertheless, as the
most conservative approach was followed, those exclusion areas can be assessed as available areas
when a more pragmatic approach is implemented. Moreover, the online wind farm map of Nova
Scotia Power (2018) was used to position wind farms on the map that, however, lacks some spatial
accuracy. Accordingly, all of the above are in harmony with our hypothesis and, thus, fail to reject
it.
50
6.5 Limitations
The findings of this research were limited by a number of factors that may compromise the validity
of this study.
To begin with, an important issue that needs to be addressed is the availability of spatial data
needed for the analysis of the study area, as well as the spatial resolution. The number and type of
spatial data could possibly alter the study’s results, as areas evaluated as suitable could be excluded
in a real case scenario and vice versa.
While the majority of data was retrieved on vector format, slopes and wind potential were found
on raster format with a spatial resolution of 20 m and 200 m respectively. In this study, a spatial
resolution of 100 m was used, based on the provisions of Municipal By-Laws that suggest a
minimum separation distance between wind turbines equal to the height of the tallest wind turbine
which in this case was 100 m. That spatial resolution is higher than those used by Tegou et al.
(2010) who used a 156 m spatial resolution and Latinopoulos and Kechagia (2015) who used a
150 m resolution. However, an alteration of raster data spatial resolution could lead to different
results. In addition, it is a well-known fact that different MCDA techniques could, also, lead to
different results. The AHP technique used in this research, was the most common type of spatial
analysis.
The spatial accuracy of the data implemented could affect the results as well. For example, it was
impossible to use data that represented coastline regions of Nova Scotia, as there was a spatial
misalignment with boundary data that was used as a base map. Moreover, this study does not
exclude island areas found in a close distance from the shores of Nova Scotia. That may be
unsuitable for wind power due to technical reasons and particularly connection and transportation
costs.
Finally, time limitation was another factor that could possibly affect the outcome of this study.
This is relevant, mostly, to the number of questionnaires selected. If more time was provided, more
questionnaires would be collected, and a more representative depiction of the decision makers’
references would be possible to achieve.
51
7. Conclusions
The purpose of this study was to answer our research questions by identifying the most suitable
wind power areas of the Nova Scotia, Canada. That was possible through the implementation of a
GIS-based MCDA analysis, where various criteria were used. Those criteria, Constraint and
Evaluation criteria, can influence wind power on four (4) main domains/categories; social,
economical, environmental, and technical.
The spatial analysis conducted for the province, indicated that the majority of the study area was
unavailable for wind power development. The main reason for that, was the high dispersion of
urban areas as well as existed wind conditions, where high wind speeds were found. Furthermore,
eight (8) Evaluation criteria were used to assess the wind power suitability, based on preferences
of five (5) decision makers. Relative weights were assigned on criteria and were extracted using
the AHP MCDA technique. Final results were validated by performing a sensitivity analysis. That,
proved our methodological framework to be sensitive to changes that are consistent to findings of
two (2) fundamental research papers; Höfer et al., 2016 and Tegou et al., 2010, in which our
methodology based its structure.
In general, the sensitivity of the applied methodology was found mainly in two (2) areas.
Application of the GIS procedure, per se, and the selection of the MCDA technique. In this study,
changes within GIS were found in values assigned on each criterion, as well as, the number, type,
and spatial resolution of criteria. In the MCDA technique selection, changes were found in its
internal procedure. The fact that results of the current research are consistent with those found in
studies they were based upon, prove the general applicability of that methodology. Nevertheless,
there are many studies that have used different methodologies and implemented more than one (1)
MCDA techniques to test result validity (Sanchez-Lozano, 2016; Atici, 2015; Aydin et al., 2010).
An important remark of this research was the fact that areas found suitable for wind power coincide
with the already existing wind farms of Nova Scotia. That is of great importance for the final result
validity and methodology application. Thus, we were allowed to believe that our data were
adequate enough to support our hypothesis; that possible wind power development sites would
coincide with already existing wind farms in Nova Scotia.
In general, despite the low suitable area percentage (19% of the total study area), there is still
enough space for wind power to be developed while covering the province’s energy objectives and
produce more electricity through RES. Those areas have been defined by a spatial resolution of

52
100 m, meaning that more wind power areas could be potentially identified with a higher spatial
resolution. Moreover, as the scale of this project is the provincial one, a more detailed municipal
and local level analysis could reveal more development potential areas by implementing the
applied methodology.
Finally, our results should be considered as a strategic plan providing guidelines on where the
interested parties could look for suitable wind power sites. As a consequence, our results could be
used as a Decision-Aid tool from decision makers. By no means this study substitutes the need for
a more detailed evaluation of a specific location.
53
REFERENCES
Alberta Government. (2017). Wildlife Directive for Alberta Wind Energy Projects Report.
[Online] Available at: http://aep.alberta.ca/fish-wildlife/wildlife-land-use-
guidelines/documents/WildlifeWindEnergyDirective-Apr07-2017.pdf [Accessed at: 2 July 2018]
AMEC. (2006). Canso Wind Farm: Environmental Impact Statement Canso, Nova Scotia. [Online]
Available at: https://novascotia.ca/nse/ea/cansowind/CansoWF_Registration.pdf [Accessed at: 30
June 2018]
Annapolis County. (2011). Land Use By-Law. [Online] Available at:
https://annapoliscounty.ca/Documents/1EzFolderList/CommunityDev/MunicipalPlanningStrateg
yLandUseBy-
law/AnnapolisCounty/2%20Annapolis%20County%20Land%20Use%20Bylaw.pdf [Accessed
at: 30 June 2018]
Atici, K.B. & Ulucan, A. (2011). A Multiple Criteria Energy Decision Support
System\Energetikos daugiakriterine sprendimu paramos Sistema. Technological and Economic
Development of Economy 17 (2): 219. [Online] Available at: 10.3846/20294913.2011.580563
[Accessed at: 20 June 2018]
Atici, K.B., Simsek, A.B., Ulucan, A., Tosun, M.U. (2015). A GIS-based Multiple Criteria
Decision Analysis approach for wind power plant site selection. Utilities Policy 37: 86-96 [Online]
Available at: https://doi.org/10.1016/j.jup.2015.06.001 [Accessed at: 19 June 2018]
Atlantic Canada Opportunities Agency. (2017). Atlantic Canada. [Online] Available at:
http://www.acoa-apeca.gc.ca/eng/ImLookingFor/Pages/AboutAtlanticCanada.aspx [ Accessed at:
26 June 2018]
Aydin Y.N., Kentel E., Duzgun S. (2010). GIS-based environmental assessment of wind energy
systems for spatial planning: A case study from Western Turkey. Renewable and Sustainable
Energy Reviews 14 (1): 364-373 [Online] Available at: https://doi.org/10.1016/j.rser.2009.07.023
[Accessed at: 18 June 2018]
Azizi, A., Malekmohammadi, B., Jafari, H.R., Nasiri, H., Amini Parsa, V. (2014). Land suitability
assessment for wind power plant site selection using ANP-DEMATEL in a GIS environment: case
study of Ardabil province, Iran. Environmental Monitoring and Assessment 186 (10): 6695-6709.
[Online] Available at: https://doi-org.ezproxy.its.uu.se/10.1007/s10661-014-3883-6 [Accessed at:
19 June 2018]
Baban M.J.S., Parry T. (2001). Developing and applying a GIS-assisted approach to locating wind
farms in the UK. Renewable Energy 24 (1): 59-71 [Online] Available at:
https://doi.org/10.1016/S0960-1481(00)00169-5 [Accessed at: 18 June 2018]
54
Brans P.J., Vicke P.H., Mareschal B. (1986). How to select and how to rank projects: the
PROMETHEE method. European Journal Operation Research 24:228–238
Brans P.J. (2002). Ethics and Decisions. European Journal of Operational Research 136 (2): 340-
352 [Online] Available at: https://doi.org/10.1016/S0377-2217(01)00121-7 [Accessed at: 18 June
2018]
Brunelli M. (2015). Introduction to the Analytic Hierarchy Process. Cham: Springer International
Publishing. pp 18, 19, 25 [Online] Available at: https://doi-org.ezproxy.its.uu.se/10.1007/978-3-
319-12502-2 [Accessed at: 19 October 2018]
Cabala P. (2010). Using the Analytical Hierarchy Processing Evaluating Decision Alternatives.
Operations Research and Decisions 1:6–23. [Online] Available at:
orduser.pwr.wroc.pl/DownloadFile.aspx?aid=151 [Accessed at: 19 October 2018]
Canadian Wind Energy Association (CanWEA). (2007). Canadian Wind Energy Association
Position on Setbacks for Large-Scale Wind Turbines in Rural Areas (MOE Class 3) in Ontario.
[Online] Available at: https://www.gov.mb.ca/jec/energy/pubs/cwea_position.pdf [Accessed at:
30 June 2018]
Canadian Wind Energy Association (CanWEA). (2017). Atlantic Canada-Installed Capacity.
[Online] Available at: https://canwea.ca/wind-energy/atlantic-canada/ [Accessed at: 26 June 2018]
Canadian Wind Energy Association (CanWEA). (2018). Installed Capacity, Updated June 18,
2018. [Online] Available at: https://canwea.ca/wp-content/uploads/2018/06/canwea-
installedcapacity-June2018-web.pdf [Accessed at: 26 June 2018]
Chen, H., Wood, M. D., Linstead, C., Maltby, E. (2011). Uncertainty analysis in a GIS-based
multi-criteria analysis tool for river catchment management. Environmental Modelling and
Software 26 (4): 395–405. [Online] Available at: https://doi.org/10.1016/j.envsoft.2010.09.005
[Accessed at: 19 June 2018]
County of Antigonish. (2009). Land Use By-law for the COUNTY OF ANTIGONISH Concerning
the Regulation of Wind Turbine Development. [Online] Available at:
http://www.edpc.ca/plandocs/atwind/WTDP_LUB.pdf [Accessed at: 30 June 2018]
County of Inverness. (2012). Land Use By-law for the COUNTY OF INVERNESS Concerning
the Regulation of Wind Turbine Development. [Online] Available at:
http://www.edpc.ca/plandocs/inwind/IN_Wind_LUB.pdf [Accessed at: 30 June 2018]
County of Kings. (2012). COUNTY OF KINGS Land Use By-Law. [Online] Available at:
http://www.countyofkings.ca/residents/planning/windturbines.aspx [Accessed at: 30 June 2018]
55
County of Richmond. (2010). Land Use By‐Law for the COUNTY OF RICHMOND, Addressing
the Development of Wind Energy. [Online] Available at: http://www.edpc.ca/ri_plandocs.htm
[Accessed at: 30 June 2018]
County of Victoria. (2014). Land Use By-law for the COUNTY OF VICTORIA Concerning the
Regulation of Wind Turbine Development. [Online] Available at:
http://www.edpc.ca/plandocs/viwind/VI_Wind-LUB.pdf
[Accessed at: 30 June 2018]
Diakoulaki D., Antunes C.H., Gomes Martins A. (2005). MCDA and Energy Planning. In:
Multiple Criteria Decision Analysis: State of the Art Surveys. International Series in Operations
Research & Management Science, vol 78. Springer, New York, NY. [Online] Available at:
https://doi-org.ezproxy.its.uu.se/10.1007/0-387-23081-5_21 [Accessed at: 15 March 2018]
DiBiase D. (2018). The Nature of Geographic Information; An Open Geospatial Textbook. Open
Educational Resource Initiative, Penn State’s John A. Dutton e-Education Institute. [Online]
Available at: https://www.e-education.psu.edu/natureofgeoinfo/c7_p10.html [Accessed at: 18
October 2018]
Eastman, J. R., Kyem P.A.K., Toledano, J. (1993). A Procedure for Multi – Objective Decision
Making in GIS under Conditions of Conflicting Objectives. Proceedings of the Fourth European
Conference and Exhibition on Geographical Information Systems, EGIS '93.Genoa: EGIS
Foundation 1: 438-447.
Emera. (2016). Maritime Link-Project Overview. [Online] Available at:
http://www.emeranl.com/site/media/emeranl/Documents/01242014ML%20Overview.pdf
[Accessed at: 26 June 2018]
Enercon. (2015). Enercon Product Overview. [Online] Available at:
https://www.enercon.de/fileadmin/Redakteur/MedienPortal/broschueren/pdf/en/ENERCON_Pro
dukt_en_06_2015.pdf [Accessed at: 1 July 2018]
Esri Tool Help. (2017). How Raster Calculator Works. [Online] Available at:
http://desktop.arcgis.com/en/arcmap/10.3/tools/spatial-analyst-toolbox/how-raster-calculator-
works.htm [Accessed at: 30 June 2018]
Felber G., Stoeglehner G. (2014). Onshore wind energy use in spatial planning—a proposal for
resolving conflicts with a dynamic safety distance approach. Energy, Sustainability and Society 4:
1-8 [Online] Available at: http://dx.doi.org.ezproxy.its.uu.se/10.1186/s13705-014-0022-8
[Accessed at: 18 June 2018]
Ferretti, V. (2011). A multicriteria spatial decision support system development for siting a landfill
in the province of Torino (Italy). Journal of Multi-criteria Decision Analysis 18 (5–6): 231–252.
[Online] Available at: 10.1002/mcda.493 [Accessed at: 19 June 2018]
56
Georgiou A., Polatidis H., Haralambopoulos A.D. (2012). Wind Energy Resource Assessment and
Development: Decision Analysis for Site Evaluation and Application. Energy Sources,Part A:
Recovery, Utilization, and Environmental Effects 34 (19): 1759-1767 [Online] Available at:
http://dx.doi.org/10.1080/15567036.2011.559521 [Accessed at: 19 June 2018]
Geotechnological Chamber of Greece. (2012). Press Release, Suggestions for the Protection of
High Productivity Lands. [Online] Available at:
https://www.geotee.gr/lnkFiles/20120411_DELTIO_TYPOY_protaseis_prostasias_ghs_ypsilis_
paragwgikothtas.pdf [Accessed at: 2 July 2018]
Gigović, L., Pamučar, D., Božanić, D. & Ljubojević, S. (2017). Application of the GIS-DANP-
MABAC multi-criteria model for selecting the location of wind farms: A case study of Vojvodina,
Serbia. Renewable Energy 103: 501-521. [Online] Available at:
https://doi.org/10.1016/j.renene.2016.11.057 [Accessed at: 29 June 2018]
Gorsevski P.V., Cathcart S.C., Mirzaei G., Jamali M.M., Ye X., Gomezdelcampo E. (2013). A
group-based spatial decision support system for wind farm site selection in Northwest Ohio.
Energy Policy 255:374–85. [Online] Available at: 10.1016/j.enpol.2012.12.013 [Accessed at 7
July 2018]
Government of Canada. (2016). Pan-Canadian Framework on Clean Growth and Climate Change:
Canada's Plan to Address Climate Change and Grow the Economy. [Online] Available at:
http://publications.gc.ca/collections/collection_2017/eccc/En4-294-2016-eng.pdf [Accessed at:
23 July 2018]
Government of Canada (2018a). Indian Reserve Act of Nova Scotia (1959). [Online] Available at:
http://laws-lois.justice.gc.ca/eng/acts/I-7.4/FullText.html [Accessed at: 1 July 2018]
Government of Canada. (2018b). Parks Canada in Nova Scotia. [Online] Available at:
https://www.pc.gc.ca/en/voyage-travel/promotion/nouvelle-ecosse-nova-scotia [Accessed at: 26
June 2018]
Greek Wine Federation. (2016). Press Release, Agricultural Land Must be Saved. [Online]
Available at:
http://greekwinefederation.gr/files/repository/20160718120350_DELTIOTYPOUGEORGIKIGI.
pdf [Accessed at: 2 July 2018]
Halifax Regional Municipality. (2013). Land Use By-Law Halifax Peninsula. [Online] Available
at: https://www.halifax.ca/sites/default/files/documents/about-the-city/regional-community-
planning/HalifaxPeninsula221_Effective_March112017.pdf [Accessed at: 30 June 2018]
Haralambopoulos A.D., Polatidis H. (2003). Renewable energy projects: structuring a multicriteria
group decision-making framework. Renewable Energy 28 (6): 961-973. [Online] Available at:
https://doi.org/10.1016/S0960-1481(02)00072-1 [Accessed: 14 March 2018]
57
Harrison D.J. (2012). Onshore Wind Power Systems (ONSWPS): A GIS-Based Tool For
Preliminary Site-Suitability Analysis. MSc Geographic Information Science and Technology.
Thesis, Faculty of the USC Graduate School, Univeristy of Southern California. Unpublished
study [Online] Available at: https://spatial.usc.edu/wp-
content/uploads/2014/04/HarrisonJeffryThesis.pdf [Accessed at: 1 July 2018]
Hellenic Ministry of Environment, Physical Planning and PublicWorks (HMEPPPW). (2008).
Special Regulatory Framework for Land-planning and Sustainable Development in Renewable
Energy Source, Athens, Greece.
Hessburg, P. F., Reynolds, K. M., Salter, R. B., Dickinson, J. D., Gaines, W. L., Harrod, R. J.
(2013). Landscape evaluation for restoration planning on the Okanogan-Wenatchee National
Forest, USA. Sustainability 5: 805–840. [Online] Available at: https://doi.org/10.3390/su5030805
[Accessed at: 19 June 2018]
Historica Canada. (2017). Nova Scotia. [Online] Available at:
https://www.thecanadianencyclopedia.ca/en/article/nova-scotia/ [Accessed at: 26 June 2018]
Höfer T., Sunak Y., Siddique H., Madlener R. (2016). Wind farm siting using a spatial Analytic
Hierarchy Process approach: A case study of the Städteregion Aachen. Applied Energy 163: 222-
243 [Online] Available at: https://doi.org/10.1016/j.apenergy.2015.10.138 [Accessed at: 19 June
2018]
Höhn J., Lehtonen E., Rasi S., Rintala J. (2014). A Geographical Information System (GIS) based
methodology for determination of potential biomasses and sites for biogas plants in southern
Finland. Applied Energy 113: 1-10 [Online] Available at:
https://doi.org/10.1016/j.apenergy.2013.07.005 [Accessed at: 19 June 2018]
Huang C.L., Yoon K. (1981). Multi attribute decision making: methods and applications. Springer,
New York.
Ibrahim, H., Ghandour, M., Dimitrova, M. I., & Perron, J. (2011). Integration of wind energy into
electricity systems: Technical challenges and actual solutions. Energy Procedia, 6, 815-824.
[Online] Available at:doi:10.1016/j.egypro.2011.05.092 [ Accessed at: 1 July 2018]
Important Bird Areas (IBA) Canada. (2015). Important Bird Areas Canada Database. [Online]
Available at: https://www.ibacanada.ca/explore_how.jsp?lang=en&lang=en [Accessed at: 26 June
2018]
Kazak J., Van Hoof J., Szewranski S. (2017). Challenges in the wind turbines location process in
Central Europe – The use of spatial decision support systems. Renewable and Sustainable Energy
Reviews 76: 425-433 [Online] Available at: https://doi.org/10.1016/j.rser.2017.03.039 [Accessed
at: 19 June 2018]
58
Keenay L.R. (1982). Decision Analysis: An Overview. Operations Research 30 (5): 803-838
[Online] Available at: https://www.jstor.org/stable/170347 [Accessed at: 11 September 2018]
Kumar A., Sah B., Singh R.A., Deng Y., He X., Kumar P., Bansal R.C. (2017). A review of multi
criteria decision making (MCDM) towards sustainable renewable energy development. Renewable
and Sustainable Energy Reviews 69: 596-609 [Online] Available at:
https://doi.org/10.1016/j.rser.2016.11.191 [Accessed at: 18 June 2018]
Latinopoulos D., Kechagia K. (2015). A GIS-based multi-criteria evaluation for wind farm site
selection. A regional scale application in Greece. Renewable Energy 78: 550-560 [Online]
Available at: https://doi.org/10.1016/j.renene.2015.01.041 [Accessed at: 18 June 2018]
Leão, S., Bishop, I., Evans, D. (2004). Spatial–temporal model for demand and allocation of waste
landfills in growing urban regions. Computers, Environment and Urban Systems 28 (4):353–385.
[Online] Available at: https://doi.org/10.1016/S0198-9715(03)00043-7 [Accessed at: 19 June
2018]
Loken E. (2007). Use of multicriteria decision analysis methods for energy planning problems.
Renewable and Sustainable Energy Reviews 11 (7): 1584-1595 [Online] Available at:
https://doi.org/10.1016/j.rser.2005.11.005 [Accessed at: 15 March 2018]
Malczewski., J. (1999). GIS and Multicriteria Decision Analysis. John Willey and Sons Inc. New
York pp 117-136.
Malczewski J. (2006). GIS‐based multicriteria decision analysis: a survey of the literature.
International Journal of Geographical Information Science 20 (7): 703-726 [Online] Available at:
https://doi-org.ezproxy.its.uu.se/10.1080/13658810600661508 [Accessed at: 19 June 2018]
Malczewski J., Rinner C. (2015). Multicriteria Decision Analysis in Geographic Information
Science. Springer Science Business Media New York, New York. pp. 64 [Online] Available at:
10.1007/978-3-540-74757-4 [Accessed at: 19 June 2018]
Mills B.M. (2015). Preserving Agriculture through Wind Energy Development: A Study of the
Social, Economic, and Land Use Effects of Windfarms on Rural Landowners and Their
Communities. Doctoral Dissertation., Urban and Regional Planning. University of Michigan.
Unpublished Dissertation. [Online] Available at:
https://deepblue.lib.umich.edu/bitstream/handle/2027.42/111508/sbmills_1.pdf?sequence=1&isA
llowed=y [Accessed at: 2 July 2018]
Munda G. (2004). Social multi-criteria evaluation: Methodological foundations and operational
consequence.s European Journal of Operational Research 158 (3): 662-977 [Online] Available at:
https://doi.org/10.1016/S0377-2217(03)00369-2 [Accessed at: 15 March 2018]F
Municipality of Argyle. (2016). MUNICIPALITY OF ARGYLE Land Use By-Law. [Online]
Available at: https://www.munargyle.com/en/land-use-bylaw.html [Accessed at: 30 June 2018]
59
Municipality of Cumberland (2016). Municipality of Cumberland Land Use By-Law. [Online]
Available at: https://cumberlandcounty.ns.ca/38-consolidated-lub-june-7-2016-official/file.html
[Accessed at: 30 Jun3 2018]
Municipality of the County of Colchester. (2013). Chapter 56 Wind Turbine Development By-law
[Online] Available at: https://www.colchester.ca/527-wind-turbine-development-by-law-chapter-
56/file [Accessed at: 30 June 2018]
Municipality of the County of Pictou. (2007). Municipality of the County of Pictou Land Use By-
Law. [Online] Available at: http://county.pictou.ns.ca/assets/Bylaws-downloads/Wind-Energy-
LUB-Amendment.pdf [Accessed at: 30 June 2018]
Municipality of the District of Barrington. (2013). Municipality of the District of Barrington Land
Use By-Law. [Online] Available at: https://www.barringtonmunicipality.com/council/municipal-
by-laws/1140-land-use-bylaw/file [Accessed at: 30 June 2018]
Municipality of the District of Digby. (2010). Land Use By-law for the Regulation of Wind
Turbine Development in the Municipality of the District of Digby. [Online] Available at:
https://www.digbydistrict.ca/163-regulation-of-wind-turbine-development-land-use-by-law-
january-25-2010/file.html [Accessed at: 30 June 2018]
Municipality of the District of Guysborough. (2013). Official Land Use Bylaw. As amended April
10, 2013. [Online] Available at:
http://modg.ca/sites/default/files/pdfs/LAND%20USE%20BYLAW.pdf [Accessed at: 30 June
2018]
Municipality of the District of Shelburne. (2015). Land Use By-Law L-101. [Online] Available
at:https://www.municipalityofshelburne.ca/by-laws/377-municipal-planning-strategy-and-land-
use-by-law-l-101/file.html [Accessed at: 30 June 2018]
Municipality of the District of Yarmouth. (2011). Wind Energy Development By-Law W-0106-
11. [Online] Available at:
http://www.district.yarmouth.ns.ca/agenda/files2/001/000445/WindEnergyDevelopmentBy-
lawFinal%20_3_.pdf [Accessed at: 30 June 2018]
National Energy Board of Canada. (2015a). Provincial and Territorial Energy Profiles-Nova
Scotia. [Online] Available at: https://www.neb-one.gc.ca/nrg/ntgrtd/mrkt/nrgsstmprfls/ns-
eng.html [Accessed at: 26 June 2018]
National Energy Board of Canada. (2015b). Market Snapshot: Some Canadian provinces have
already met their 2030 GHG emissions targets. [Online] Available at: https://www.neb-
one.gc.ca/nrg/ntgrtd/mrkt/snpsht/2017/07-01prvncsmssnstrgts-eng.html [Accessed at: 26 June
2018]
60
National Energy Board of Canada. (2016a). Canada’s Adoption of Renewable Power Sources –
Energy Market Analysis. [Online] Available at: https://www.neb-
one.gc.ca/nrg/sttstc/lctrct/rprt/2017cnddptnrnwblpwr/wnd-eng.html#fg10 [Accessed at: 23 July
2018]
National Energy Board of Canada. (2016b). Canada’s Renewable Power Landscape 2016 – Energy
Market Analysis-Nova Scotia. [Online] Available at: http://www.neb-
one.gc.ca/nrg/sttstc/lctrct/rprt/2016cndrnwblpwr/prvnc/ns-eng.html [Accessed at: 27 June 2018]
National Energy Board of Canada. (2017a). Market Snapshot: Some Canadian provinces have
already met their 2030 GHG emissions targets. [Online] Available at: https://www.neb-
one.gc.ca/nrg/ntgrtd/mrkt/snpsht/2017/07-01prvncsmssnstrgts-eng.html [Accessed at: 23 July
2018]
National Energy Board of Canada. (2017b). Canada’s Renewable Landscape-Energy Analysis
2017. [Online] Available at: https://www.neb-
one.gc.ca/nrg/sttstc/lctrct/rprt/2017cndrnwblpwr/2017cndrnwblpwr-eng.pdf [Accessed at: 23 July
2018]
Nature Canada. (2018). Wind Turbines. [Online] Available at:
http://naturecanada.ca/initiatives/save-bird-lives/wind-turbines/. [Accessed at: 30 June 2018]
Natural Resources Canada. (2002). Atlas of Canada 6th Edition: Nova Scotia. [Online] Available
at:https://www.nrcan.gc.ca/earth-sciences/geography/atlas-canada/reference-
maps/16846#provincial-and-territorial-outline [Accessed at: 26 June 2018]
New Brunswick Department of Energy. (2008). REPORT: Model Wind Turbine Provisions and
Best Practices for New Brunswick Municipalities, Rural Communities and Unincorporated Areas.
[Online] Available at:
http://www2.gnb.ca/content/dam/gnb/Departments/en/pdf/Publications/NBwindEnergy.pdf
[Accessed at: 30 June 2018]
New Brunswick Department of Natural Resources. (2012). Allocation of Crown Lands for Wind
Power Projects. [Online] Available at: http://www2.gnb.ca/content/dam/gnb/Departments/nr-
rn/pdf/en/Publications/CLM0172005.pdf [Accessed at: 30 June 2018]
Nova Scotia Department of Agriculture. (2008). A Review of Initiatives Indented to Conserve
Agricultural Land. [Online] Available at: https://novascotia.ca/agri/documents/business-
research/LandUseReview.pdf [Accessed ay: 1 July 2018]
Nova Scotia Department of Agriculture. (2010). Profile of Agricultural Land Resources in Nova
Scotia. [Online] Available at: https://novascotia.ca/agri/documents/business-
research/AL1000%20Nova%20Scotia.pdf [Accessed at: 1 July 2018]
61
Nova Scotia Department of Energy. (2010). Renewable Electricity Plan. A path to good jobs,
stable prices, and a cleaner environment. [Online] Available at:
http://normandmousseau.com/documents/Locke-3.pdf [Accessed at: 26 June 2018]
Nova Scotia Department of Energy. (2015). Our Electricity Future Nova Scotia’s Electricity Plan
2015-2040. [Online] Available at: https://energy.novascotia.ca/sites/default/files/Our-Electricity-
Future.pdf [Accessed at: 26 June 2018]
Nova Scotia Department of Energy. (2017). COMFIT Review. [Online] Available at:
https://energy.novascotia.ca/renewables/programs-and-projects/comfit/applicant-submission-
report [Accessed at: 26 June 2018]
Nova Scotia Department of Energy. (Undated). Wind Turbine Effects. [Online] Available at:
https://energy.novascotia.ca/sites/default/files/Wind%20Turbine%20Effects.pdf [Accessed at: 23
July 2018]
Nova Scotia Department of Environment. (2002). Natural Landscapes of Nova Scotia: Summary
Descriptions, January 2002. [Online] Available at:
https://novascotia.ca/nse/protectedareas/docs/landscapes_report.pdf [Accessed at: 26 June 2018]
Nova Scotia Department of Environment. (2010). The State of Nova Scotia’s Coast: Technical
Report. [Online] Available at: https://novascotia.ca/coast/documents/report/Coastal-Tech-Report-
Chapter3.pdf [Accessed at: 26 June 2018]
Nova Scotia Department of Environment. (2017a). Nova Scotia’s Wetlands. [Online] Available
at: https://novascotia.ca/nse/wetland/ [Accessed at: 26 June 2018]
Nova Scotia Department of Environment. (2017b). About Protected Areas. [Online] Available at:
https://novascotia.ca/nse/protectedareas/about.asp [Accessed at: 26 June 2018]
Nova Scotia Department of Environment. (2017c). Projects-Environmental Assessments. [Online]
Available at: https://novascotia.ca/nse/ea/projects.asp?display=complete&x=83&y=25 [Accessed
at: 26 June 2018]
Nova Scotia Department of Municipal Affairs. (2016). Annual Report, Municipal Statistics 2015-
2016. [Online] Available at: https://novascotia.ca/dma/pdf/mun-2016-annual-report-of-
municipal-statistics.pdf [Accessed at: 26 June 2018]
Nova Scotia Department of Natural Resources. (2012). Nova Scotia’s Code of Forest Practice A
Framework for the Implementation of Sustainable Forest Management Guidelines For Crown
Land. [Online] Available at: https://novascotia.ca/natr/forestry/reports/Code-of-Forest-
Practice.pdf [Accessed at: 26 June 2018]
Nova Scotia Department of Natural Resources. (2013). Crown Land in Nova Scotia. [Online]
Available at: https://novascotia.ca/natr/land/ [Accessed at: 30 June 2018]
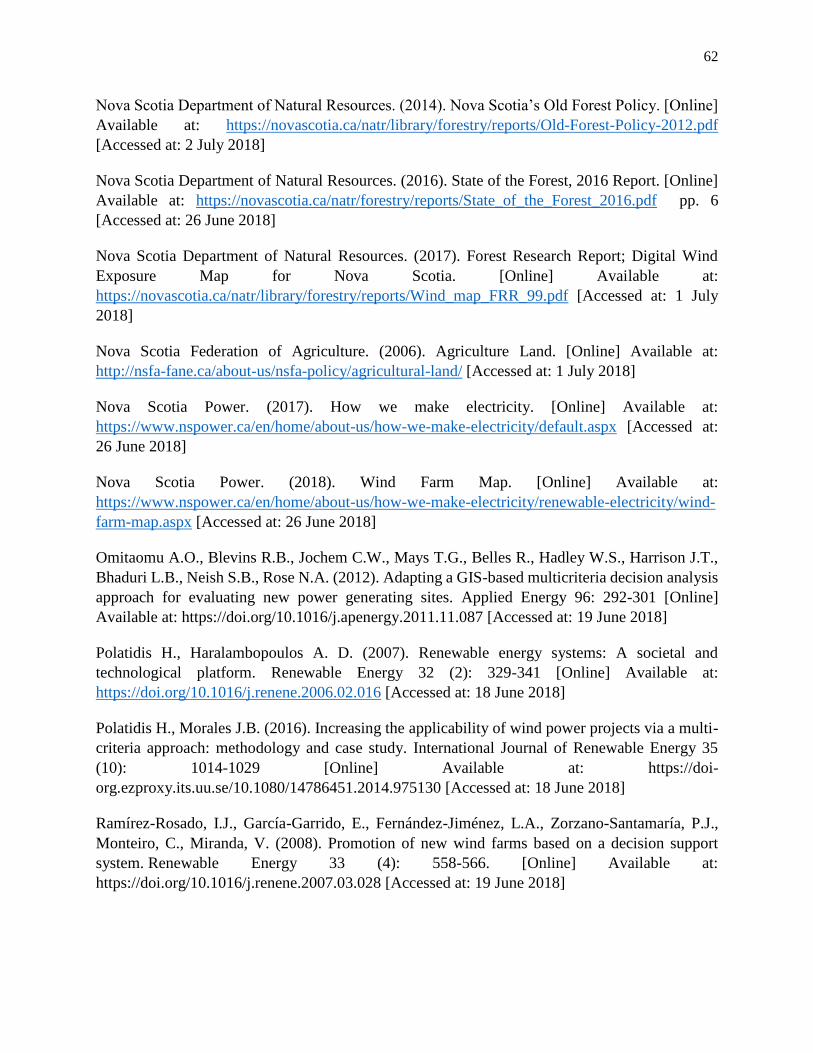
62
Nova Scotia Department of Natural Resources. (2014). Nova Scotia’s Old Forest Policy. [Online]
Available at: https://novascotia.ca/natr/library/forestry/reports/Old-Forest-Policy-2012.pdf
[Accessed at: 2 July 2018]
Nova Scotia Department of Natural Resources. (2016). State of the Forest, 2016 Report. [Online]
Available at: https://novascotia.ca/natr/forestry/reports/State_of_the_Forest_2016.pdf pp. 6
[Accessed at: 26 June 2018]
Nova Scotia Department of Natural Resources. (2017). Forest Research Report; Digital Wind
Exposure Map for Nova Scotia. [Online] Available at:
https://novascotia.ca/natr/library/forestry/reports/Wind_map_FRR_99.pdf [Accessed at: 1 July
2018]
Nova Scotia Federation of Agriculture. (2006). Agriculture Land. [Online] Available at:
http://nsfa-fane.ca/about-us/nsfa-policy/agricultural-land/ [Accessed at: 1 July 2018]
Nova Scotia Power. (2017). How we make electricity. [Online] Available at:
https://www.nspower.ca/en/home/about-us/how-we-make-electricity/default.aspx [Accessed at:
26 June 2018]
Nova Scotia Power. (2018). Wind Farm Map. [Online] Available at:
https://www.nspower.ca/en/home/about-us/how-we-make-electricity/renewable-electricity/wind-
farm-map.aspx [Accessed at: 26 June 2018]
Omitaomu A.O., Blevins R.B., Jochem C.W., Mays T.G., Belles R., Hadley W.S., Harrison J.T.,
Bhaduri L.B., Neish S.B., Rose N.A. (2012). Adapting a GIS-based multicriteria decision analysis
approach for evaluating new power generating sites. Applied Energy 96: 292-301 [Online]
Available at: https://doi.org/10.1016/j.apenergy.2011.11.087 [Accessed at: 19 June 2018]
Polatidis H., Haralambopoulos A. D. (2007). Renewable energy systems: A societal and
technological platform. Renewable Energy 32 (2): 329-341 [Online] Available at:
https://doi.org/10.1016/j.renene.2006.02.016 [Accessed at: 18 June 2018]
Polatidis H., Morales J.B. (2016). Increasing the applicability of wind power projects via a multi-
criteria approach: methodology and case study. International Journal of Renewable Energy 35
(10): 1014-1029 [Online] Available at: https://doi-
org.ezproxy.its.uu.se/10.1080/14786451.2014.975130 [Accessed at: 18 June 2018]
Ramírez-Rosado, I.J., García-Garrido, E., Fernández-Jiménez, L.A., Zorzano-Santamaría, P.J.,
Monteiro, C., Miranda, V. (2008). Promotion of new wind farms based on a decision support
system. Renewable Energy 33 (4): 558-566. [Online] Available at:
https://doi.org/10.1016/j.renene.2007.03.028 [Accessed at: 19 June 2018]
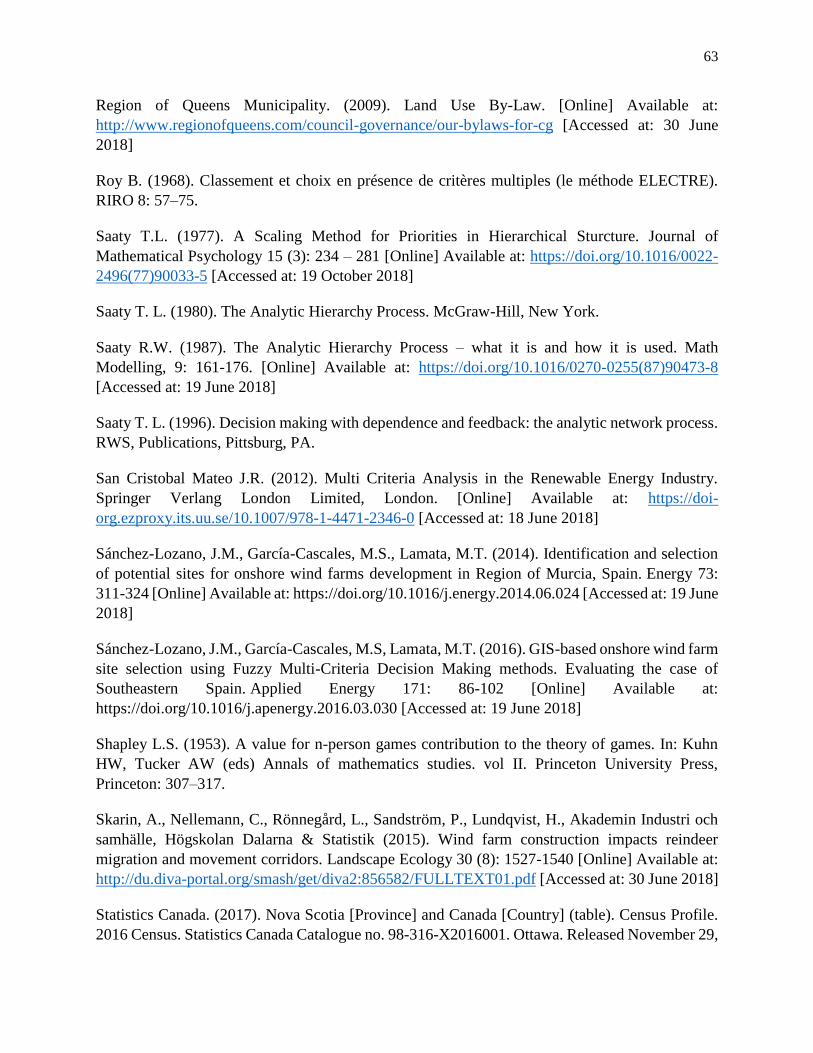
63
Region of Queens Municipality. (2009). Land Use By-Law. [Online] Available at:
http://www.regionofqueens.com/council-governance/our-bylaws-for-cg [Accessed at: 30 June
2018]
Roy B. (1968). Classement et choix en présence de critères multiples (le méthode ELECTRE).
RIRO 8: 57–75.
Saaty T.L. (1977). A Scaling Method for Priorities in Hierarchical Sturcture. Journal of
Mathematical Psychology 15 (3): 234 – 281 [Online] Available at: https://doi.org/10.1016/0022-
2496(77)90033-5 [Accessed at: 19 October 2018]
Saaty T. L. (1980). The Analytic Hierarchy Process. McGraw-Hill, New York.
Saaty R.W. (1987). The Analytic Hierarchy Process – what it is and how it is used. Math
Modelling, 9: 161-176. [Online] Available at: https://doi.org/10.1016/0270-0255(87)90473-8
[Accessed at: 19 June 2018]
Saaty T. L. (1996). Decision making with dependence and feedback: the analytic network process.
RWS, Publications, Pittsburg, PA.
San Cristobal Mateo J.R. (2012). Multi Criteria Analysis in the Renewable Energy Industry.
Springer Verlang London Limited, London. [Online] Available at: https://doi-
org.ezproxy.its.uu.se/10.1007/978-1-4471-2346-0 [Accessed at: 18 June 2018]
Sánchez-Lozano, J.M., García-Cascales, M.S., Lamata, M.T. (2014). Identification and selection
of potential sites for onshore wind farms development in Region of Murcia, Spain. Energy 73:
311-324 [Online] Available at: https://doi.org/10.1016/j.energy.2014.06.024 [Accessed at: 19 June
2018]
Sánchez-Lozano, J.M., García-Cascales, M.S, Lamata, M.T. (2016). GIS-based onshore wind farm
site selection using Fuzzy Multi-Criteria Decision Making methods. Evaluating the case of
Southeastern Spain. Applied Energy 171: 86-102 [Online] Available at:
https://doi.org/10.1016/j.apenergy.2016.03.030 [Accessed at: 19 June 2018]
Shapley L.S. (1953). A value for n-person games contribution to the theory of games. In: Kuhn
HW, Tucker AW (eds) Annals of mathematics studies. vol II. Princeton University Press,
Princeton: 307–317.
Skarin, A., Nellemann, C., Rönnegård, L., Sandström, P., Lundqvist, H., Akademin Industri och
samhälle, Högskolan Dalarna & Statistik (2015). Wind farm construction impacts reindeer
migration and movement corridors. Landscape Ecology 30 (8): 1527-1540 [Online] Available at:
http://du.diva-portal.org/smash/get/diva2:856582/FULLTEXT01.pdf [Accessed at: 30 June 2018]
Statistics Canada. (2017). Nova Scotia [Province] and Canada [Country] (table). Census Profile.
2016 Census. Statistics Canada Catalogue no. 98-316-X2016001. Ottawa. Released November 29,
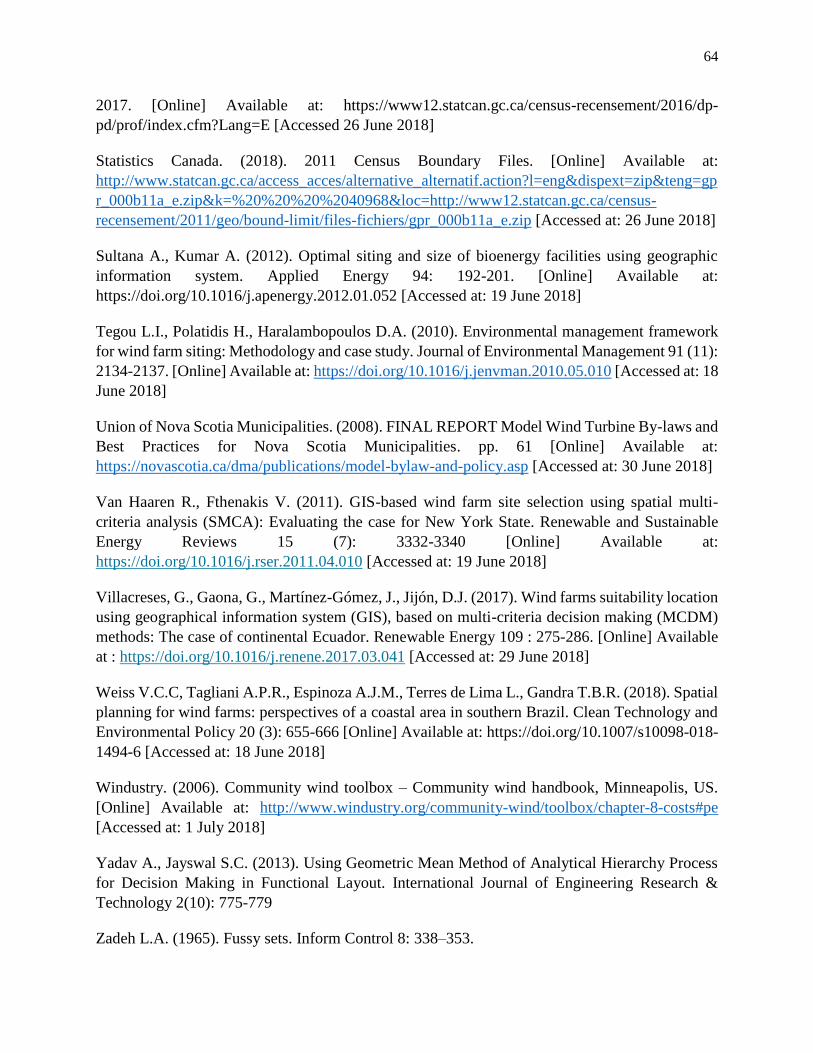
64
2017. [Online] Available at: https://www12.statcan.gc.ca/census-recensement/2016/dp-
pd/prof/index.cfm?Lang=E [Accessed 26 June 2018]
Statistics Canada. (2018). 2011 Census Boundary Files. [Online] Available at:
http://www.statcan.gc.ca/access_acces/alternative_alternatif.action?l=eng&dispext=zip&teng=gp
r_000b11a_e.zip&k=%20%20%20%2040968&loc=http://www12.statcan.gc.ca/census-
recensement/2011/geo/bound-limit/files-fichiers/gpr_000b11a_e.zip [Accessed at: 26 June 2018]
Sultana A., Kumar A. (2012). Optimal siting and size of bioenergy facilities using geographic
information system. Applied Energy 94: 192-201. [Online] Available at:
https://doi.org/10.1016/j.apenergy.2012.01.052 [Accessed at: 19 June 2018]
Tegou L.I., Polatidis H., Haralambopoulos D.A. (2010). Environmental management framework
for wind farm siting: Methodology and case study. Journal of Environmental Management 91 (11):
2134-2137. [Online] Available at: https://doi.org/10.1016/j.jenvman.2010.05.010 [Accessed at: 18
June 2018]
Union of Nova Scotia Municipalities. (2008). FINAL REPORT Model Wind Turbine By-laws and
Best Practices for Nova Scotia Municipalities. pp. 61 [Online] Available at:
https://novascotia.ca/dma/publications/model-bylaw-and-policy.asp [Accessed at: 30 June 2018]
Van Haaren R., Fthenakis V. (2011). GIS-based wind farm site selection using spatial multi-
criteria analysis (SMCA): Evaluating the case for New York State. Renewable and Sustainable
Energy Reviews 15 (7): 3332-3340 [Online] Available at:
https://doi.org/10.1016/j.rser.2011.04.010 [Accessed at: 19 June 2018]
Villacreses, G., Gaona, G., Martínez-Gómez, J., Jijón, D.J. (2017). Wind farms suitability location
using geographical information system (GIS), based on multi-criteria decision making (MCDM)
methods: The case of continental Ecuador. Renewable Energy 109 : 275-286. [Online] Available
at : https://doi.org/10.1016/j.renene.2017.03.041 [Accessed at: 29 June 2018]
Weiss V.C.C, Tagliani A.P.R., Espinoza A.J.M., Terres de Lima L., Gandra T.B.R. (2018). Spatial
planning for wind farms: perspectives of a coastal area in southern Brazil. Clean Technology and
Environmental Policy 20 (3): 655-666 [Online] Available at: https://doi.org/10.1007/s10098-018-
1494-6 [Accessed at: 18 June 2018]
Windustry. (2006). Community wind toolbox – Community wind handbook, Minneapolis, US.
[Online] Available at: http://www.windustry.org/community-wind/toolbox/chapter-8-costs#pe
[Accessed at: 1 July 2018]
Yadav A., Jayswal S.C. (2013). Using Geometric Mean Method of Analytical Hierarchy Process
for Decision Making in Functional Layout. International Journal of Engineering Research &
Technology 2(10): 775-779
Zadeh L.A. (1965). Fussy sets. Inform Control 8: 338–353.
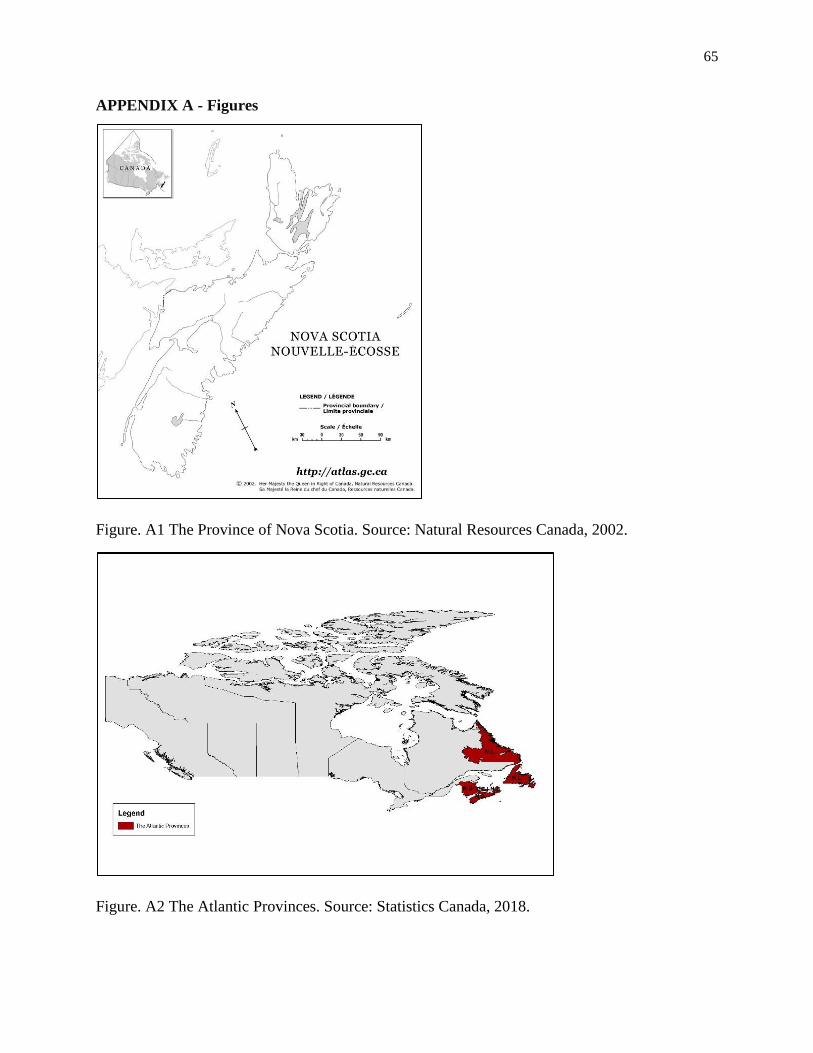
65
APPENDIX A - Figures
Figure. A1 The Province of Nova Scotia. Source: Natural Resources Canada, 2002.
Figure. A2 The Atlantic Provinces. Source: Statistics Canada, 2018.
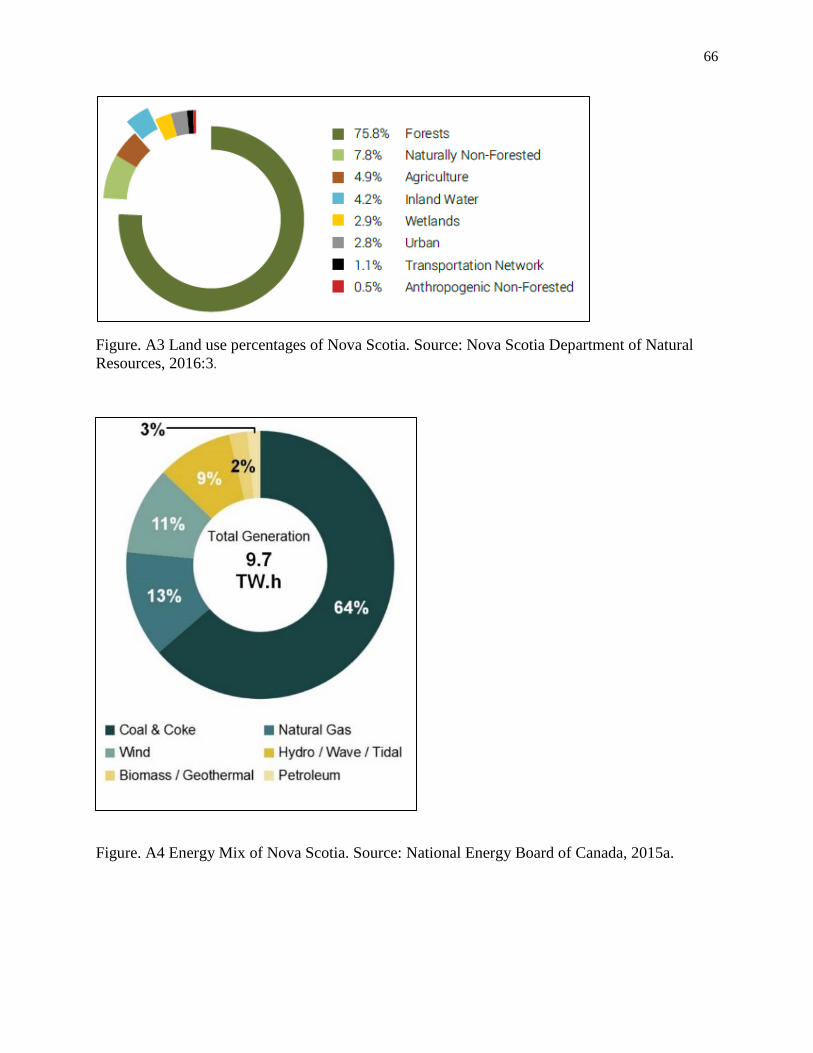
66
Figure. A3 Land use percentages of Nova Scotia. Source: Nova Scotia Department of Natural
Resources, 2016:3.
Figure. A4 Energy Mix of Nova Scotia. Source: National Energy Board of Canada, 2015a.
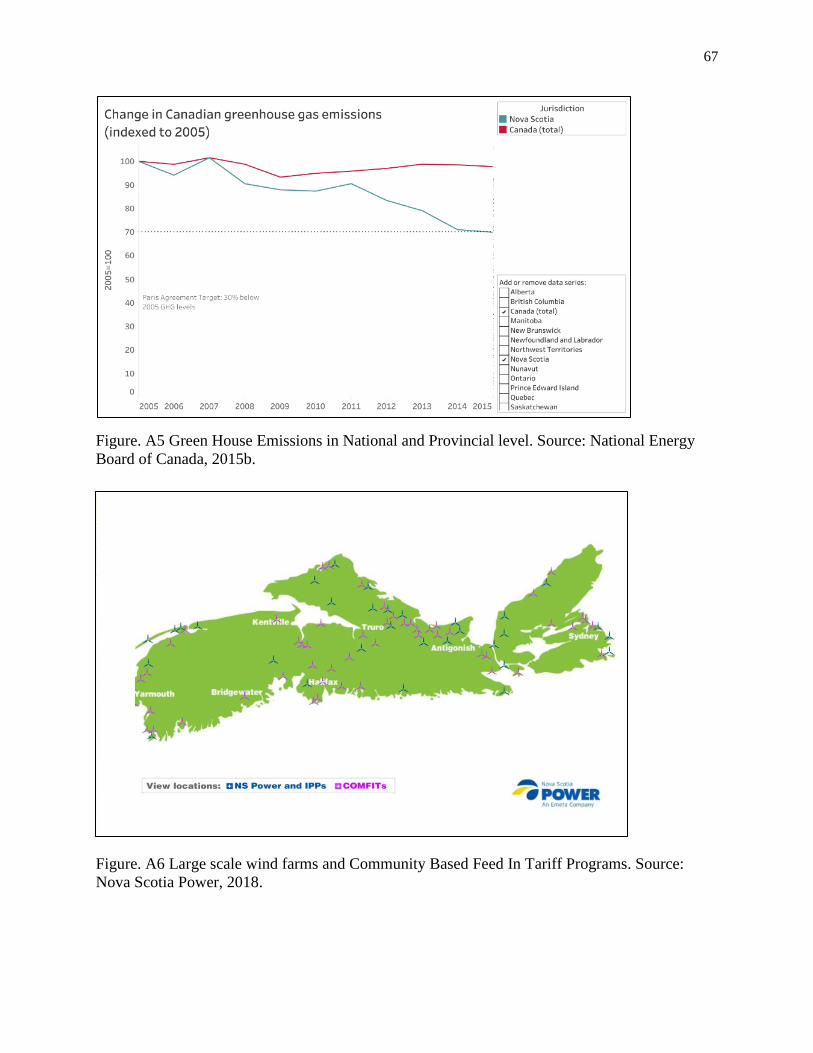
67
Figure. A5 Green House Emissions in National and Provincial level. Source: National Energy
Board of Canada, 2015b.
Figure. A6 Large scale wind farms and Community Based Feed In Tariff Programs. Source:
Nova Scotia Power, 2018.
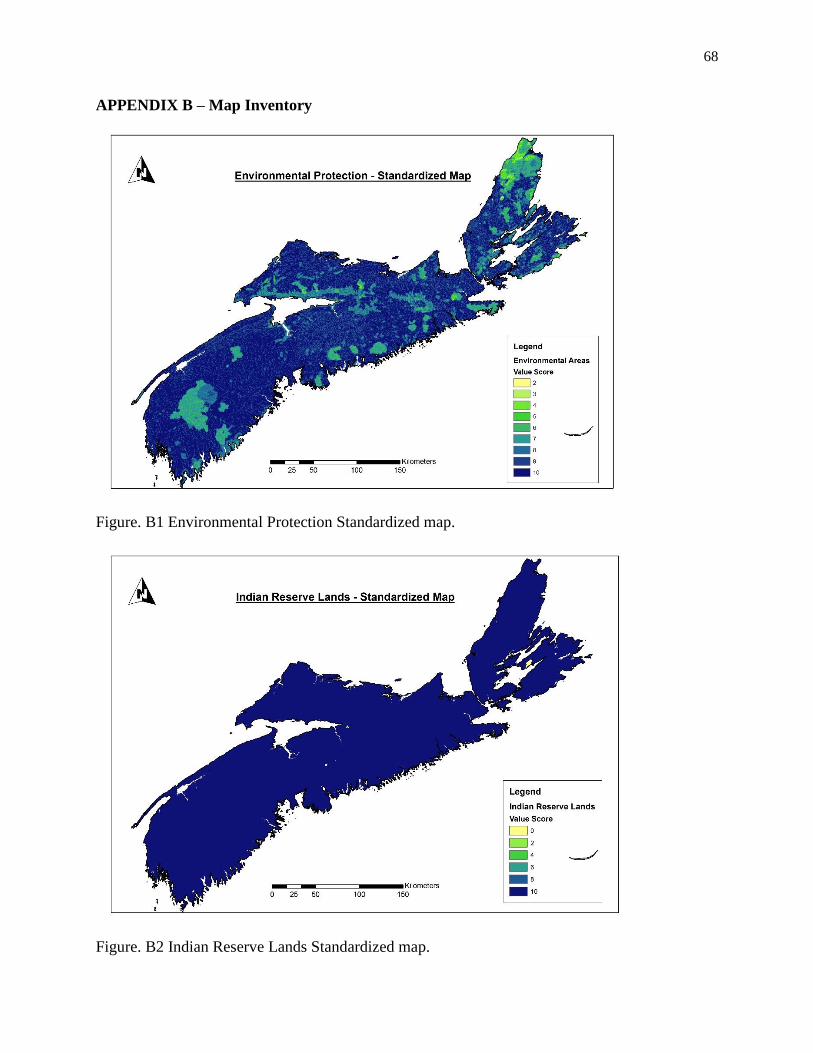
68
APPENDIX B – Map Inventory
Figure. B1 Environmental Protection Standardized map.
Figure. B2 Indian Reserve Lands Standardized map.
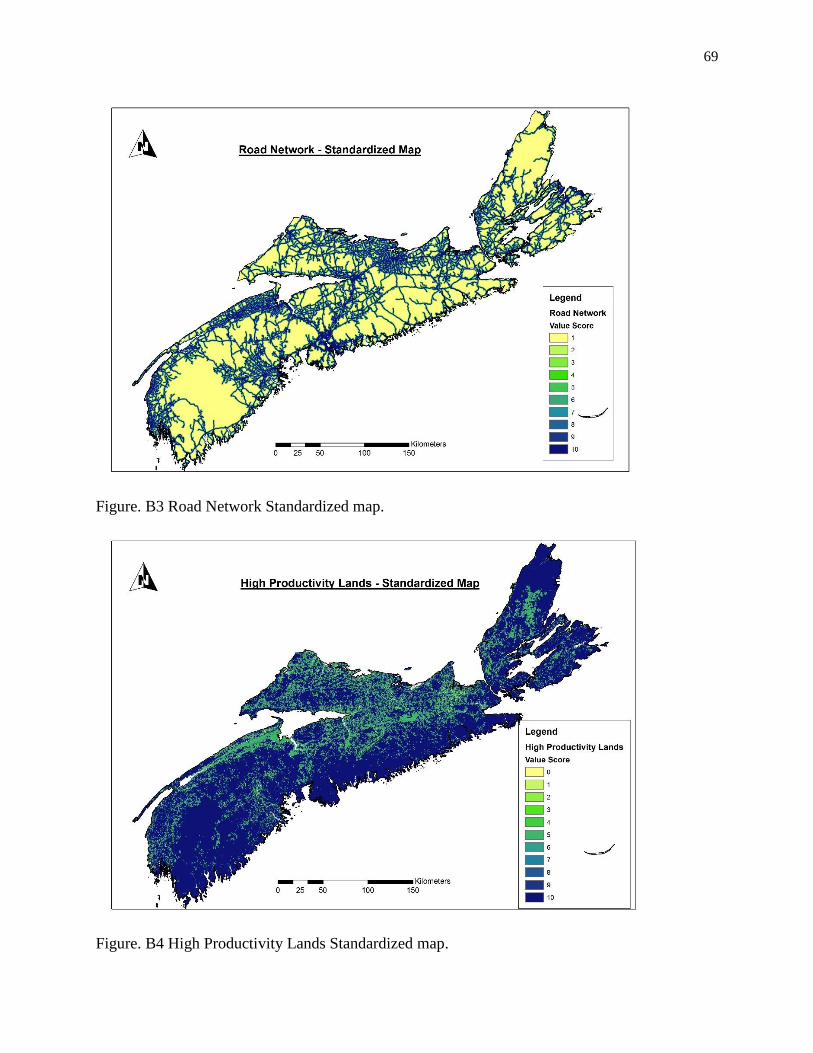
69
Figure. B3 Road Network Standardized map.
Figure. B4 High Productivity Lands Standardized map.
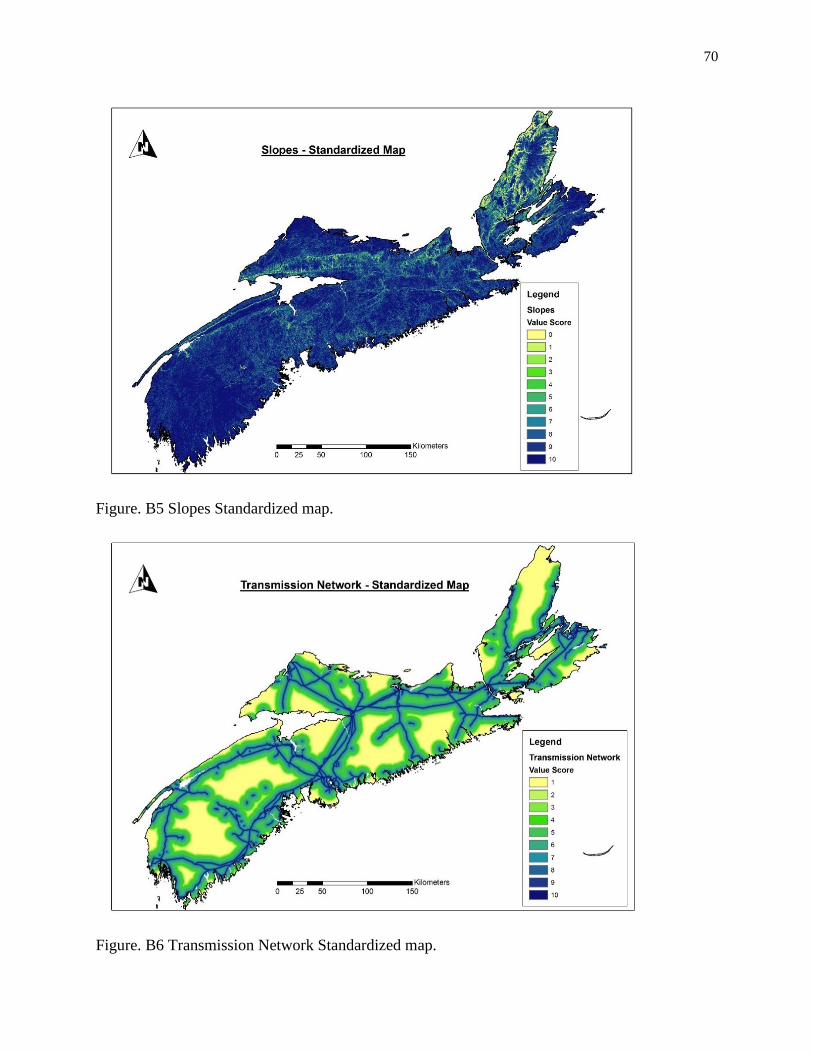
70
Figure. B5 Slopes Standardized map.
Figure. B6 Transmission Network Standardized map.
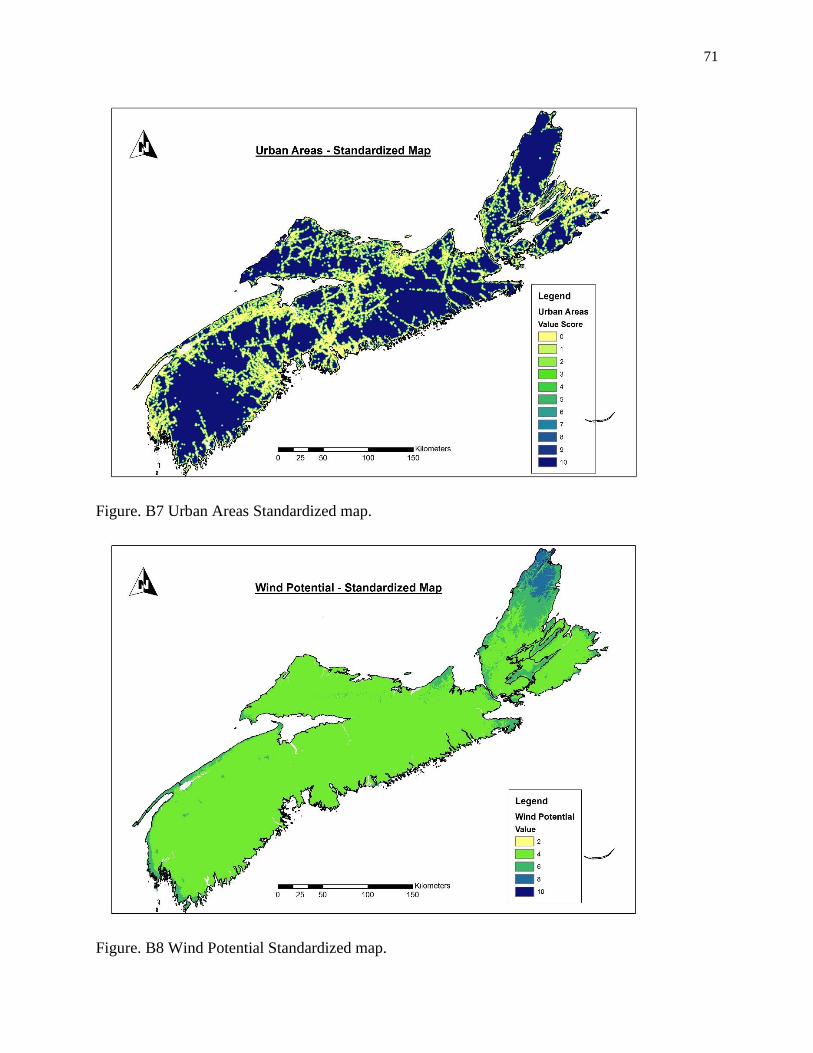
71
Figure. B7 Urban Areas Standardized map.
Figure. B8 Wind Potential Standardized map.
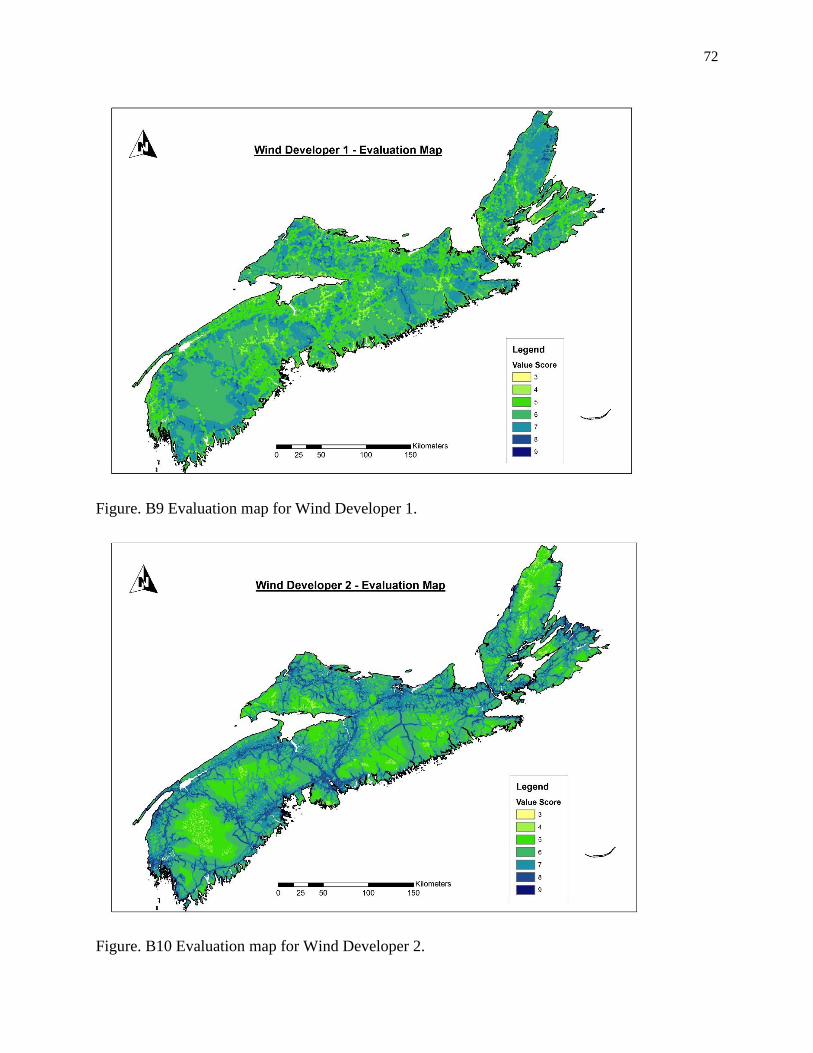
72
Figure. B9 Evaluation map for Wind Developer 1.
Figure. B10 Evaluation map for Wind Developer 2.
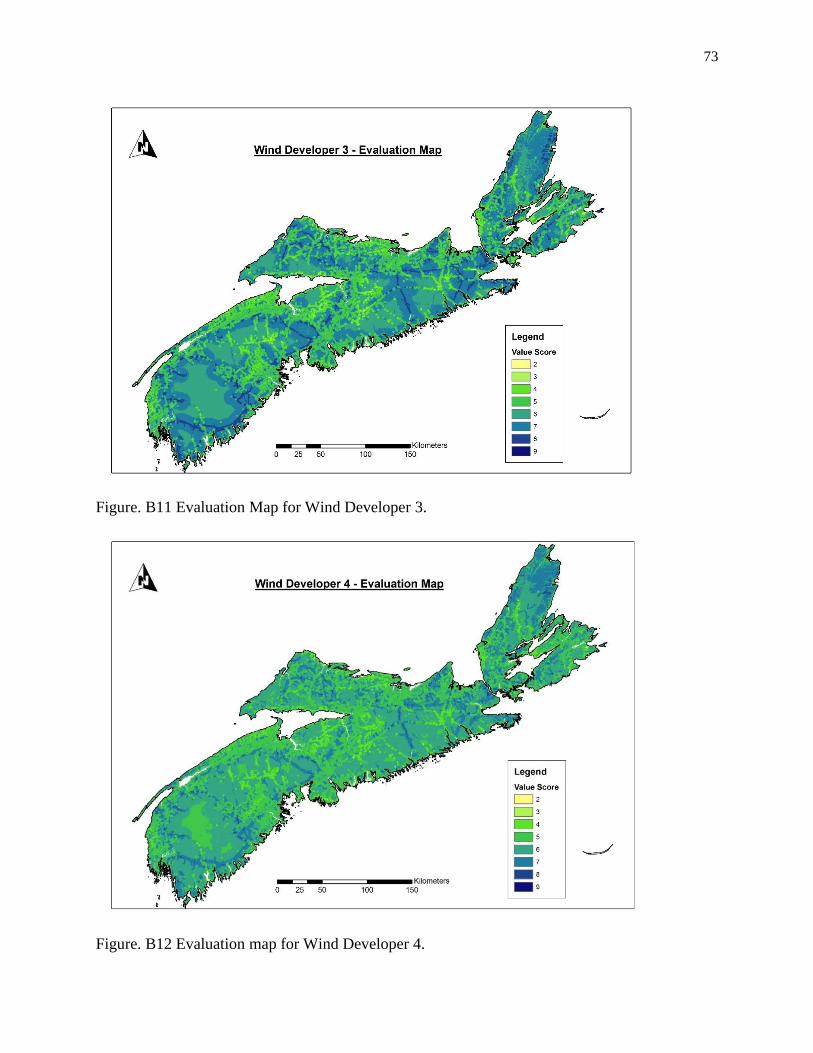
73
Figure. B11 Evaluation Map for Wind Developer 3.
Figure. B12 Evaluation map for Wind Developer 4.
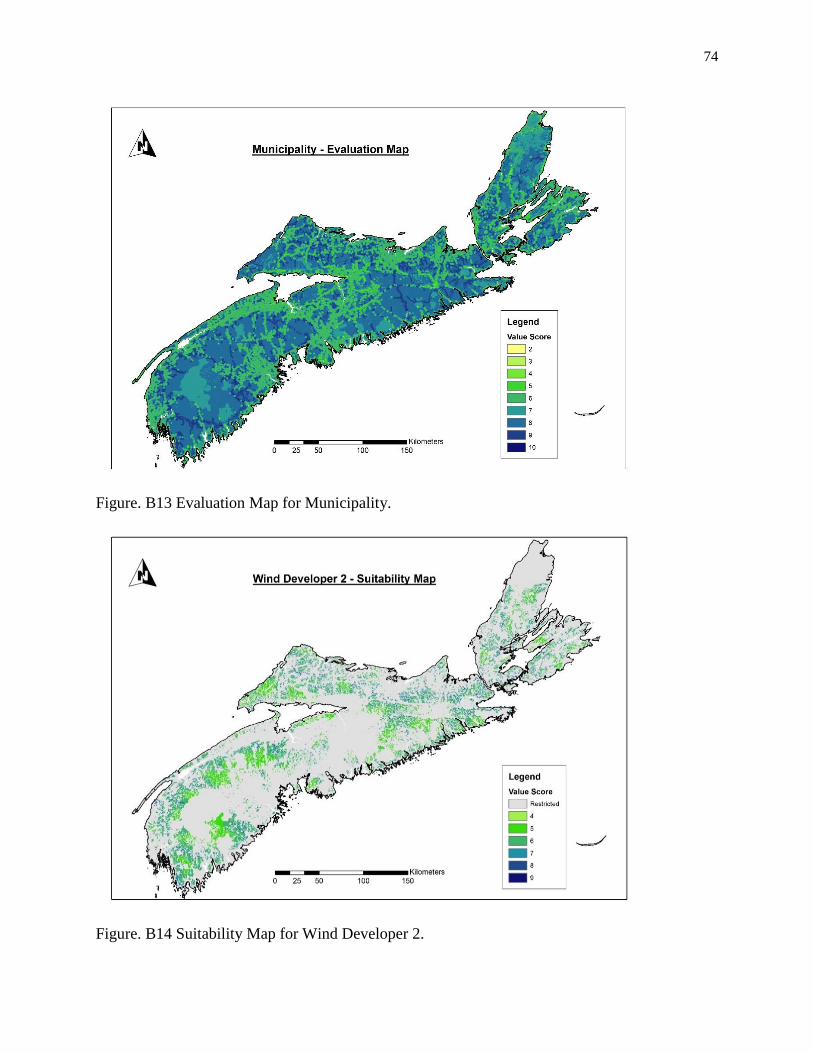
74
Figure. B13 Evaluation Map for Municipality.
Figure. B14 Suitability Map for Wind Developer 2.
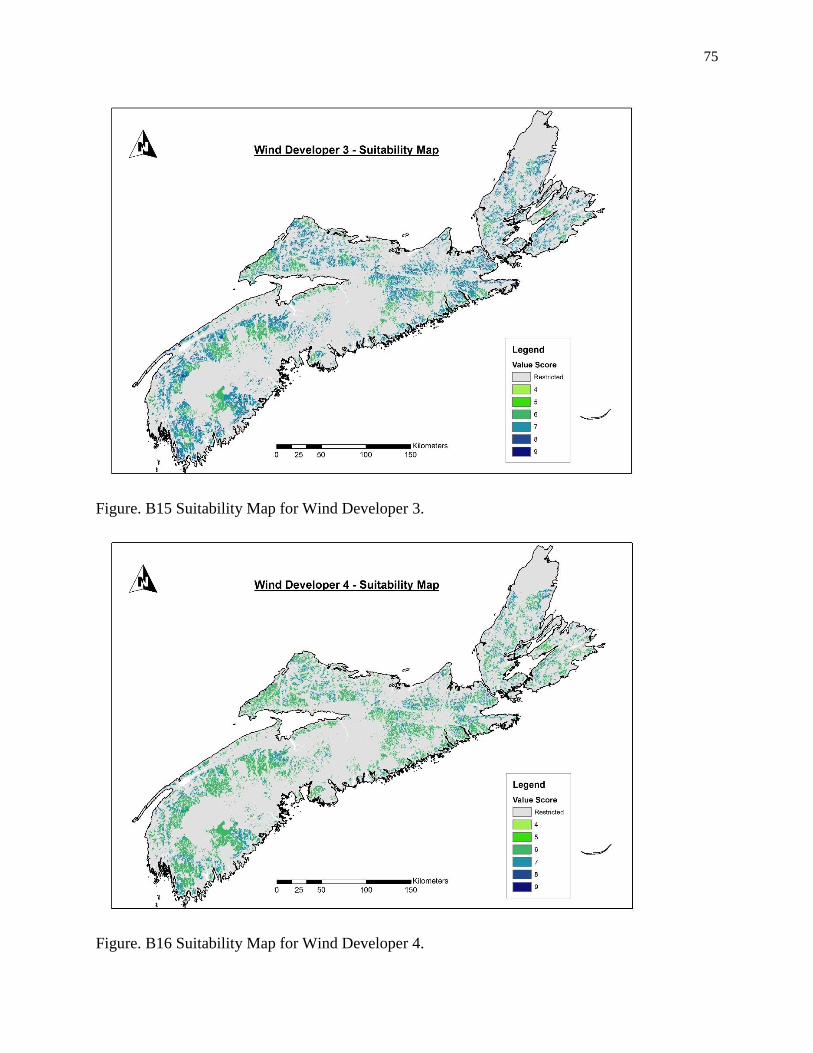
75
Figure. B15 Suitability Map for Wind Developer 3.
Figure. B16 Suitability Map for Wind Developer 4.
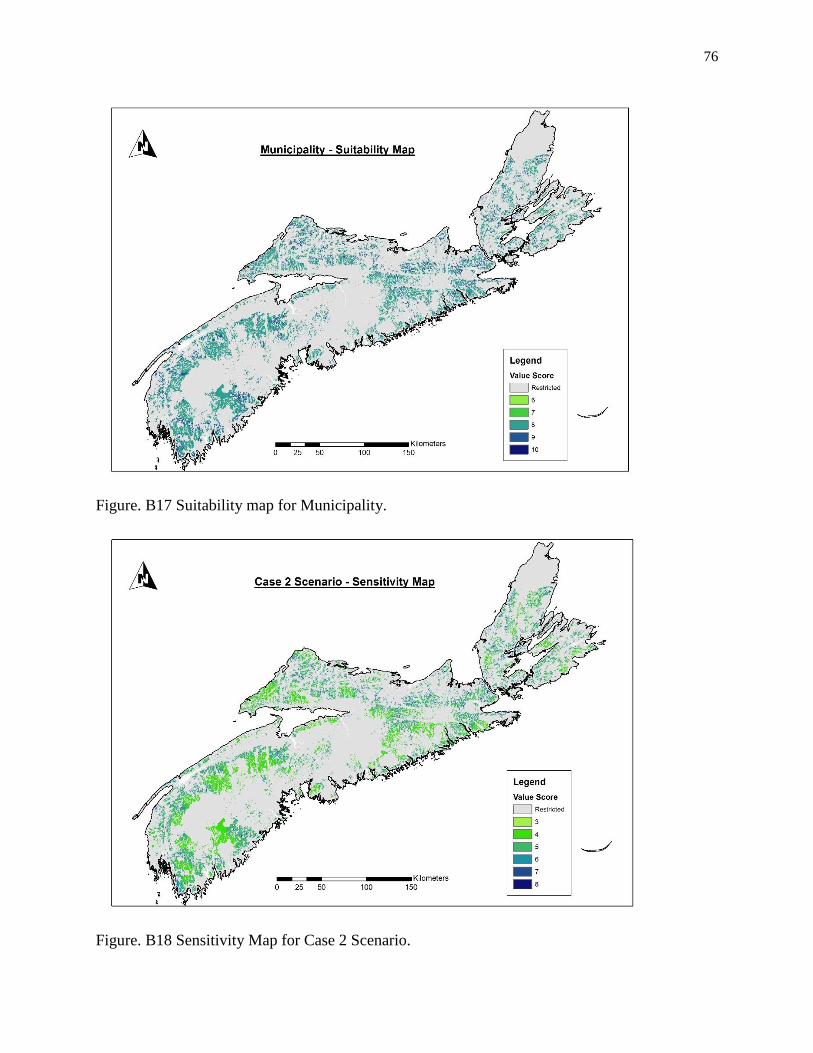
76
Figure. B17 Suitability map for Municipality.
Figure. B18 Sensitivity Map for Case 2 Scenario.
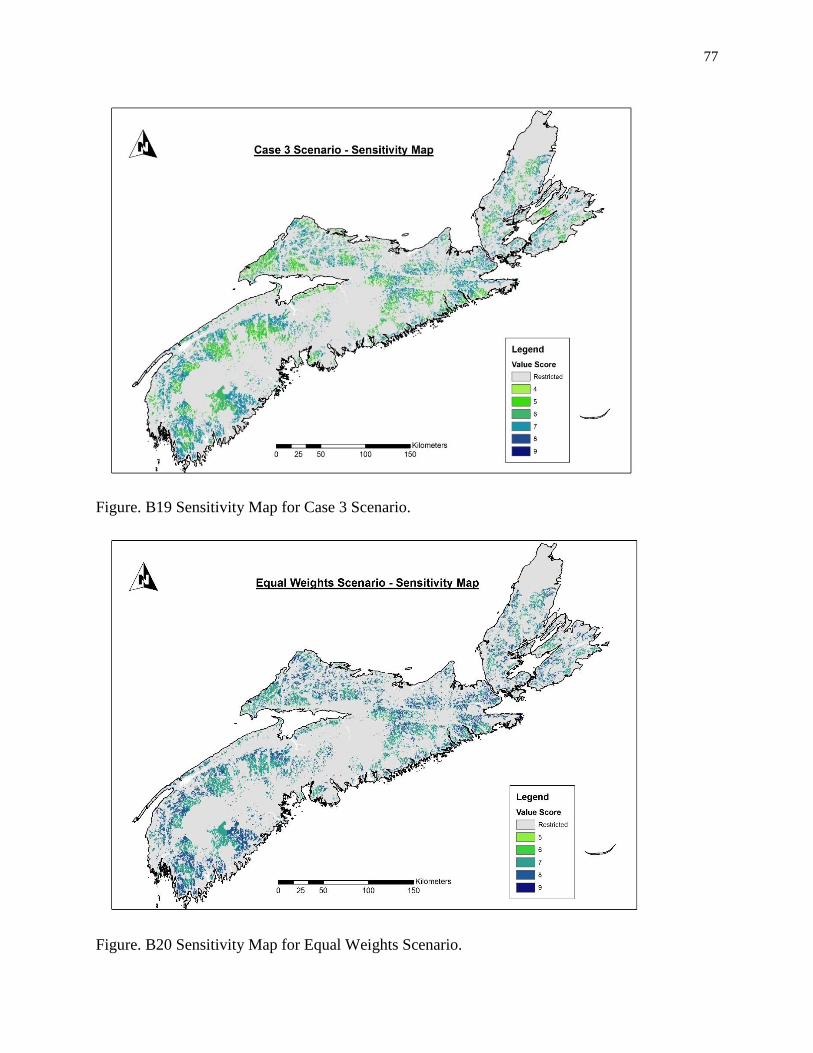
77
Figure. B19 Sensitivity Map for Case 3 Scenario.
Figure. B20 Sensitivity Map for Equal Weights Scenario.
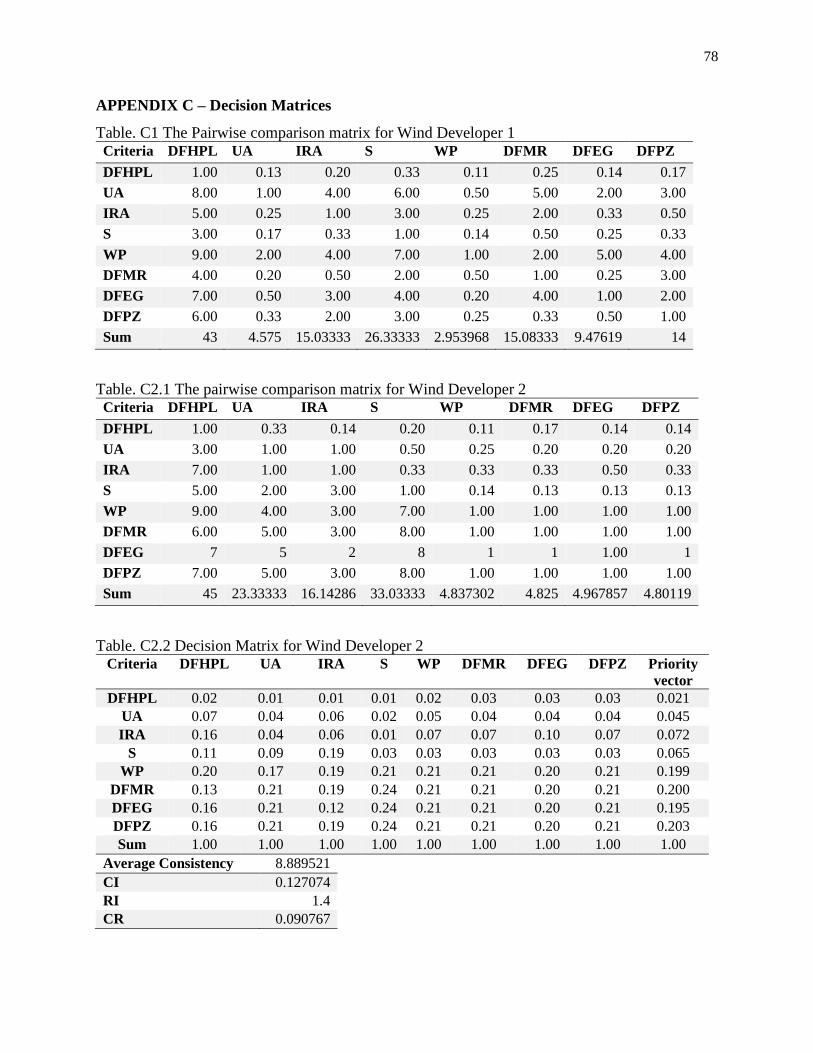
78
APPENDIX C – Decision Matrices
Table. C1 The Pairwise comparison matrix for Wind Developer 1 Criteria DFHPL UA IRA S WP DFMR DFEG DFPZ
DFHPL 1.00 0.13 0.20 0.33 0.11 0.25 0.14 0.17
UA 8.00 1.00 4.00 6.00 0.50 5.00 2.00 3.00
IRA 5.00 0.25 1.00 3.00 0.25 2.00 0.33 0.50
S 3.00 0.17 0.33 1.00 0.14 0.50 0.25 0.33
WP 9.00 2.00 4.00 7.00 1.00 2.00 5.00 4.00
DFMR 4.00 0.20 0.50 2.00 0.50 1.00 0.25 3.00
DFEG 7.00 0.50 3.00 4.00 0.20 4.00 1.00 2.00
DFPZ 6.00 0.33 2.00 3.00 0.25 0.33 0.50 1.00
Sum 43 4.575 15.03333 26.33333 2.953968 15.08333 9.47619 14
Table. C2.1 The pairwise comparison matrix for Wind Developer 2 Criteria DFHPL UA IRA S WP DFMR DFEG DFPZ
DFHPL 1.00 0.33 0.14 0.20 0.11 0.17 0.14 0.14
UA 3.00 1.00 1.00 0.50 0.25 0.20 0.20 0.20
IRA 7.00 1.00 1.00 0.33 0.33 0.33 0.50 0.33
S 5.00 2.00 3.00 1.00 0.14 0.13 0.13 0.13
WP 9.00 4.00 3.00 7.00 1.00 1.00 1.00 1.00
DFMR 6.00 5.00 3.00 8.00 1.00 1.00 1.00 1.00
DFEG 7 5 2 8 1 1 1.00 1
DFPZ 7.00 5.00 3.00 8.00 1.00 1.00 1.00 1.00
Sum 45 23.33333 16.14286 33.03333 4.837302 4.825 4.967857 4.80119
Table. C2.2 Decision Matrix for Wind Developer 2 Criteria DFHPL UA IRA S WP DFMR DFEG DFPZ Priority
vector
DFHPL 0.02 0.01 0.01 0.01 0.02 0.03 0.03 0.03 0.021
UA 0.07 0.04 0.06 0.02 0.05 0.04 0.04 0.04 0.045
IRA 0.16 0.04 0.06 0.01 0.07 0.07 0.10 0.07 0.072
S 0.11 0.09 0.19 0.03 0.03 0.03 0.03 0.03 0.065
WP 0.20 0.17 0.19 0.21 0.21 0.21 0.20 0.21 0.199
DFMR 0.13 0.21 0.19 0.24 0.21 0.21 0.20 0.21 0.200
DFEG 0.16 0.21 0.12 0.24 0.21 0.21 0.20 0.21 0.195
DFPZ 0.16 0.21 0.19 0.24 0.21 0.21 0.20 0.21 0.203
Sum 1.00 1.00 1.00 1.00 1.00 1.00 1.00 1.00 1.00
Average Consistency 8.889521
CI 0.127074
RI 1.4
CR 0.090767
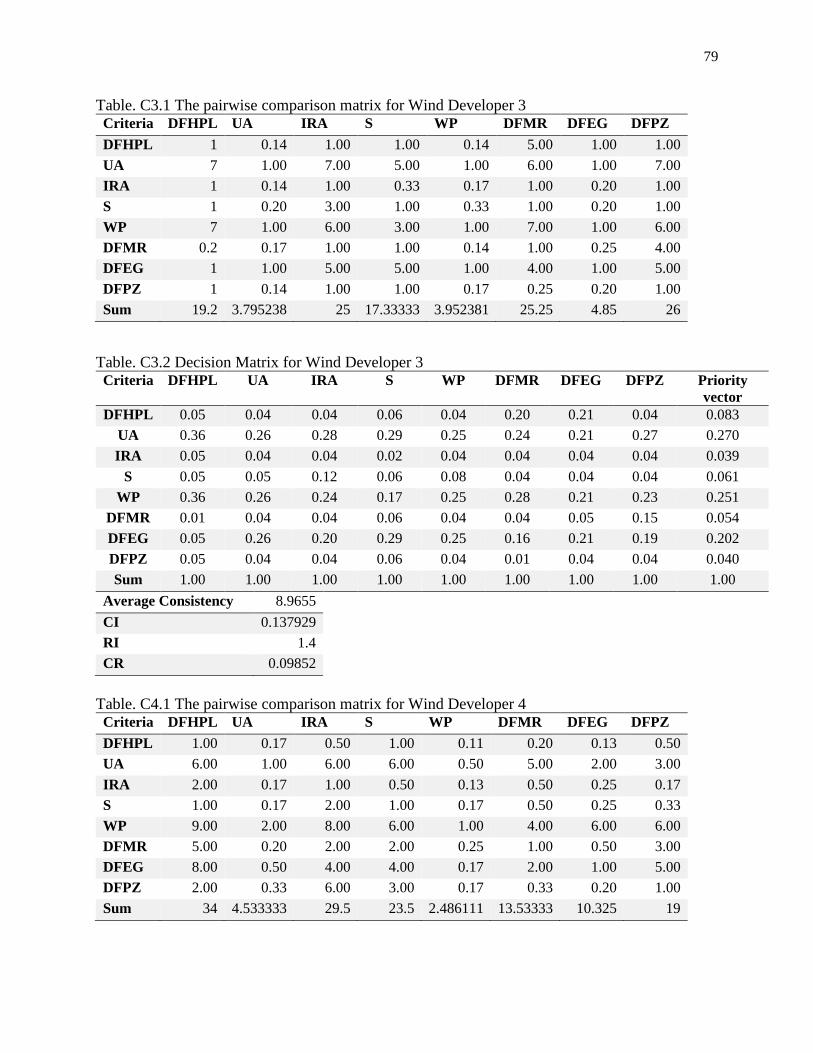
79
Table. C3.1 The pairwise comparison matrix for Wind Developer 3 Criteria DFHPL UA IRA S WP DFMR DFEG DFPZ
DFHPL 1 0.14 1.00 1.00 0.14 5.00 1.00 1.00
UA 7 1.00 7.00 5.00 1.00 6.00 1.00 7.00
IRA 1 0.14 1.00 0.33 0.17 1.00 0.20 1.00
S 1 0.20 3.00 1.00 0.33 1.00 0.20 1.00
WP 7 1.00 6.00 3.00 1.00 7.00 1.00 6.00
DFMR 0.2 0.17 1.00 1.00 0.14 1.00 0.25 4.00
DFEG 1 1.00 5.00 5.00 1.00 4.00 1.00 5.00
DFPZ 1 0.14 1.00 1.00 0.17 0.25 0.20 1.00
Sum 19.2 3.795238 25 17.33333 3.952381 25.25 4.85 26
Table. C3.2 Decision Matrix for Wind Developer 3 Criteria DFHPL UA IRA S WP DFMR DFEG DFPZ Priority
vector
DFHPL 0.05 0.04 0.04 0.06 0.04 0.20 0.21 0.04 0.083
UA 0.36 0.26 0.28 0.29 0.25 0.24 0.21 0.27 0.270
IRA 0.05 0.04 0.04 0.02 0.04 0.04 0.04 0.04 0.039
S 0.05 0.05 0.12 0.06 0.08 0.04 0.04 0.04 0.061
WP 0.36 0.26 0.24 0.17 0.25 0.28 0.21 0.23 0.251
DFMR 0.01 0.04 0.04 0.06 0.04 0.04 0.05 0.15 0.054
DFEG 0.05 0.26 0.20 0.29 0.25 0.16 0.21 0.19 0.202
DFPZ 0.05 0.04 0.04 0.06 0.04 0.01 0.04 0.04 0.040
Sum 1.00 1.00 1.00 1.00 1.00 1.00 1.00 1.00 1.00
Average Consistency 8.9655
CI 0.137929
RI 1.4
CR 0.09852
Table. C4.1 The pairwise comparison matrix for Wind Developer 4 Criteria DFHPL UA IRA S WP DFMR DFEG DFPZ
DFHPL 1.00 0.17 0.50 1.00 0.11 0.20 0.13 0.50
UA 6.00 1.00 6.00 6.00 0.50 5.00 2.00 3.00
IRA 2.00 0.17 1.00 0.50 0.13 0.50 0.25 0.17
S 1.00 0.17 2.00 1.00 0.17 0.50 0.25 0.33
WP 9.00 2.00 8.00 6.00 1.00 4.00 6.00 6.00
DFMR 5.00 0.20 2.00 2.00 0.25 1.00 0.50 3.00
DFEG 8.00 0.50 4.00 4.00 0.17 2.00 1.00 5.00
DFPZ 2.00 0.33 6.00 3.00 0.17 0.33 0.20 1.00
Sum 34 4.533333 29.5 23.5 2.486111 13.53333 10.325 19
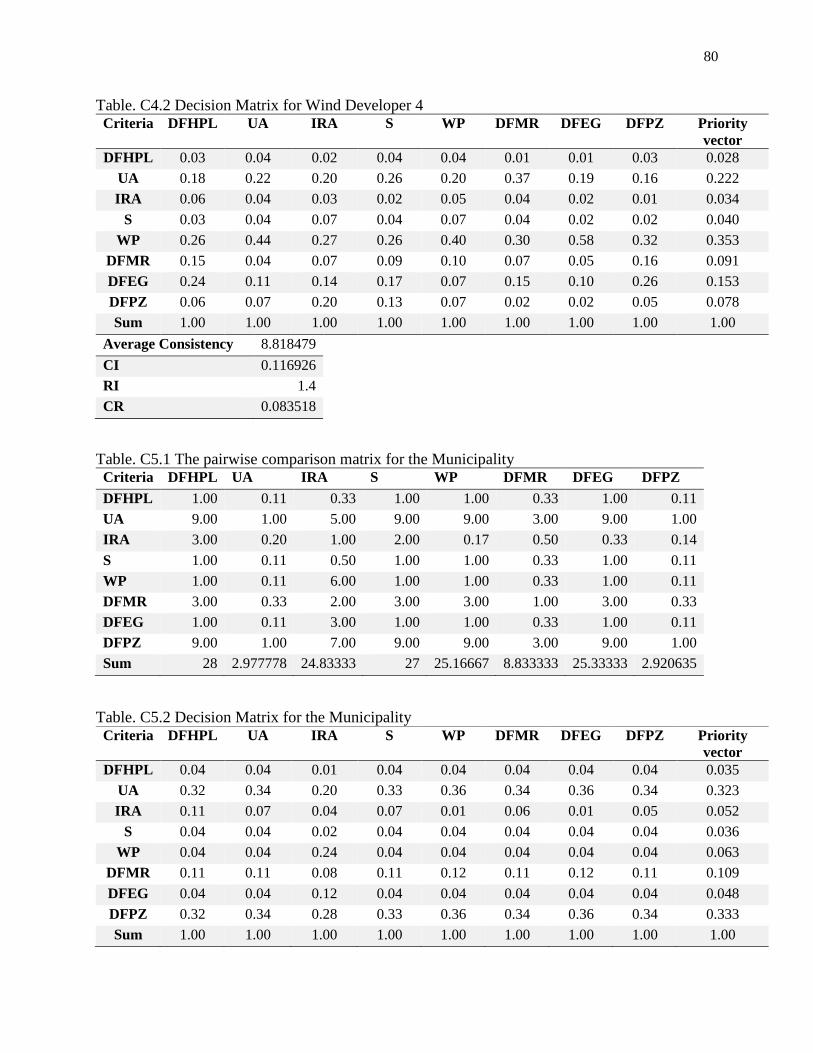
80
Table. C4.2 Decision Matrix for Wind Developer 4 Criteria DFHPL UA IRA S WP DFMR DFEG DFPZ Priority
vector
DFHPL 0.03 0.04 0.02 0.04 0.04 0.01 0.01 0.03 0.028
UA 0.18 0.22 0.20 0.26 0.20 0.37 0.19 0.16 0.222
IRA 0.06 0.04 0.03 0.02 0.05 0.04 0.02 0.01 0.034
S 0.03 0.04 0.07 0.04 0.07 0.04 0.02 0.02 0.040
WP 0.26 0.44 0.27 0.26 0.40 0.30 0.58 0.32 0.353
DFMR 0.15 0.04 0.07 0.09 0.10 0.07 0.05 0.16 0.091
DFEG 0.24 0.11 0.14 0.17 0.07 0.15 0.10 0.26 0.153
DFPZ 0.06 0.07 0.20 0.13 0.07 0.02 0.02 0.05 0.078
Sum 1.00 1.00 1.00 1.00 1.00 1.00 1.00 1.00 1.00
Average Consistency 8.818479
CI 0.116926
RI 1.4
CR 0.083518
Table. C5.1 The pairwise comparison matrix for the Municipality Criteria DFHPL UA IRA S WP DFMR DFEG DFPZ
DFHPL 1.00 0.11 0.33 1.00 1.00 0.33 1.00 0.11
UA 9.00 1.00 5.00 9.00 9.00 3.00 9.00 1.00
IRA 3.00 0.20 1.00 2.00 0.17 0.50 0.33 0.14
S 1.00 0.11 0.50 1.00 1.00 0.33 1.00 0.11
WP 1.00 0.11 6.00 1.00 1.00 0.33 1.00 0.11
DFMR 3.00 0.33 2.00 3.00 3.00 1.00 3.00 0.33
DFEG 1.00 0.11 3.00 1.00 1.00 0.33 1.00 0.11
DFPZ 9.00 1.00 7.00 9.00 9.00 3.00 9.00 1.00
Sum 28 2.977778 24.83333 27 25.16667 8.833333 25.33333 2.920635
Table. C5.2 Decision Matrix for the Municipality Criteria DFHPL UA IRA S WP DFMR DFEG DFPZ Priority
vector
DFHPL 0.04 0.04 0.01 0.04 0.04 0.04 0.04 0.04 0.035
UA 0.32 0.34 0.20 0.33 0.36 0.34 0.36 0.34 0.323
IRA 0.11 0.07 0.04 0.07 0.01 0.06 0.01 0.05 0.052
S 0.04 0.04 0.02 0.04 0.04 0.04 0.04 0.04 0.036
WP 0.04 0.04 0.24 0.04 0.04 0.04 0.04 0.04 0.063
DFMR 0.11 0.11 0.08 0.11 0.12 0.11 0.12 0.11 0.109
DFEG 0.04 0.04 0.12 0.04 0.04 0.04 0.04 0.04 0.048
DFPZ 0.32 0.34 0.28 0.33 0.36 0.34 0.36 0.34 0.333
Sum 1.00 1.00 1.00 1.00 1.00 1.00 1.00 1.00 1.00
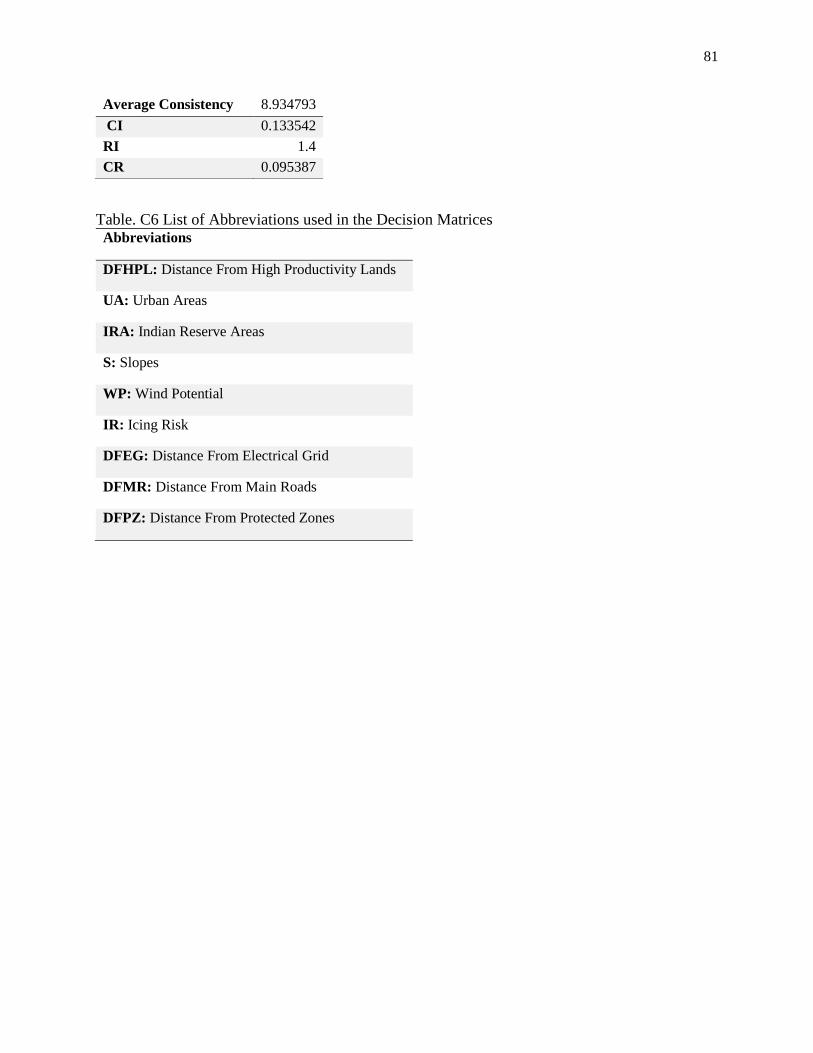
81
Table. C6 List of Abbreviations used in the Decision Matrices Abbreviations
DFHPL: Distance From High Productivity Lands
UA: Urban Areas
IRA: Indian Reserve Areas
S: Slopes
WP: Wind Potential
IR: Icing Risk
DFEG: Distance From Electrical Grid
DFMR: Distance From Main Roads
DFPZ: Distance From Protected Zones
Average Consistency 8.934793
CI 0.133542
RI 1.4
CR 0.095387
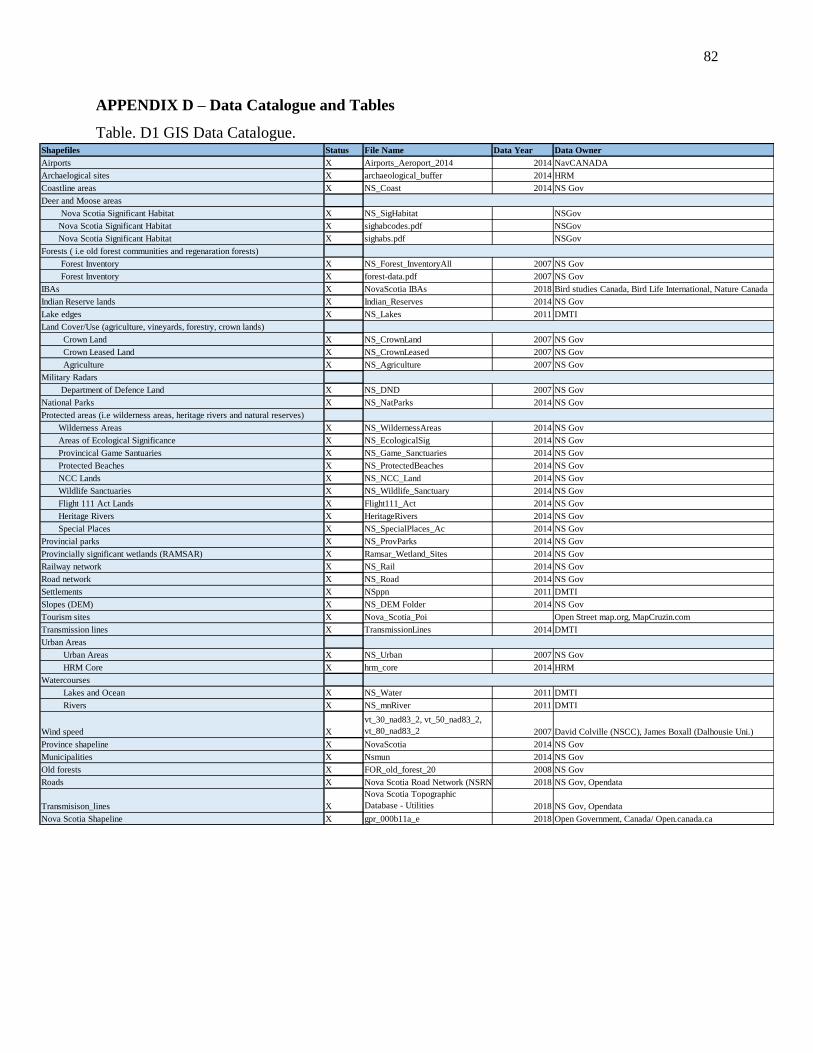
82
APPENDIX D – Data Catalogue and Tables
Table. D1 GIS Data Catalogue.
Shapefiles Status File Name Data Year Data Owner
Airports X Airports_Aeroport_2014 2014 NavCANADA
Archaelogical sites X archaeological_buffer 2014 HRM
Coastline areas X NS_Coast 2014 NS Gov
Deer and Moose areas
Nova Scotia Significant Habitat X NS_SigHabitat NSGov
Nova Scotia Significant Habitat X sighabcodes.pdf NSGov
Nova Scotia Significant Habitat X sighabs.pdf NSGov
Forests ( i.e old forest communities and regenaration forests)
Forest Inventory X NS_Forest_InventoryAll 2007 NS Gov
Forest Inventory X forest-data.pdf 2007 NS Gov
IBAs X NovaScotia IBAs 2018 Bird studies Canada, Bird Life International, Nature Canada
Indian Reserve lands X Indian_Reserves 2014 NS Gov
Lake edges X NS_Lakes 2011 DMTI
Land Cover/Use (agriculture, vineyards, forestry, crown lands)
Crown Land X NS_CrownLand 2007 NS Gov
Crown Leased Land X NS_CrownLeased 2007 NS Gov
Agriculture X NS_Agriculture 2007 NS Gov
Military Radars
Department of Defence Land X NS_DND 2007 NS Gov
National Parks X NS_NatParks 2014 NS Gov
Protected areas (i.e wilderness areas, heritage rivers and natural reserves)
Wilderness Areas X NS_WildernessAreas 2014 NS Gov
Areas of Ecological Significance X NS_EcologicalSig 2014 NS Gov
Provincical Game Santuaries X NS_Game_Sanctuaries 2014 NS Gov
Protected Beaches X NS_ProtectedBeaches 2014 NS Gov
NCC Lands X NS_NCC_Land 2014 NS Gov
Wildlife Sanctuaries X NS_Wildlife_Sanctuary 2014 NS Gov
Flight 111 Act Lands X Flight111_Act 2014 NS Gov
Heritage Rivers X HeritageRivers 2014 NS Gov
Special Places X NS_SpecialPlaces_Ac 2014 NS Gov
Provincial parks X NS_ProvParks 2014 NS Gov
Provincially significant wetlands (RAMSAR) X Ramsar_Wetland_Sites 2014 NS Gov
Railway network X NS_Rail 2014 NS Gov
Road network X NS_Road 2014 NS Gov
Settlements X NSppn 2011 DMTI
Slopes (DEM) X NS_DEM Folder 2014 NS Gov
Tourism sites X Nova_Scotia_Poi Open Street map.org, MapCruzin.com
Transmission lines X TransmissionLines 2014 DMTI
Urban Areas
Urban Areas X NS_Urban 2007 NS Gov
HRM Core X hrm_core 2014 HRM
Watercourses
Lakes and Ocean X NS_Water 2011 DMTI
Rivers X NS_mnRiver 2011 DMTI
Wind speed X
vt_30_nad83_2, vt_50_nad83_2,
vt_80_nad83_2 2007 David Colville (NSCC), James Boxall (Dalhousie Uni.)
Province shapeline X NovaScotia 2014 NS Gov
Municipalities X Nsmun 2014 NS Gov
Old forests X FOR_old_forest_20 2008 NS Gov
Roads X Nova Scotia Road Network (NSRN) 2018 NS Gov, Opendata
Transmisison_lines X
Nova Scotia Topographic
Database - Utilities 2018 NS Gov, Opendata
Nova Scotia Shapeline X gpr_000b11a_e 2018 Open Government, Canada/ Open.canada.ca
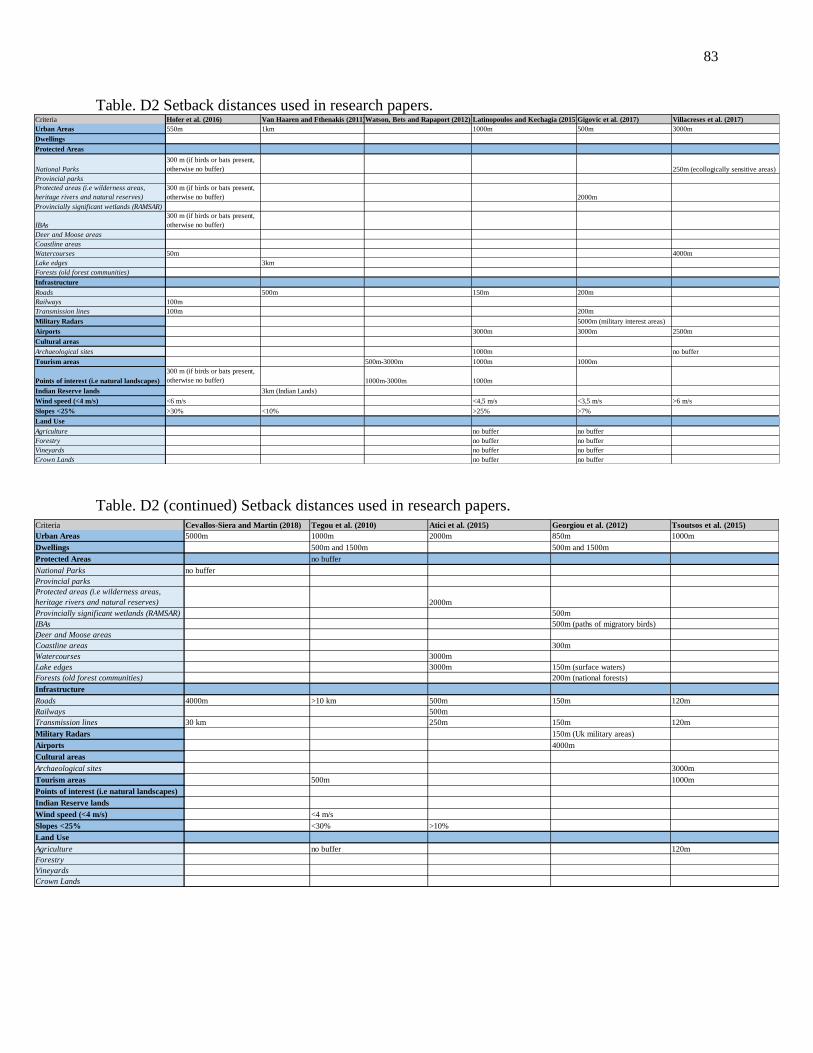
83
Table. D2 Setback distances used in research papers.
Table. D2 (continued) Setback distances used in research papers.
Criteria Hofer et al. (2016) Van Haaren and Fthenakis (2011)Watson, Bets and Rapaport (2012) Latinopoulos and Kechagia (2015)Gigovic et al. (2017) Villacreses et al. (2017)
Urban Areas 550m 1km 1000m 500m 3000m
Dwellings
Protected Areas
National Parks
300 m (if birds or bats present,
otherwise no buffer) 250m (ecollogically sensitive areas)
Provincial parks
Protected areas (i.e wilderness areas,
heritage rivers and natural reserves)
300 m (if birds or bats present,
otherwise no buffer) 2000m
Provincially significant wetlands (RAMSAR)
IBAs
300 m (if birds or bats present,
otherwise no buffer)
Deer and Moose areas
Coastline areas
Watercourses 50m 4000m
Lake edges 3km
Forests (old forest communities)
Infrastructure
Roads 500m 150m 200m
Railways 100m
Transmission lines 100m 200m
Military Radars 5000m (military interest areas)
Airports 3000m 3000m 2500m
Cultural areas
Archaeological sites 1000m no buffer
Tourism areas 500m-3000m 1000m 1000m
Points of interest (i.e natural landscapes)
300 m (if birds or bats present,
otherwise no buffer) 1000m-3000m 1000m
Indian Reserve lands 3km (Indian Lands)
Wind speed (<4 m/s) <6 m/s <4,5 m/s <3,5 m/s >6 m/s
Slopes <25% >30% <10% >25% >7%
Land Use
Agriculture no buffer no buffer
Forestry no buffer no buffer
Vineyards no buffer no buffer
Crown Lands no buffer no buffer
Criteria Cevallos-Siera and Martin (2018) Tegou et al. (2010) Atici et al. (2015) Georgiou et al. (2012) Tsoutsos et al. (2015)
Urban Areas 5000m 1000m 2000m 850m 1000m
Dwellings 500m and 1500m 500m and 1500m
Protected Areas no buffer
National Parks no buffer
Provincial parks
Protected areas (i.e wilderness areas,
heritage rivers and natural reserves) 2000m
Provincially significant wetlands (RAMSAR) 500m
IBAs 500m (paths of migratory birds)
Deer and Moose areas
Coastline areas 300m
Watercourses 3000m
Lake edges 3000m 150m (surface waters)
Forests (old forest communities) 200m (national forests)
Infrastructure
Roads 4000m >10 km 500m 150m 120m
Railways 500m
Transmission lines 30 km 250m 150m 120m
Military Radars 150m (Uk military areas)
Airports 4000m
Cultural areas
Archaeological sites 3000m
Tourism areas 500m 1000m
Points of interest (i.e natural landscapes)
Indian Reserve lands
Wind speed (<4 m/s) <4 m/s
Slopes <25% <30% >10%
Land Use
Agriculture no buffer 120m
Forestry
Vineyards
Crown Lands

84
Table. D3 Setback distances suggested by the Municipal By-Laws.
Table. D3 (continued) Setback distances suggested by the Municipal By-Laws.
Name Distance from dwellings on the same property Distance from natural gas pipeline
Distance from puclic lands without cultural
interest Distance form other wind farms Distance from dwellings
Cape Breton n/a n/a n/a n/a 175,26m + 1 foot increase for each 1 foot increase in height
Halifax n/a n/a n/a n/a 1000m
Queens n/a n/a n/a n/a n/a
Annapolis[b] n/a n/a n/a n/a 700m (HH), 1000m
Antigonish[c] n/a n/a n/a n/a 1000m
Colchester[d] n/a n/a n/a n/a 1000m
Cumberland[e] 1,25 times the height of the wind turbine 85m n/a 4x the height of the wind turbine 600m or 3 times the height of the wind turbine
Inverness[f] n/a n/a n/a n/a 600m
Kings[g] n/a n/a n/a n/a 700m
Pictou[h] n/a n/a n/a n/a 1000m
Richmond[i] n/a n/a n/a n/a 1000m
Victoria[j ] n/a n/a n/a n/a 1000m
n/a n/a n/a n/a 1000m
n/a n/a n/a n/a 285m
Barrington n/a n/a n/a n/a 1000m (also from institutional and recrational land uses)
Chester only small scale wind turbines n/a n/a n/a only small scale wind turbines
Clare n/a n/a n/a n/a n/a
Digby n/a n/a n/a n/a 1000m
East Hants n/a n/a 1,5x the heigh of the wind turbine n/a n/a
Guysborough 2x the height of the wind turbine n/a n/a n/a n/a
Lunenburg n/a n/a n/a n/a n/a
Shelburne n/a n/a n/a n/a 500m
St. Mary's n/a n/a n/a n/a n/a
West Hants n/a n/a n/a n/a n/a
Yarmouth 2x the height of the wind turbine n/a n/a n/a n/a
Results 2x the height of the wind turbine 85m 1,5 the height of the wind turbine 4x the height of the wind turbine 1000m
Argyle
Name Distance from lake edge Distance from property lines Distance from watercourse Distance from coastal lines Distance from pubic road/highway
Cape Breton n/a n/a n/a n/a n/a
Halifax n/a 1x the height of te wind turbine 20m-->60m n/a n/a
Queens n/a 1,5x the height of the wind turbine 1,5x the height of the wind turbine n/a n/a
Annapolis[b] n/a 1+1/2 the height of the wind turbine n/a n/a 2x the height of the wind turbine
Antigonish[c] n/a 1x the height of the wind turbine + 10m 60m or 2x the height of the wind turbine 100m 60m or 2x the height of the wind turbine
Colchester[d] n/a 1x the height of the wind turbine n/a n/a 1x the height of the wind turbine
Cumberland[e] n/a n/a n/a n/a 1x the height of the wind turbine + 7,5m
Inverness[f] n/a 10m+ the height of the rotor 60m 100m 60m
Kings[g] n/a 1x the height of the wind turbine n/a 1x the height of the wind turbine n/a
Pictou[h] n/a 1x the height of the wind turbine n/a n/a 300m
Richmond[i] n/a 1x the height of the wind turbine 60m or 2x the height of the wind turbine n/a 60m or 2x the height of the wind turbine
Victoria[j ] n/a 1,5x the height of the wind turbine n/a n/a n/a
n/a n/a n/a 1/2 of the rotor diameter + applicable minimum yard requirement of Part 21(9)n/a
n/a n/a n/a n/a n/a
Barrington n/a n/a n/a n/a n/a
Chester only small scale wind turbines only small scale wind turbines only small scale wind turbines only small scale wind turbines only small scale wind turbines
Clare n/a n/a n/a n/a n/a
Digby n/a 750m n/a n/a n/a
East Hants n/a 4x the height of the wind turbine n/a n/a n/a
Guysborough 100m n/a 30,48m n/a 2x the height of the wind turbine
Lunenburg n/a n/a n/a n/a n/a
Shelburne n/a 1x the height of the wind turbine 61m n/a 220m
St. Mary's n/a n/a n/a n/a n/a
West Hants n/a n/a n n/a n/a
Yarmouth n/a 4x the height of the wind turbine 60m n/a 100m+ the height of the wind turbine
Results 100m 1x the height of the wind turbine 60m or 2x the height of the wind turbine 1x the height of the wind turbine2x the height of the wind turbine
Argyle
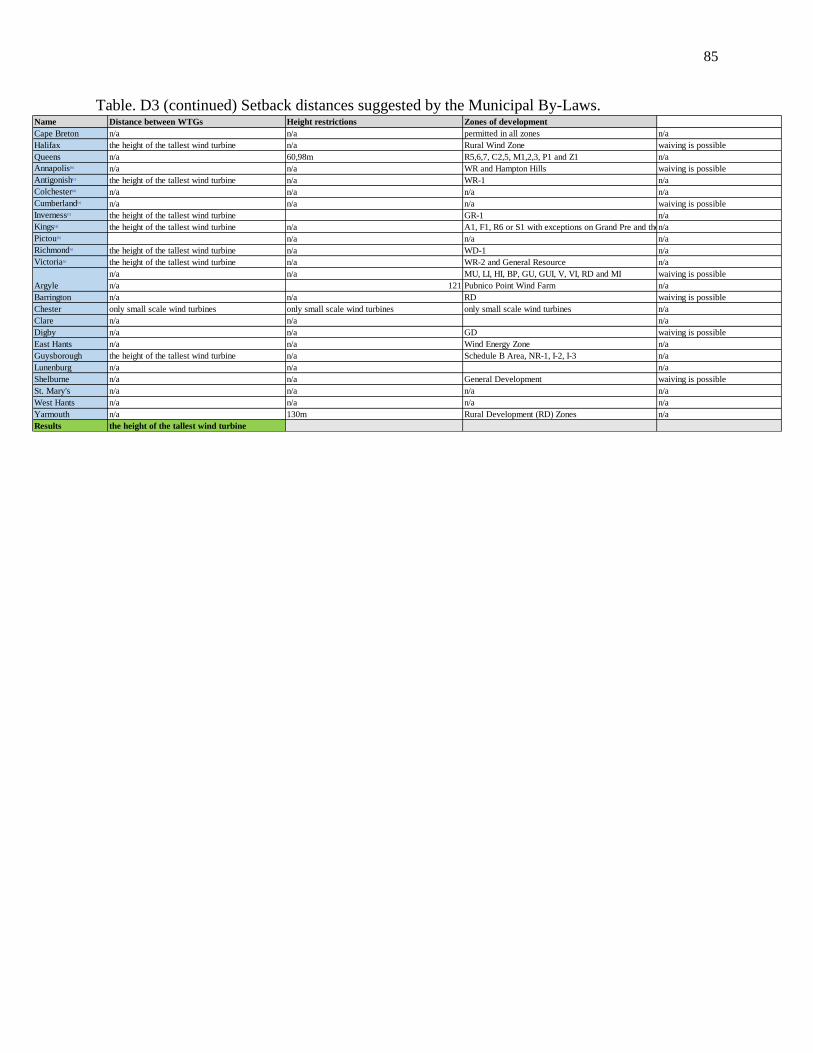
85
Table. D3 (continued) Setback distances suggested by the Municipal By-Laws.
Name Distance between WTGs Height restrictions Zones of development
Cape Breton n/a n/a permitted in all zones n/a
Halifax the height of the tallest wind turbine n/a Rural Wind Zone waiving is possible
Queens n/a 60,98m R5,6,7, C2,5, M1,2,3, P1 and Z1 n/a
Annapolis[b] n/a n/a WR and Hampton Hills waiving is possible
Antigonish[c] the height of the tallest wind turbine n/a WR-1 n/a
Colchester[d] n/a n/a n/a n/a
Cumberland[e] n/a n/a n/a waiving is possible
Inverness[f] the height of the tallest wind turbine GR-1 n/a
Kings[g] the height of the tallest wind turbine n/a A1, F1, R6 or S1 with exceptions on Grand Pre and the Aea Plan Boundaryn/a
Pictou[h] n/a n/a n/a
Richmond[i] the height of the tallest wind turbine n/a WD-1 n/a
Victoria[j ] the height of the tallest wind turbine n/a WR-2 and General Resource n/a
n/a n/a MU, LI, HI, BP, GU, GUI, V, VI, RD and MI waiving is possible
n/a 121 Pubnico Point Wind Farm n/a
Barrington n/a n/a RD waiving is possible
Chester only small scale wind turbines only small scale wind turbines only small scale wind turbines n/a
Clare n/a n/a n/a
Digby n/a n/a GD waiving is possible
East Hants n/a n/a Wind Energy Zone n/a
Guysborough the height of the tallest wind turbine n/a Schedule B Area, NR-1, I-2, I-3 n/a
Lunenburg n/a n/a n/a
Shelburne n/a n/a General Development waiving is possible
St. Mary's n/a n/a n/a n/a
West Hants n/a n/a n/a n/a
Yarmouth n/a 130m Rural Development (RD) Zones n/a
Results the height of the tallest wind turbine
Argyle
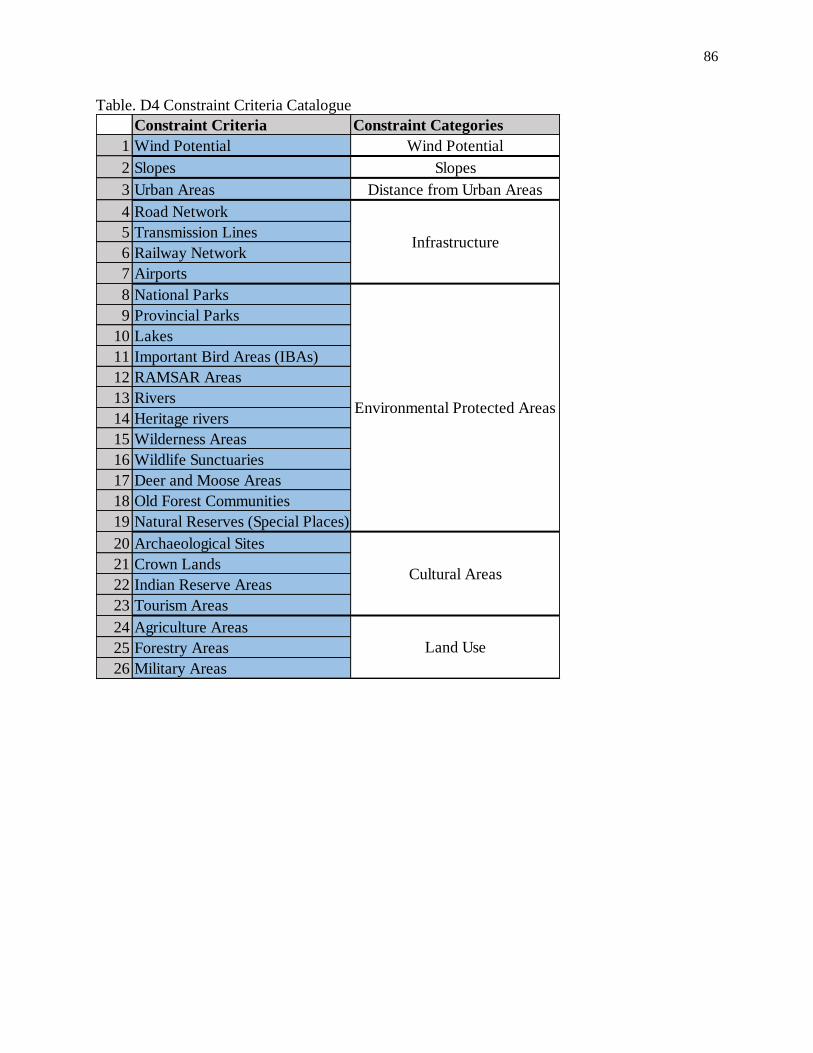
86
Table. D4 Constraint Criteria Catalogue
Constraint Criteria Constraint Categories
1 Wind Potential Wind Potential
2 Slopes Slopes
3 Urban Areas Distance from Urban Areas
4 Road Network
5 Transmission Lines
6 Railway Network
7 Airports
8 National Parks
9 Provincial Parks
10 Lakes
11 Important Bird Areas (IBAs)
12 RAMSAR Areas
13 Rivers
14 Heritage rivers
15 Wilderness Areas
16 Wildlife Sunctuaries
17 Deer and Moose Areas
18 Old Forest Communities
19 Natural Reserves (Special Places)
20 Archaeological Sites
21 Crown Lands
22 Indian Reserve Areas
23 Tourism Areas
24 Agriculture Areas
25 Forestry Areas
26 Military Areas
Infrastructure
Environmental Protected Areas
Cultural Areas
Land Use

87
APPENDIX E - Questionnaire
Questionnaire
A GIS based Multi Criteria Decision Analysis (MCDA) approach on wind
power development: the case of Nova Scotia, Canada
Date:
Name of Organization/ Company:
Question 1.
How would you describe the main area of your organization’s/company’s activity?
Question 2.
What would be your thoughts regarding the development of large scale wind farms in Nova Scotia?
Question 3.
What do you believe will be the barrier for large scale wind farm development in Nova Scotia? Do you
have any specific concerns?
Question 4.
If you had to decide, in a scale from 1 to 9, about the relative importance of the criteria below regarding
the development of a large-scale wind farm, what would your preference be? (see next page for
instructions)
Criteria DFHPL UA IRA S WP IR DFEG DFMR DFPZ
DFHPL 1
UA 1
IRA 1
S 1
WP 1
IR 1
DFEG 1
DFMR 1
DFPZ 1
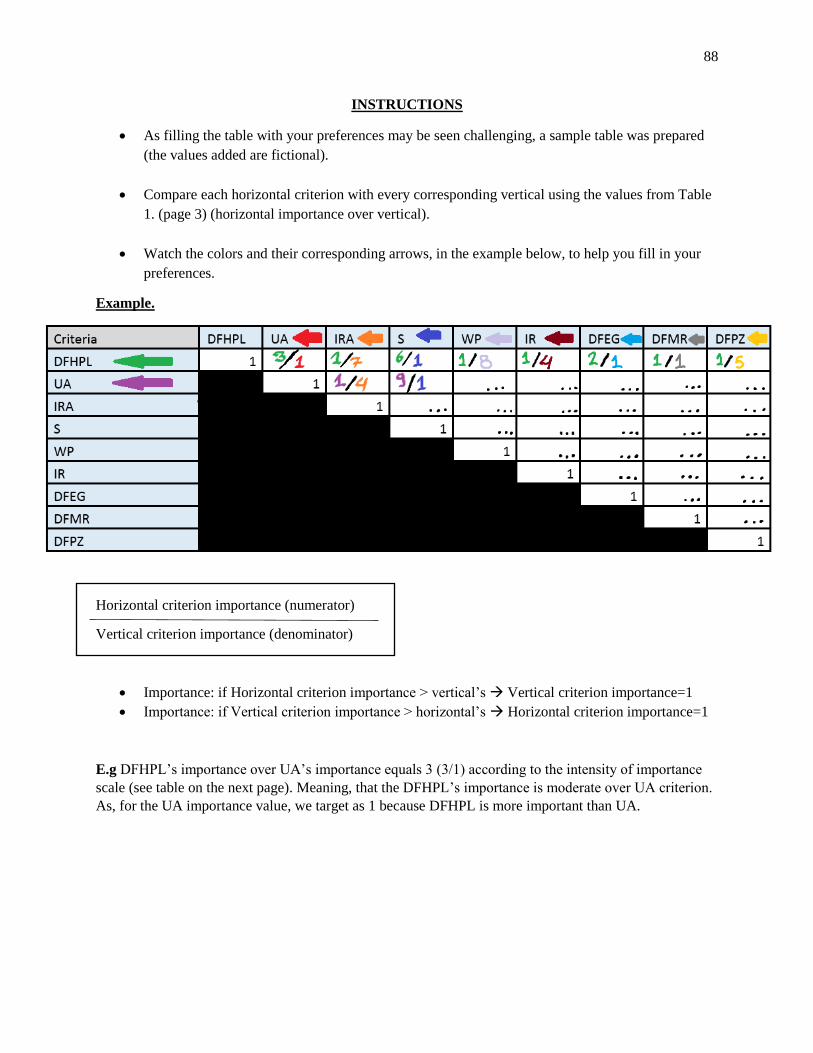
88
INSTRUCTIONS
• As filling the table with your preferences may be seen challenging, a sample table was prepared
(the values added are fictional).
• Compare each horizontal criterion with every corresponding vertical using the values from Table
1. (page 3) (horizontal importance over vertical).
• Watch the colors and their corresponding arrows, in the example below, to help you fill in your
preferences.
Example.
Horizontal criterion importance (numerator)
Vertical criterion importance (denominator)
• Importance: if Horizontal criterion importance > vertical’s → Vertical criterion importance=1
• Importance: if Vertical criterion importance > horizontal’s → Horizontal criterion importance=1
E.g DFHPL’s importance over UA’s importance equals 3 (3/1) according to the intensity of importance
scale (see table on the next page). Meaning, that the DFHPL’s importance is moderate over UA criterion.
As, for the UA importance value, we target as 1 because DFHPL is more important than UA.
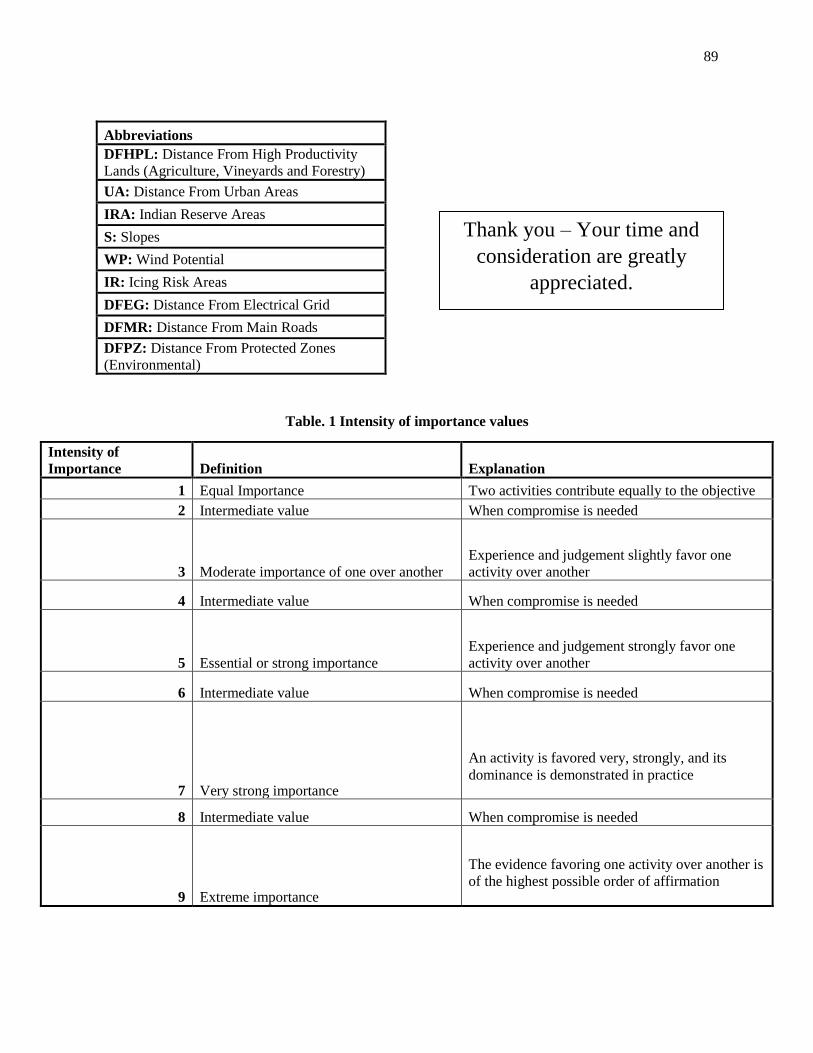
89
Table. 1 Intensity of importance values
Intensity of
Importance Definition Explanation
1 Equal Importance Two activities contribute equally to the objective
2 Intermediate value When compromise is needed
3 Moderate importance of one over another
Experience and judgement slightly favor one
activity over another
4 Intermediate value When compromise is needed
5 Essential or strong importance
Experience and judgement strongly favor one
activity over another
6 Intermediate value When compromise is needed
7 Very strong importance
An activity is favored very, strongly, and its
dominance is demonstrated in practice
8 Intermediate value When compromise is needed
9 Extreme importance
The evidence favoring one activity over another is
of the highest possible order of affirmation
Abbreviations
DFHPL: Distance From High Productivity
Lands (Agriculture, Vineyards and Forestry)
UA: Distance From Urban Areas
IRA: Indian Reserve Areas
S: Slopes
WP: Wind Potential
IR: Icing Risk Areas
DFEG: Distance From Electrical Grid
DFMR: Distance From Main Roads
DFPZ: Distance From Protected Zones
(Environmental)
Thank you – Your time and
consideration are greatly
appreciated.
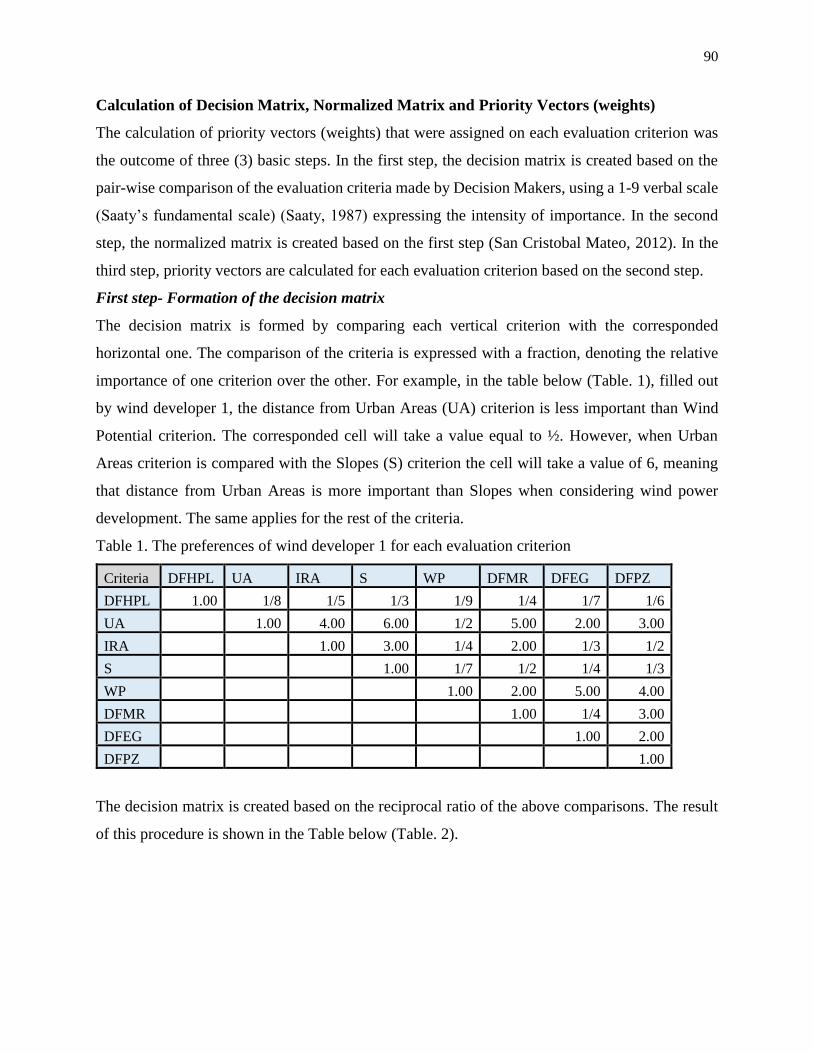
90
Calculation of Decision Matrix, Normalized Matrix and Priority Vectors (weights)
The calculation of priority vectors (weights) that were assigned on each evaluation criterion was
the outcome of three (3) basic steps. In the first step, the decision matrix is created based on the
pair-wise comparison of the evaluation criteria made by Decision Makers, using a 1-9 verbal scale
(Saaty’s fundamental scale) (Saaty, 1987) expressing the intensity of importance. In the second
step, the normalized matrix is created based on the first step (San Cristobal Mateo, 2012). In the
third step, priority vectors are calculated for each evaluation criterion based on the second step.
First step- Formation of the decision matrix
The decision matrix is formed by comparing each vertical criterion with the corresponded
horizontal one. The comparison of the criteria is expressed with a fraction, denoting the relative
importance of one criterion over the other. For example, in the table below (Table. 1), filled out
by wind developer 1, the distance from Urban Areas (UA) criterion is less important than Wind
Potential criterion. The corresponded cell will take a value equal to ½. However, when Urban
Areas criterion is compared with the Slopes (S) criterion the cell will take a value of 6, meaning
that distance from Urban Areas is more important than Slopes when considering wind power
development. The same applies for the rest of the criteria.
Table 1. The preferences of wind developer 1 for each evaluation criterion
Criteria DFHPL UA IRA S WP DFMR DFEG DFPZ
DFHPL 1.00 1/8 1/5 1/3 1/9 1/4 1/7 1/6
UA 1.00 4.00 6.00 1/2 5.00 2.00 3.00
IRA 1.00 3.00 1/4 2.00 1/3 1/2
S 1.00 1/7 1/2 1/4 1/3
WP 1.00 2.00 5.00 4.00
DFMR 1.00 1/4 3.00
DFEG 1.00 2.00
DFPZ 1.00
The decision matrix is created based on the reciprocal ratio of the above comparisons. The result
of this procedure is shown in the Table below (Table. 2).
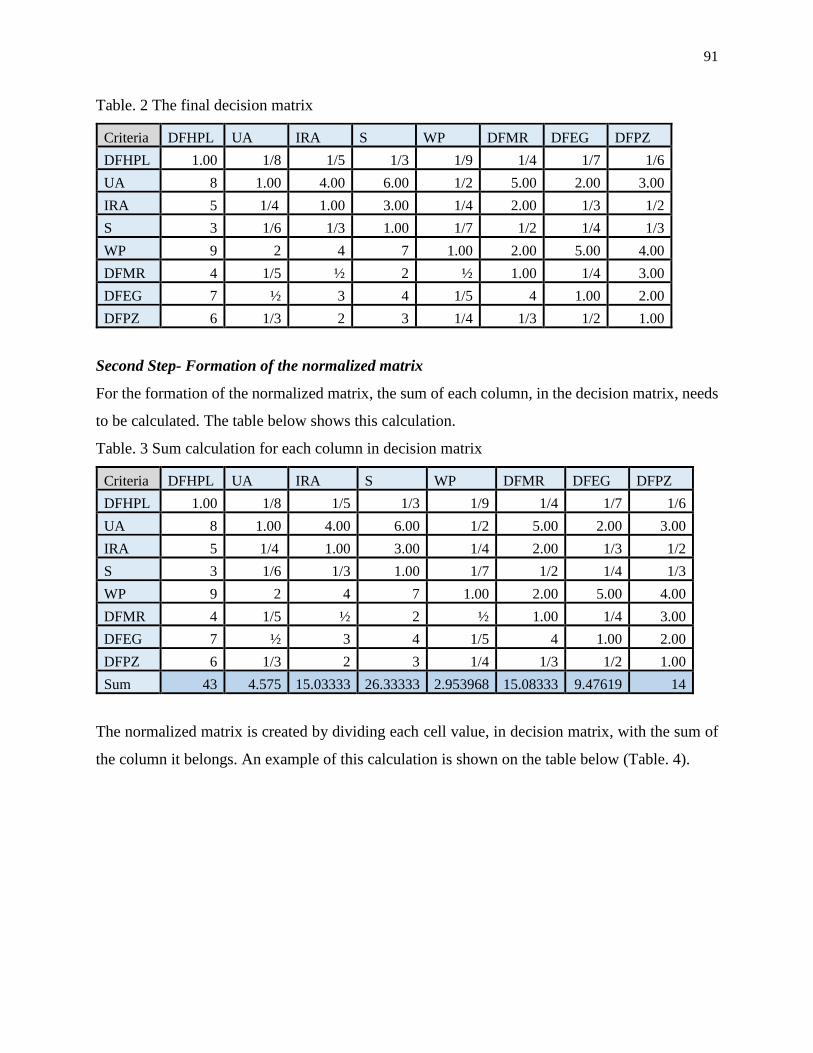
91
Table. 2 The final decision matrix
Criteria DFHPL UA IRA S WP DFMR DFEG DFPZ
DFHPL 1.00 1/8 1/5 1/3 1/9 1/4 1/7 1/6
UA 8 1.00 4.00 6.00 1/2 5.00 2.00 3.00
IRA 5 1/4 1.00 3.00 1/4 2.00 1/3 1/2
S 3 1/6 1/3 1.00 1/7 1/2 1/4 1/3
WP 9 2 4 7 1.00 2.00 5.00 4.00
DFMR 4 1/5 ½ 2 ½ 1.00 1/4 3.00
DFEG 7 ½ 3 4 1/5 4 1.00 2.00
DFPZ 6 1/3 2 3 1/4 1/3 1/2 1.00
Second Step- Formation of the normalized matrix
For the formation of the normalized matrix, the sum of each column, in the decision matrix, needs
to be calculated. The table below shows this calculation.
Table. 3 Sum calculation for each column in decision matrix
Criteria DFHPL UA IRA S WP DFMR DFEG DFPZ
DFHPL 1.00 1/8 1/5 1/3 1/9 1/4 1/7 1/6
UA 8 1.00 4.00 6.00 1/2 5.00 2.00 3.00
IRA 5 1/4 1.00 3.00 1/4 2.00 1/3 1/2
S 3 1/6 1/3 1.00 1/7 1/2 1/4 1/3
WP 9 2 4 7 1.00 2.00 5.00 4.00
DFMR 4 1/5 ½ 2 ½ 1.00 1/4 3.00
DFEG 7 ½ 3 4 1/5 4 1.00 2.00
DFPZ 6 1/3 2 3 1/4 1/3 1/2 1.00
Sum 43 4.575 15.03333 26.33333 2.953968 15.08333 9.47619 14
The normalized matrix is created by dividing each cell value, in decision matrix, with the sum of
the column it belongs. An example of this calculation is shown on the table below (Table. 4).
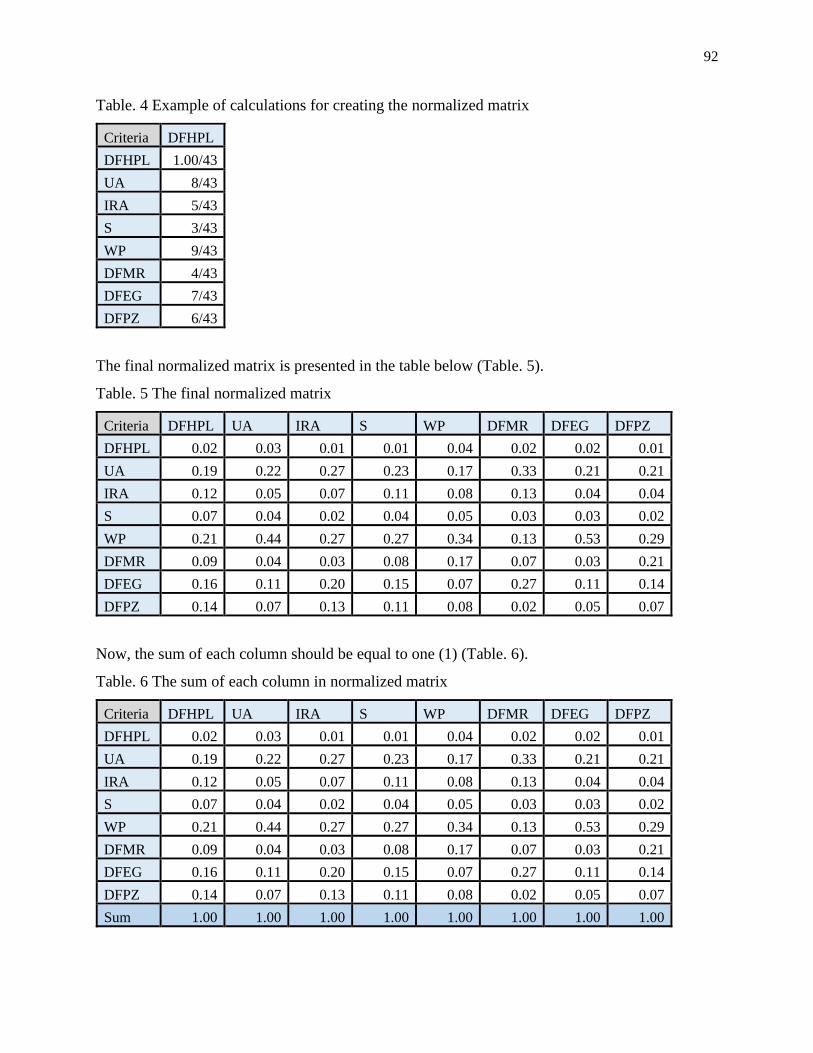
92
Table. 4 Example of calculations for creating the normalized matrix
Criteria DFHPL
DFHPL 1.00/43
UA 8/43
IRA 5/43
S 3/43
WP 9/43
DFMR 4/43
DFEG 7/43
DFPZ 6/43
The final normalized matrix is presented in the table below (Table. 5).
Table. 5 The final normalized matrix
Criteria DFHPL UA IRA S WP DFMR DFEG DFPZ
DFHPL 0.02 0.03 0.01 0.01 0.04 0.02 0.02 0.01
UA 0.19 0.22 0.27 0.23 0.17 0.33 0.21 0.21
IRA 0.12 0.05 0.07 0.11 0.08 0.13 0.04 0.04
S 0.07 0.04 0.02 0.04 0.05 0.03 0.03 0.02
WP 0.21 0.44 0.27 0.27 0.34 0.13 0.53 0.29
DFMR 0.09 0.04 0.03 0.08 0.17 0.07 0.03 0.21
DFEG 0.16 0.11 0.20 0.15 0.07 0.27 0.11 0.14
DFPZ 0.14 0.07 0.13 0.11 0.08 0.02 0.05 0.07
Now, the sum of each column should be equal to one (1) (Table. 6).
Table. 6 The sum of each column in normalized matrix
Criteria DFHPL UA IRA S WP DFMR DFEG DFPZ
DFHPL 0.02 0.03 0.01 0.01 0.04 0.02 0.02 0.01
UA 0.19 0.22 0.27 0.23 0.17 0.33 0.21 0.21
IRA 0.12 0.05 0.07 0.11 0.08 0.13 0.04 0.04
S 0.07 0.04 0.02 0.04 0.05 0.03 0.03 0.02
WP 0.21 0.44 0.27 0.27 0.34 0.13 0.53 0.29
DFMR 0.09 0.04 0.03 0.08 0.17 0.07 0.03 0.21
DFEG 0.16 0.11 0.20 0.15 0.07 0.27 0.11 0.14
DFPZ 0.14 0.07 0.13 0.11 0.08 0.02 0.05 0.07
Sum 1.00 1.00 1.00 1.00 1.00 1.00 1.00 1.00
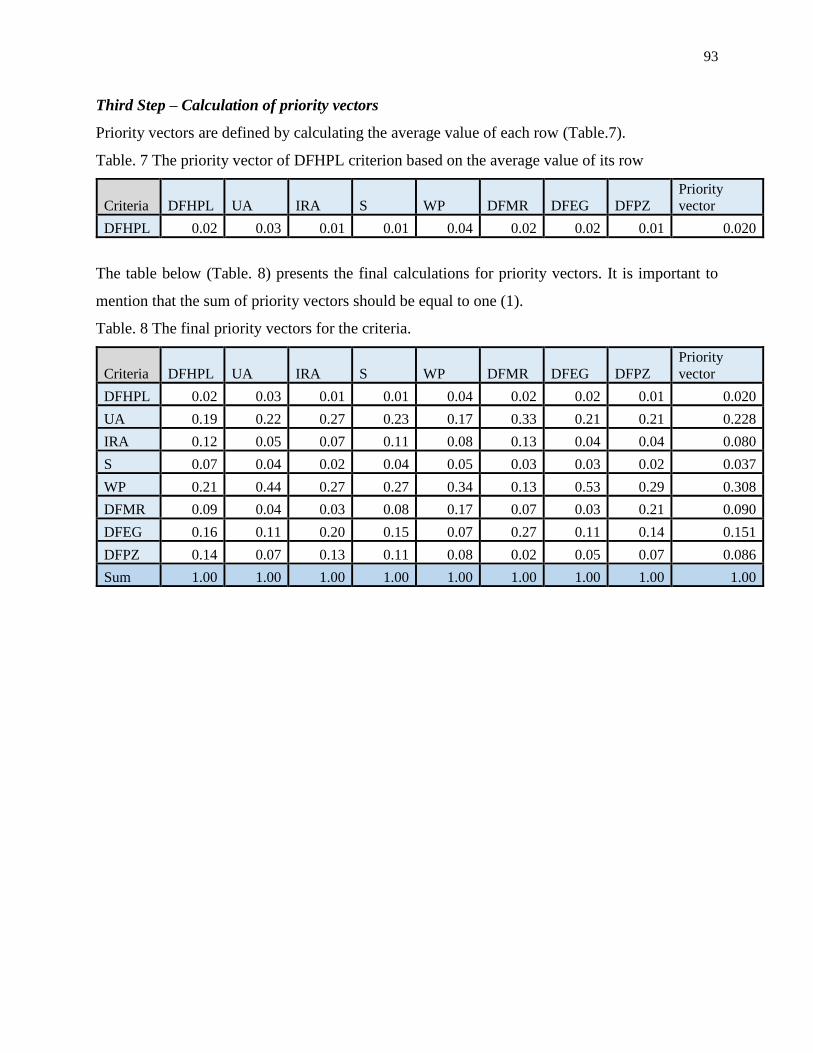
93
Third Step – Calculation of priority vectors
Priority vectors are defined by calculating the average value of each row (Table.7).
Table. 7 The priority vector of DFHPL criterion based on the average value of its row
Criteria DFHPL UA IRA S WP DFMR DFEG DFPZ
Priority
vector
DFHPL 0.02 0.03 0.01 0.01 0.04 0.02 0.02 0.01 0.020
The table below (Table. 8) presents the final calculations for priority vectors. It is important to
mention that the sum of priority vectors should be equal to one (1).
Table. 8 The final priority vectors for the criteria.
Criteria DFHPL UA IRA S WP DFMR DFEG DFPZ
Priority
vector
DFHPL 0.02 0.03 0.01 0.01 0.04 0.02 0.02 0.01 0.020
UA 0.19 0.22 0.27 0.23 0.17 0.33 0.21 0.21 0.228
IRA 0.12 0.05 0.07 0.11 0.08 0.13 0.04 0.04 0.080
S 0.07 0.04 0.02 0.04 0.05 0.03 0.03 0.02 0.037
WP 0.21 0.44 0.27 0.27 0.34 0.13 0.53 0.29 0.308
DFMR 0.09 0.04 0.03 0.08 0.17 0.07 0.03 0.21 0.090
DFEG 0.16 0.11 0.20 0.15 0.07 0.27 0.11 0.14 0.151
DFPZ 0.14 0.07 0.13 0.11 0.08 0.02 0.05 0.07 0.086
Sum 1.00 1.00 1.00 1.00 1.00 1.00 1.00 1.00 1.00