Embed Size (px)
Citation preview

ERDC/CHL CHETN-IV-73 September 2008
A GIS Based Tool for Extracting
Shoreline Positions from Aerial Imagery (BeachTools) Revised
by Gary A. Zarillo, Justin Kelley, and Vickie Larson
PURPOSE: This Coastal and Hydraulics Engineering Technical Note (CHETN) presents BeachTools, an ArcViewTM 9.1 Geographic Information System (GIS) extension designed to identify and quantitatively establish the position of shorelines and other coastal features from aerial imagery. This CHETN is a revision of the original BeachTools extension produced in ArcView 3.2 (Hoeke et al. 2001). BACKGROUND: Aerial imagery in the form of digitized aerial photography is commonly analyzed to qualitatively and quantitatively study the evolution of coastal inlets and adjacent beach and estuary geomorphology. Methodologies for calculating sediment budgets and analyzing inlet-ebb shoal evolution using data derived from aerial photography can be found in CETN-IV-15 (Rosati and Kraus 1999) and CETN-IV-13 (Stauble 1998), respectively. BeachTools is designed to facilitate such studies by providing a suite of tools that allows for the automatic delineation of coastal features and the generation of baselines and transects, removing the tedium and subjectivity of extracting data by hand and allowing for greater precision of such measurements. Capabilities of BeachTools presently include the following:
• Clipping and mosaicking imagery. • Image histogram stretching. • Automatic delineation of shoreline features, including a suite of editing tools. • Calculation of aerial extents of coastal features. • Tools for baseline and transect generation of text files containing transect measurements
for export to other software for calculating shoreline changes. The extension was originally developed (Hoeke et al. 2001) as a tool for studying historical shoreline change from aerial photography, specifically, to automatically map the wet-dry line and the vegetation line of the beach (Figure 1) and to generate transects from a common baseline to these features. The following sections follow recommended procedures for extracting shoreline measurements from aerial photo sets. The vegetation line is an indicator of long-term shoreline position. CETN-IV-15 (Rosati and Kraus 1999) discusses the interpretation of shoreline-position data and various definitions of shoreline position for coastal engineering analysis. The definition of the shoreline must be made explicit and accounted for if shoreline-position data derived through different methods are to be compared. Most previous studies have only identified the wet-dry line as an estimation of the

Report Documentation Page Form ApprovedOMB No. 0704-0188
Public reporting burden for the collection of information is estimated to average 1 hour per response, including the time for reviewing instructions, searching existing data sources, gathering andmaintaining the data needed, and completing and reviewing the collection of information. Send comments regarding this burden estimate or any other aspect of this collection of information,including suggestions for reducing this burden, to Washington Headquarters Services, Directorate for Information Operations and Reports, 1215 Jefferson Davis Highway, Suite 1204, ArlingtonVA 22202-4302. Respondents should be aware that notwithstanding any other provision of law, no person shall be subject to a penalty for failing to comply with a collection of information if itdoes not display a currently valid OMB control number.
1. REPORT DATE SEP 2008 2. REPORT TYPE
3. DATES COVERED 00-00-2008 to 00-00-2008
4. TITLE AND SUBTITLE A GIS Based Tool for Extracting Shoreline Positions from AerialImagery (BeachTools) Revised
5a. CONTRACT NUMBER
5b. GRANT NUMBER
5c. PROGRAM ELEMENT NUMBER
6. AUTHOR(S) 5d. PROJECT NUMBER
5e. TASK NUMBER
5f. WORK UNIT NUMBER
7. PERFORMING ORGANIZATION NAME(S) AND ADDRESS(ES) U.S. Army Engineer Research and Development Center,EnvironmentalLaboratory and Coastal and Hydraulics Laboratory,3909 Halls Ferry Road,Vicksburg,MS,39180-6199
8. PERFORMING ORGANIZATIONREPORT NUMBER
9. SPONSORING/MONITORING AGENCY NAME(S) AND ADDRESS(ES) 10. SPONSOR/MONITOR’S ACRONYM(S)
11. SPONSOR/MONITOR’S REPORT NUMBER(S)
12. DISTRIBUTION/AVAILABILITY STATEMENT Approved for public release; distribution unlimited
13. SUPPLEMENTARY NOTES
14. ABSTRACT
15. SUBJECT TERMS
16. SECURITY CLASSIFICATION OF: 17. LIMITATION OF ABSTRACT Same as
Report (SAR)
18. NUMBEROF PAGES
14
19a. NAME OFRESPONSIBLE PERSON
a. REPORT unclassified
b. ABSTRACT unclassified
c. THIS PAGE unclassified
Standard Form 298 (Rev. 8-98) Prescribed by ANSI Std Z39-18

ERDC/CHL CHETN-IV-73 September 2008
2
Figure 1. Example of vegetation line and wet/dry line
delineated by a vector polygon.
low tide terrace (Dolan et al. 1980; Smith and Zarillo 1990). Not only does the vegetation line provide an estimate of the position of the toe of the dune, it may be a less variable indicator of long-term shoreline change. Because the response of the vegetation line to erosion or accretion is on the order of months to years, rather than the higher frequency changes of the wet-dry lines, it can act as a low-pass frequency (short-period) filter, making longer term trends in shoreline position more apparent. In a case study at Sebastian Inlet, FL, the standard deviation of the elevation of the vegetation line, determined by finding the intersection points with concurrent beach profiles on five separate surveys, was found to be less than half the standard deviation of the wet-dry line elevation, 1.6 ft and 3.35 ft (0.5 m and 1 m), respectively. Additionally, the simultaneous estimation of the position of the low-tide terrace and the toe of the dune can be extrapolated to other measurements, such as mean beach width and mean beach slope. Although BeachTools was developed for extracting shoreline measurements, it is not restricted to measuring linear features. The method presented in the following sections simply serves to familiarize the user with its functions. The generation of vector polygons from imagery has a variety of other applications, including the automated mapping of barrier spits and inlet flood and ebb shoals. The calculation of aerial extents (area) has been included to facilitate the measurement and extrapolation to sediment volumes of these features.

ERDC/CHL CHETN-IV-73 September 2008
3
OVERVIEW Installing BeachTools and Analysis Methods: ArcView 9.1 is a geographic information system (GIS) data visualization, query, and map creation solution designed for the Windows desktop environment. It is based on the same architectural technology on which the other ArcGIS Desktop products are based. ArcView 9.1 consists of three applications:
• ArcMap – The application for map making and analysis. • ArcCatalog – A tool for accessing and managing data. • ArcToolbox – The geoprocessing environment for data management, conversion, and
analysis. Installing BeachTools: Refer to ArcView help for details on loading extensions. BeachTools is dependent on the ArcView Image Analysis extension and, therefore, Image Analysis for ArcView 9.1 must already be installed. Loading the BeachTools extensions adds the menus and buttons (shown in Figure 2) to ArcView data frame documents.
Figure 2. Menu and buttons added on loading
BeachTools extension.
To install the BeachTools toolbar, you must activate the BeachTools Library file named BeachTools.dll. To install the library file, place BeachTools.dll in a convenient directory and open an existing or blank ArcMap application. On the main ArcMap menu, click on the Tools menu and (under Tools) click on the Customize submenu. Once in “Customize,” the “Add from file” menu can be used to locate the BeachTools Library file. When the BeachTools Library is activated, the list of BeachTools functions (Objects) will appear. Click “OK” at this point, and BeachTools will be in the list of toolbars ready to be activated. Once this is complete, the BeachTools menu will appear in the view. In summary, the sequence is “ArcMAp” > “Customize” > “Add from file” > open BeachTools > close.
ERDC/CHL CHETN-IV-73 September 2008
4
Suggested Steps for Shoreline Analysis: Although BeachTools can manipulate data imported from other sources and perform functions other than shoreline analysis, the following procedure to map vegetation and wet/dry lines is recommended, especially for the user not familiar with the ArcView environment:
a. Rectify (georeference) imagery using the ArcView Georeferencing toolbar.
b. Subset (clip) imagery using the Subset Aerial Image, so that adjoining images “fit” together well without large differences in shoreline position on the edges of the adjoining images. (Do not mosaic!)
c. Apply Toggle Image Legend to better discriminate the position of the vegetation line and wet/dry lines through histogram stretching of pixel values.
d. Create polygons representing the beach from the vegetation line to the wet/dry line using the Shoreline Polygon Tools. Union (merge) adjoining or overlapping polygons.
e. Define a baseline and a transect spacing in Baseline Transect Properties.
f. Generate transects for the baseline-normal position of the wet-dry line and the vegetation line using Generate Transects.
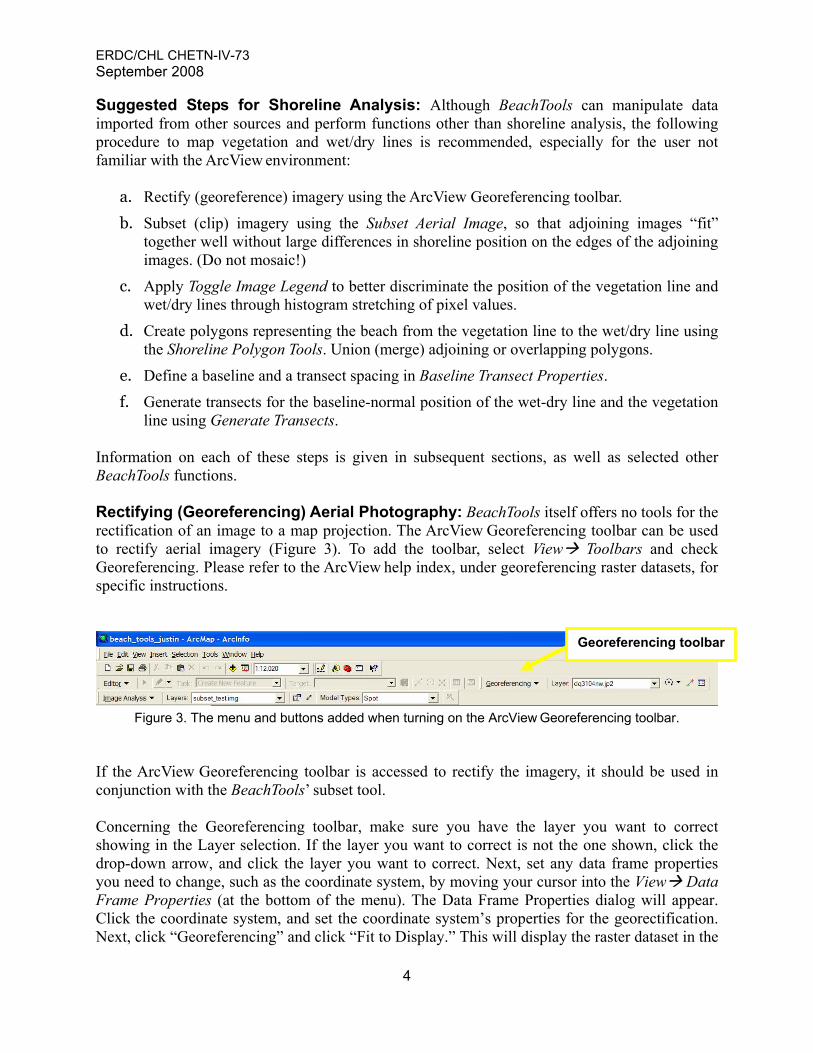
Information on each of these steps is given in subsequent sections, as well as selected other BeachTools functions. Rectifying (Georeferencing) Aerial Photography: BeachTools itself offers no tools for the rectification of an image to a map projection. The ArcView Georeferencing toolbar can be used to rectify aerial imagery (Figure 3). To add the toolbar, select View Toolbars and check Georeferencing. Please refer to the ArcView help index, under georeferencing raster datasets, for specific instructions.
Figure 3. The menu and buttons added when turning on the ArcView Georeferencing toolbar.
If the ArcView Georeferencing toolbar is accessed to rectify the imagery, it should be used in conjunction with the BeachTools’ subset tool. Concerning the Georeferencing toolbar, make sure you have the layer you want to correct showing in the Layer selection. If the layer you want to correct is not the one shown, click the drop-down arrow, and click the layer you want to correct. Next, set any data frame properties you need to change, such as the coordinate system, by moving your cursor into the View Data Frame Properties (at the bottom of the menu). The Data Frame Properties dialog will appear. Click the coordinate system, and set the coordinate system’s properties for the georectification. Next, click “Georeferencing” and click “Fit to Display.” This will display the raster dataset in the
Georeferencing toolbar
ERDC/CHL CHETN-IV-73 September 2008
5
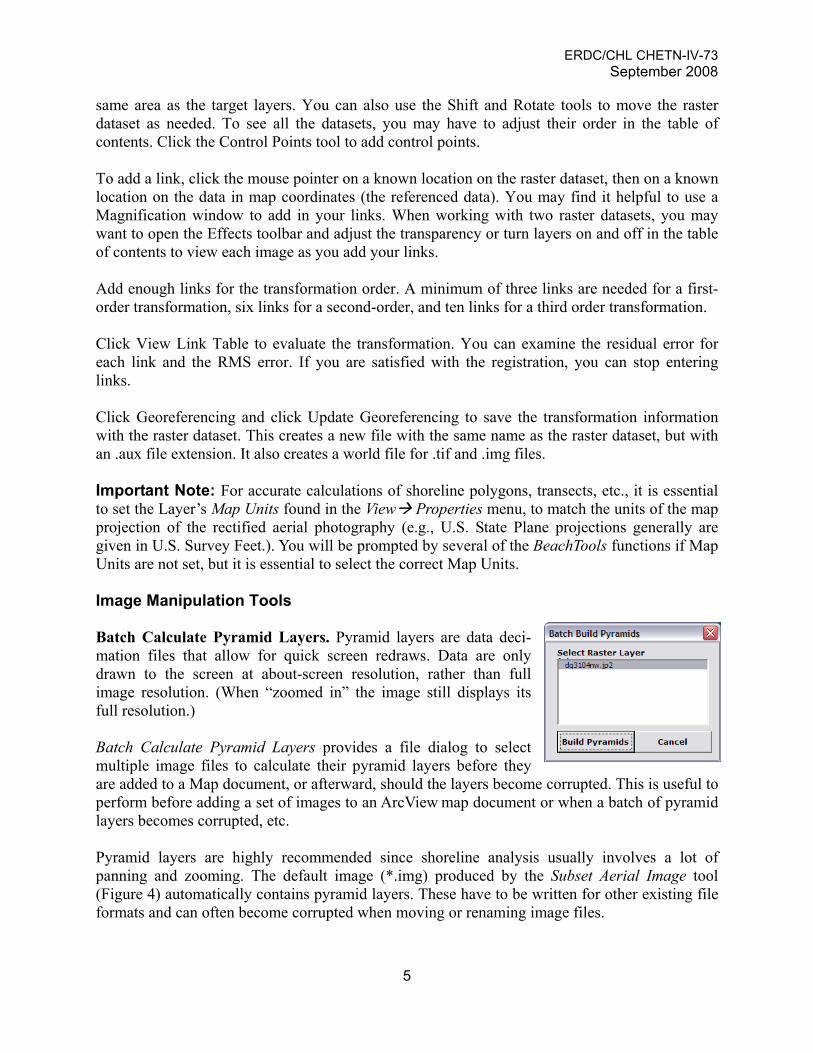
same area as the target layers. You can also use the Shift and Rotate tools to move the raster dataset as needed. To see all the datasets, you may have to adjust their order in the table of contents. Click the Control Points tool to add control points. To add a link, click the mouse pointer on a known location on the raster dataset, then on a known location on the data in map coordinates (the referenced data). You may find it helpful to use a Magnification window to add in your links. When working with two raster datasets, you may want to open the Effects toolbar and adjust the transparency or turn layers on and off in the table of contents to view each image as you add your links. Add enough links for the transformation order. A minimum of three links are needed for a first-order transformation, six links for a second-order, and ten links for a third order transformation. Click View Link Table to evaluate the transformation. You can examine the residual error for each link and the RMS error. If you are satisfied with the registration, you can stop entering links. Click Georeferencing and click Update Georeferencing to save the transformation information with the raster dataset. This creates a new file with the same name as the raster dataset, but with an .aux file extension. It also creates a world file for .tif and .img files. Important Note: For accurate calculations of shoreline polygons, transects, etc., it is essential to set the Layer’s Map Units found in the View Properties menu, to match the units of the map projection of the rectified aerial photography (e.g., U.S. State Plane projections generally are given in U.S. Survey Feet.). You will be prompted by several of the BeachTools functions if Map Units are not set, but it is essential to select the correct Map Units. Image Manipulation Tools Batch Calculate Pyramid Layers. Pyramid layers are data deci-mation files that allow for quick screen redraws. Data are only drawn to the screen at about-screen resolution, rather than full image resolution. (When “zoomed in” the image still displays its full resolution.) Batch Calculate Pyramid Layers provides a file dialog to select multiple image files to calculate their pyramid layers before they are added to a Map document, or afterward, should the layers become corrupted. This is useful to perform before adding a set of images to an ArcView map document or when a batch of pyramid layers becomes corrupted, etc. Pyramid layers are highly recommended since shoreline analysis usually involves a lot of panning and zooming. The default image (*.img) produced by the Subset Aerial Image tool (Figure 4) automatically contains pyramid layers. These have to be written for other existing file formats and can often become corrupted when moving or renaming image files.

ERDC/CHL CHETN-IV-73 September 2008
6
Figure 4. Subset Aerial Image menu.
Subset Aerial Image. Immediately after rectification, rather than using Image Analysis’ Save or Save As commands, it is recommended that BeachTools’ Subset Aerial Image command be pressed while the original image is still rectified in memory only. This command allows the user to select and save a rectified clip region, or subset, of the original image, while saving rectifi-cation information on the original image, but leaving the original image itself unchanged. There are several reasons for doing this:
• The original image is unchanged, meaning rectification can always be performed again if errors were made or the file becomes corrupted.
• Due to radial distortion, the center of aerial images is usually the most spatially accurate, and since a set of aerial photographs usually has at least 50 percent overlap, only the center region of each image can be selected to be retained.
• Selecting only the necessary portion of the image saves disk space. • Subset can be used to create cut lines, i.e., using the Subset tool to select areas of adjacent
images having similar spectral characteristics limits abrupt changes in adjacent images. This is essential for creating a visually pleasing mosaic (Figure 5).
• The borders of scanned aerial photography usually contain fiducial marks and other information; it is usually necessary to crop out these borders for analysis.
Access the Subset tool from the BeachTools toolbar using the Subset Aerial Image button. This dialog prompts you to select the raster data layers that you wish to clip. You can press the Capture button and click in the image to select the minimum x and y values that will be used to define the clip area. Repeat this step for the upper right corner of the desired clip area. An output path and file name for the image subset is required. Available file types are ERDAS IMAGINE (*.img) and GEO-TIFF (*.tif). Clicking Subset Image dismisses the dialog, and the subset is written to file using cubic convolution. When complete, the new subset is added to the active data frame, and the user is prompted to remove the original image.
ERDC/CHL CHETN-IV-73 September 2008
7
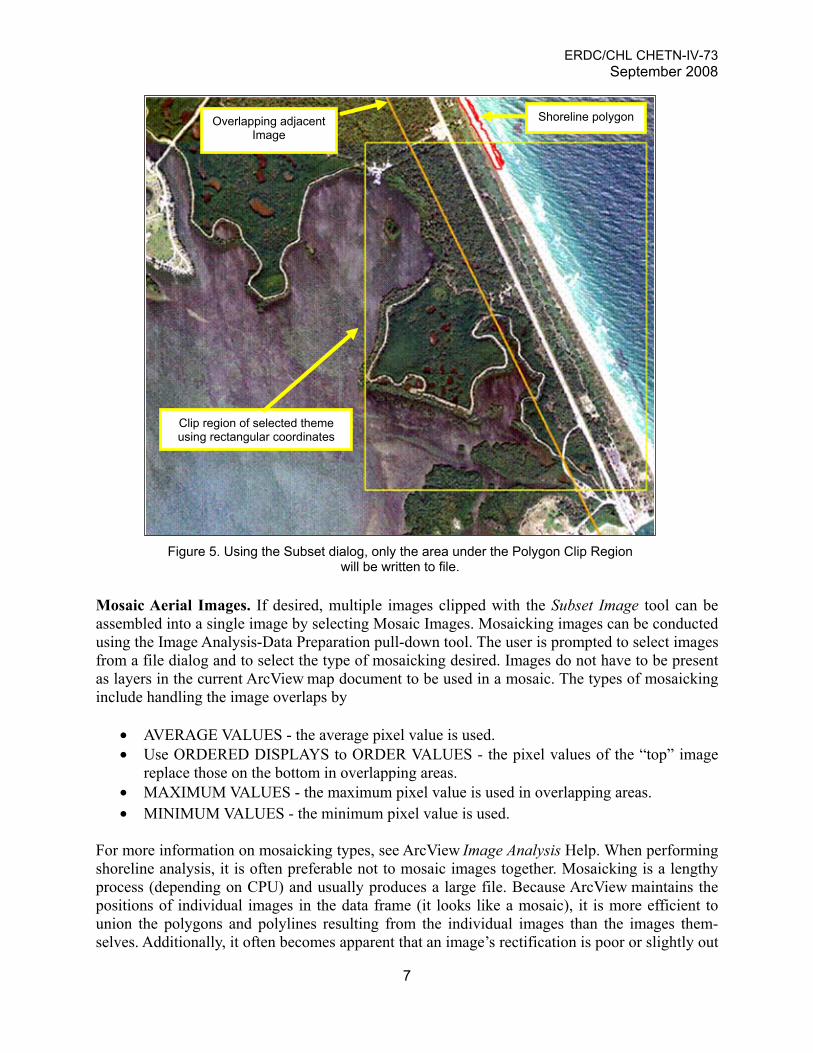
Figure 5. Using the Subset dialog, only the area under the Polygon Clip Region
will be written to file.
Mosaic Aerial Images. If desired, multiple images clipped with the Subset Image tool can be assembled into a single image by selecting Mosaic Images. Mosaicking images can be conducted using the Image Analysis-Data Preparation pull-down tool. The user is prompted to select images from a file dialog and to select the type of mosaicking desired. Images do not have to be present as layers in the current ArcView map document to be used in a mosaic. The types of mosaicking include handling the image overlaps by
• AVERAGE VALUES - the average pixel value is used. • Use ORDERED DISPLAYS to ORDER VALUES - the pixel values of the “top” image
replace those on the bottom in overlapping areas. • MAXIMUM VALUES - the maximum pixel value is used in overlapping areas. • MINIMUM VALUES - the minimum pixel value is used.
For more information on mosaicking types, see ArcView Image Analysis Help. When performing shoreline analysis, it is often preferable not to mosaic images together. Mosaicking is a lengthy process (depending on CPU) and usually produces a large file. Because ArcView maintains the positions of individual images in the data frame (it looks like a mosaic), it is more efficient to union the polygons and polylines resulting from the individual images than the images them-selves. Additionally, it often becomes apparent that an image’s rectification is poor or slightly out
Clip region of selected theme using rectangular coordinates
Overlapping adjacent Image
Shoreline polygon

ERDC/CHL CHETN-IV-73 September 2008
8
of alignment at a later stage of the shoreline analysis. Rectification of individual images can be improved on the fly by applying the Image Analysis align tool; if an individual image is not well rectified, the entire mosaicking process may need to be repeated. If desired, however, mosaicking can produce a visually pleasing composite image. Toggle Image Legend. This tool changes the brightness and contrast of the current image layer. To add this button to the data frame, select Toggle Image Legend button from the BeachTools toolbar. Finding distinct edges in imagery from the raw pixel values is sometimes difficult, especially along an irregular wet-dry line. Often, tonal differences of the raw pixels are small between the dry area of the beach and the wet. Toggle Image Legend provides a button directly on the current data frame’s display that changes the current active layer (if it is an Image Analysis layer) from “raw” pixel values to a “stretch” of the upper end of available pixel values. The Toggle Image Legend dialogue prompts the user to Enter a Minimum RGB Value or use the default value of 175 (Figure 6). The effect of clicking the Toggle Selected Image Layer button on the data frame is the same as moving each band’s histogram’s minimum and maximum count endpoints from pixel values of 0 to 255 (“raw”) to about 173 to 255 (“stretched”). Normally, this would require accessing the Image Analysis layer’s legend’s advanced options. This is a stretch toward the “bright” (high raw pixel values) end of the image spectrum so “bright” objects (such as the beach) will have much more contrast. Clicking the Toggle Legend button on the data frame improves visualization of the shoreline (wet-dry) line, which makes it easier to create and edit the polygon shoreline file and can some-times make it easier to find edges of corners and other features serving as ground control points in rectification. Clicking Toggle Legend again returns the values to the original “raw” values.
Figure 6. Toggle Image menu along with an example of an image having enhanced contrast in preparation for extracting beach theme for analysis.
ERDC/CHL CHETN-IV-73 September 2008
9
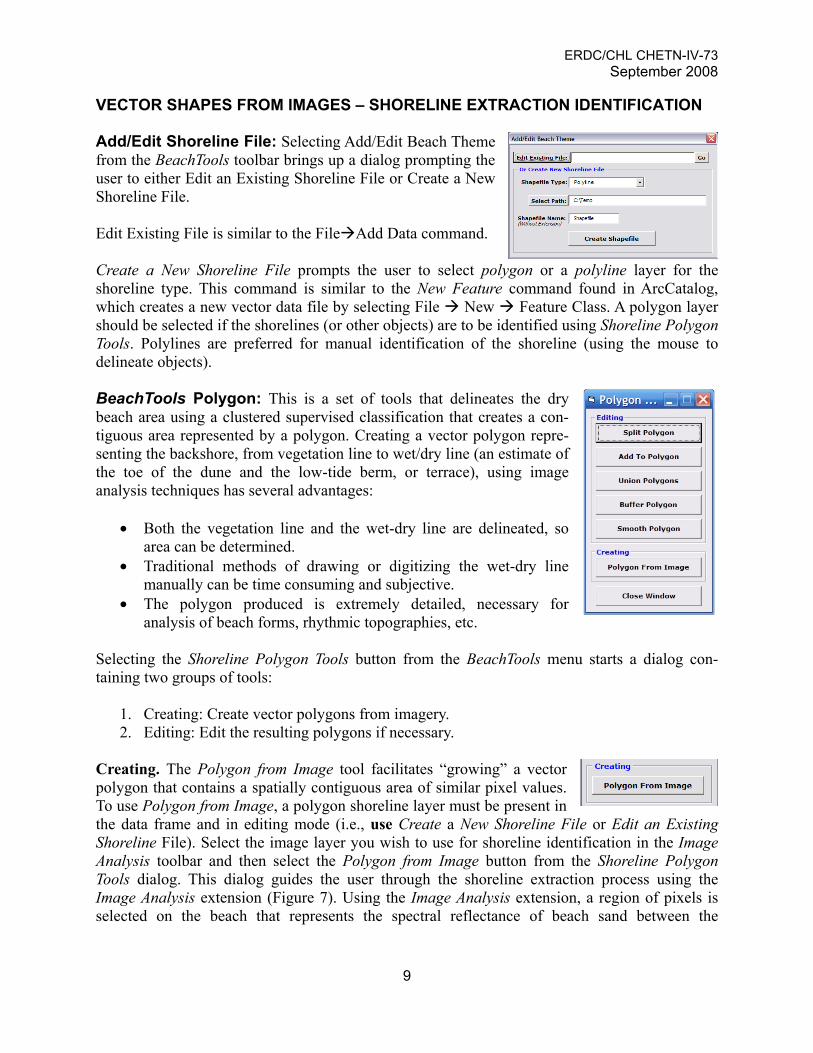
VECTOR SHAPES FROM IMAGES – SHORELINE EXTRACTION IDENTIFICATION Add/Edit Shoreline File: Selecting Add/Edit Beach Theme from the BeachTools toolbar brings up a dialog prompting the user to either Edit an Existing Shoreline File or Create a New Shoreline File. Edit Existing File is similar to the File Add Data command. Create a New Shoreline File prompts the user to select polygon or a polyline layer for the shoreline type. This command is similar to the New Feature command found in ArcCatalog, which creates a new vector data file by selecting File New Feature Class. A polygon layer should be selected if the shorelines (or other objects) are to be identified using Shoreline Polygon Tools. Polylines are preferred for manual identification of the shoreline (using the mouse to delineate objects). BeachTools Polygon: This is a set of tools that delineates the dry beach area using a clustered supervised classification that creates a con-tiguous area represented by a polygon. Creating a vector polygon repre-senting the backshore, from vegetation line to wet/dry line (an estimate of the toe of the dune and the low-tide berm, or terrace), using image analysis techniques has several advantages:
• Both the vegetation line and the wet-dry line are delineated, so area can be determined.
• Traditional methods of drawing or digitizing the wet-dry line manually can be time consuming and subjective.
• The polygon produced is extremely detailed, necessary for analysis of beach forms, rhythmic topographies, etc.
Selecting the Shoreline Polygon Tools button from the BeachTools menu starts a dialog con-taining two groups of tools:
1. Creating: Create vector polygons from imagery. 2. Editing: Edit the resulting polygons if necessary.
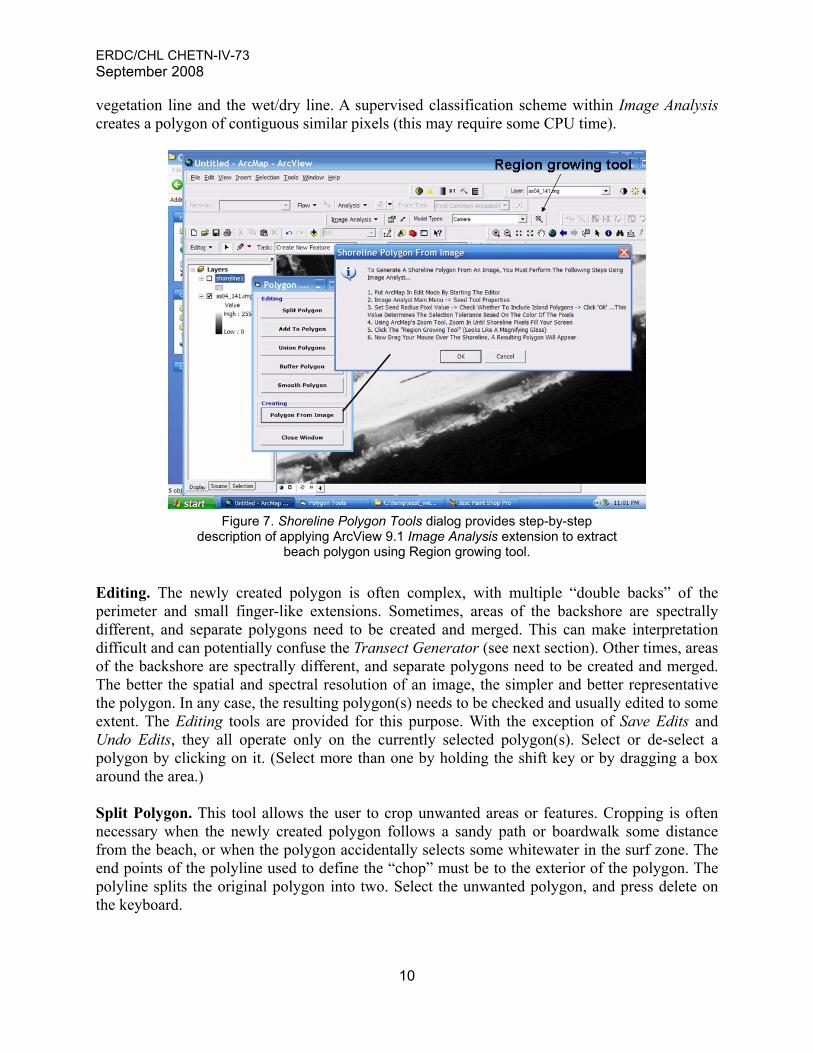
Creating. The Polygon from Image tool facilitates “growing” a vector polygon that contains a spatially contiguous area of similar pixel values. To use Polygon from Image, a polygon shoreline layer must be present in the data frame and in editing mode (i.e., use Create a New Shoreline File or Edit an Existing Shoreline File). Select the image layer you wish to use for shoreline identification in the Image Analysis toolbar and then select the Polygon from Image button from the Shoreline Polygon Tools dialog. This dialog guides the user through the shoreline extraction process using the Image Analysis extension (Figure 7). Using the Image Analysis extension, a region of pixels is selected on the beach that represents the spectral reflectance of beach sand between the
ERDC/CHL CHETN-IV-73 September 2008
10
vegetation line and the wet/dry line. A supervised classification scheme within Image Analysis creates a polygon of contiguous similar pixels (this may require some CPU time).
Figure 7. Shoreline Polygon Tools dialog provides step-by-step
description of applying ArcView 9.1 Image Analysis extension to extract beach polygon using Region growing tool.
Editing. The newly created polygon is often complex, with multiple “double backs” of the perimeter and small finger-like extensions. Sometimes, areas of the backshore are spectrally different, and separate polygons need to be created and merged. This can make interpretation difficult and can potentially confuse the Transect Generator (see next section). Other times, areas of the backshore are spectrally different, and separate polygons need to be created and merged. The better the spatial and spectral resolution of an image, the simpler and better representative the polygon. In any case, the resulting polygon(s) needs to be checked and usually edited to some extent. The Editing tools are provided for this purpose. With the exception of Save Edits and Undo Edits, they all operate only on the currently selected polygon(s). Select or de-select a polygon by clicking on it. (Select more than one by holding the shift key or by dragging a box around the area.) Split Polygon. This tool allows the user to crop unwanted areas or features. Cropping is often necessary when the newly created polygon follows a sandy path or boardwalk some distance from the beach, or when the polygon accidentally selects some whitewater in the surf zone. The end points of the polyline used to define the “chop” must be to the exterior of the polygon. The polyline splits the original polygon into two. Select the unwanted polygon, and press delete on the keyboard.

ERDC/CHL CHETN-IV-73 September 2008
11
Add to Polygon adds areas of features that were missed. This may happen when a long boardwalk extends into the backshore region, the debris line crosses the wet-dry line, etc. The end points of the polyline used to define the “add to” region must be in the interior of the polygon. This is generally used in conjunction with Union Polygons; add a little bit to a larger polygon and merge them together. Union Polygons merges polygons together. Lines where contiguous polygons meet dissappear. This should be used whereever overlapping or contiguous polygons meet, i.e., in areas of over-lapping imagery, after using the Add to Polygon tool, or when dissimilar areas must be indi-vidually selected. Only selected polygons will be unioned. Buffer Polygons adds a buffer to the selected polygon based on a user provided distance. Smooth Polygons. It is almost always necessary to smooth the perimeter using Smooth Polygon, which runs an N-sized convolution filter (moving average) around the perimeter. The user is prompted for the size of the filter each time it is run. Only selected polygons will be smoothed. With good imagery, and a distinct wet-dry line, Smooth Polygon is often the only editing necessary to prepare the polygon for a union with polygons from adjacent images and for subsequent analysis. With poor quality imagery, it is sometimes difficult for the Polygon from Image algorithm to distinguish among patches of white water, boardwalks, and roads that intersect the backshore. It is often necessary to select Include Island Polygons in this case, because areas of wet sand may be surrounded by areas of white water and dry sand. Use Split Polygons, Add to Polygon, Buffer Polygon, and Remove Island Polygons to remove unwanted features, add missed features, and nudge the polygon into proper position. The final polygon should be fairly smooth and contain no island polygons (“holes”). If any edit produces an undesirable result, press Undo Edit (and Redo Edit). It is a good idea to union all overlapping or adjoining polygons from all of the imagery for a given study date by using the Union Polygons Tool. This avoids confusion for the Calculate Transects algorithm. ESTABLISHING SHORELINE POSITIONS – GENERATING TRANSECTS AND BASELINES: Once a suitable polygon of the backshore or other areas has been generated, a baseline needs to be added to the data frame to serve as a stationary reference for generating transects. Baselines and transect properties are defined in the Baseline/Transect Properties dialog. Transects for any applicable shapefile can be generated using the Generate Shoreline Transects command, as long as there is a baseline present in the data frame. Although the methods in this CHETN recommend a polygon representation of the shoreline, polyline representations are supported as well. When constructing a baseline it is best to make it parallel to and roughly as long as or longer than the longest shoreline in the time series of shorelines. For good results with polygon representations, place the baseline landward of the shoreline polygon; never intersect it. To create a new baseline (or New Polyline Layer), use either the Add/Edit Beach Theme menu or the Generate Baseline Transects menu by selecting the path for the file and typing the name of the baseline (Figure 8). In the Add/Edit Beach Theme menu, be sure to specify the baseline as a

ERDC/CHL CHETN-IV-73 September 2008
12
polyline rather than polygon. In the Generate Baseline Transects menu, the only option is a polyline. Once the baseline file is created and placed in edit mode, the sketch tool can be used to position the baseline landward of the shoreline layer. The baseline must be oriented within the coordinate system of the project view for transect generation to function properly. For east-facing shorelines, the baseline must be drawn from south to north, whereas for west-facing shorelines the baseline must be drawn from north to south. Likewise for south-facing shorelines the baseline must be drawn from west to east, and for a north-facing shoreline the baseline must be drawn from east to west. After the baseline is sketched the baseline file must be saved before generating transects to the vegetation line and shoreline.
Figure 8. Menu for creating polyline to be used as baseline for creating transects
across shoreline polygon.
The endpoint coordinates of a baseline can also be entered manually under the Generate Baseline Transect menu. Manual Coordinate entry is used for entering the endpoints of the baseline using known positions in the current map projection as nodes. In using Manual Coordinate entry, be sure to follow the proper convention of baseline orientation with respect to shoreline orientation as described. The Baseline/Transect Properties dialog enables the user to input a distance for transect spacing, the baseline-parallel distance between consecutive transects. The units for this are always the projection units. The selection of spacing is dependent on the project location and the use of the data. For example, to capture small-scale features such as beach cusps, spacing on the order of 10 m should be specified. Once created, the Baseline Shapefile can be selected from the pull-down menu. The Generate Transects button adds the baseline to the data frame if it does not exist or replaces the existing baseline with the newly selected one (Figure 9).

ERDC/CHL CHETN-IV-73 September 2008
13
Figure 9. The Baseline/Transect Properties dialog.
Generate Transects automatically creates the transects, with no further prompting. When transect generation is complete, information on spacing and the number of transects generated is displayed. The transects are added to the data frame in the form of an ArcView shape layer. The attribute table of this layer contains a transect identifier, a baseline identifier (for multiple baselines), a baseline-vegetation line transect length (vegLength), and a baseline-wet-dry line length (shrLength). This table can be exported in a variety of formats for analysis with other software (Figure 10).
Figure 10. Example of an attribute table listing distances from baseline to vegetation line
and wet/dry line.

ERDC/CHL CHETN-IV-73 September 2008
14
OTHER USES FOR BEACHTOOLS: The preceding portions of this CHETN outline applications of BeachTools specifically for shoreline identification and analysis. BeachTools can also be used to delineate shoals, spits, and other coastal features. The inclusion of areas in the polygon attribute tables allows one to measure the aerial extent of other features. Time series of aerial photography can be analyzed to monitor the evolution of such features and an inlet geomorphologic system as a whole. ADDITIONAL INFORMATION: This CHETN is a product of the Inlet Channels and Geomorphology Work Unit of the Coastal Inlets Research Program (CIRP) being conducted at the U.S. Army Engineer Research and Development Center, Coastal and Hydraulics Laboratory (ERDC-CHL). Authors of this technical note were Dr. Gary A. Zarillo, Justin Kelley, and Vickie Larson of the Florida Institute of Technology, Melbourne, FL. Questions about this CHETN and the application of BeachTools can be addressed to Dr. Zarillo (at 321-674-7378 or [email protected]) or to Mary Claire Allison, ERDC-CHL (at 601-634-3088 or Mary.C.Allison@ usace.army.mil). For information about the CIRP, please contact the Program Manager, Dr. Nicholas C. Kraus, ERDC-CHL, at 601-634-2016 or [email protected]. This technical note should be cited as follows:
Zarillo, G. A., J. Kelley, and V. Larson. 2008. A GIS based tool for extracting shoreline positions from aerial imagery (BeachTools) revised. Coastal and Hydraulics Laboratory Engineering Technical Note ERDC/CHL CHETN-IV-73. Vicksburg, MS: U.S. Army Engineer Research and Development Center. http://chl.erdc.usace.army.mil/chetn
REFERENCES Dolan, R. B., B. Hayden, P. May, and S. May. 1980. The reliability of shoreline change measured from aerial
photographs. Shore and Beach 48(4):22–29.
Hoeke, R. K., G. A. Zarillo, and M. Synder. 2001. A GIS based tool for extracting shoreline positions from aerial imagery (BeachTools). Coastal and Hydraulics Engineering Technical Note CHETN-IV-37, Vicksburg, MS: U.S. Army Engineer Research and Development Center. http://chl.erdc.usace.army.mil/chetn.
Rosati, J. D., and N. C. Kraus. 1999. Formulation of sediment budgets at inlets. Coastal Engineering Technical Note CETN-IV-15 (revised September 1999). Vicksburg, MS: U.S. Army Engineer Research and Development Center.
Smith, G. L., and G. A. Zarillo. 1990. Calculating long-term shoreline recession rates using aerial photographic and beach profiling techniques. Journal of Coastal Research 6(1):111–120.
Stauble, D. 1998. Techniques for measuring and analyzing inlet ebb-shoal evolution. Coastal Engineering Technical Note CETN-IV-13. Vicksburg, MS: U.S. Army Engineer Research and Development Center.
NOTE: The contents of this technical note are not to be used for advertising, publication, or promotional purposes. Citation of trade names does not constitute an official
endorsement or approval of the use of such products.