Embed Size (px)
Citation preview
SIT Journal of Management; ISSN: 2278-9111 with IF 2.463
1 | P a g e
SIT Journal of Management;7(1);2017
A GIS Model for Tourism Administration in Kerala – A Study based on
Google Maps
ISSN: 2278-9111 with IF 2.463
SIT Journal of Management
7(1); 1-15;6 I 17
@Dept. of Business Administration
Siliguri Institute of Technology, Siliguri
http://www.ejsit.org
SITJM
Dr. K.S. Anil kumar
Principal
Ayyappa College, Eramallikkara
Venugopal C.K.
Assistant Professor
KITTS
Email: [email protected]
Abstract
This paper aims at developing an online Geographical Information System (GIS) that use Google
maps to administer the tourism resources in the state of Kerala. Using the inherent capabilities of
Google maps the tool developed will provide information to travelers and administrators. Since
this tool has been developed on a zero budget basis, this is an ideal platform for researchers and
students to explore the immense possibilities of Google maps further. Stand alone GIS
applications using proprietary or free software requires a large amount of money and time. The
features in this application can be incorporated into other applications by providing links to the
maps developed in this application. Since Google maps are already in digitized format and are
accurate, additional data can be added without compromising on quality and accuracy. Different
layers provide access to information based on categories such as elephant corridors, tourist
attractions, hotels and other information related to tourism.
Keywords: GIS, Tourism, Google maps, Kerala, Layers
Introduction
Geographical Information systems (GIS) are used worldwide in route mapping, location based
searching and as a travel aid. In addition to the above, GIS can be used an administrative tool in
SIT Journal of Management; ISSN: 2278-9111 with IF 2.463
2 | P a g e
SIT Journal of Management;7(1);2017
Tourism. This study aims at developing a GIS using Google maps for managing the tourism
resources of Kerala. Tourism being the leading job provider is an integral part of the socio-
economic fabric of Kerala. Administration of tourism efficiently using state of the art
technological tools will hold the key to sustainable development in the state. Since Tourism is
ideally suited to the Kerala model of development use of Information technology as an aid to the
tourism sector has to be encouraged. Use of GIS in Tourism as a management tool which will aid
administration is yet to be fully exploited. This paper provides an insight into how a tourism GIS
can be used to aid administration all the levels of management.
Objectives of the study
1. To develop a GIS model for tourism administration in Kerala using google maps
2. To suggest ways in which this model can be used to improve tourism administration in
the state of Kerala
Limitations of the Study
This project was implemented using google maps. Hence this will work only if internet
connection is available. The maps displayed in the application can be modified only in the
following ways.
a. Adding non spatial data to existing maps
b. Plotting lines, polygons and point using tools available in Google maps
Literature Review
Maps are a natural means of indexing and presenting tourism related information. Today due to
advances in modern telecommunication and information technologies, there is an increasing
effort in the development of Geographic Information Systems. This paper explains the creation
SIT Journal of Management; ISSN: 2278-9111 with IF 2.463
3 | P a g e
SIT Journal of Management;7(1);2017
of an easily adaptable Integrated Environment for the development of efficient applications
which require Geographic functionality. (Christodoulakis et al). When making decisions,
planning, analyzing the effect of changes, looking for patterns etc, maps, charts, lists, graphs and
reports are used. Often it is very difficult to get use information out of these sources. Geographic
Information Systems have the capability to handle several kinds of information that can be
related to a location or area. This paper focuses on GIS in Tourism management and promotion
in Ghana. Presenting tourism information in GIS in a multimedia environment will help tourism
agencies, stake holders and policy makers in information gathering and taking decisions. This
project will help in creating a comprehensive information base for tourism in Ghana on the
Internet. (Longmatey et al, ). This study developed a tourism potential model and detected spatial
disparity in the distribution of recreational resources. It has also demonstrated the applications of
the model’s outputs for recreational planning. The tourism potential model can be applied to
identify areas with potential for successful future tourism development, particularly in the design
of new walking tracks. A need for an integrated and collaborative approach is articulated in the
research, rather than a confrontational approach to disperse the growth generated by tourism over
the years. (Chhetri, et al).
A Tourism Planning model was developed for the state of South Carolina in USA using natural
and cultural resources. (Gunn, 1990). A simulation model was used to estimate a numerical value
for social carrying capacity (for hiking and vehicles) for Delicate Arch and Arches National
park, Utah, USA. (Lawson et al, 2002). An approach of sustainability was used for modeling
tourism potential for the Grampians National Park by combining environmental resiliency and
tourist attractiveness. (Arrowsmith and Inbakaran, 2001). Ecotourism sites were identified within
Northern Ontario, Canada using GIS techniques. This was used for mapping inventory of
SIT Journal of Management; ISSN: 2278-9111 with IF 2.463
4 | P a g e
SIT Journal of Management;7(1);2017
recreational resources. (Boyd and Butler, 1996). A tourism resource inventory developed for
British Columbia integrates both biophysical and human parameters. (Williams et al, 1996).
Mysore Urban Development Authority (Muda) is going hi-tech by adopting 3D Geographical
Information System (GIS) technology, a first by any Indian city. Muda is establishing GIS using
high-resolution-satellite images (of 0.6m resolution) and ground surveys with the incorporation
of Muda data by geo-tagging. The remote-sensing centre of the IT department (Karnataka) will
help the urban body in the project. The last two decades have witnessed high population growth
in India’s urban areas. Urban centres are the hub of the manufacturing, services and trade. As a
result, more people are migrating from rural areas to urban centres, making municipal
governance a very complex issue. The complexity is more pronounced in states like West Bengal
which has on of the highest population densities. One of its towns, Kalyani is a planned
industrial town but with large unplanned settlements in form of slums. It has a university and
number of colleges. It is part of the Kolkata Metropolitan Development Authority and is
surrounded by villages. It is situated on the bank of river Ganges on its natural levee.
GIS database provides invaluable inputs not only for planning of infrastructure like road,
sewerage and drinking water, but also helps manage important services to various stakeholders.
All the above planning components are interlinked with each other. Moreover, the whole
municipal planning is related with the regional planning and the planning of neighboring
municipalities. It is possible to integrate slum development plan with infrastructure development
as well as the local economic development plan. In a democratic setup, this GIS framework
simultaneously provides transparency to the elected representatives who run the municipalities
and to the stakeholders.
SIT Journal of Management; ISSN: 2278-9111 with IF 2.463
5 | P a g e
SIT Journal of Management;7(1);2017
The purpose of this paper is to investigate STIP’s potential—as a tourism planning approach—to
incorporate ‘sustainability criteria’: realize development objectives; enable desired and expected
visitor experiences; do not exceed carrying capacity standards; and minimize overall resource
impacts. The overall goal was to map sustainable trail development locations by integrating (i.e.,
using a GIS) social (visitor preferences and managerial objectives) with biological (natural
resource) data. When the three-phase GIS-supported methodology set forward here allows
realizing these goals, STIP can be considered a comprehensive and operational sustainable
tourism planning tool.
This paper presents a conceptual GIS-supported sustainable tourism infrastructure planning
`approach (STIP). This approach aims at integrating a comprehensive set of sustainability criteria
(i.e.,dealing with development objectives, preferred visitor experiences, and carrying capacity
standards) in tourism planning, using GIS. STIP involves three phases: a visitor segmentation
phase, a zoning phase, and a transportation network planning phase.
STIP integrates the 1) visitor segmentation; 2) zoning; and 3) visitor transportation network
planning phases (see Figure 1). The integration of these phases allows for directing visitors
through preferred zones, to undertake preferred activities at preferred facility locations, while
accounting for development objectives and resource constraints. Experiences have shown that it
is important to plan judiciously so that funds invested for ecotourism projects are maximized.
This article emphasizes the use of modern techniques such as GIS for Multiple Criteria Decision
Making (MCDM). Framework for prioritization of important ecotourism projects for funding
opportunities so as to reach the optimal level of eco-tourism development.
SIT Journal of Management; ISSN: 2278-9111 with IF 2.463
6 | P a g e
SIT Journal of Management;7(1);2017
Study
Even though various GIS based packages are available that can be used to develop a fully
fledged GIS, in this study Google maps are used to develop a GIS model for tourism
administration due to the following reasons. This being a individual research paper, purchasing
and developing a GIS tool like ArcGIS is expensive. Since the focus of the study will shift to
developmental intricacies associated with a software tools and will become time consuming, free
software such as QGIS is also not used. Google maps have been used in this study due to
following advantages. a) The maps are readily available and accurate b) The response time
related to the click event of the mouse and responses obtained are fast enough in a standard
internet connection c) Since the spatial data is accurate only non spatial data needs to be added.
d) Non spatial data can be used extract information using queries e) This will help in decision
making.
The tool developed during this study can function in the following ways
1. The administrator can develop an application or presentation to access the maps and
layers.
2. The maps with built in layers can be accessed in different ways and is available online
3. Therefore when the user clicks the link from any application which he uses (provided he
has corresponding link) can access the map and the associated resources and data
Google maps can be used effectively to provide a cheap alternative for travel solutions. Since
the latitude and longitude are already plotted with pin point accuracy in Google maps, they can
be customized to suit our needs. The concept of layers which is an intrinsic component of GIS
can be created from the Google maps. In this study all districts of Kerala were mapped. Each
SIT Journal of Management; ISSN: 2278-9111 with IF 2.463
7 | P a g e
SIT Journal of Management;7(1);2017
district was outlined and given a different shade. Since the Google map already contains the
important locations of all the districts, these can be added to the layer which was created under
the layer Thiruvananthapuram. The different layers thus mapped are
a. Tourist places
b. Information Centres
c. DTPCs
d. Forest areas
e. Trekking routes
f. Elephant corridors
g. Restaurants
h. Resorts
Other features
1.0 Conventional features
1.1 Shortest Distance finder
1.2 Distance finder
1.3 Shortest route
1.4 Layers
1.4.1 Tourist Places
1.4.2 Trekking paths
1.4.3 Walking tours
1.4.4 Elephant corridors
1.4.5 Water holes
2.0 Tabular data (Non Spatial)
2.1 Details of Hotels
2.1.1 Type of room
2.1.2 Room rent
2.1.3 Pictures
2.1.4 Facilities
2.1.5 Address
2.1.6 Location map
2.2 Details of destination
2.2.1 Type of destination
2.2.2 Facilities
2.2.3 Pictures
2.2.4 Location map
2.3 Trekking packages
2.3.1 Rate, Route, Duration of trek, Trek path (map)
2.4 Elephant corridors
SIT Journal of Management; ISSN: 2278-9111 with IF 2.463
8 | P a g e
SIT Journal of Management;7(1);2017
2.4.1 Route, Distance, map
2.5 Walking tours
2.5.1 Rate, Route, Duration, Tour map
2.6 Cycling tours
2.6.1 Rate, Route, Duration, Tour map
3.0 Analysing Changes
3.1 Calculation of change in forest cover
3.2 Calculation of change in coastal area
4.0 Tourist related
4.1 International
4.1.1 Year, Number, Country, Type of Tourist
4.2 Domestic
4.2.1 Year, Number, Country, Type of Tourist
4.3 Calculation of change in percentage of tourists year wise based on
4.3.1 Country
4.3.2 State
4.4 Change in revenue earned year wise based on
4.4.1 Country
4.4.2 State
Even though the important tourist places are already mapped in the google map only additional
information such as description of the destination, type of destination etc are to be added. Since
this layer gives only description of the tourist places, additional information related to Tourist
Information Centres, DTPCs and other layers as mentioned above have to be added. Information
centres like those in Thampanoor are located in the railway station and bus station and are not
marked in the googke map. These have been incorporated into the layers which have been
created during the study. The DTPC layer is also added in similar fashion. Forest areas consist
of Eco Tourism destination like Neyyar, Peppara, Arrippa, Kallar, Wayand, Peechi – Vazhani,
Athirapalli, Thekkady etc. There is Eco Development Committees (EDC), Vana Samrakshana
Samithis (VSS) located in these destinations. There function as livelihood providers to local
communities in the fringe areas. These eco tourism destinations can be mapped as a separate
layer incorporating the description of the destination and the activities that can be done here.
Other layers than can be added are trekking paths are elephant corridors. These can be marked as
SIT Journal of Management; ISSN: 2278-9111 with IF 2.463
9 | P a g e
SIT Journal of Management;7(1);2017
routes into the maps using the line tool. Restaurants and Hotels can be added as a separate layer
at each destination. For example a destination such as Kovalam has a number of restaurants and
resorts which can be incorporated into the map. The advantage of this approach is that new
features and information can be added to the existing ones without compromising on accuracy.
The intrinsic features of GIS such as finding the shortest distance, measuring the distance
between two points etc are also incorporated. In Google maps sometimes a route may be missing
such an inner road. This is also as part of this study.
The application which was developed as part of the study has the following broad capabilities.
1. Displaying tourism related information for each district layer wise
2. Calculation of distance between routes
3. Finding shortest path
4. Displaying the area falling under each district separately using different shades.
Advantages of using the web based GIS developed
1. This provides accurate location based data
2. Additional information can be incorporated or new data can be added
3. New layers can be created.
4. The maps are real time and accurate
5. Additional information and tables can be added
6. Existing data can be modified
7. The links to the respective maps (layers) can be incorporated into a document or
presentation and can also be accessed from another application.
SIT Journal of Management; ISSN: 2278-9111 with IF 2.463
10 | P a g e
SIT Journal of Management;7(1);2017
Analysis specific to Kerala in addition to regular analysis
• Changes specific to eco tourism destinations
• Change in forest cover
• Change in Tourism receipts associated with Kerala model of Tourism development in
area such as
a. Responsible tourism
b. Eco tourism
c. Other practices that are associated with tourism and livelihood
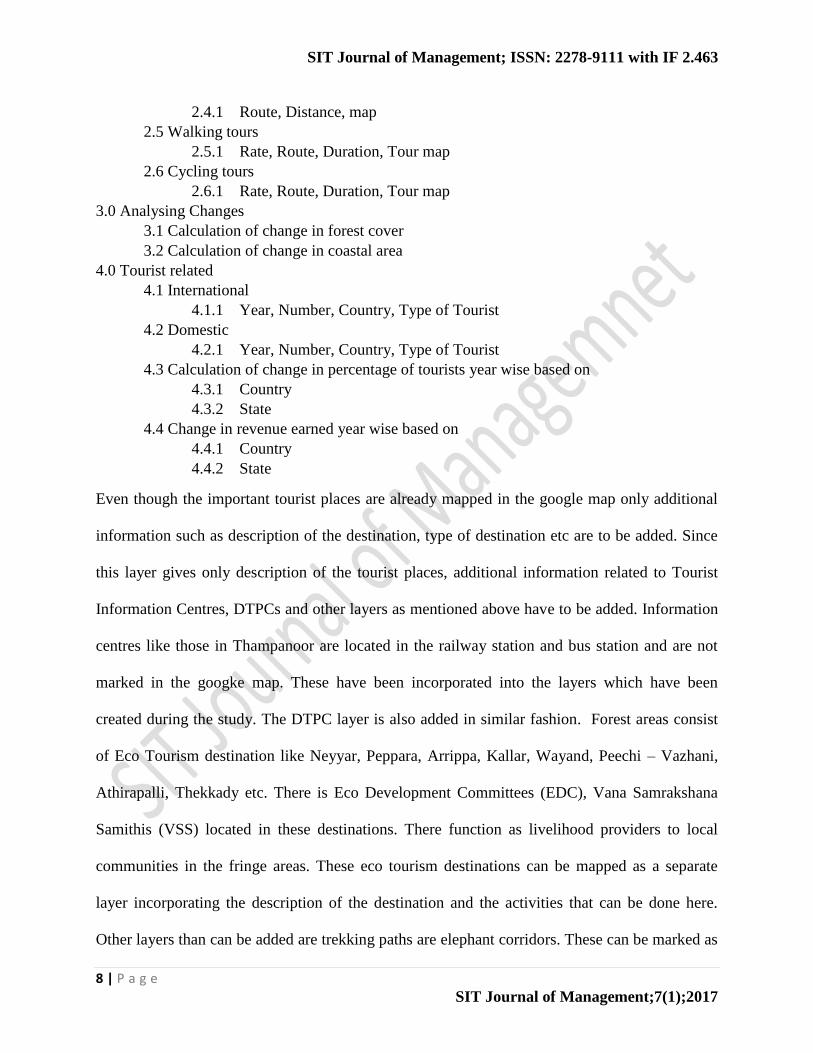
System Diagram
Figure 1
The components of the system (Figure 1) are as follows:
1. Customised Layers which consists of Tourist Places, Hotels and resorts, wildlife
sanctuaries, trekking paths, Walking tours, Cycling tours, Elephant corridors, ATMs,
Hospitals etc.
Customised Layers
Customised Google maps
Application Interfaces
Outputs
SIT Journal of Management; ISSN: 2278-9111 with IF 2.463
11 | P a g e
SIT Journal of Management;7(1);2017
2. Customized Google maps that are created from existing Google maps and customized to
suit the requirements
3. The Application interfaces can be any one the following : An interface or link from a
PowerPoint presentation, A link from an external application or any other application that
can access internet. These interfaces can prove very useful since the application
developed as part of this study can be accessed according to the requirements of the user.
4. The outputs can be reports, graphical images in the form of maps or tabular data
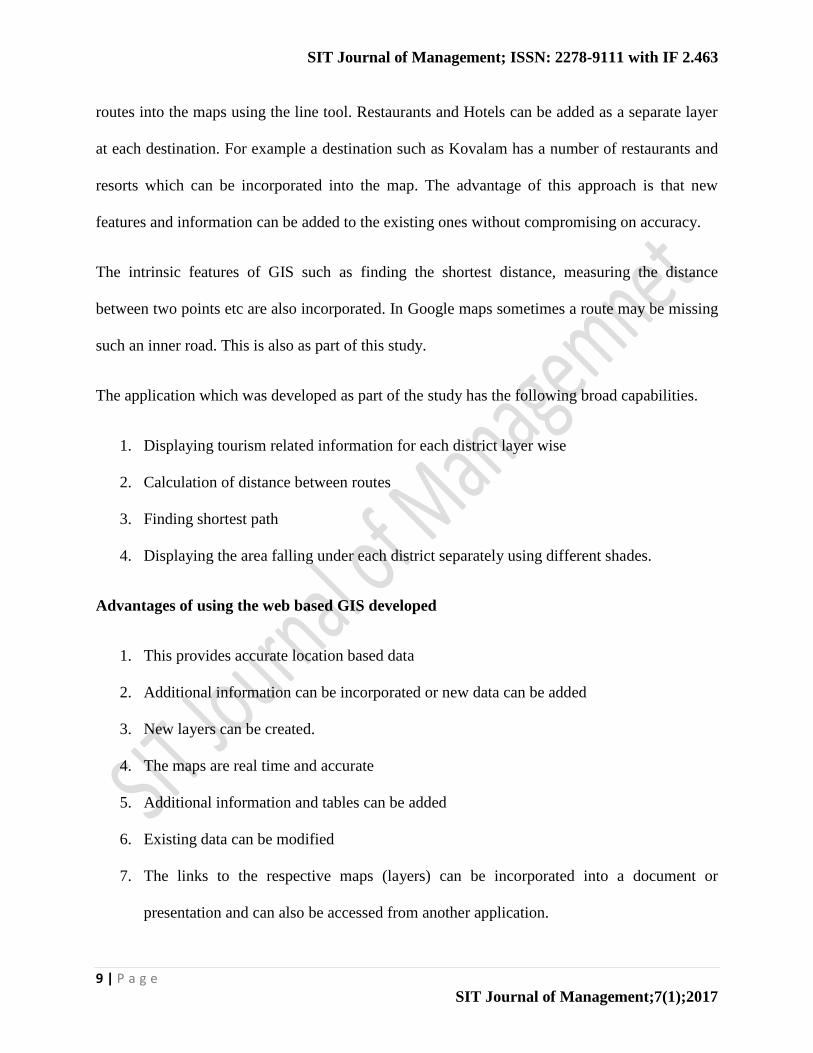
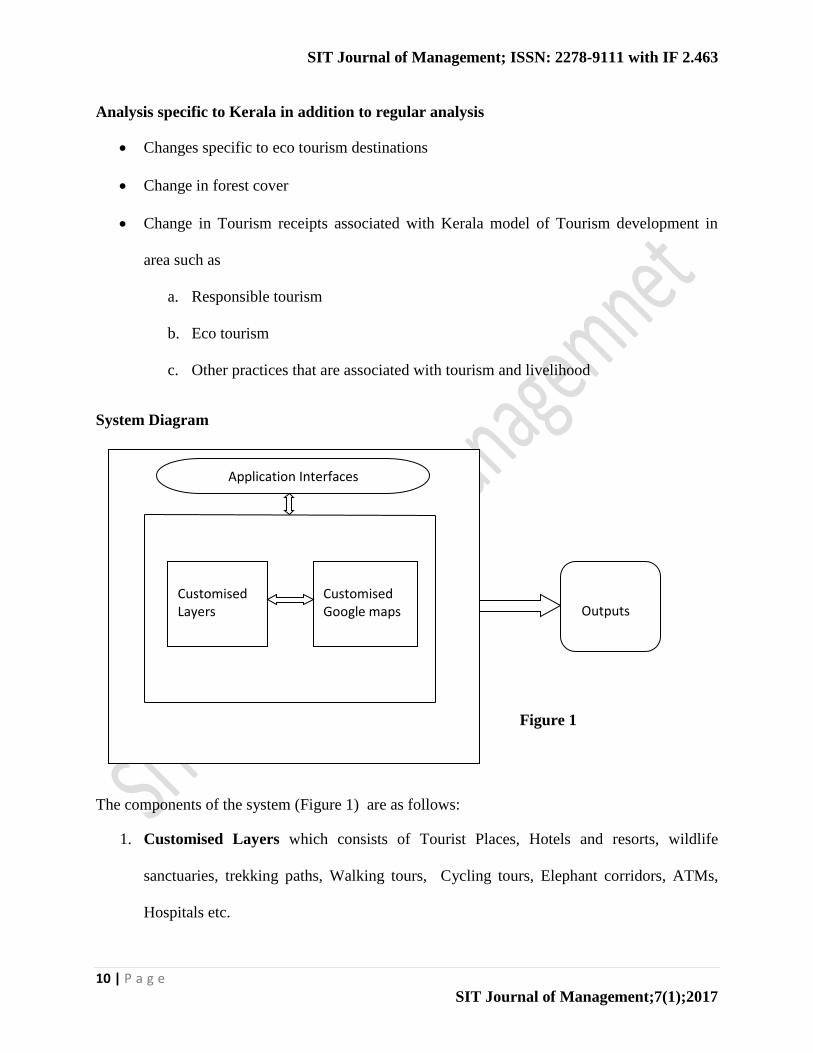
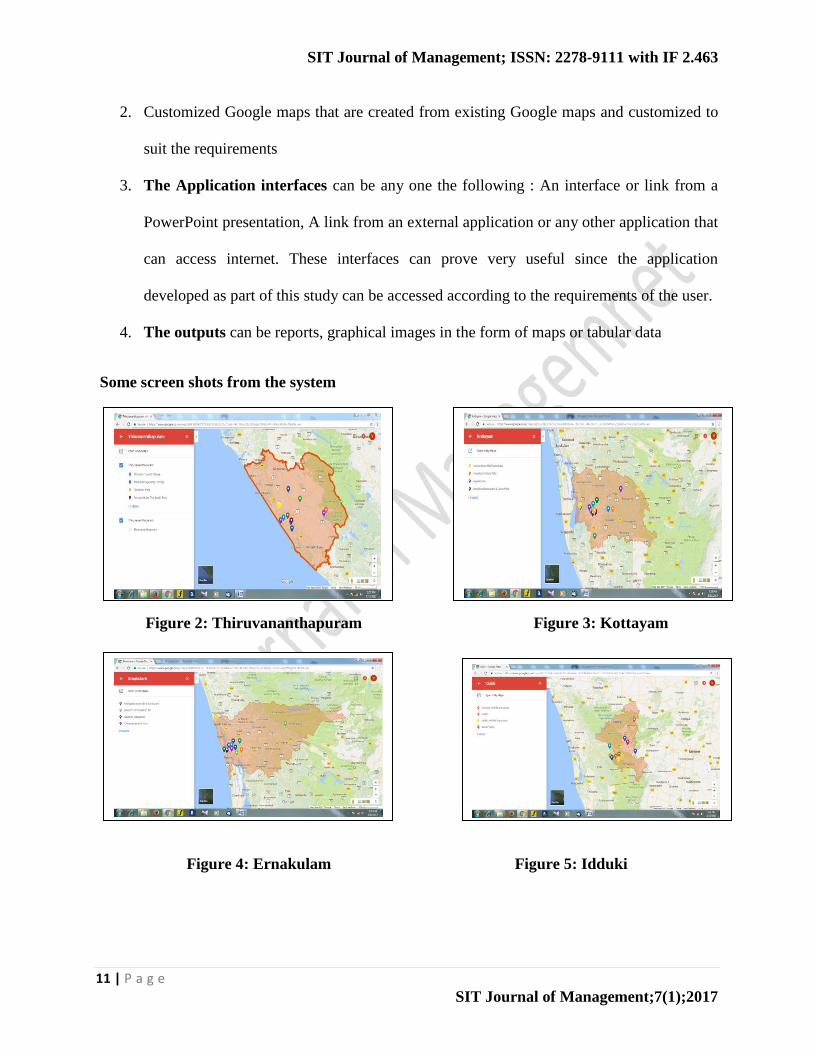
Some screen shots from the system
Figure 2: Thiruvananthapuram Figure 3: Kottayam
Figure 4: Ernakulam Figure 5: Idduki
SIT Journal of Management; ISSN: 2278-9111 with IF 2.463
12 | P a g e
SIT Journal of Management;7(1);2017
Findings
1. In addition to the existing features of a GIS such as shortest distance finding, distance
calculation, location finding and route mapping the following features will help Tourism
a. Displaying non spatial data in tabular format related to a location such as
i. Details of rooms in a hotel or resort
ii. Facilities available in a Tourist location
iii. Total number of tourists
iv. Classification of tourists based on country, state, spending, stay, type etc
b. Location specific information based on destination types (eg. Sea side, Lakes, Hill
stations, Eco-destinations etc)
i. ATMS
ii. Hospitals
iii. Information centres etc
2. Top, middle and bottom level managers can used both spatial and non spatial data based on
their needs for the following
a. Top level
i. For taking long strategic decisions which will have long time implications
such as
1. Deciding on choosing and developing a destination
2. Planning tourism development in an existing destination in a
sustainable and scientific manner

SIT Journal of Management; ISSN: 2278-9111 with IF 2.463
13 | P a g e
SIT Journal of Management;7(1);2017
3. To analyze tourism receipts and arrivals over a period of time and
arrive at factors that affect these parameters. This will help maximize
revenue without compromising carrying capacity.
b. Middle level
i. Arriving at tactical decisions such as solving a bottle neck problem at a
destination. This may involve analyzing and finding reasons why
1. The destination is becoming unpopular among tourists
2. Environmental damage happens (using EIA tools)
3. Local participation is less etc
ii. Bottom level
1. Taking day to day decisions like scheduling, assignments, overall
monitoring etc
3. Analyzing land use pattern due to tourism over a period of time (Number of buildings, other
structures, landmarks etc
4. Analyzing changes in coastal areas associated with tourism over a period of time (Such as
analyzing areas encroached or reclaimed over a period of time)
Suggestions
Developing a fully fledged GIS using a free software or proprietary software in lines of the
above tool, can be done if time permits. This involves the following steps.
• Procuring maps from agencies (This may require payment)
• Digitizing the maps and adding layers (This requires the service of GIS expert and each
point, line or polygon has to mapped manually) – May require over a year to complete
SIT Journal of Management; ISSN: 2278-9111 with IF 2.463
14 | P a g e
SIT Journal of Management;7(1);2017
• Designing a query engine to cater to decision making
• Developing a report generation module
• Finally these may be integrated into a single package for full deployment
The whole project once implemented can be made a web based app, standalone package or
Web GIS depending on the need
Scope for further study
A fully fledged GIS can be developed using proprietary software such as ArcGIS or by using
free software such as QGIS. Even though such an approach allows the user to make tailor made
GIS, this has the following disadvantages.
1. Maps have to be procured and digitized which requires expertise and involves a
substantial cost factor
2. Only an expert in GIS will be able to digitally map the various elements accurately into
the base map. This is time consuming and requires assistance from a team
However the present study can act a stepping stone for developing a standalone application in
GIS. All the components developed during this study can be used for this.
Conclusion
There is no doubt a GIS based tool will useful for Tourism administration in Kerala. This study
aims at developing a GIS tool using Google maps for management of tourism resources of
Kerala. Since Google maps are accurate and reliable, a GIS based on this will also provide
accurate results. The development of this tool is mainly intended to provide a guideline for future
research in this area. This model will act not only a tool for tourism administration but also
provided a broad frame work on which future development in this area can be made.
SIT Journal of Management; ISSN: 2278-9111 with IF 2.463
15 | P a g e
SIT Journal of Management;7(1);2017
References
Arrowsmith C.A. and R. Inbakaran (2001) , Estimating environmental resiliency for the
Grampians National Park , Tourism Management 23 (3) pp 295 – 309
Boyd S.W and R.W Butler (1996) “Seeing the forest through the trees : Identifying potential
ecotourism sites in Northern Ontario in L.C. Harrison nd W. Husbands (eds) Practicing
Responsible Tourism: International case studies in Tourism Planning, policy and development,
Wiley and Sons, NewYork pp : 380 – 403
Bas Boers B A Gis Based Approach M.S. Wageningen University; Stuart Cottrell, Ph.D.
Colorado State University
Gunn C.A (1990). Upcountry South Carolina Guidelines for Tourism Development. College
Station TX.
Lawson S., R. Manning, W. Valliere, B. Wang and M. Budtruk (2002). Using simulating
modeling to facilitate proactive monitoring and adaptive management of social carrying capacity
in Arches National Park, Utah, USA. In Arnberger A, C. Brandenburg and A Muhar (eds)
Conference Proceeding of the Monitoring and Management of visitor flows in recreational and
protected areas, Bodenkultur University, Vienna, Austria, pp 205 – 201.
Williams P.W., J Paul and D. Hainsworth (1996). Keeping track of what really counts: Tourism
resource inventory systems in British Columbia in L.C. Harrison and W. Husbands (eds.)
Practicing Responsible Tourism: International case studies in Tourism planning, policy and
development. New York. Wiley and Sons pp. 404 – 421
Fan Wenbing, 2006a. Application of “3S” technique to the city planning and building. Anhui
Construction, (1), pp. 16 Zheng Chaogui, 2004a. “3S” technology and its application to urban
planning Journal of Chuzhou University, 6(4), pp. 105
P.K. Ryngnga; Ecotourism Prioritisation : A geographic information system approach South
Asian Journal of Tourism and Heritage (2008), Vol 1 No. 1