Embed Size (px)
Citation preview
A post-Budget economic and market outlook Dr Chris Caton May 2015
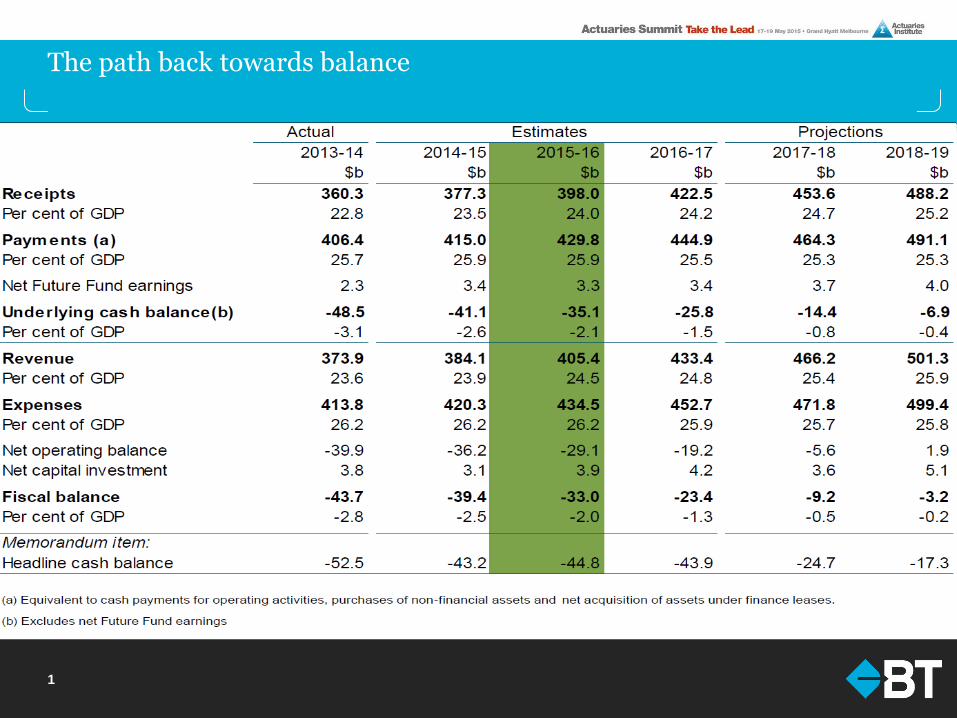
The path back towards balance
1
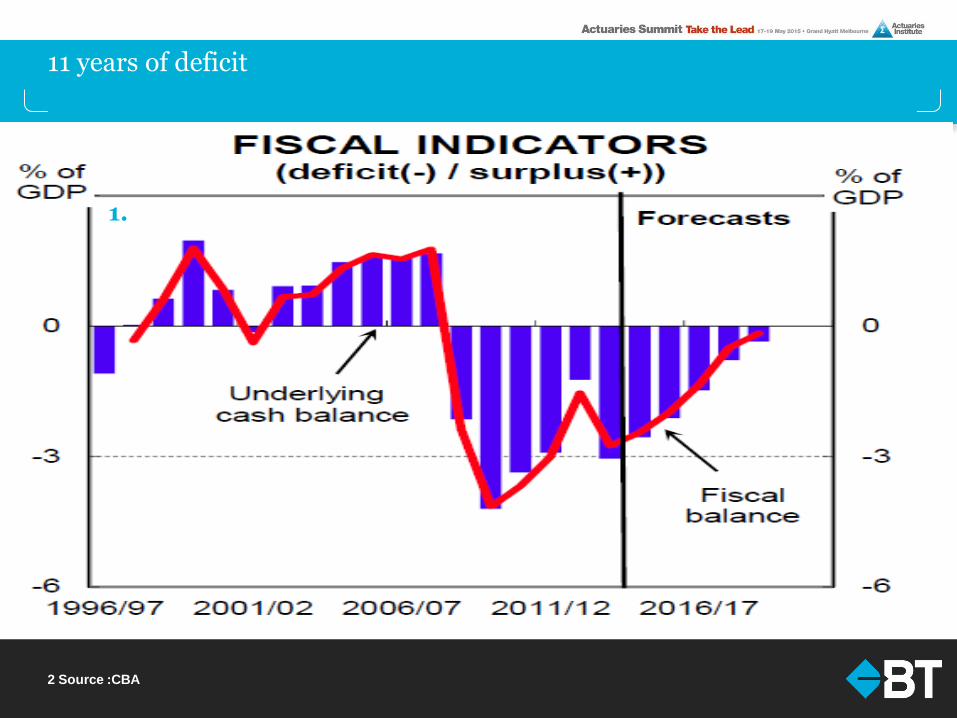
11 years of deficit
2 Source :CBA
1.
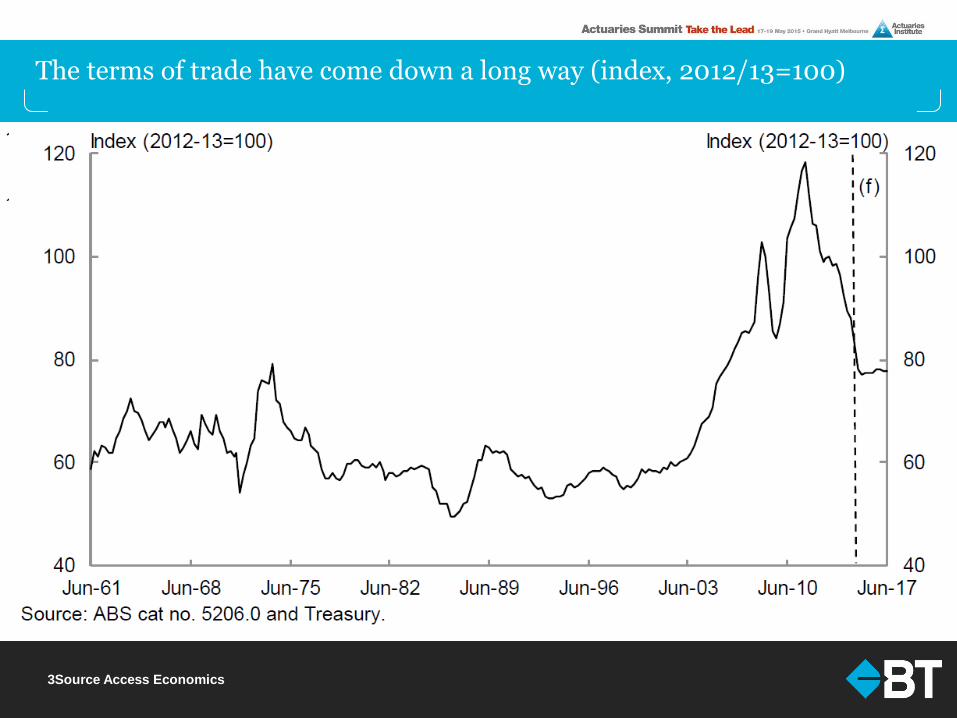
The terms of trade have come down a long way (index, 2012/13=100)
3Source Access Economics
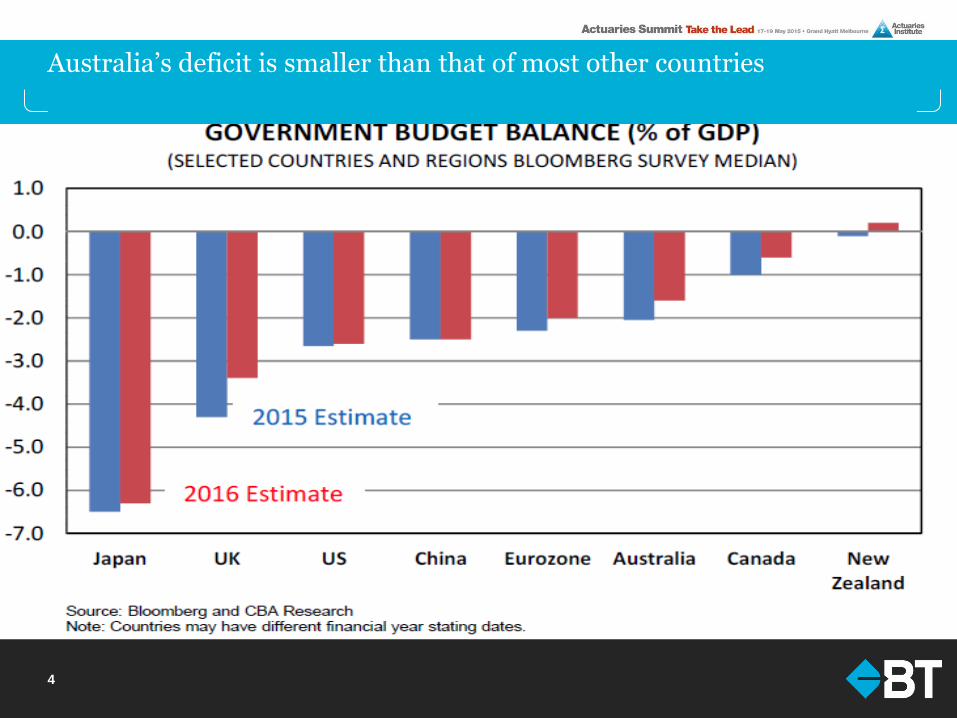
Australia’s deficit is smaller than that of most other countries
4
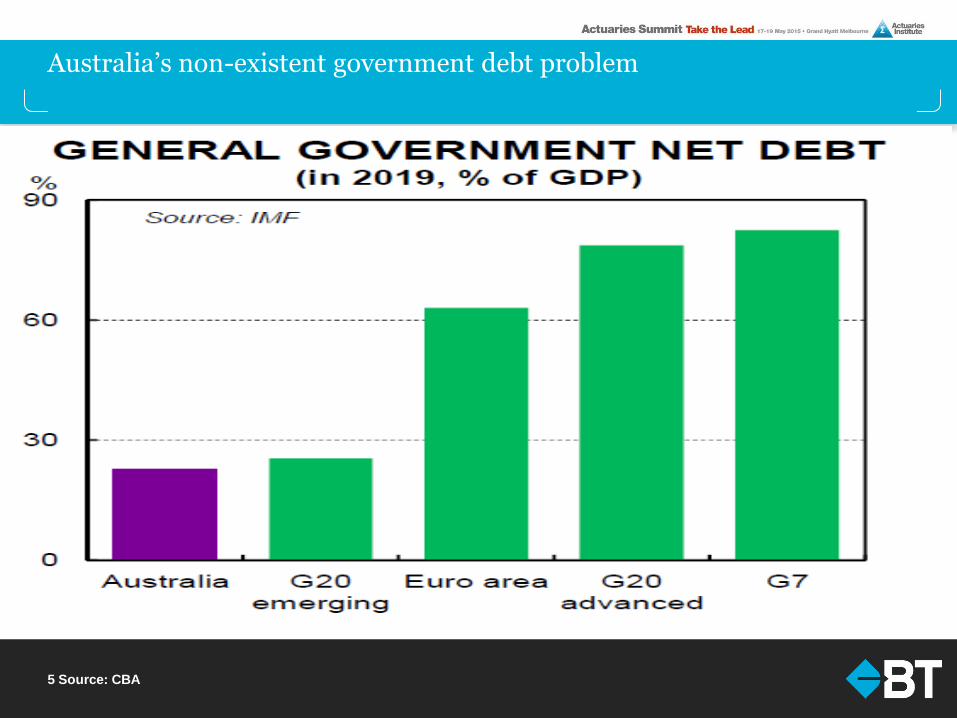
Australia’s non-existent government debt problem
5 Source: CBA
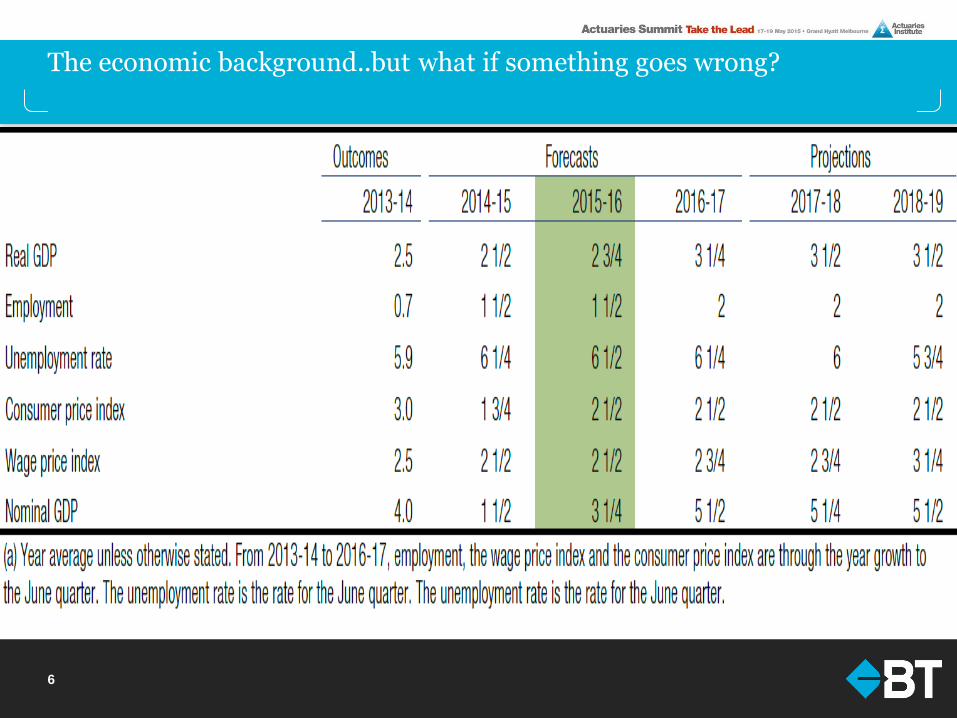
The economic background..but what if something goes wrong?
6
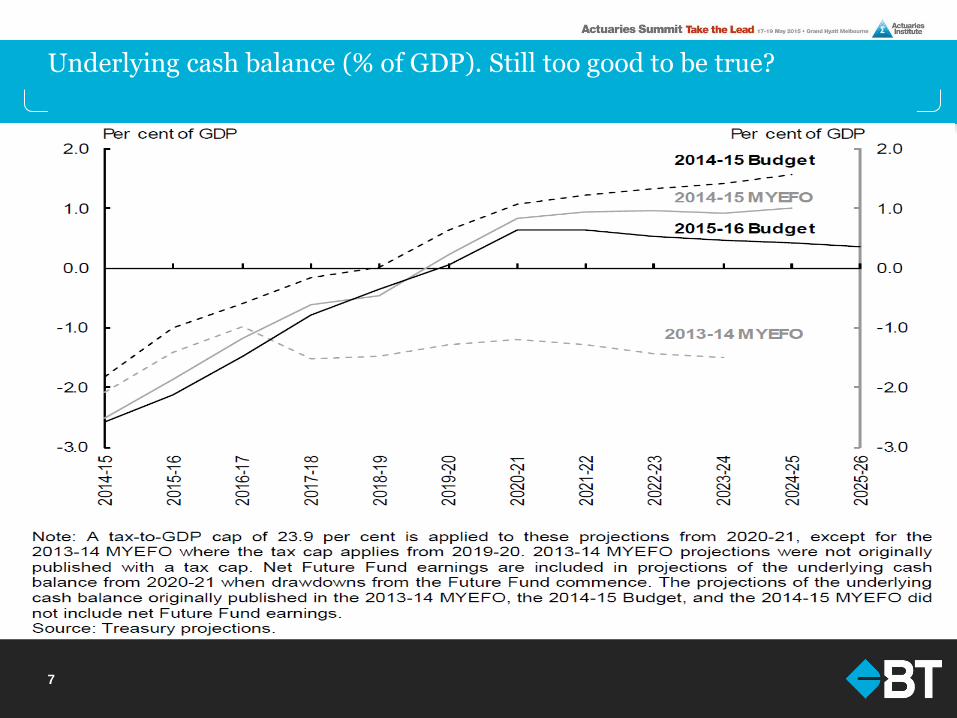
Underlying cash balance (% of GDP). Still too good to be true?
7
8
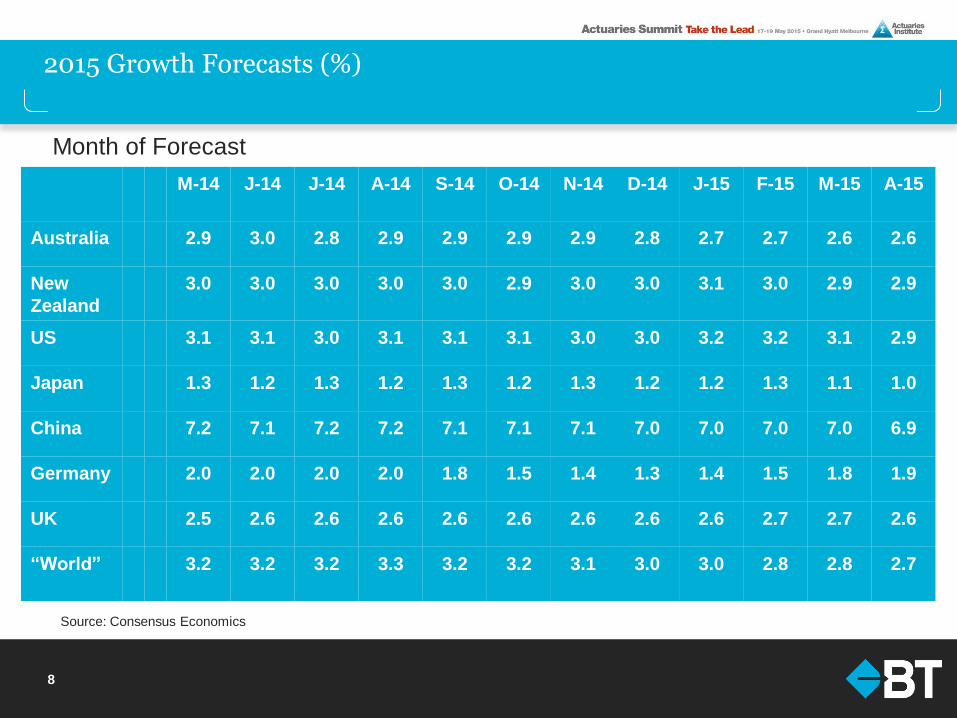
2015 Growth Forecasts (%)
Month of Forecast
M-14 J-14 J-14 A-14 S-14
O-14 N-14 D-14 J-15 F-15 M-15 A-15
Australia 2.9 3.0 2.8 2.9 2.9 2.9 2.9 2.8 2.7 2.7 2.6 2.6
New
Zealand
3.0 3.0 3.0 3.0 3.0 2.9 3.0 3.0 3.1 3.0 2.9 2.9
US 3.1 3.1 3.0 3.1 3.1 3.1 3.0 3.0 3.2 3.2 3.1 2.9
Japan 1.3 1.2 1.3 1.2 1.3 1.2 1.3 1.2 1.2 1.3 1.1 1.0
China 7.2 7.1 7.2 7.2 7.1 7.1 7.1 7.0 7.0 7.0 7.0 6.9
Germany 2.0 2.0 2.0 2.0 1.8 1.5 1.4 1.3 1.4 1.5 1.8 1.9
UK 2.5 2.6 2.6 2.6 2.6 2.6 2.6 2.6 2.6 2.7 2.7 2.6
“World” 3.2 3.2
3.2 3.3 3.2 3.2 3.1 3.0 3.0 2.8 2.8 2.7
Source: Consensus Economics
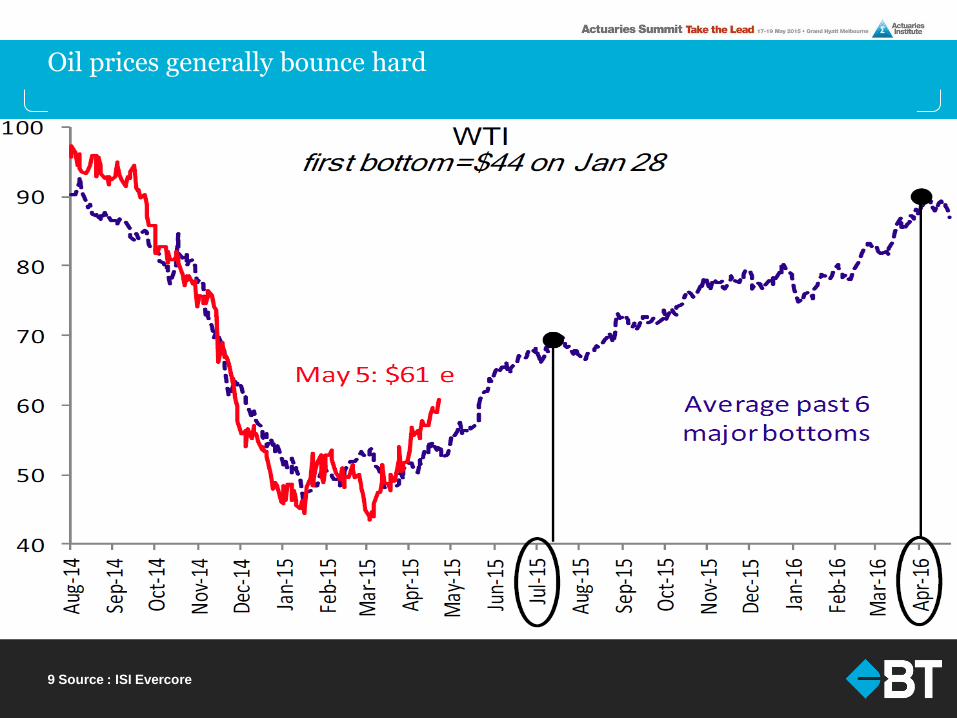
Oil prices generally bounce hard
9 Source : ISI Evercore
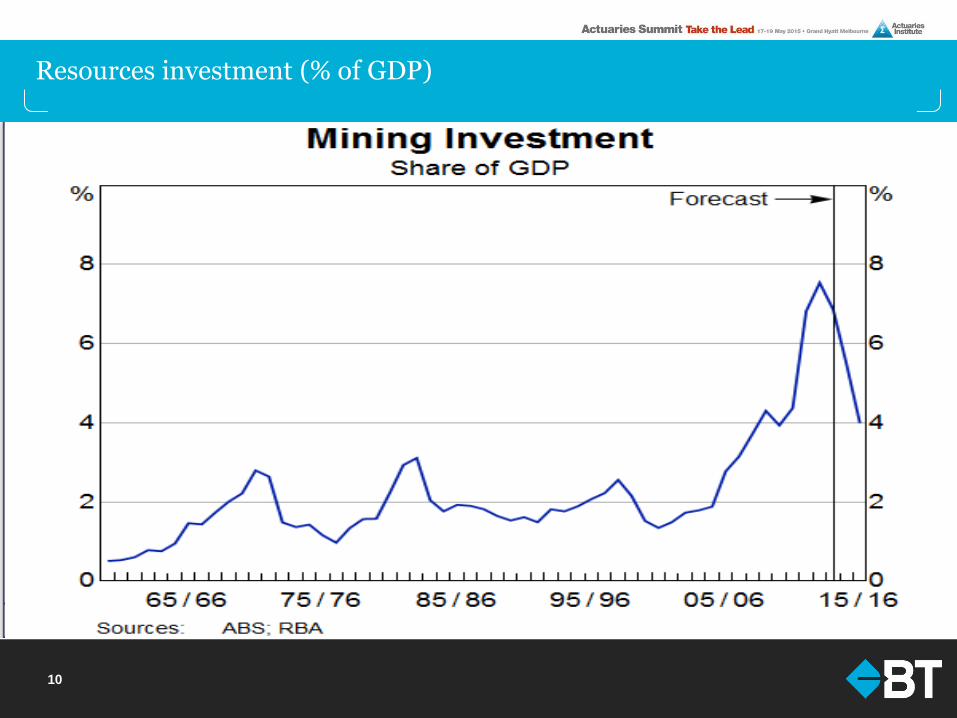
Resources investment (% of GDP)
10
11
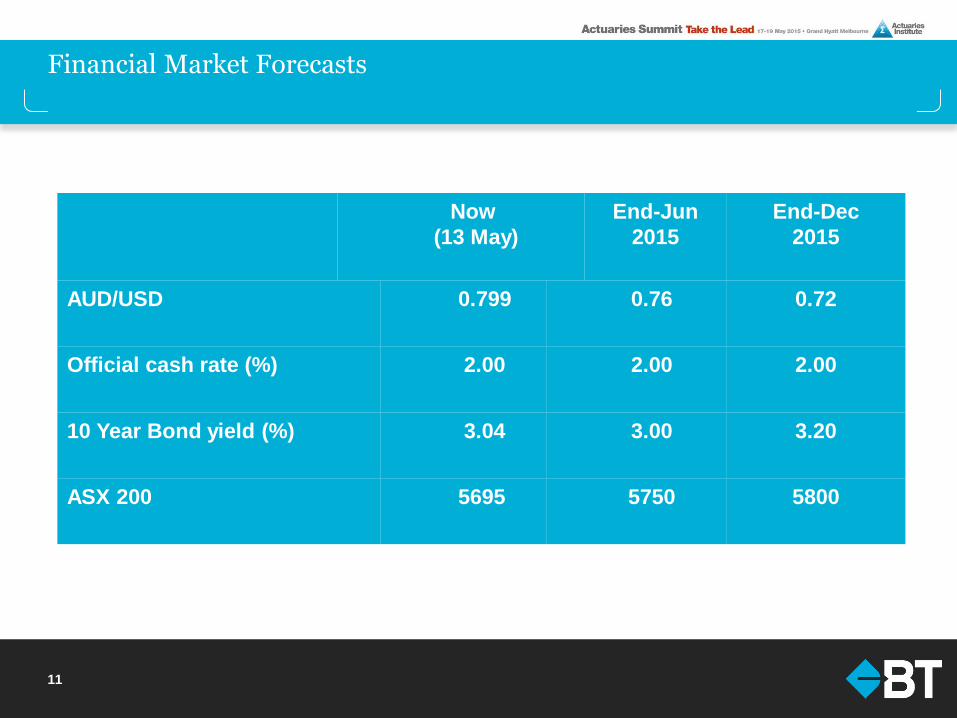
Financial Market Forecasts
Now
(13 May)
End-Jun
2015
End-Dec
2015
AUD/USD 0.799
0.76 0.72
Official cash rate (%) 2.00
2.00 2.00
10 Year Bond yield (%) 3.04
3.00 3.20
ASX 200 5695
5750 5800
12
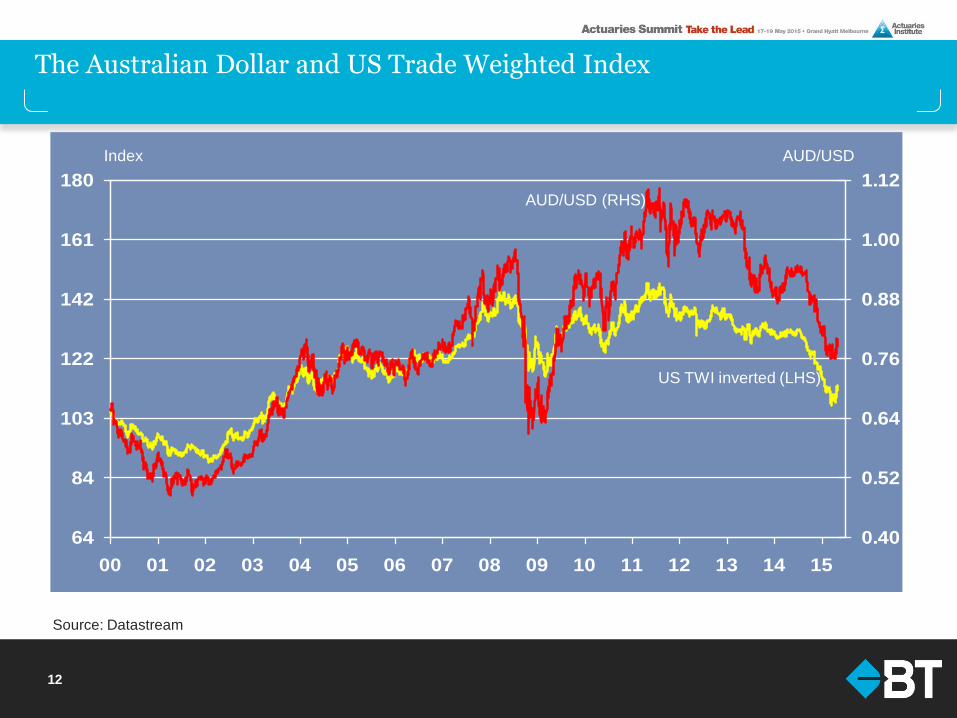
The Australian Dollar and US Trade Weighted Index
Source: Datastream
64
84
103
122
142
161
180
00 01 02 03 04 05 06 07 08 09 10 11 12 13 14 15
0.40
0.52
0.64
0.76
0.88
1.00
1.12
Index AUD/USD
US TWI inverted (LHS)
AUD/USD (RHS)
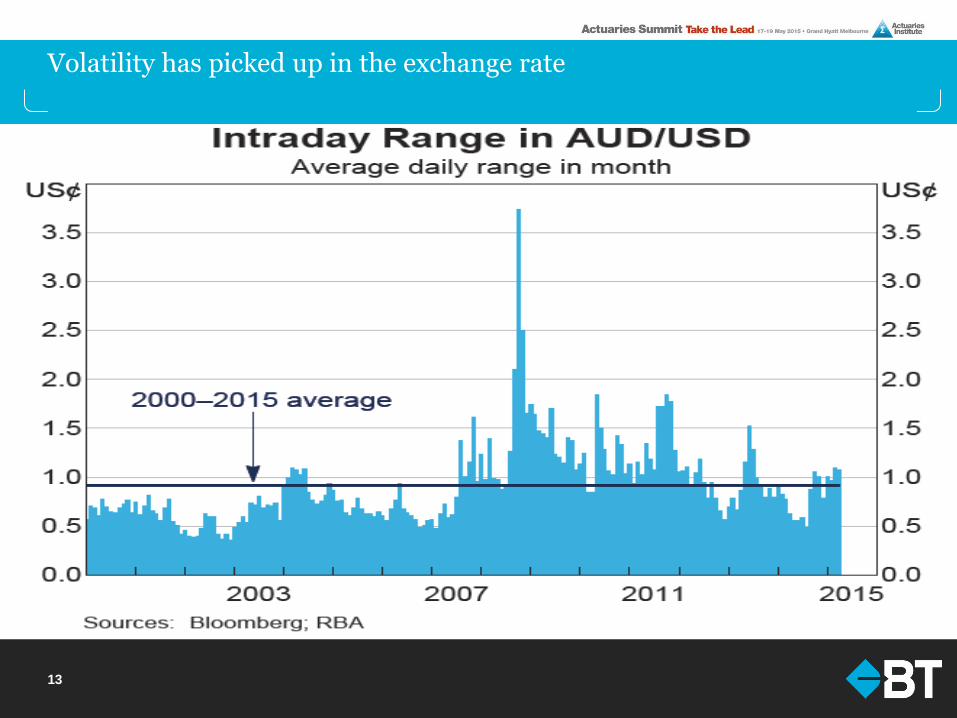
Volatility has picked up in the exchange rate
13
14
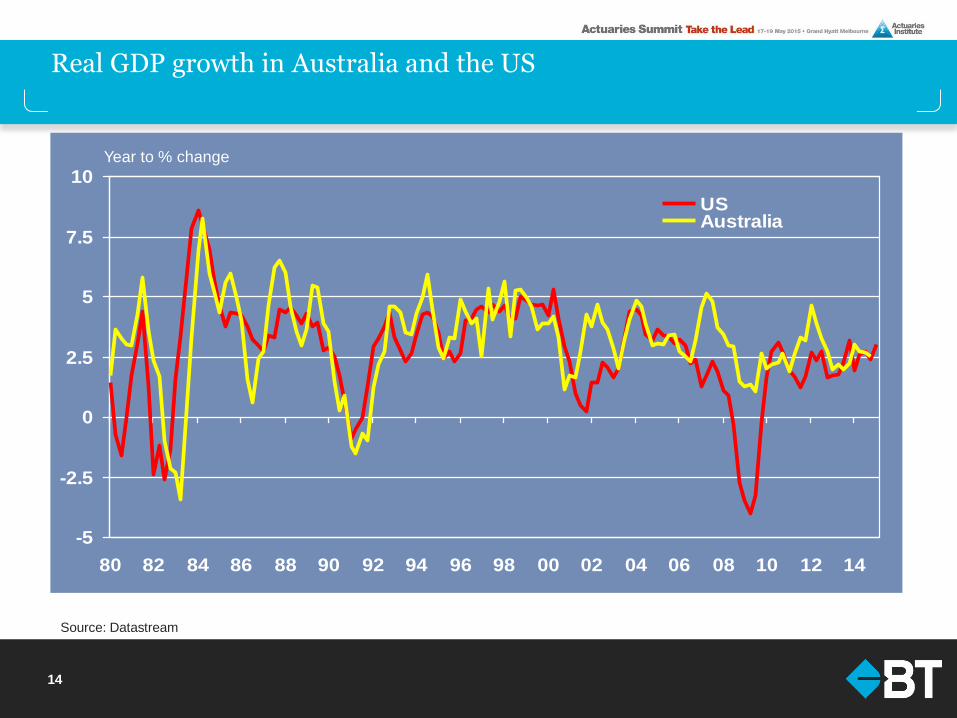
Real GDP growth in Australia and the US
Source: Datastream
-5
-2.5
0
2.5
5
7.5
10
80 82 84 86 88 90 92 94 96 98 00 02 04 06 08 10 12 14
USAustralia
Year to % change
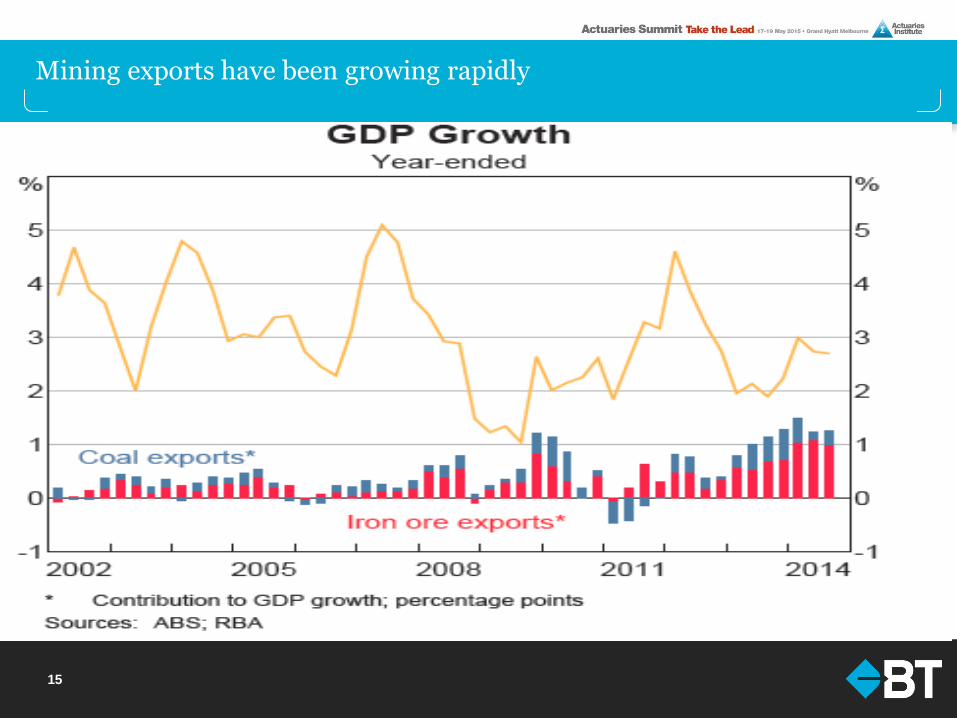
Mining exports have been growing rapidly
15
16
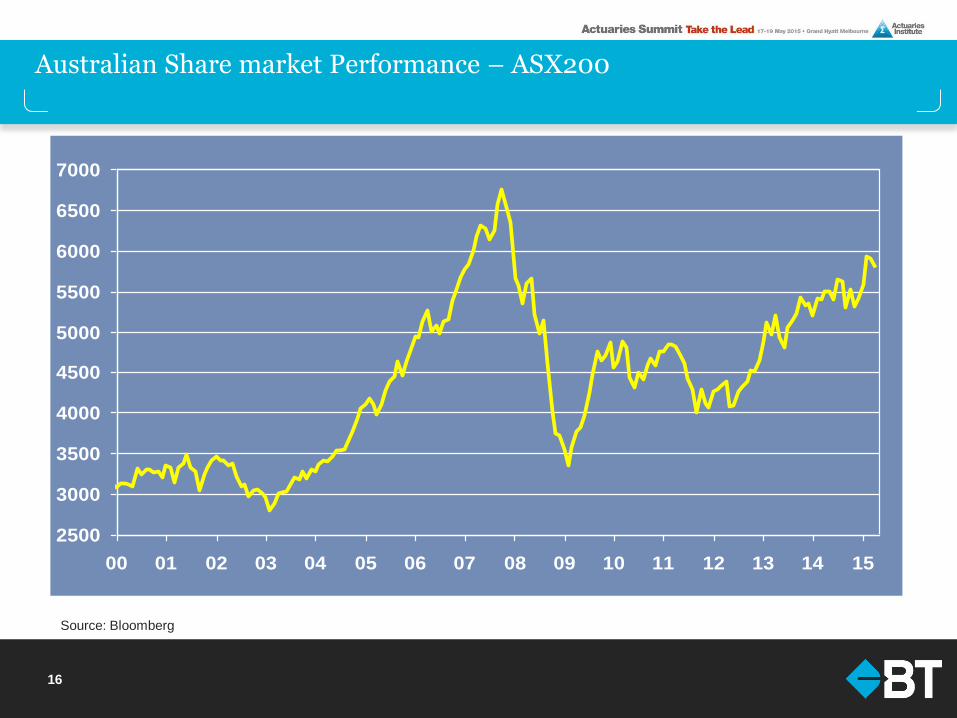
Australian Share market Performance – ASX200
Source: Bloomberg
2500
3000
3500
4000
4500
5000
5500
6000
6500
7000
00 01 02 03 04 05 06 07 08 09 10 11 12 13 14 15
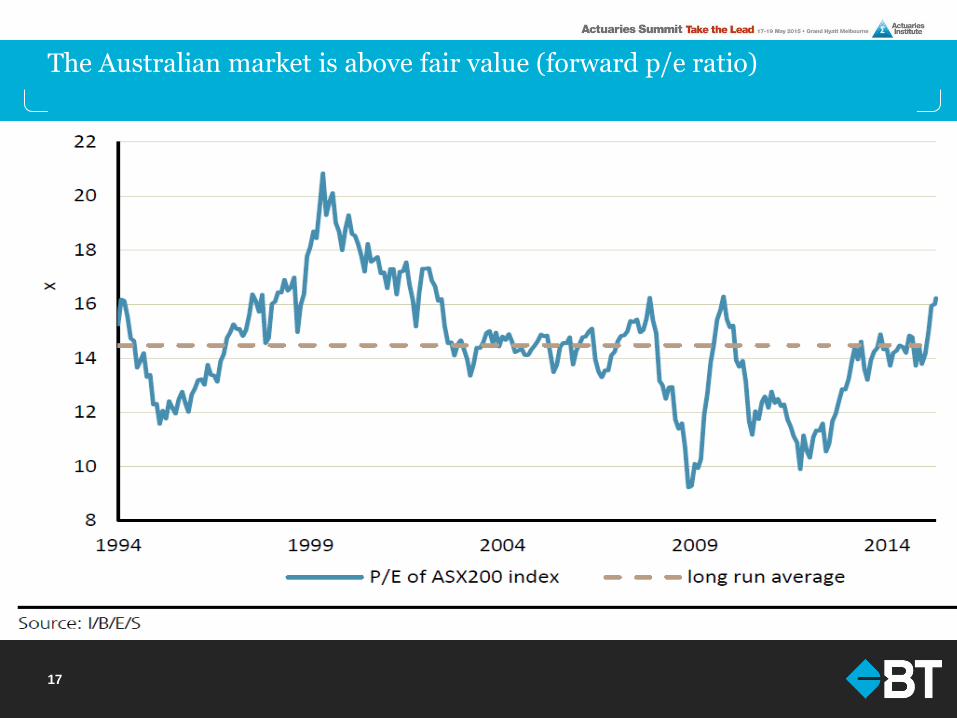
The Australian market is above fair value (forward p/e ratio)
17
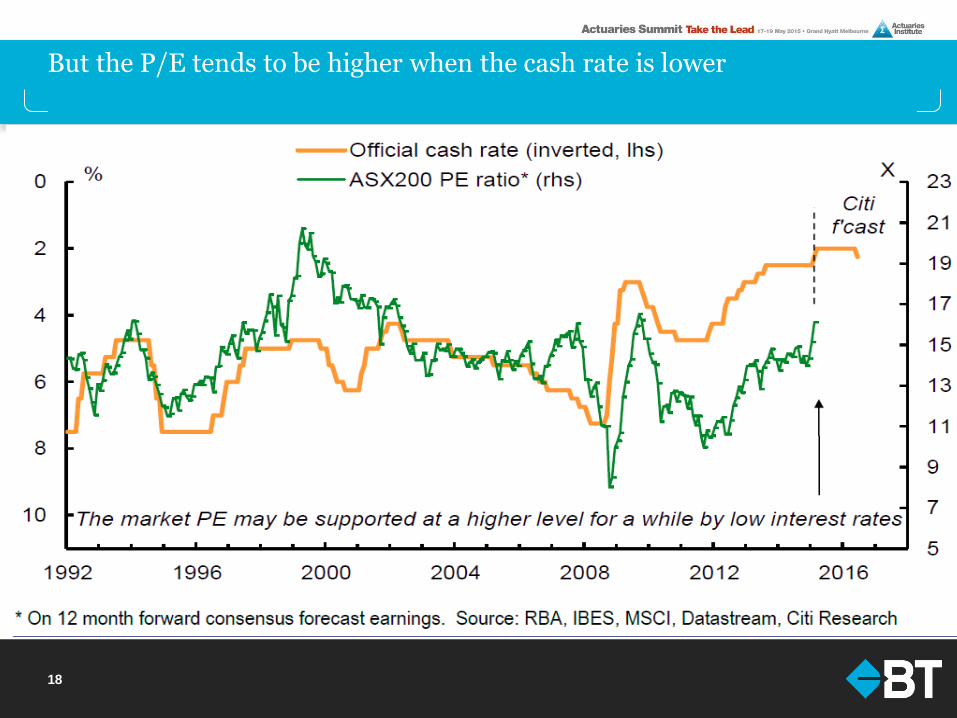
But the P/E tends to be higher when the cash rate is lower
18
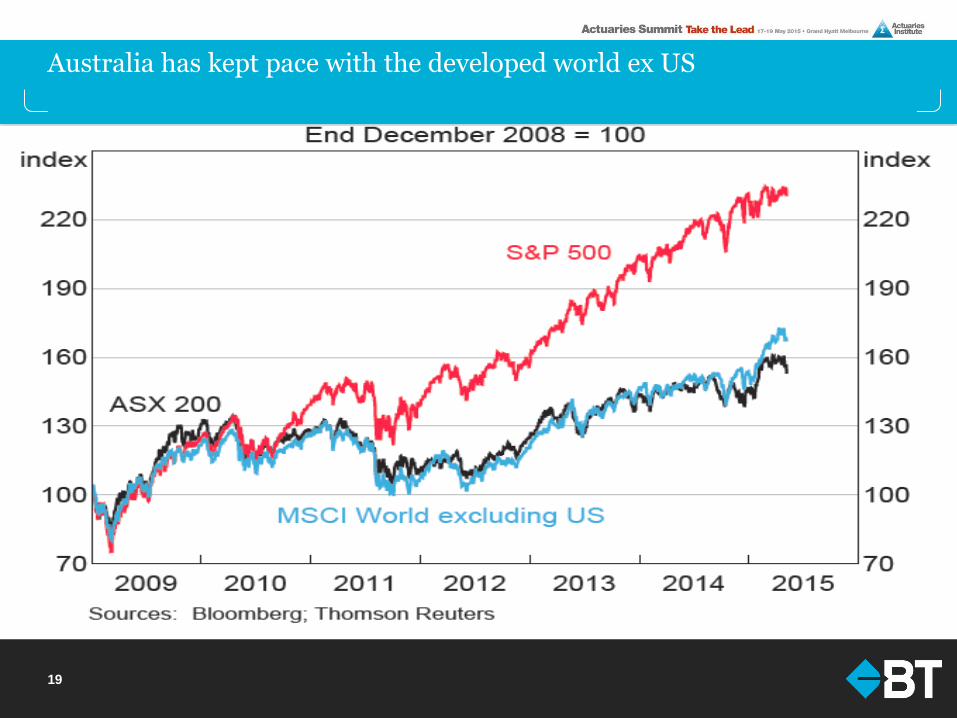
Australia has kept pace with the developed world ex US
19
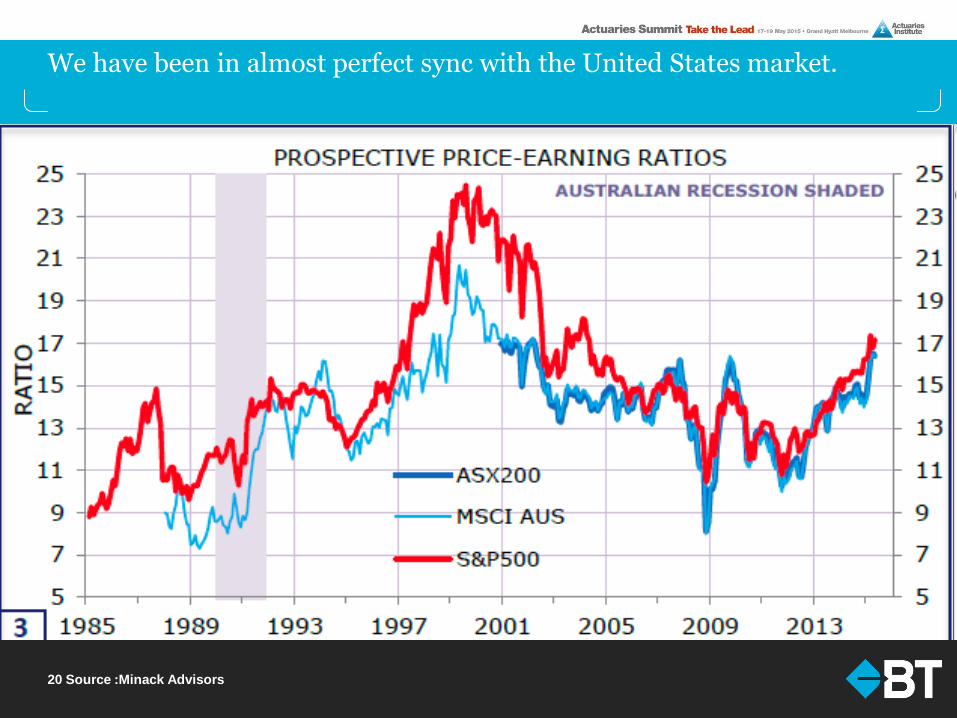
We have been in almost perfect sync with the United States market.
20 Source :Minack Advisors
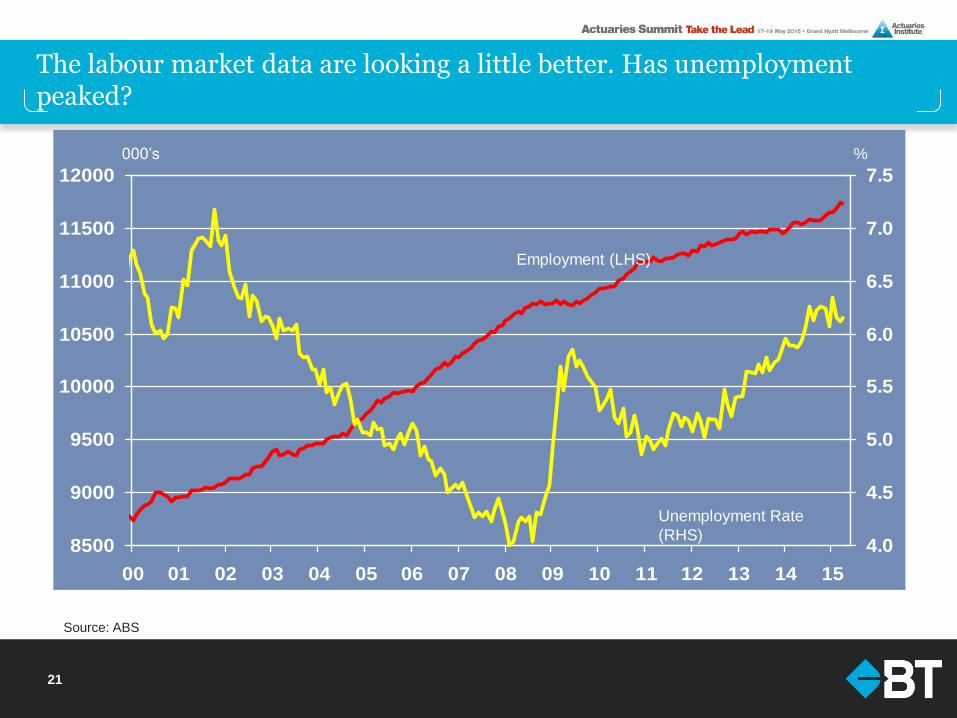
21
The labour market data are looking a little better. Has unemployment peaked?
Source: ABS
8500
9000
9500
10000
10500
11000
11500
12000
00 01 02 03 04 05 06 07 08 09 10 11 12 13 14 15
4.0
4.5
5.0
5.5
6.0
6.5
7.0
7.5
000’s %
Employment (LHS)
Unemployment Rate
(RHS)
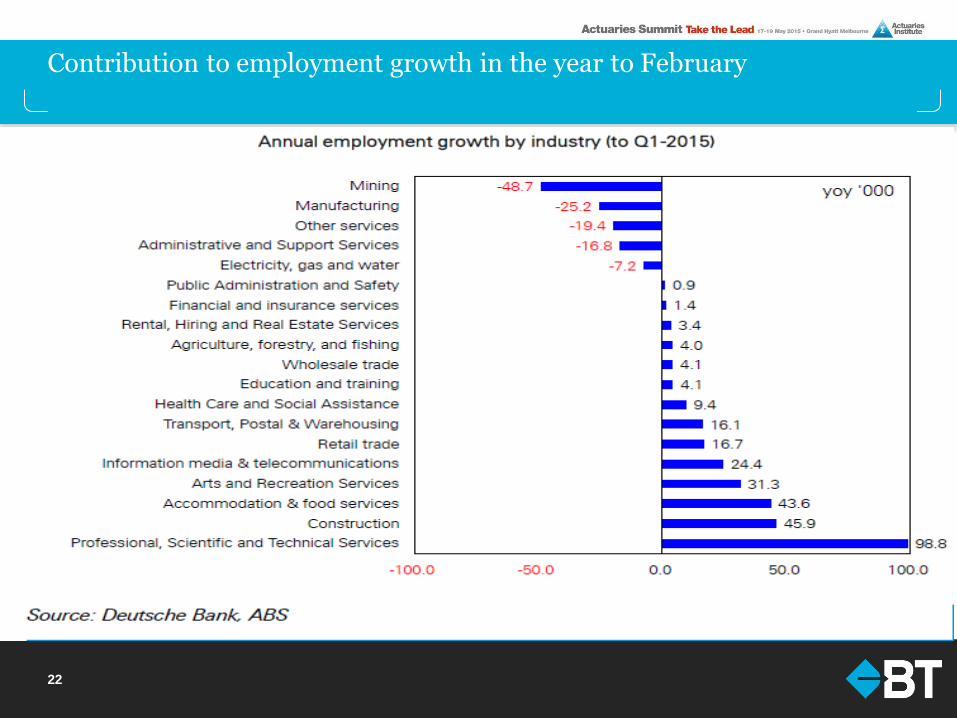
Contribution to employment growth in the year to February
22
23
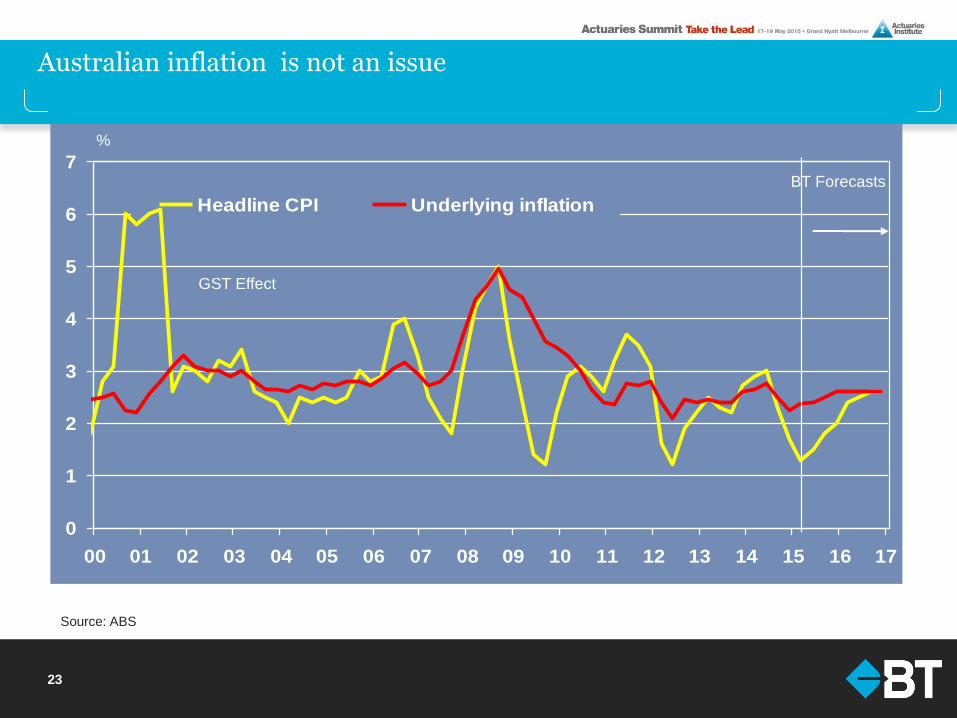
Australian inflation is not an issue
Source: ABS
0
1
2
3
4
5
6
7
00 01 02 03 04 05 06 07 08 09 10 11 12 13 14 15 16 17
Headline CPI Underlying inflation
%
BT Forecasts
GST Effect
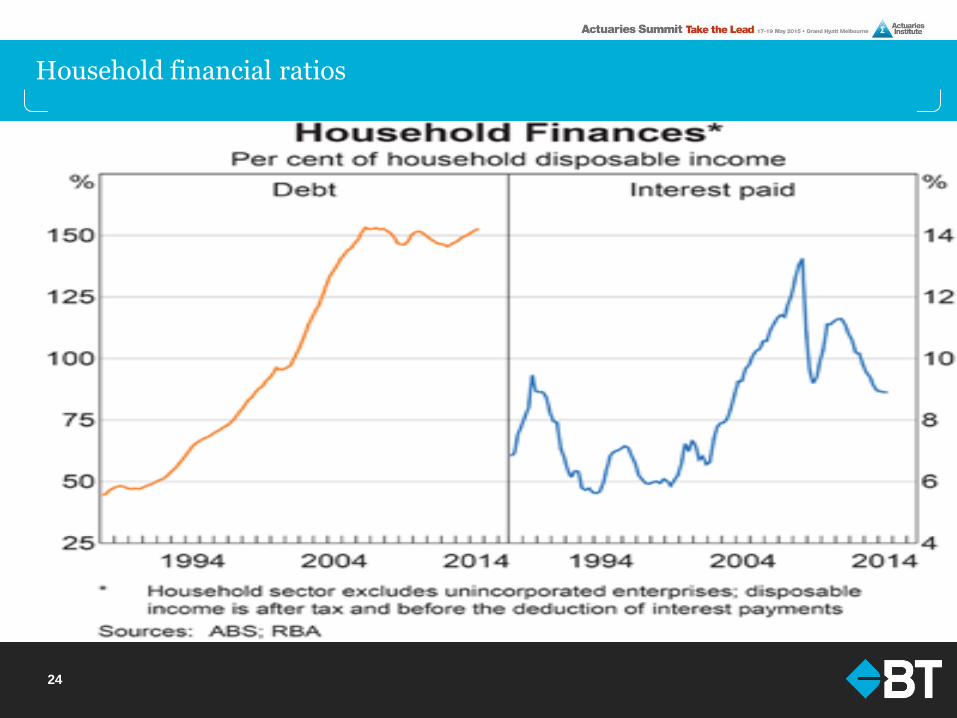
Household financial ratios
24
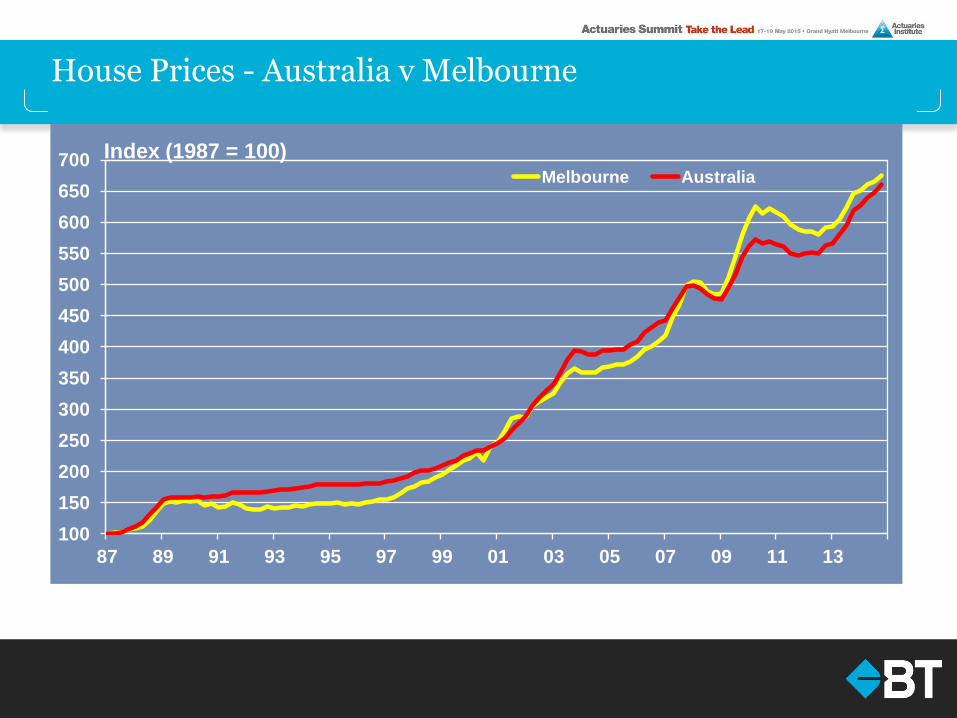
House Prices - Australia v Melbourne
Source: ABS
100
150
200
250
300
350
400
450
500
550
600
650
700
87 89 91 93 95 97 99 01 03 05 07 09 11 13
Melbourne Australia
Index (1987 = 100)
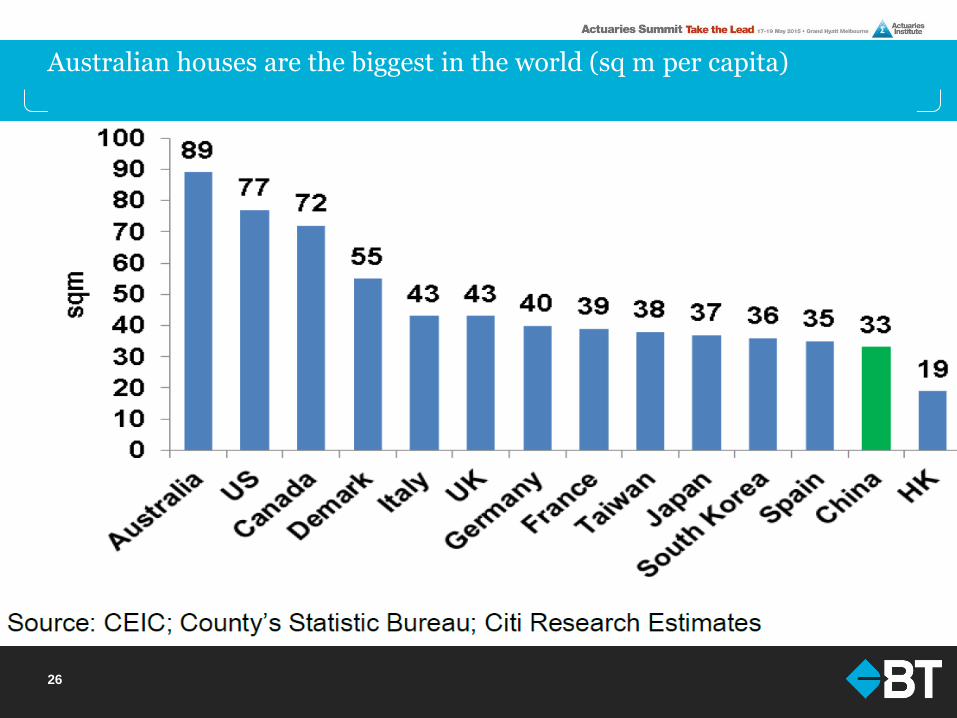
Australian houses are the biggest in the world (sq m per capita)
26
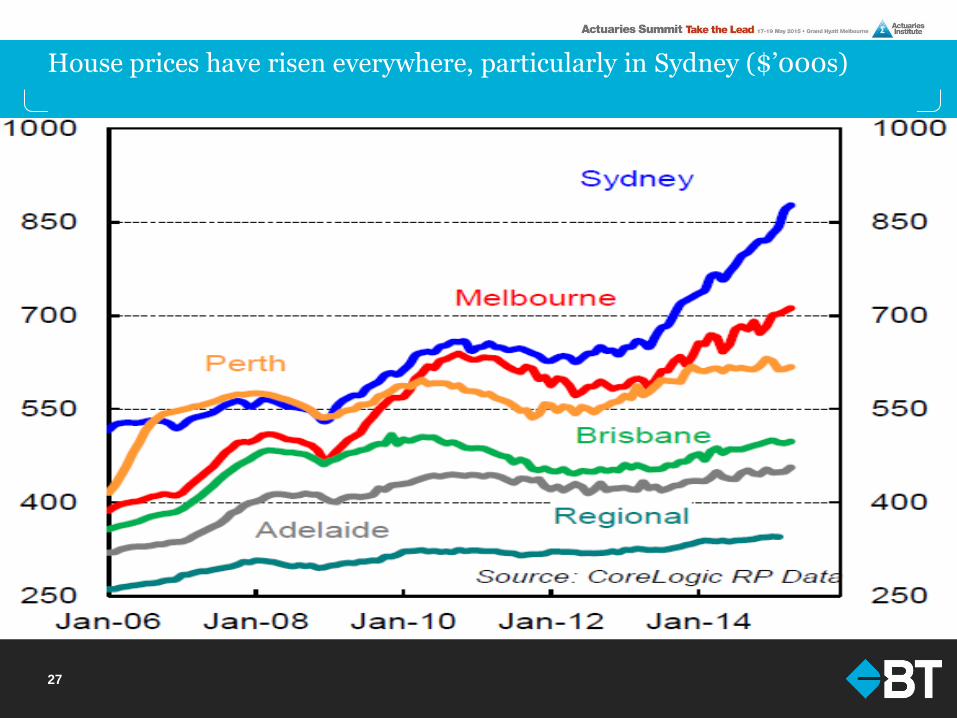
House prices have risen everywhere, particularly in Sydney ($’000s)
27
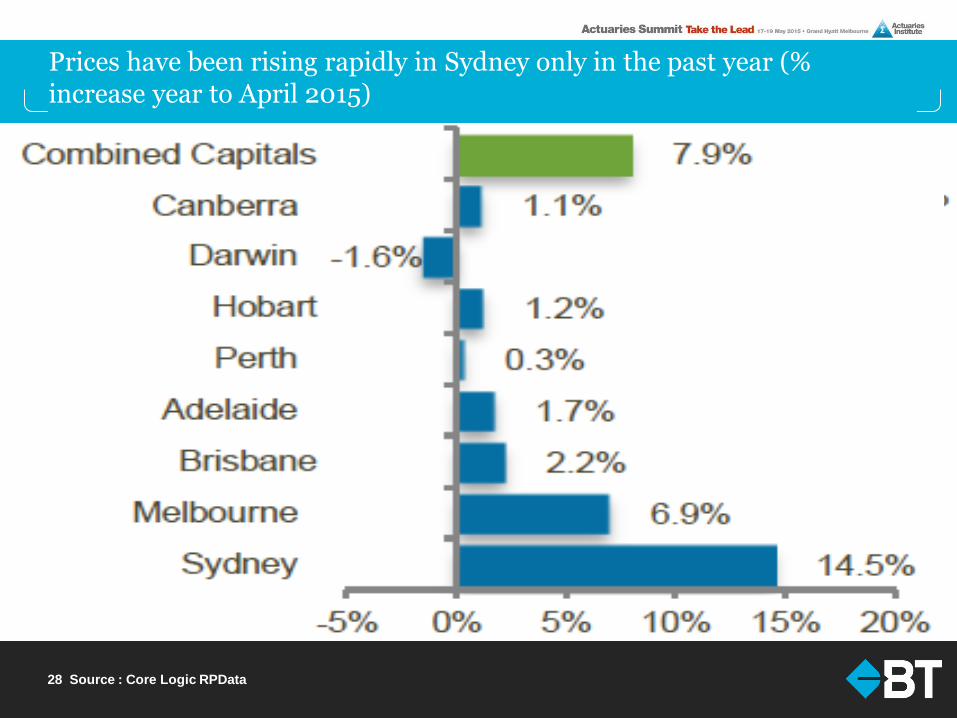
Prices have been rising rapidly in Sydney only in the past year (% increase year to April 2015)
28 Source : Core Logic RPData
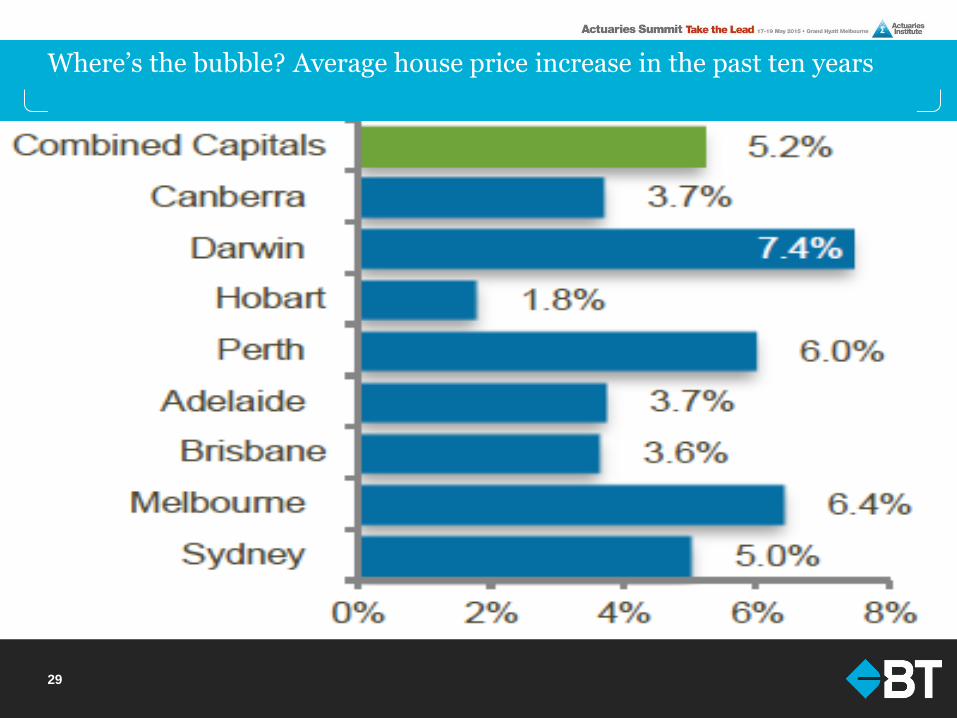
Where’s the bubble? Average house price increase in the past ten years
29
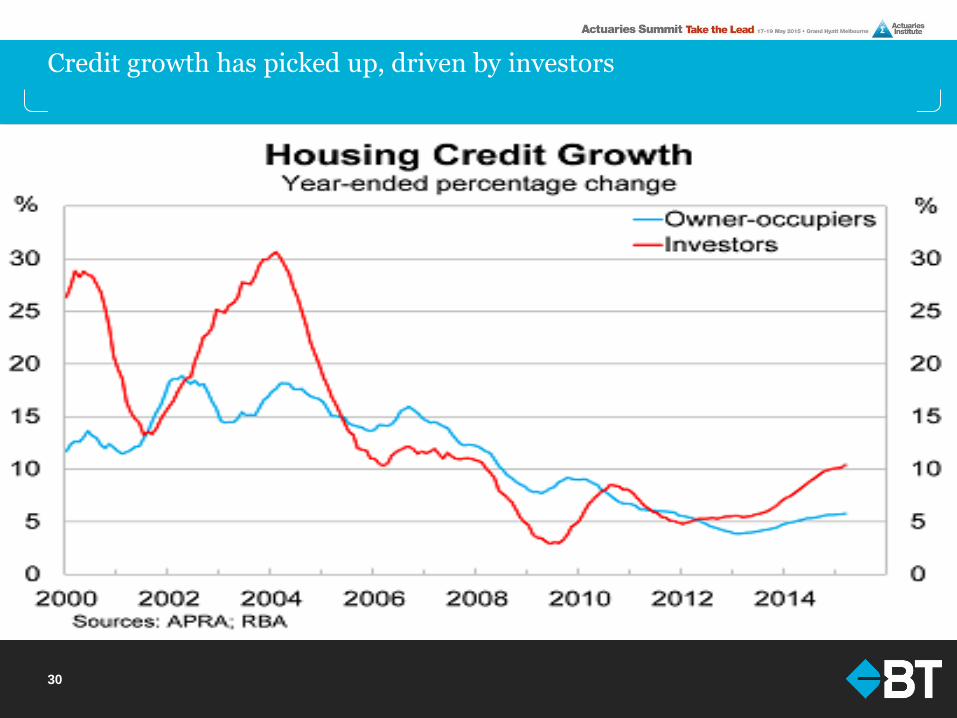
Credit growth has picked up, driven by investors
30
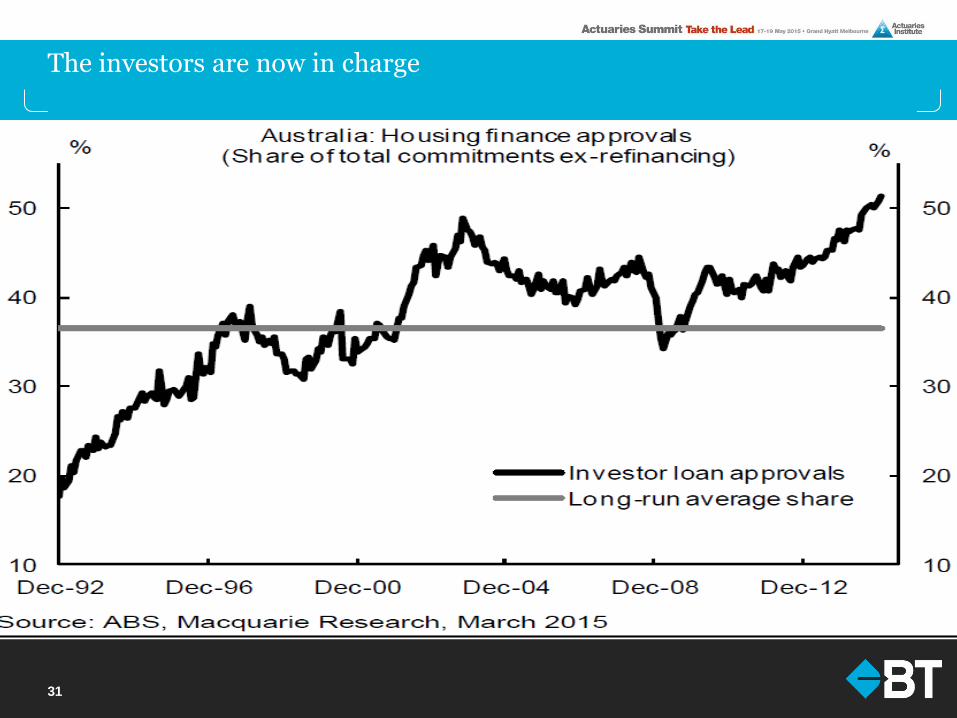
The investors are now in charge
31
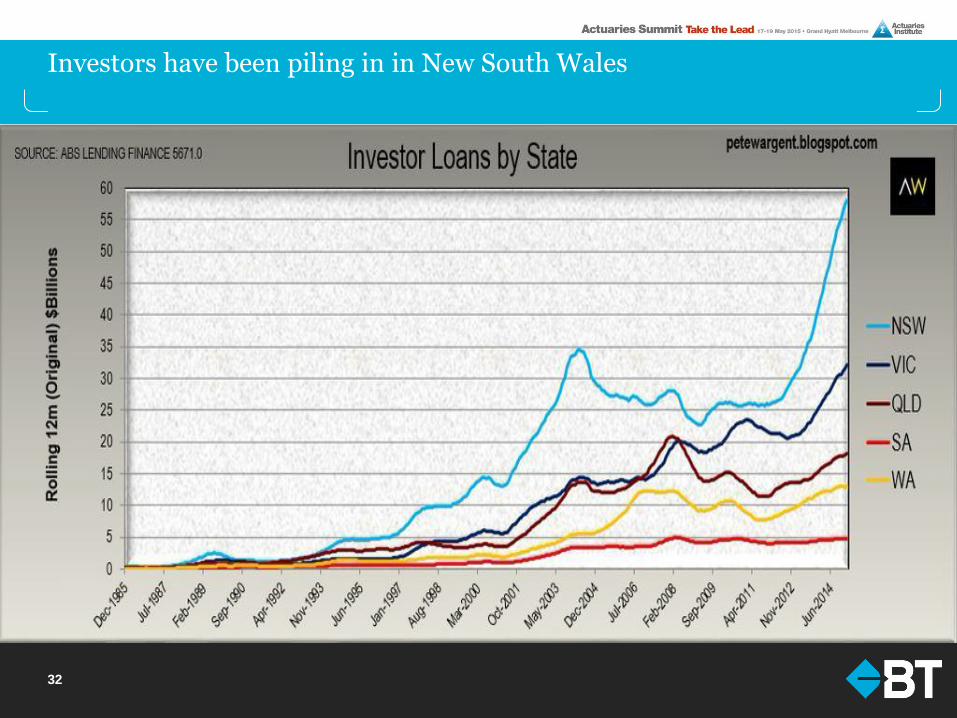
Investors have been piling in in New South Wales
32
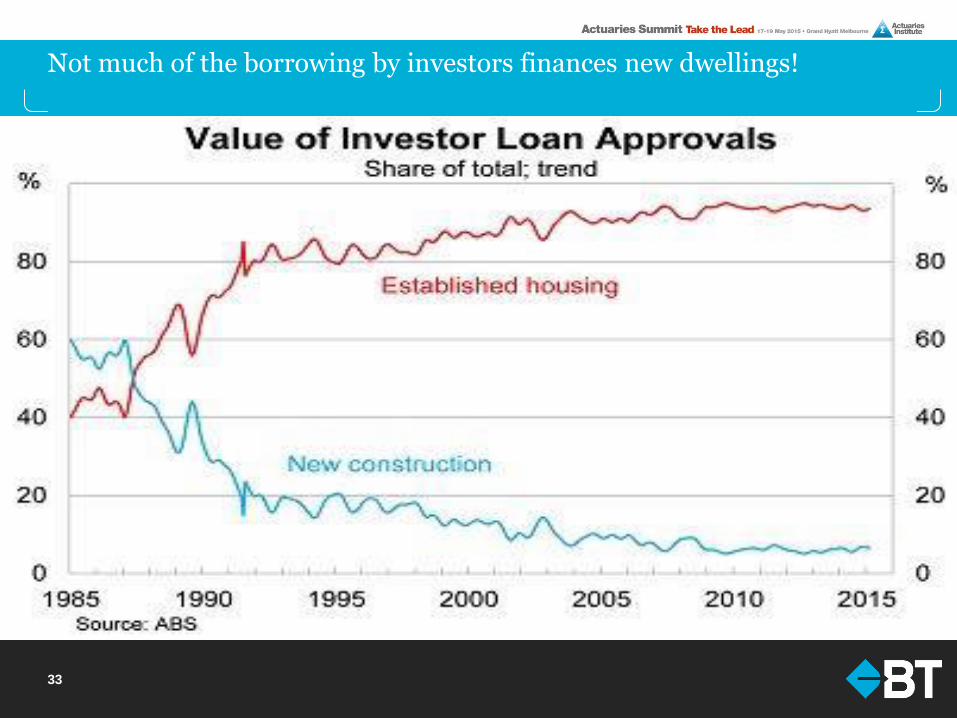
Not much of the borrowing by investors finances new dwellings!
33
34
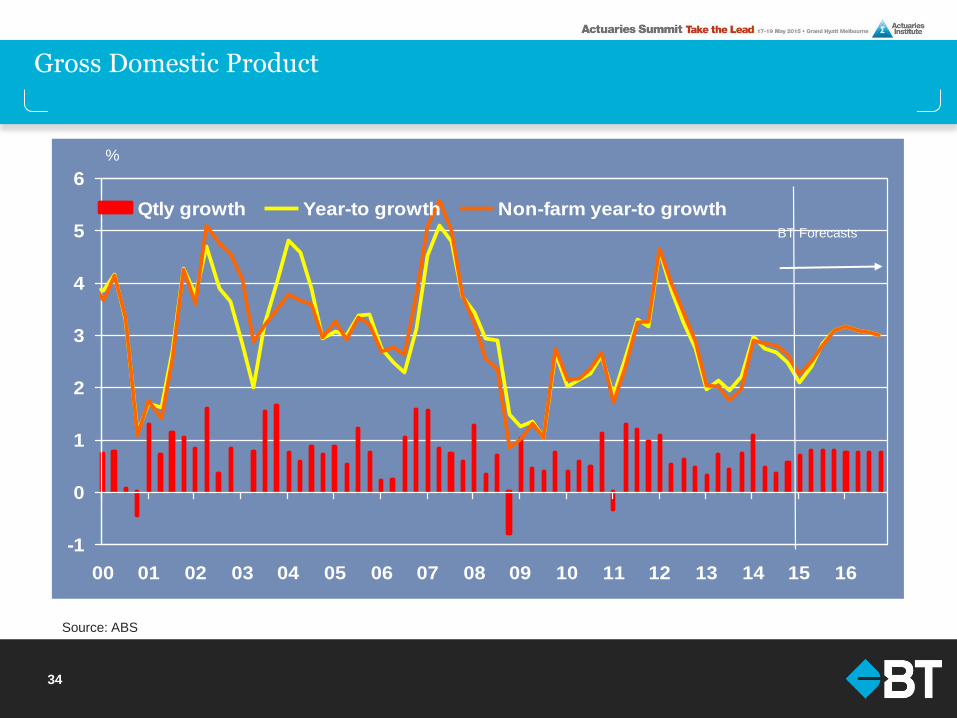
Gross Domestic Product
Source: ABS
-1
0
1
2
3
4
5
6
00 01 02 03 04 05 06 07 08 09 10 11 12 13 14 15 16
Qtly growth Year-to growth Non-farm year-to growth
%
BT Forecasts
35 Source Consensus Economics Ss: Consensus Economics
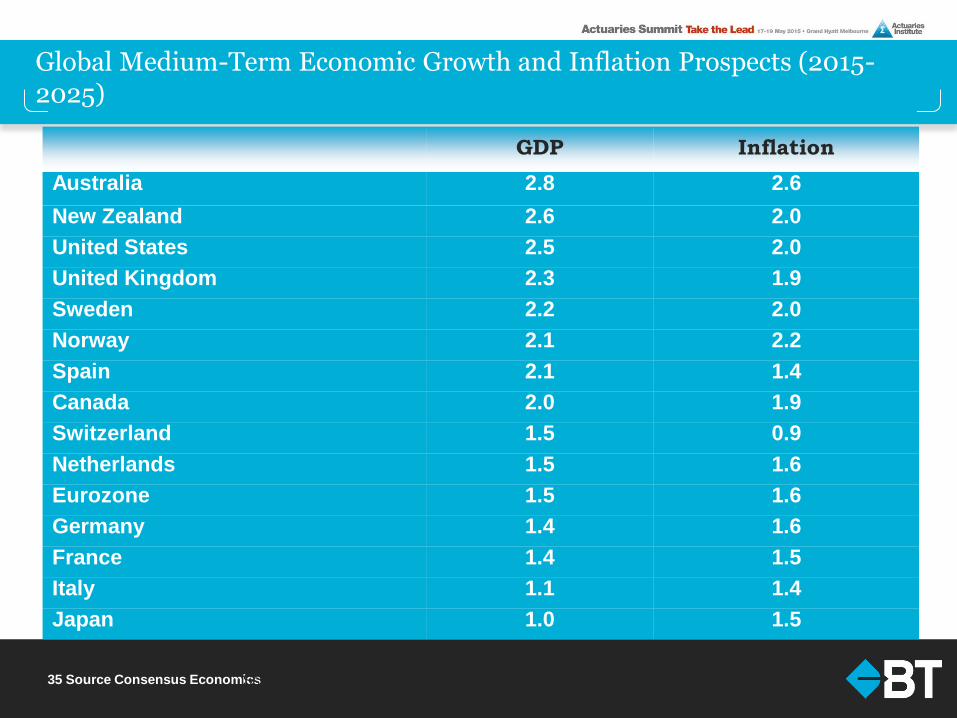
GDP Inflation
Australia 2.8 2.6
New Zealand 2.6 2.0
United States 2.5 2.0
United Kingdom 2.3 1.9
Sweden 2.2 2.0
Norway 2.1 2.2
Spain 2.1 1.4
Canada 2.0 1.9
Switzerland 1.5 0.9
Netherlands 1.5 1.6
Eurozone 1.5 1.6
Germany 1.4 1.6
France 1.4 1.5
Italy 1.1 1.4
Japan 1.0 1.5
Global Medium-Term Economic Growth and Inflation Prospects (2015-2025)
36
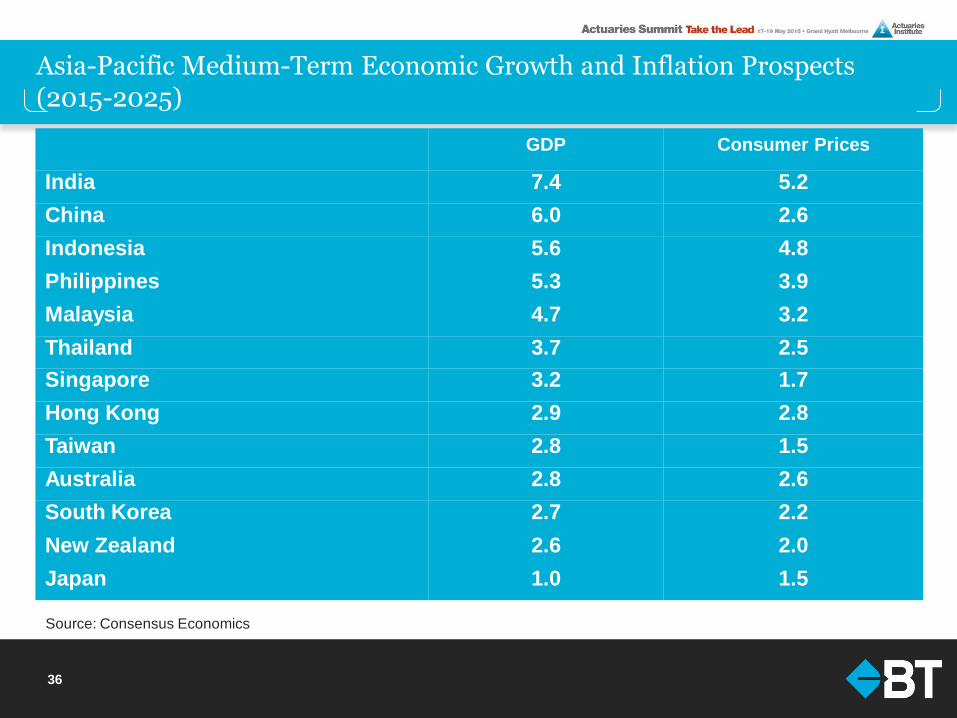
Asia-Pacific Medium-Term Economic Growth and Inflation Prospects (2015-2025)
GDP Consumer Prices
India 7.4 5.2
China 6.0 2.6
Indonesia 5.6 4.8
Philippines 5.3 3.9
Malaysia 4.7 3.2
Thailand 3.7 2.5
Singapore 3.2 1.7
Hong Kong 2.9 2.8
Taiwan 2.8 1.5
Australia 2.8 2.6
South Korea 2.7 2.2
New Zealand 2.6 2.0
Japan 1.0 1.5
Source: Consensus Economics
37
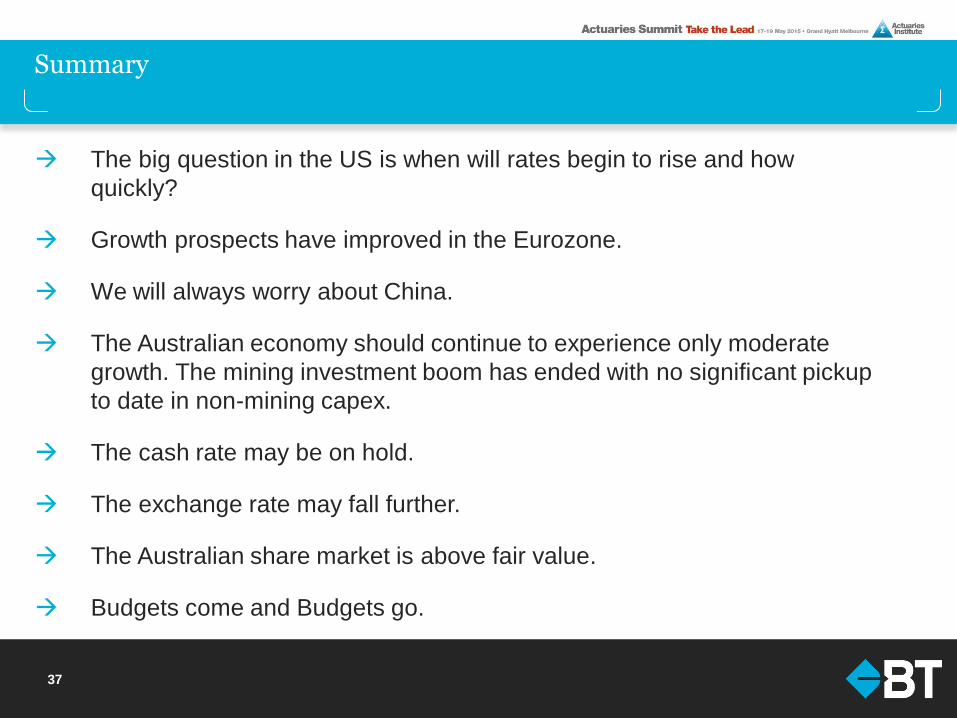
Summary
The big question in the US is when will rates begin to rise and how
quickly?
Growth prospects have improved in the Eurozone.
We will always worry about China.
The Australian economy should continue to experience only moderate
growth. The mining investment boom has ended with no significant pickup
to date in non-mining capex.
The cash rate may be on hold.
The exchange rate may fall further.
The Australian share market is above fair value.
Budgets come and Budgets go.
Disclaimer
This presentation has been prepared by BT Financial Group Limited (ABN 63 002 916 458) ‘BT’ and is for
general information only. Every effort has been made to ensure that it is accurate, however it is not
intended to be a complete description of the matters described. The presentation has been prepared
without taking into account any personal objectives, financial situation or needs. It does not contain and is
not to be taken as containing any securities advice or securities recommendation. Furthermore, it is not
intended that it be relied on by recipients for the purpose of making investment decisions and is not a
replacement of the requirement for individual research or professional tax advice. BT does not give any
warranty as to the accuracy, reliability or completeness of information which is contained in this
presentation. Except insofar as liability under any statute cannot be excluded, BT and its directors,
employees and consultants do not accept any liability for any error or omission in this presentation or for
any resulting loss or damage suffered by the recipient or any other person. Unless otherwise noted, BT is
the source of all charts; and all performance figures are calculated using exit to exit prices and assume
reinvestment of income, take into account all fees and charges but exclude the entry fee. It is important to
note that past performance is not a reliable indicator of future performance.
This document was accompanied by an oral presentation, and is not a complete record of the discussion
held.
No part of this presentation should be used elsewhere without prior consent from the author.
For more information, please call BT Customer Relations on 132 135 8:00am to 6:30pm (Sydney time)
38