Embed Size (px)
Citation preview

A global overview prepared by
Susan Schneegans, Editor, UNESCO Science Report 2010

The democratization of scienceTechnological progress and the rapid spread of Internet is allowing countries to produce/use more knowledge Cheap, easy access to digital technologies (mobile phones, broadband, Internet)has accelerated the diffusion of knowledge and technologies and facilitated international research networking. Internet access rose between 2002 and 2008:• Worldwide: 11% →24% • Developed countries: 38% → 62% • Developing countries: 5% →17% (Cuba: 4% → 13%).
Countries with a lesser scientific capacity are finding they can acquire, adopt and transform technology and thereby avoid certain costly investments.
More countries are playing by the same set of rulesThanks to their newfound economic weight and to broader membership of global institutional
frameworks (e.g. China joined the World Trade Organization in 2001), the newly industrializing countries of the G20 are challenging:
• existing rules with regard to trade, investment and intellectual property rights;• the traditional dominance of the EU, Japan and USA for investment in R&D.
Within countries, greater interest in developing a “science culture” and broadening S&T participation e.g. Rep. of Korea: science popularization via TV, science literacy portal; government disseminates
information via newsletter

The internationalization of scienceThis trend is being fostered by:
• Greater access to Internet;• Greater recourse to “science diplomacy”;• The cost of megaprojects (e.g. International Space Station, ITER);• The desire to conquer new markets via international business consortia (e.g. Airbus);• The implantation of R&D centres overseas by multinationals (facilitated by new digital
technologies);• The cross-border nature of many problems (e.g. pandemics; climate change, environmental
degradation) • Emerging economies are seeking to attract highly skilled research personnel from abroad • e.g. China is wooing expatriates and foreign experts• The growing economic might of Brazil, China, India, South Africa and others is enabling them to
invest in high-tech companies in developed countries. e.g. when Tata Steel took over the British steel giant Corus (2007) it did not hold a single
American patent. The takeover brought over 80 patents and almost 1 000 research staff.
This two-way flow of information, knowledge, technology, investment and personnel is leading to:
• stronger research collaboration (more international co-authorship, more partnerships)• a more competitive environment.

A growing emphasis in STI policy on sustainability and
green technologies• A global trend;• ICTs, biotechnologies,
nanotechnologies remain common R&D priorities ;
• Clean energy and climate research two emerging R&D priorities;
• Disaster forecasting/monitoring a growing priority
• Space science and technology becoming a focus of international collaboration, as developing countries seek to monitor their territory more closely, often via North–South or South–South collaboration.

R&D remains dominated by a minority of countries.
Is the gap narrowing between developed and developing countries?• Yes: 83% of R&D was conducted in the developed countries in 2002, • 76% in 2007;• BUT R&D remains unevenly distributed. The Big Five – China, the
European Union, Japan, the Russian Federation and the USA – represent:• one-third of the world population but • three-quarters of the world’s researchers and• three-quarters of world expenditure on R&D (GERD).
R&D is unevenly distributed within countries, both developed and developing:• In Brazil, 40% of GERD is spent in the São Paulo region;• South Africa’s Gauteng Province: 51% of GERD;• In the USA, 59% of R&D was performed in 10 out of 50 states in 2005,
one-fifth in California alone.

We are seeing a shift in global influence.
An unprecedented cycle of economic growth (1996-2007) fuelled a spending spree in R&D between 2002 and 2007:
• world GDP rose by 43%;• world expenditure on R&D rose by 45%;• Global R&D intensity (GERD/GDP ratio) remained stationary: 1.7%.• In Brazil, R&D intensity progressed more slowly than the economy overall.
Behind this apparent stability in R&D effort, a lot has changed, driven by Asia:• Thanks largely to China (+3.9% world share), India (+ 0.6%) and the
Republic of Korea (+0.8%), Asia’s share of world GERD rose from 27% to 32% between 2002 and 2007.
• This came at the expense of Europe, North America and Japan, the traditional leaders of science (Japan’s share: 13.7% → 12.9%).
• China and the Republic of Korea are beginning to emulate the US/Japan model of a higher world share of GERD than of GDP (see next slide).


The rise of China is spectacular.GERDBetween 2002 and 2007: China’s contribution to world GERD rose: 5.0% → 8.9% • China’s GERD: PPP $39 billion → PPP $ 102 billion
Between 2002 and 2008: China’s R&D effort climbed by 50%: 1.07% → 1.54% (2008). China plans to carry its GERD/GDP ratio to 2.5% by 2020. In comparison:
• Argentina: 0.44% → 0.51% (2007) • Brazil: 0.99% → 1.09%• Mexico: 0.37% → 0.37% (2007)• India: 0.81% → 0.88%; • Republic of Korea: 2.40% →3.37%• South Africa: 0.73 → 0.93% (2001 and 2007)
ResearchersBetween 2002 and 2008, China doubled the number of researchers: 810 500 → 1.59 millioncompared to 1.43 million in USA (2006), which has four times the researcher density of China.PublicationsChina is second only to the USA for scientific articles recorded in the SCI. For citations (the impact factor), China is on a par with India.Technological impact“Today, the R&D intensity of high-tech industry remains much lower in China than in developed
countries” (Chapter on China).

Source: UNESCO Science Report 2010
World shares of GERD, 2002 and 2007 (%)
30,2
27,1 2,81,4
0,9
37,7

World shares of researchers, 2002 and 2007 (%)
Source: UNESCO Science Report 2010

Source: UNESCO Science Report 2010
World shares of publications, 2002 and 2008 (%)
45,5 24,2
3,23,8
1,634,2
42,530,7
3,44,9
2,0
31,1
2008

Business spending on R&D is growing fastest in Asia
Between 2000 and 2007, business spending progressed fastest in China, the Rep. of Korea, Singapore and Japan
• In China, 70.4% of spending on R&D is now financed by industry, close to Japan (77.7%) and the Rep. of Korea (73.7%).
• Business spending has grown in India but from a low starting point. (Private R&D funding accounted for the 10% rise to 0.88% GERD/GDP ratio by 2007.)
For the leading European countries, the situation remained stable• The exception is the Russian Federation, where the share of business spending on R&D is
declining. Generally speaking, the indicators for Russian science are stagnating.
The share of business spending on R&D has slipped in the USA.
• The pharmaceutical industry, one of the biggest spenders, was already stressed before the recession. Since the recession (2008), researchers in the private sector have been laid off.

Persistent inequality in private knowledge production

• China plans to raise GERD as a share of GDP from 1.54% (2008) to 2.5% by 2020, within its Outline of the Medium- and Long-Term Plan for National Science and Technology Development (2006–2020).
• China plans to recruit 2000 foreigners in the next 5–10 years to work in its laboratories, research institutes, leading enterprises and universities via its Recruitment Programme of Global Experts, known as the Thousand Talents Programme.
• Nigeria plans to join the world’s top 20 most powerful economies by 2020 by attaining a GERD/GDP ratio comparable to that of the 20 leading developed economies (Nigeria Vision 20:20), see page 309.
• The Republic of Korea plans to become one of seven major powers in S&T by 2012 through creative technological innovation. One of its top priorities is to raise the GERD/GDP ratio to 5% by 2012.
• In the USA, the Obama administration announced plans in April 2009 to increase GERD from 2.7% to 3% of GDP.
• In 2006, Qatar implemented a five-year plan to increase GERD from 0.33% to 2.8%.
• Brazil plans to raise R&D expenditure from 1.07% of GDP in 2007 to 1.5% of GDP in 2010. Another target is to augment the number of scholarships and fellowships available to university students and researchers from 102 000 in 2007 to 170 000 by 2011.
• In Turkey, the number of full-time equivalent research personnel is to be carried from 28 964 in 2002 to 150 000 by 2013. Turkey plans to raise GERD from 0.72% of GDP in 2007 to 2.0% by 2013.
Examples of national targets

A closer look at…
• The Arab States
• Sub-Saharan Africa
• Latin America

GERD/GDP ratio in the Arab States


Challenges for the Arab world• Governments need to use science to create national wealth and skilled jobs for the
masses of young people graduating from universities each year, estimated at about 100 million over the next decade.
• Research is dominated by the higher education sector, where it often serves purely academic purposes.
• There is very little linkage between universities and industry when it comes to research output and thus little wealth generation via the commercialization of R&D. In the majority of Arab states, intellectual property regimes are very weak, providing little protection for the output of scientists.
• Some countries are attempting to leapfrog the development cycle by importing ready- made models of research centres and universities; this may yield success but only at the local level unless an interregional component is added.
• The stability and security of Arab countries cannot simply be a function of military expenditure and expenditure devoted to upholding law and order. Long-term security and prosperity for all countries in the region can only be achieved by assuring the triple helix of food, water and energy security, combined with sustainable and equitable socio-economic development in tolerant societies where accountability and rule of law prevail.

GERD in Africa, 2002 and 2007 (ppp $ billions)
Source: UNESCO Science Report 2010
*Data are for 2001 – **Data are for 2000
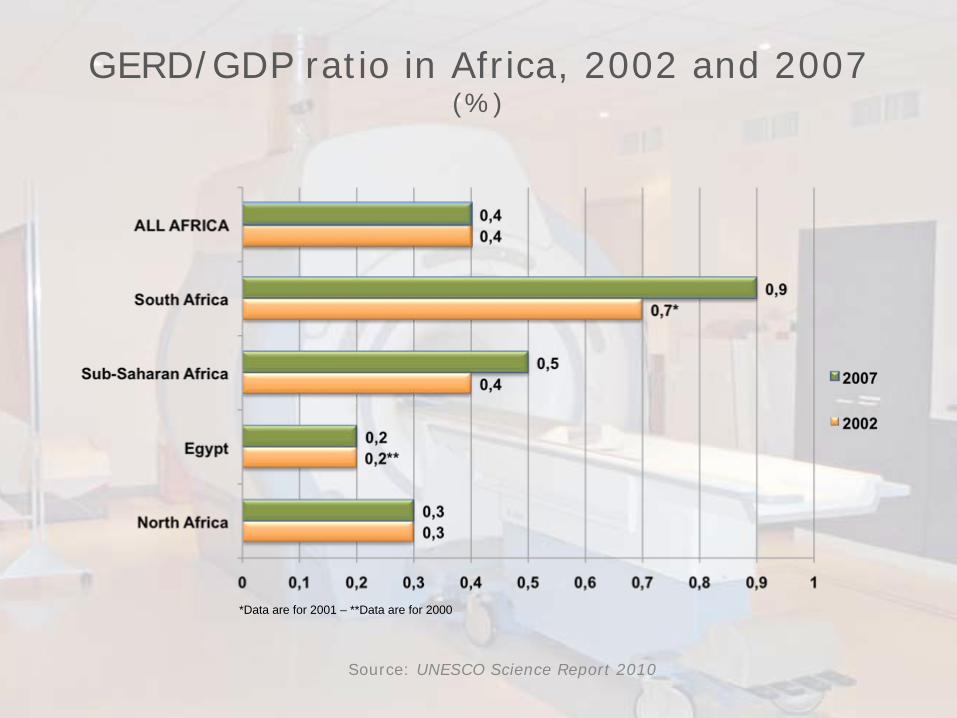
GERD/GDP ratio in Africa, 2002 and 2007 (%)
Source: UNESCO Science Report 2010
*Data are for 2001 – **Data are for 2000

Source: UNESCO Science Report 2010
Researchers in Africa, 2002 and 2007 (per million population)

Africa’s world share of GERD, 2002 and 2007 (%)
Source: UNESCO Science Report 2010

Scientific publications in sub-Saharan Africa, 2000–2008
UNESCO Science Report 2010Source: Thomson Reuters (Scientific) Inc. Web of Science (Science Citation Index Expanded), compiled for UNESCO by the Canadian Observatoire des sciences et des technologies, May 2010
Top 7 countries in terms
of productivity

Publications in sub-Saharan
Africa by major field of science,
2008 (%)
For those countries which produced more than 100
publications in 2008
UNESCO Science Report 2010Source: Thomson Reuters (Scientific) Inc. Web of Science, (Science Citation Index Expanded), compiled f UNESCO b th C di Ob t i d i t d t h l i M 2010

USPTO patents awarded to South African inventors,
2000–2009
Other countries are given for comparison
UNESCO Science Report 2010
Source: USPTO (Utility Patents)

Recommendations for Africa• A national science policy based on the technological and industrial needs of society needs to be
designed in collaboration with the local scientific leadership.
• More systematic, more reliable statistics gathering and analysis to inform policy-making.• Integration of the national science policy into the nation’s development plan.
• Governments should raise GERD to at least 1% of GDP.
• Establish and sustain world-class research and training institutions in food security, energy supply, tropical diseases, soil erosion, water quality, deforestation and desertification on the continent.
• African states and donor organizations need to act collectively to establish research and training centres in key areas of frontier science and technology (molecular biology, biotechnology, informatics, nanotechnology, new materials, etc.).
• The African Academy of Science can play a key role in developing regional programmes in S&T. Both it and the Network of Academies of Science deserve strong support from African governments.
• Every African country should strive to produce at least 1000 scientists per million population by 2025.
• Each African country should establish at least one science centre or museum. At present, there are 23: 17 in South Africa and six in Egypt, Tunisia, Botswana and Mauritius.
• African countries need to put in place fast, affordable and reliable connections to the Internet and other technological infrastructure to become more competitive.

R&D intensity remains low in Latin America (2008)
« The Achilles Tendon of STI policies in Latin America remains the low level of investment in R&D, with the exception of Brazil ».
« The academic sector is the most dynamic actor in creating innovation systems in Latin America. Local knowledge is underutilized by productive sectors ».
Chapter on Latin America

S&T personnel: a widening gap between the ‘Big Four’ and the rest of Latin America

Brazil is pulling ahead for scientific papers (SCI database)


Challenges for STI policy in Latin America• There is inadequate co-ordination of policy instruments and the institutions
responsible for implementing them.
• It is difficult to establish linkages between S&T policies and social policies.
• Investment in R&D is very low in all but Brazil.
• Training and retaining a critical mass of highly skilled personnel is a growing concern.
• The science-push (linear) model still predominates, rather than the demand-pull model favouring innovation.
• Academia is the strongest actor of the innovation system. Even the design of innovation policies falls to academics.
• Businesses play the role of users or consumers of knowledge produced by R&D institutions, even if this knowledge was created with no regard for users. Knowledge is consequently underutilized by the productive sector.
STI must play an increasingly important role in achieving growth and equality ». Chapter on Latin America