Embed Size (px)
Citation preview

IZA DP No. 3614
A Good Time to Stay Out?Strikes and the Business Cycle
Paul J. DevereuxRobert A. Hart
DI
SC
US
SI
ON
PA
PE
R S
ER
IE
S
Forschungsinstitutzur Zukunft der ArbeitInstitute for the Studyof Labor
July 2008

A Good Time to Stay Out?
Strikes and the Business Cycle
Paul J. Devereux University College Dublin,
CEPR and IZA
Robert A. Hart University of Stirling
and IZA
Discussion Paper No. 3614 July 2008
IZA
P.O. Box 7240 53072 Bonn
Germany
Phone: +49-228-3894-0 Fax: +49-228-3894-180
E-mail: [email protected]
Any opinions expressed here are those of the author(s) and not those of IZA. Research published in this series may include views on policy, but the institute itself takes no institutional policy positions. The Institute for the Study of Labor (IZA) in Bonn is a local and virtual international research center and a place of communication between science, politics and business. IZA is an independent nonprofit organization supported by Deutsche Post World Net. The center is associated with the University of Bonn and offers a stimulating research environment through its international network, workshops and conferences, data service, project support, research visits and doctoral program. IZA engages in (i) original and internationally competitive research in all fields of labor economics, (ii) development of policy concepts, and (iii) dissemination of research results and concepts to the interested public. IZA Discussion Papers often represent preliminary work and are circulated to encourage discussion. Citation of such a paper should account for its provisional character. A revised version may be available directly from the author.

IZA Discussion Paper No. 3614 July 2008
ABSTRACT
A Good Time to Stay Out? Strikes and the Business Cycle*
In this paper, we compile a unique historical dataset that records strike activity in the British engineering industry from 1920 to 1970. These data have the advantage of containing a fairly homogenous set of companies and workers, covering a long period with varying labour market conditions, including information that enables the addition of union and company fixed effects, and providing geographical detail that allows a district-level analysis that controls for year and seasonal effects. We study the cyclicality of strike durations, strike incidence, and strike outcomes and distinguish between pay and non-pay strikes. Like the previous literature, we find evidence that strikes over pay have countercyclical durations. However, in the post-war period, the magnitude of this effect is much reduced when union and firm fixed effects are included. These findings suggest that it is important when studying strike durations to take account of differences in the composition of companies and unions that are involved in strikes at different points of the business cycle. We also find that strike outcomes tend to be more favourable to unions when the national unemployment rate is lower. JEL Classification: E32, J31 Keywords: strikes, cyclicality, duration, incidence, outcome Corresponding author: Robert A. Hart Department of Economics University of Stirling Stirling FK9 4LA Scotland UK E-mail: [email protected]
* Bob Hart acknowledges funding for this project from ESRC Grant RES-000-22-1804. The full strikes data are available at the UK Data Archive, Study Number 5841 (http://www.data-archive.ac.uk/ search/searchStart.asp and search for study number). We are grateful to the Engineering Employers Federation for allowing access to their payroll statistics and to Warwick University Modern Record Centre and Glasgow University Archive Centre for their help in assembling the material. This work has greatly benefited from the inputs of Andrew Currall and Daniel Currall who transcribed the data and from Elizabeth Roberts who provided research assistance.

1
1. Introduction
Economists have long been interested in how strike duration and strike incidence
change with labour market conditions. Evidence from the U.S. (Kennan 1985) and
Canada (Harrison and Stewart 1989) suggests that strike durations are countercyclical.
The North American evidence lends more qualified support to the view that strike
incidence is procyclical (Kennan, 1986; Harrison and Stewart, 1994). However, the
findings are by no means uniform across the strikes’ literature. In this paper, we use a
new data set that we have put together from the strikes records of the Engineering
Employers Federation (EEF) in Great Britain. Statistics cover 10,870 company-level
strike incidents over the period 1920 to 1970. These unique data allow us to study strike
durations in a relatively homogenous industry and so differ from the cross-industry
studies that dominate earlier research work.1
Our data add to earlier studies in several other ways. First, they cover a long
period that straddles two colossal events, the Great Depression and the Second World
War (WW2). As such, there is tremendous variation in cyclical conditions over the
sample period. Second, they allow use of other comparable data collected for this period,
especially district-level unemployment rates. These rates, matched to districts in which
strikes took place, enable us to exploit cross-sectional variation in labour market
conditions in addition to time-series variation. Third, we make use of company and union
identifiers to investigate the robustness of our estimates to the presence of company and
union fixed effects. Including these extra controls increases the likelihood that we are
1 Also, the engineering industry was particularly strike-prone. Durcan et al. (1983) report that 57% of major stoppages (defined as involving the loss of 5000 working days or more) in all British industry (excluding Mining) between 1946 and 1973 were accounted for by just five industries; these were, in descending order, motor vehicles, non-electrical engineering, electrical engineering, iron and steel, and shipbuilding.

2
capturing true cyclical effects rather than selection effects. Finally, we add to the
literature by examining how labour market conditions impact strike outcomes. In
particular we examine whether unions are more likely to obtain successful outcomes if
the unemployment rate is low.
2. Is there a Good Time to Stay Out?
Would we expect strike activity to link systematically to changes in the
macroeconomic climate? The dominant approaches to understanding strikes incidence
and duration (see, especially, Kennan 1986) appear to give, at best, equivocal answers.
One view effectively rules out significant correlations between strike
incidence/duration and the business cycle. Hicks (1932) holds that strikes occur more or
less randomly, resulting from irrational bargaining behaviour. If the company and its
workforce are fully and symmetrically informed about internal and external product and
labour markets, then they can rationally achieve an optimal contractual relationship
without recourse to costly and inefficient disputes and work stoppages.
For strikes to occur under conditions of full rationality requires an assumption of
private information, the principal motivation behind the dominant approach to explaining
strike activity. In a company-union context, for example, strikes can be seen as a means
of one (or both) party’s willingness to incur costs in order to elicit more information from
the other side of the dispute. Generally, the assumption is that the company has private
information about profitability and the union about its members’ appetite and capacity for
strike action. In screening models, the union makes take-it-or-leave-it wage offers to the
company and strikes if an offer is rejected. The company balances the cost of a strike of a

3
given expected length followed by settlement at a low wage against the cost of accepting
the union’s initial high wage offer and not facing a strike. Signalling models have the
opposite structure in that the informed party, the company, makes the wage offers. There
are also models in the literature that allow for private information on both sides and/or
both screening and signalling elements (Kennan and Wilson 1993, Cramton and Tracy
2003). However, it is difficult to envisage product and labour market conditions playing
a prominent role in models that stress the motivating role of variables that are
asymmetrically understood by the parties.2
In the literature, there is limited evidence of procyclical strike incidence and
somewhat broader support for countercyclical strike duration. These are plausible
outcomes from a union perspective. When sales are high and inventories are low and
when productive workers are faced with abundant job opportunities, the company may
perceive particularly high costs of work stoppages. This would seem to provide a good
time for the union to solve a grievance through strike action since there is pressure on the
company to expedite matters. When unemployment is high, the union may perceive high
costs to strike action (Farber, 1978). Alternative sources of employment income for
strikers (part-time jobs, the black economy) will be relatively scarce and the situation
may be exacerbated if wider family members are also experiencing adverse job
conditions. Moreover, when strikes do occur during economic downturns, high
2 Booth and Cressy (1990) establish a possible connection between private information regarding company profit and the business cycle. Companies with high capacity utilisation, ceteris paribus, may be perceived to enjoy high profits and so be more strike-prone. This line of reasoning suggests procyclical strike incidence. In their regression analysis, however, the two measures used by these authors to proxy utilisation (rising/stable sales and establishments operating at full capacity) produce contradictory results.
4
inventories and thin order books may provide conditions in which employers can afford
to be more robust in their resolve, resisting demands for relatively protracted periods.3
Kennan (1986) and Cramton and Tracy (2003) argue that it is a challenge for
bargaining models to underpin theoretically findings of procyclical incidence and
countercyclical duration. But, there is considerable room to be cautious over treating
these outcomes as if they represented a consensus among researchers. Strong counter
evidence exists. Analysing 6,000 negotiations in British manufacturing in the 1980s,
Ingram et al. (1993) find significant countercyclical strike incidence. Based on a U.S.
data set covering over 6,000 union contracts for the period 1970 to 1981, McConnell
(1990) finds no evidence of cyclical variation in strike duration.
3. Data and Descriptive Analysis
The strike records we use come from a set of volumes on engineering strikes
within the Engineering Employers' Federation (EEF)4 that are stored at the University of
Warwick’s Modern Records Centre. These provide company-level annual strike
information for all the Federation’s members over an unbroken period from 1920 to
1970. The data are very comprehensive: for each strike, they report the name of the
company involved, the union(s) involved, the geographical engineering district (e.g.
3 There is an obvious counter argument (Vanderkamp, 1970). If product market demand is generally weak then employers may be wary of jeopardising their relationship with existing customers given a relative abundance of alternative supply sources. 4 The Employers' Federation of Engineering Associations was established in 1896 and by 1899 had become known as the Engineering Employers' Federation. It later merged in 1918 with the National Employers' Federation and become known as the Engineering and Allied Employers' National Federation. In 1961 it changed its name back to the Engineering Employers' Federation (EEF). The EEF is the largest sector employers' organisation in the United Kingdom with a current membership of nearly 6000 companies throughout the country.

5
Coventry), the cause of the strike, the outcome or resolution, the strike duration in days5
(with precise start and end dates), the numbers involved (by men, women and boys), the
classes of workers involved (e.g. toolroom fitters, machinemen), and numbers of workers
incidentally laid off as a result of the strike. The level of detail is consistent for each and
every year over the half century covered. We have transcribed these data on to
spreadsheets in a systematic fashion so that they are useful for statistical analysis. There
are no censored durations because all reported strikes had ended at the end of the data.
By far the highest strike incidence in our data occurred during the 1960s (see
Figure 2b and Table 3 below). We are able to undertake an especially detailed
investigation of this important strikes period as monthly district-level unemployment
rates are available for the period 1960-1970 for 54 engineering districts. (Districts are
listed in Appendix Table 1). We match these exactly to the start month of the strike and
to the EEF district in which each strike occurred.
Because we are using a new dataset, we now describe some of the characteristics
of the included strikes and describe how these relate to information in the literature from
other sources.
Determinants of Working Days Lost
The number of working days lost as a result of strikes depends on three factors –
the number of strikes, the average strike duration, and the average number of workers per
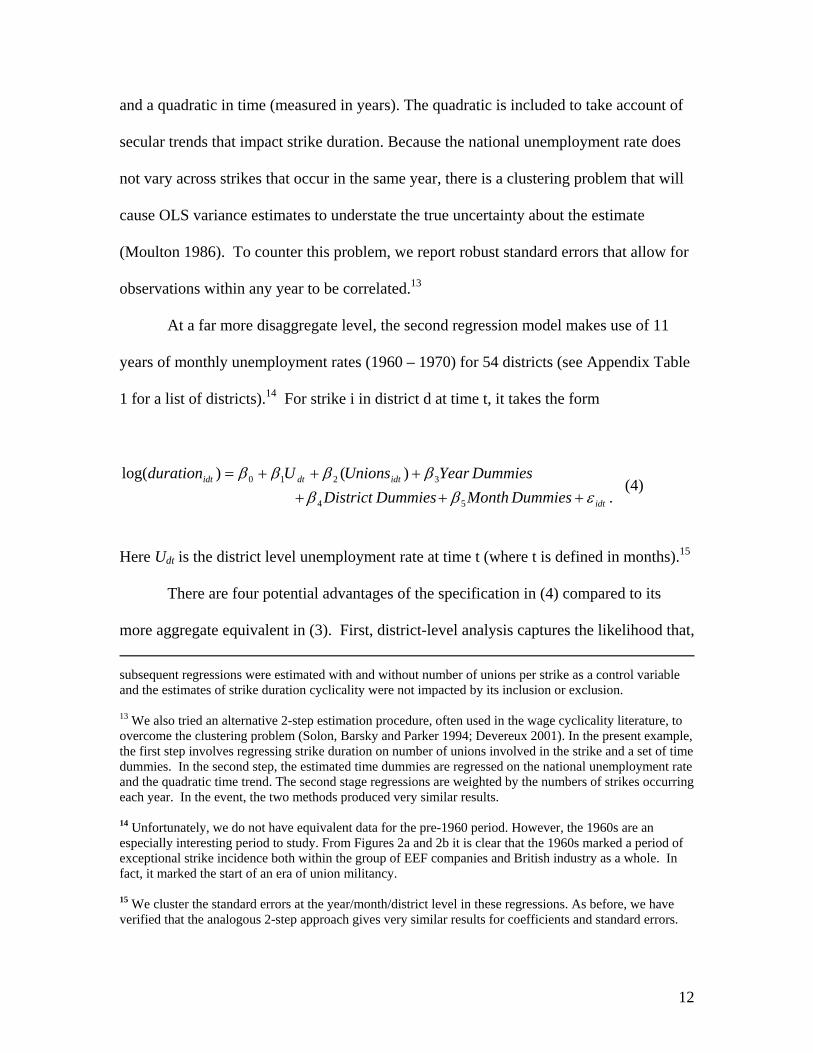
strike. Following Forchheimer (1948) and Knowles (1952), Figure 1 shows the annual
decomposition of total days lost due to EEF strikes sub-divided into these three factors.
5 For strikes lasting less than a day, durations are reported in hours.

6
Let DAYSLOST = total working days lost (per-period), STRIKES = number of strikes,
MEANDUR = average strike duration, and MEANW = average number of workers
involved in strikes; then ln(DAYSLOST) = ln(STRIKES) + ln(MEANDUR) +
ln(MEANW). The latter expression is graphed in Figure 1. It is clear that all three
components play an important role in determining the total number of working days lost.
Note the large fall in the number of strikes in the mid 1920s to early 1930s. This is not
special to our EEF data but is true in general for engineering and related metal industries,
as illustrated in Appendix Table 2.
Numbers of Strikes
Figures 2a and 2b show the annual number of strikes taking place within the EEF
from 1920 to 1970. They also show the number of strikes within British Industry as a
whole. Clearly, EEF and national patterns match closely. Figure 2a covers the period
from 1920 to the end of WW2. The two marked features are (a) the relatively low level
of strike activity between 1922 and 1934 and (b) a growth in the number of strikes in the
run up to and during WW2. For the first of these sub-periods, Knowles (1952, p.145-
150) finds little evidence of national level relationships between the number of strikes on
the one hand and the cost of living, weekly wage rates and union membership on the
other. Low levels of strikes do tend to correspond more closely with high national
unemployment rates, but even these associations are not altogether very persuasive.6 In
the second sub-period, there were large numbers of official and unofficial engineering
6 For example, unemployment rates peaked in 1931 and 1932, at the height of the Great Depression, with about one-quarter of the workforce unemployment on average in EEF engineering districts (Hart and MacKay, 1975). But strike activity was at its lowest in 1927 when, at 10%, unemployment was well below its peak.

7
strikes resulting, in particular, from pressures of war demands on the industry. A very
noticeable feature of Figure 2b, covering post-war strike numbers, is that strike activity
increases considerably during the 1960s. This is in line with other sources that have
demonstrated an upsurge in strikes at this time. Galambos and Evans (1977) show that,
during the period 1965 – 1970, “the Vehicles, Aircraft, Metal Manufacture and
Engineering groups, already isolated as ‘strike prone’, continue to deteriorate during this
period”. Between 1965 and 1970, these authors show that between 20 and 25 percent of
all U.K. industrial disputes (excluding Mining) occurred in engineering and electrical
goods.
Pay Versus Non-Pay Strikes
The data include reported reasons for striking and, in common with a number of
papers in the literature, we have used these to classify strikes as pay-related or non-pay-
related. Respective issues and frequencies are shown in Tables 1a and 1b, in terms of the
whole period as well as pre-war and post-war years.7 For all three periods in Table 1a,
the predominant pay disputes involved wages, bonuses and piece rates.8 Non-pay strikes
occur for many different reasons, although disputes involving perceived wrongful
dismissal and union-related grievances are clearly generally important.9
7 The complete data set, published in the UK Data Archive (see Acknowledgements for full reference), contains more detail about the reason behind each strike. 8 Knowles and Hill (1954) provide an excellent discussion of these payment methods within the context of the EEF payroll data. 9 Galambos and Evans (1977) show that in Metals and Engineering Industries the two main reasons for non-pay stoppages from 1965 to 1969 were (a) disputes concerning the employment and discharge of workers (between 9 and 22 percent of all stoppages during this period), and (b) other working arrangements, rules and discipline (between 5 and 16 percent). The first of these matches ‘wrongful dismissal’, the most important cause of non-wage disputes in our data (see Table 1b). The second, almost certainly is included in ‘treatment of workers’, the third in importance.

8
Figure 4 plots the proportion of non-pay to total strikes from 1920 to 1970. To the
extent that we can verify, this is quite strongly representative of the reported incidence of
non-pay disputes in other sources. For the period 1965 – 1970, Galambos and Evans
(1977) report proportions of non-pay strikes of (respectively) 49.7, 44.4, 51.3, 21.0, 37.1
and 27.6 for the Metals and Engineering industries. For the period 1945 – 1957,
McCarthy (1977) shows that 54.8% of all U.K. strikes involved non-pay issues. For all
British industry over the entire period 1946 to 1973, Durcan et al. (1983) show that non-
pay strikes constituted about 51% of all strikes.
Strike Duration
Table 2 presents information on strike durations by pay and non-pay issues. It
shows that durations are longer for strikes in which pay is a factor. Also, strikes tend to
last longer in northern districts (North of England and Scotland) presumably reflecting
greater militancy among workers and their unions in the older, more traditional
engineering areas. Durations in general were considerably longer in the pre-war
compared to the post-war era. Wartime strike durations were lowest, with much
unofficial strike action.
Table 3 shows the mean, median and survival rates of strike durations (in days)
for each year in the sample. Figure 5 plots the mean duration data. It is clear that there is
wide variation in durations across years with durations being particularly long during the
first halves of the 1920s and 1930s. These patterns in the data are consistent with other
sources. Knowles (1952, pp. 152-157) examines British industrial strike durations (all
industries) during the period 1911 to 1936. Over this period, 27.1% of striking workers
were involved in strikes lasting for 10 weeks and over, while 23.3% of strikers took part

9
in strikes lasting for between 4 and 10 weeks. 1926 appears to have been a watershed
year. Up to that year, 31.5% of strikes lasted for at least 10 weeks, a percentage that fell
to 20.2% between 1927 and 1936. Knowles also shows that strikes involving 5000
workers or more were prevalent during the period 1911 - 1926 (85.5% of all working
days lost) but far less so between 1927 and 1947 (55.7%). 10
When mean strike durations are juxtaposed against national unemployment rates,
as in Figure 5, the contrast between pre- and post-war eras is even more starkly
illustrated. Pre-war unemployment is generally on a different scale from post-war
experience, around the towering peak of the early 1930s Great Depression. At their
lowest points – in the late 1920s and middle-to-late 1930s - average pre-war durations are
comparable to post-war figures. But in the early-to-mid 1920s and at the height of the
Depression, mean durations displayed extraordinary increases.
Number of Unions per Strike
In line with British unionism in general, engineering unions did not represent
companies but, rather, trades and skills. Therefore, a given industrial dispute could
involve more than one union. Table 4 shows the percentage of total strikes in the
complete data set covered by one, two (and so on up to ten) unions. While two-thirds of
strikes in the data involve a single union, clearly there are significant numbers with two
or more unions participating.
10 One well known long term engineering strike in which the EEF featured prominently was the apprenticeship strike of 1937. It involved 32,500 apprentices, lasted for 94 days and resulted in 406,000 working days lost (see Ryan, 2004).

10
4. Strike Incidence and Unemployment Rates
Strike Incidence
Given data limitations, we cannot undertake a detailed analysis of the relationship
between strike incidence and the business cycle. Data are recorded as and when company
strikes take place and therefore do not report on companies for which no strikes occur.
However, since we know the total numbers of EEF companies each year from a
secondary source (Wigham 1973, Appendix J), we can construct a simple annual average
index of strike incidence:
⎟⎟⎠
⎞⎜⎜⎝
⎛=
t
tt C
CSTRIKEcratio ln (1)
where CSTRIKEt is the total number of EEF companies that experienced a strike in year t
and Ct is the total number of EEF companies in year t.
Figure 3 shows the (unlogged) graph of this index. The incidence of strikes is
quite low in the pre-war period (usually less than 2% per year) but rises and exceeds 10%
in the late 1960s. Unsurprisingly, the patterns in Figure 3 are broadly similar to those of
the strikes frequencies shown in Figure 2.
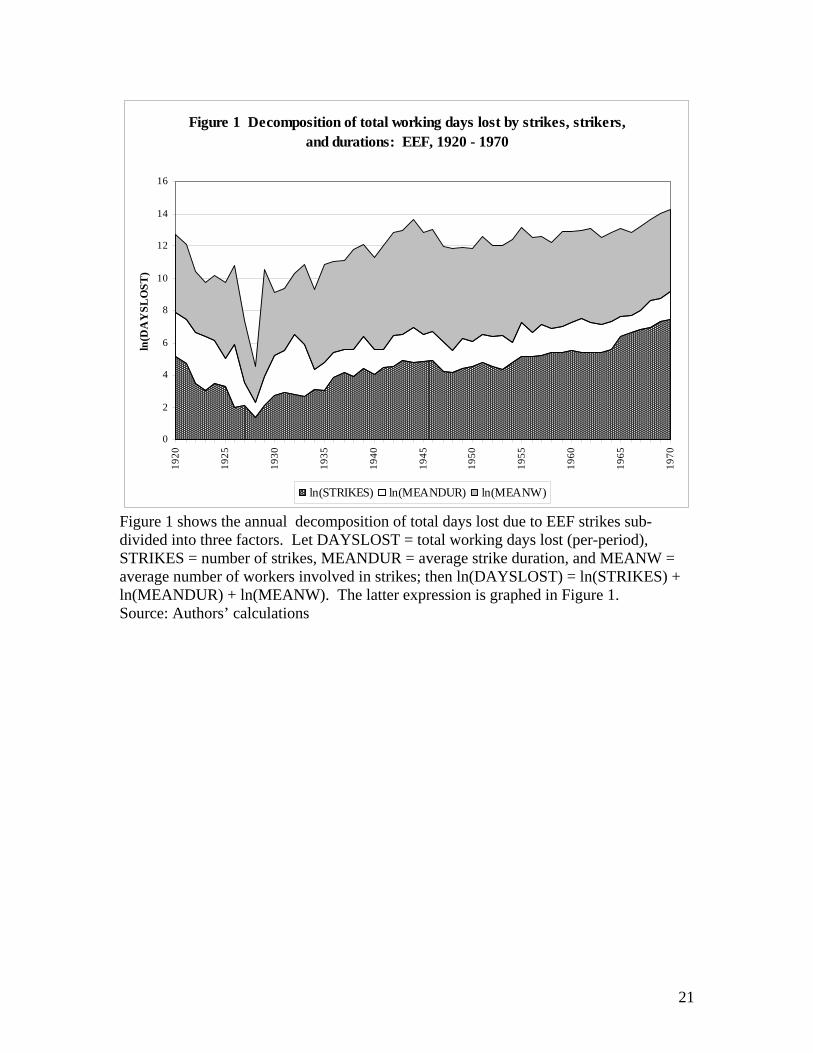
We regress this index on the national annual unemployment rate, Ut, and a
quadratic time trend for the periods 1920 to 1970, 1920 to 1938 and 1946 to 1970. Thus,
we have
ttt ttUcratio εαααα ++++= 23210 (2)
where cratiot is defined in expression (1) and εt is an error term. As in all subsequent
regressions, we split strikes by whether they were primarily about pay or non-pay issues
(see Tables 1a and 1b for details of the distinctions).

11
The estimates are presented in Table 5. Consistent with most of the prior
literature, the evidence suggests that strike incidence is procyclical. Like that literature,
the results are by no means overwhelmingly supportive.11 Standard errors are relatively
large and in only one instance – pay disputes over the entire period – do we obtain
statistical significance.
5. Strike Duration and Unemployment Rates
In contrast to strike incidence, we can make use of our company-level data to
study relationships between strike duration and the cycle. We use both national and
district-level unemployment rates.
The first specification is a log-linear model of strike duration which we estimate
over the entire period (1920 – 1970) as well as the pre-war (1920 – 1938) and post-war
(1946 – 1970) periods using the national rate of unemployment as our measure of the
cycle.
itittit ttUnionsUduration εβββββ +++++= 2
43210 )()log( (3)
Here, the log duration of strike i in year t is expressed as a function of the national
unemployment rate in year t (Ut), the number of unions involved in the strike (Unionsit) 12
11 Harrison and Stewart (1994) provide one of the best known studies. Using Canadian data on strikes and contracts they find evidence of procyclical strike incidence, particularly in manufacturing industry, but only with respect to nonwage issues. 12 There is a potential endogeneity issue with the Unions variable. As a given strike progresses through time, more workers may become affected which in turn may require more unions to become involved. Unfortunately, our strike union data does not allow us to observe such sequences. On the basis of simple regressions in which the mean annual average number of unions per strike was regressed on the unemployment rate and a quadratic time trend, there is no evidence of cyclicality. In any event, all
12
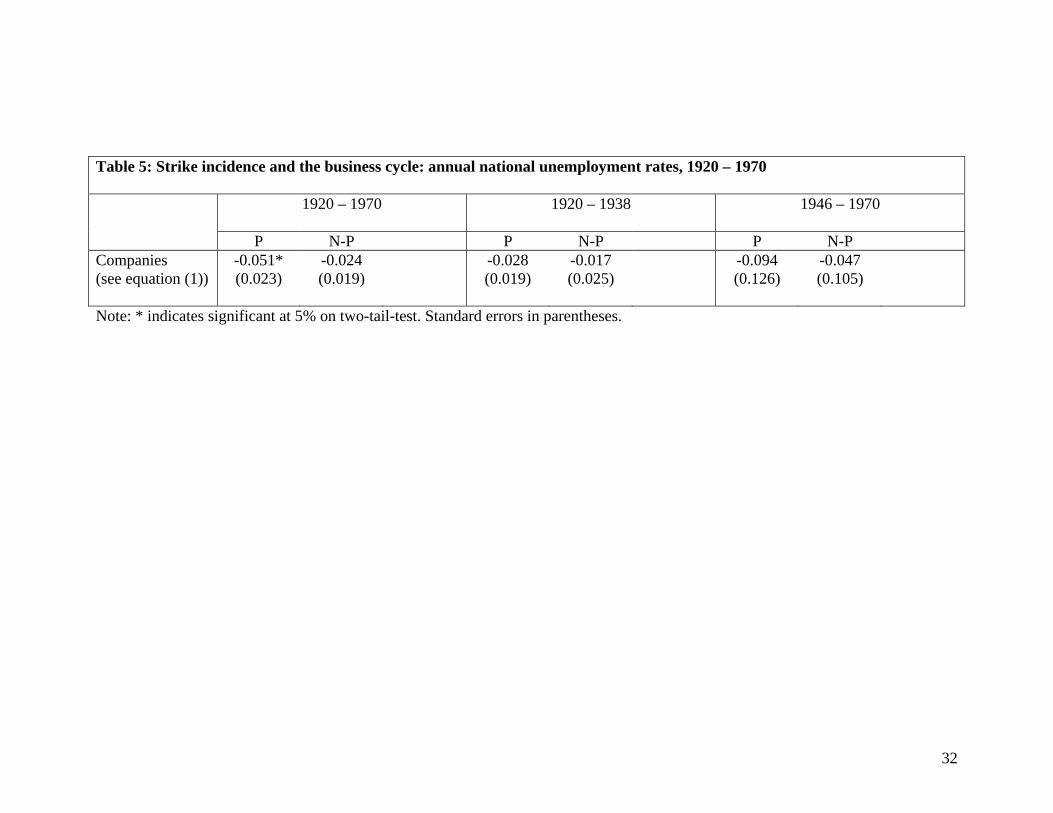
and a quadratic in time (measured in years). The quadratic is included to take account of
secular trends that impact strike duration. Because the national unemployment rate does
not vary across strikes that occur in the same year, there is a clustering problem that will
cause OLS variance estimates to understate the true uncertainty about the estimate
(Moulton 1986). To counter this problem, we report robust standard errors that allow for
observations within any year to be correlated.13
At a far more disaggregate level, the second regression model makes use of 11
years of monthly unemployment rates (1960 – 1970) for 54 districts (see Appendix Table
1 for a list of districts).14 For strike i in district d at time t, it takes the form
.)()log(
54
3210
idt
idtdtidt
DummiesMonthDummiesDistrictDummiesYearUnionsUduration
εββββββ
++++++=
(4)
Here Udt is the district level unemployment rate at time t (where t is defined in months).15
There are four potential advantages of the specification in (4) compared to its
more aggregate equivalent in (3). First, district-level analysis captures the likelihood that,
subsequent regressions were estimated with and without number of unions per strike as a control variable and the estimates of strike duration cyclicality were not impacted by its inclusion or exclusion. 13 We also tried an alternative 2-step estimation procedure, often used in the wage cyclicality literature, to overcome the clustering problem (Solon, Barsky and Parker 1994; Devereux 2001). In the present example, the first step involves regressing strike duration on number of unions involved in the strike and a set of time dummies. In the second step, the estimated time dummies are regressed on the national unemployment rate and the quadratic time trend. The second stage regressions are weighted by the numbers of strikes occurring each year. In the event, the two methods produced very similar results. 14 Unfortunately, we do not have equivalent data for the pre-1960 period. However, the 1960s are an especially interesting period to study. From Figures 2a and 2b it is clear that the 1960s marked a period of exceptional strike incidence both within the group of EEF companies and British industry as a whole. In fact, it marked the start of an era of union militancy. 15 We cluster the standard errors at the year/month/district level in these regressions. As before, we have verified that the analogous 2-step approach gives very similar results for coefficients and standard errors.

13
in many instances, it is local labour market conditions that matter most to unions and
workers. Second, introducing cross-sectional variation allows us to include both year
fixed effects and district fixed effects, while still identifying the effects of the
unemployment rate. Thus, we can be sure that some unknown year-specific factor that
impacts strike durations is not confounding our estimates. Third, from Table 2 we note
that the average strike in the post-war period lasted for about 6 days. In many instances,
the decision over the best time to stay out may well have been quite finely tuned to the
perceived state of the cycle within a relatively short interval of time. This may not be
captured by a rate of unemployment averaged over a complete year. Fourth, embracing
seasonality may well be an important consideration. In their analysis of the seasonal
patterns of UK strikes between 1946 and 1973, Durcan et al. (1983) show that spring and
autumn are the two periods in the year when major stoppages are likely to begin.
There is a particular value of employing district rates in the post-war period
because, as shown in Figure 5, during that period the national rate of unemployment goes
no higher than 2% and so is suggestive of a period of very gentle business cycles.16
However, there is a great deal of district variation around this aggregate trend. Using our
1960-1970 monthly unemployment data for 54 districts we regressed the district
unemployment rate on district, monthly and annual dummies and plotted the residuals.
Four representative examples – from Scotland, Northern Ireland, the North of England
(N.E. Coast) and the Midlands (Coventry) - are shown in Figure 6. Recall from Figure 2b
that strike activity was especially prevalent at this time as was trade union militancy.
One of the centres of militancy was in the Midlands, dominated by the automotive
16 This is not an issue for the pre-war estimates as there are enormous cyclical variations during that period.

14
industry. In Figure 6, Coventry represents this region and it is quite clear that this city
experienced several marked unemployment cycles over these 11 years. The other
districts shown – which were not the most volatile of the remaining districts – also
display systematic movements with high points in late 1962/early 1963 and towards the
end of the period as well as a fairly pronounced trough in 1966.
We can classify strikes by both company and by union involvement. Therefore,
in regression equations (3) and (4) above, we can add company and union fixed effects in
the estimating equations. As we saw in Table 5, strike incidence appears to be
procyclical, suggesting that, to some limited degree, unions and companies may have
been more willing to engage in brinkmanship when labour market conditions are good.
However, it has the further implication that the types of companies and unions that are
engaged in strikes may differ systematically over the business cycle. This is the rationale
for inclusion of company and union fixed effects in estimation. With company effects, we
are essentially comparing strike durations across strikes that occur in the same company
but at different points in the business cycle. With union effects, we are controlling for the
aggressiveness of the union.
There are 1909 different companies in our data set of which 49% experienced
only 1 strike within the full data coverage. Of the remainder, 16% percent featured twice,
8% 3-times, 6% 4-times, 4% 5-times, 3% 6-times, 2% 7-times, and about 1% featured 8-
times or more. At the extreme right of the distribution there are 12 examples of
companies featuring 100 times or more. On the union side, our data include 94 different
single unions involved in strikes while additional strike actions featured 2 or more
unions. Where more than one union was involved, the data identify the leading union.

15
Therefore, we decided to code unions from 1 to 94 for single union involvement and then
95 to 147 where one of these single unions is identified as leading one or more additional
unions in a given strike. Appendix Table 3 shows the strike frequency distribution
pertaining to these 147 distinct union cells. In 29% of cases there was only one strike
incident, while 16% involved 2 incidents, 4% 3 incidents and so on.
The estimates from regression model (3) – that incorporates annual national
unemployment rates – are shown in Table 6.17 Results for the whole period and for the
pre-war period reveal only one instance of significant countercyclicality in strike
durations. This is obtained in relation to pay-related disputes and after controlling for
union fixed effects. Somewhat more comprehensively, pay-related disputes also exhibit
countercyclical durations in the post-war era. While the standard errors are large, there is
an indication that non-pay disputes are also countercyclical during the later period.18
For the period 1960 to 1970, we repeated the durations regressions using the
extended specification shown in equation (4). These estimates for the district
unemployment rate are in Table 7. We present results with year fixed effects in addition
to estimates with a quadratic in year and we obtain strong evidence that non-pay strike
durations are countercyclical. Recall that about 50% of strikes at this time involved non-
17 We do not report coefficient values for the Unions variable in the table as this variable is likely endogenously determined and so subject to bias. However, the coefficient on it is generally negative, indicating that strike durations are shorter when more unions are involved. This supports the notion that a single union leading a dispute can more efficiently muster the solidarity and cohesion required to ‘stay the course’ in order to meet its members’ objectives. However, given the number of unions involved may be correlated with many other factors, caution is warranted in interpretation. 18 One concern is that our results may be model-dependent and there are many more sophisticated duration models that we could have used. The loglinear model we have used is exactly equivalent to an accelerated failure time hazard model in which the error is assumed to be normally distributed. We have experimented with many other hazard specifications including weibull, exponential, log-normal, log-logistic, gamma, and gompertz and found similar estimates. The derivatives were generally similar to the estimates we report in the tables.

16
pay issues (see Figure 4). Generally, we obtain similar results with respect to OLS and
union fixed effects regressions. Interestingly, the addition of company and union fixed
effects eliminates any evidence that pay-related strike durations are countercyclical. This
suggests that there were changes in the composition of unions and firms involved in pay
strikes over the business cycle and that the inability of previous studies to include union
and company fixed effects may have led to bias.
6. Union Strike Success and Unemployment Rates
In order to improve the probability of gaining from a strike, is it better for the
union to strike towards the peak of a cycle (when company profit and demand pressures
are relatively high) while resisting action during troughs (when strikers and their families
face less favourable alternative labour market options)? The EEF data record the
outcomes of strikes, although in somewhat less detail than the causes. The outcomes
were allocated under the various headings shown in Appendix Table 4. Some of these
allocations are, of necessity, somewhat tentative. In other words, it was difficult in some
instances to decide whether or not a given strike was unequivocally successful or
unsuccessful. For the categories labelled ‘successful’, however, it was reasonably clear
that most strikes achieved a partial gain or a completely successful resolution for the
union.
Let OSit be the outcome of strike i at time t such that OSit =1 if a strike is
‘successful’ (all the OSi’s listed in Table 8) and OSit = 0 otherwise. We then specify a
linear probability regression model
ittit ttUnionsUOS εγγγγγ +++++= 243210 )( (5)

17
that we estimate by OLS in the same way as in the duration regressions. As can be seen
in Table 8, our evidence points to procyclical successful outcomes, both in the pre-war
and the post-war period. The pre-war finding of procyclicality is robust to company and
union fixed effects in the case of pay strikes but not for non-pay strikes. In the post-war
period, the procyclical finding is statistically significant for non-pay strikes when union
and company fixed effects are included. The magnitude of the effect for pay strikes is
similar but the standard error is higher so it is not statistically significant. The magnitudes
are quite big – in the pre-war period a one unit increase in the unemployment rate reduces
the probability that a pay strike has a successful outcome by .03 (from a baseline of 0.40).
The equivalent effect of a one point increase in unemployment in the post-war period is
about .06 for both types of strikes (from a baseline of 0.75).19
7. Conclusions
In this paper, we have compiled a unique historical dataset that records strike
activity in the British engineering industry from 1920 to 1970. A strength of these data is
that they include a homogenous set of companies and workers, covering a long period
with varying labour market conditions. We show that the incidence and causes of strikes
in engineering over these years follow patterns that are quite reflective of strike behaviour
in British industry as a whole. However, unlike earlier broadly based cross-industry
studies, the engineering data allow us to study the cyclicality of strike durations and
outcomes after controlling for company, union, time (month and year), and local labour
market effects.
19 We have also carried out this estimation using the 1960-1970 district level unemployment rates sample. We found negative estimates that were never statistically significant.

18
We use unemployment rates as our measure of the cycle primarily because they
allow two levels of aggregation in the regression analyses – i.e. annual national and
monthly district. The great advantage of the latter is that the district unemployment rate
data are matched to coincide with the location and timing of the EEF company strikes.
We are forced to examine strike incidence at a quite aggregate level and find, in line with
other studies, fairly weak support for procyclicality. Like the previous literature, we find
evidence for countercyclical strike durations, both for pay and non-pay related strikes.
However, in the post-war period, the magnitude of this effect is much reduced for pay
strikes when union and firm fixed effects are included. These findings suggest that it is
important when studying strike durations to take account of differences in the
composition of companies and unions that are involved in strikes at different points of the
business cycle.
We also find that strike outcomes tend to be more favourable to unions when the
national unemployment rate is lower. The evidence for this is particularly strong for pay-
strikes in the pre-war period. This is perhaps unsurprising given the extremely adverse
economic conditions during the Great Depression years. The evidence on strike success
rates and the business cycle is weaker post-war but does indicate greater union success
when the national unemployment rate is lower.

19
References
Booth, A and R Cressy. 1990. Strikes with asymmetric information: theory and evidence. Oxford Bulletin of Economics and Statistics 52, 269-291.
Cramton, P C, and J S Tracy. 2003. Unions, Bargaining and Strikes. In J T Addison and
C Schnabel (eds.), International Handbook of Trade Unions, Cheltenham. UK: Edward Elgar.
Denham, J and P McDonald. 1996. Unemployment statistics from 1881 to the present
day. Labour Market Trends 104 (January), 5 – 18. Devereux, P J. 2001. The cyclicality of real wages within employer-employee matches.
Industrial and Labor Relations Review, Vol. 54, July, pp. 835-850. Durcan, J W, W E J McCarthy and G P Redman. 1983. Strikes in post-war Britain. A
study of stoppages of work due to industrial disputes, 1946 – 1973. London: George Allen and Unwin
Farber, H.1978. Bargaining theory, wage outcomes, and the occurrence of strikes: an
econometric analysis. American Economic Review 68, 262-271. Forchheimer, K. 1948. “Some international aspects of the strike movement.” Bulletin of
the Oxford Institute of Statistics 10, 9-24. Galambos, P and E W Evans. 1977. Work stoppages in the United Kingdom 1965 –
1970: a quantitative study. In E W Evans and S W Creigh (eds), Industrial Conflict in Britain. London: Frank Cass.
Harrison, A and M Stewart. 1994. Is strike behavior cyclical? Journal of Labor
Economics 12, 524–553. Harrison, A, and M Stewart. 1989. Cyclical Fluctuations in Strike Durations. American
Economic Review, Vol. 79, No. 4 (September), pp. 827-841. Hart, R A and D I MacKay. 1975. Engineering Earnings in Britain: 1914-1966. Journal of
the Royal Statistical Society 138, (Series A), 32-50. Hicks J. 1932. The Theory of Wages. London. Macmillan and Co. Ingram, P, D Metcalf and J Wadsworth. 1993. Strike incidence in British Manufacturing
in the 1980s. Industrial and Labor Relations Review 46, 704-717. Kennan, J. 1985. The Duration of Contract Strikes in U.S. Manufacturing. Journal of
Econometrics, Vol. 28, April, pp. 5-28.

20
Kennan, J. 1986. The economics of strikes. In Handbook of Labor Economics, O Ashenfelter and R Layard (eds.), Amsterdam and New York: North Holland.
Kennan, J and R Wilson. 1993. Bargaining with Private Information. Journal of
Economic Literature 31, 45-104. Knowles, K G J C. 1952. Strikes - a study in industrial conflict. Oxford, Basil Blackwell. Knowles, K G J C. and T P Hill. 1954. The structure of engineering earnings. Bulletin of
the Oxford University Institute of Statistics 16, 272-328. McCarthy, W E J. 1977. The reasons given for striking. An analysis of official statistics.
1945-1957. In E W Evans and S W Creigh (eds), Industrial Conflict in Britain. London: Frank Cass.
McConnell, S. 1990. Cyclical fluctuations in strike activity. Industrial and Labor
Relations Review 44, 130-143. Moulton, Brent R. 1986. Random group effects and the precision of regression estimates.
Journal of Econometrics, Vol. 32, August, pp. 385-397. Ryan, P. 2004. Apprentice strikes in the Twentieth-Century UK engineering and
shipbuilding industries. Historical Studies in Industrial Relations 18, 1 – 63. Solon, G, R B Barsky and J A. Parker. 1994. Measuring the cyclicality of real wages:
how important is composition bias? Quarterly Journal of Economics 109, No. 1, pp. 1-26.
Vanderkamp, J. 1970. Economic activity and strikes in Canada. Industrial Relations 9,
215-230. Wigham, E. 1973. The power to manage. A history of the Engineering Employers’
Federation. London: Macmillan.
21
Figure 1 Decomposition of total working days lost by strikes, strikers, and durations: EEF, 1920 - 1970
0
2
4
6
8
10
12
14
1619
20
1925
1930
1935
1940
1945
1950
1955
1960
1965
1970
ln(D
AY
SLO
ST)
ln(STRIKES) ln(MEANDUR) ln(MEANW)
Figure 1 shows the annual decomposition of total days lost due to EEF strikes sub-divided into three factors. Let DAYSLOST = total working days lost (per-period), STRIKES = number of strikes, MEANDUR = average strike duration, and MEANW = average number of workers involved in strikes; then ln(DAYSLOST) = ln(STRIKES) + ln(MEANDUR) + ln(MEANW). The latter expression is graphed in Figure 1. Source: Authors’ calculations

22
Figure 2a Number of strikes in all British Industries and in EEF member companies, 1920-1945
0
500
1000
1500
2000
2500
1920
1921
1922
1923
1924
1925
1926
1927
1928
1929
1930
1931
1932
1933
1934
1935
1936
1937
1938
1939
1940
1941
1942
1943
1944
1945
Brit
ish
Indu
stry
Str
ikes
0
20
40
60
80
100
120
140
160
180
200
EEF
Strik
es
All industrial strikes EEF strikes
Source: Data for all-industries graph taken from Knowles (1952, Statistical Appendix Table 1, p.310). (For 1926, all industries data exclude the General Strike. It lasted from 3-12 May and, while initiated through an employers’ lock out of coal miners, involved a wide cross-section of industry including building, printing, dock, iron, steel, metal, heavy chemical, transport and railway workers.)
Figure 2b Number of strikes in all British industries (excluding mining) and in EEF member companies, 1946 - 1970
0
500
1000
1500
2000
2500
3000
3500
4000
1946
1947
1948
1949
1950
1951
1952
1953
1954
1955
1956
1957
1958
1959
1960
1961
1962
1963
1964
1965
1966
1967
1968
1969
1970
Brit
ish
Indu
stry
Str
ikes
0
200
400
600
800
1000
1200
1400
1600
1800
EEF
Strik
es
All industrial strikes EEF strikes
Source: Data for all-industries graph from Durcan et al. (1983, Table 6.1, p.174)

23
Figure 3 Strike incidence by companies in the EEF, 1920 - 1970
0
0.02
0.04
0.06
0.08
0.1
0.1219
20
1922
1924
1926
1928
1930
1932
1934
1936
1938
1940
1942
1944
1946
1948
1950
1952
1954
1956
1958
1960
1962
1964
1966
1968
1970
Strike incidence is calculated as the total number of EEF companies that experienced a strike in year t divided by the total number of EEF companies in year t.
Figure 4: Proportion of non-pay strikes in EEF companies
0.0
0.1
0.2
0.3
0.4
0.5
0.6
0.7
0.8
0.9
1920
1922
1924
1926
1928
1930
1932
1934
1936
1938
1940
1942
1944
1946
1948
1950
1952
1954
1956
1958
1960
1962
1964
1966
1968
1970

24
Figure 5 Annual average strike durations and the rate of unemployment, 1920 - 1970
0
10
20
30
40
50
60
1920
1921
1922
1923
1924
1925
1926
1927
1928
1929
1930
1931
1932
1933
1934
1935
1936
1937
1938
1939
1940
1941
1942
1943
1944
1945
1946
1947
1948
1949
1950
1951
1952
1953
1954
1955
1956
1957
1958
1959
1960
1961
1962
1963
1964
1965
1966
1967
1968
1969
1970
Mea
n du
ratio
n in
day
0
2
4
6
8
10
12
14
16
Une
mpl
oym
ent R
ate
Mean Duration U
Source of Unemployment Rates: Denham and McDonald (1996)

25
Figure 6 District monthly unemployment net of district, monthly and annual fixed effects: March 1960 to December 1970
-2
-1
0
1
2
3
4
5
6
1960
/1
1960
/4
1960
/7
1960
/10
1961
/1
1961
/4
1961
/7
1961
/10
1962
/1
1962
/4
1962
/7
1962
/10
1963
/1
1963
/4
1963
/7
1963
/10
1964
/1
1964
/4
1964
/7
1964
/10
1965
/1
1965
/4
1965
/7
1965
/10
1966
/1
1966
/4
1966
/7
1966
/10
1967
/1
1967
/4
1967
/7
1967
/10
1968
/1
1968
/4
1968
/7
1968
/10
1969
/1
1969
/4
1969
/7
1969
/10
1970
/1
1970
/4
1970
/7
1970
/10
Aberdeen Coventry N.E. Coast Northern Ireland
This figure is constructed by regressing the district unemployment rate on district, monthly and annual dummies and plotting the residuals.

26
Table 1a Causes of Pay-Related Strikes, 1920 – 1970
PAY ISSUES 1920-1970 1920-1938 1946-1970 Percentage Percentage Percentage Wages 49.82 61.94 49.97
Bonuses 17.09 7.96 17.62
Piece Rates 14.14 12.19 14.01
Systems of pay (e.g. rate fixing, abolition of piecework system) 6.78 5.72 5.79
Payment for Time Lost (mainly waiting time payments due to downtime) 5.07 1.49 5.61
Relative Pay (mainly disputes over pay differentials among skill groups 3.32 4.48 3.26
Holiday Pay 1.97 - 2.27
Shift/Night Rates 0.11 0.5 0.06
Overtime 0.09 0.09
Misc. Pay-related 1.6 5.72 1.32

Table 1b Causes of Non-Pay Strikes, 1920 – 1970 NON-PAY ISSUES 1920-1970 1920-1938 1946-1970 Percentage Percentage Percentage Wrongful dismissal 14.13 14.1 13.79 Union-related issues (e.g. employment of non-union workers, inter-union disputes) 10.46 20.51 9.46 Treatment of worker(s) 9.63 2.24 9.75 Work Environment (e.g. work conditions too cold or too hot) 8.27 0.96 8.89 Work flexibility (e.g. switching labour to alternative tasks, cover for absenteeism, work reorganisation) 7.41 0.64 8.29 Job demarcation 7.06 21.79 6.17 Working hours 5.87 3.85 6.19 Redundancy 5.61 1.28 6.01 Timing of job tasks (e.g. timing of piecework; objections to work time investigations) 4.95 6.41 4.92 Sympathy with others (largely sympathy with workers directly involved in strikes/disputes) 4.75 9.62 4.48 Supervision (e.g. objection to attitude of foreman) 4.38 3.21 4.16 Delay in/ refusal of management to open negotiations 3.56 - 4 Production constraints (e.g. shortage of work, partial plant shutdown, manning problems) 3.47 2.56 3.56 Attendance at union meeting (e.g. attendance at an unofficial meeting during working hours) 2.46 - 2.8 Use of outside labour 0.81 2.24 0.75 Apprentices (e.g. ratios of apprentices to skilled journeymen) 0.42 4.17 0.15 Miscellaneous 6.73 6.41 6.61

28
Table 2: Mean and median strike durations (days) by period and north/south Issue
Wages Only
All Pay
Non-Pay
All Issues
Pre-war Mean 60.03 43.51 9.33 28.41 Median 23 13 4 6
No. of strikes 237 383 303 686
War Mean 6.36 5.02 4.86 4.94 Median 2.5 2.5 2 2
No. of strikes 110 333 360 693
Post-war Mean 8.23 6.71 4.49 5.58 Median 3 2 1.5 2 No. of
strikes 2311 4626 4776 9402 Issue
Wage Only Wages Plus Nonwage All Issues
North Mean 20.83 15.12 7.63 11.58 Median 5 4 3 3.5
No. of strikes 1,095 2,080 1,869 3,949
South Mean 7.13 5.50 3.30 4.35 Median 2 2 1 1 No. of
strikes 1,563 3,262 3,570 6,832

29
Table 3: Description of Strike Activity (1920 – 1970)
Survival rates
No. of strikes
Mean Duration
Median Duration Day5 Day25 Day50 Day75 Day100
1920 175 58.3 10 0.7 0.33 0.27 0.26 0.23 1921 103 37.61 11 0.68 0.41 0.34 0.21 0.12 1922 33 27.7 20 0.79 0.42 0.21 0.12 0 1923 21 27.48 19 0.71 0.33 0.24 0.05 0.05 1924 33 22.09 8 0.64 0.27 0.09 0.09 0 1925 27 19.81 16 0.78 0.48 0.07 0 0 1926 7 33.29 2 0.29 0.29 0.29 0.14 0.14 1927 8 4.13 4 0.25 0 0 0 0 1928 4 3 2.5 0.25 0 0 0 0 1929 8 3.69 2.5 0.25 0 0 0 0 1930 15 16.73 6 0.6 0.13 0.07 0.07 0.07 1931 18 7.28 3 0.33 0.11 0 0 0 1932 16 36.69 29 0.81 0.56 0.38 0.19 0 1933 14 11.03 6.25 0.64 0.07 0.07 0 0 1934 23 8.18 3 0.35 0.09 0.04 0 0 1935 20 7.18 4 0.45 0.05 0 0 0 1936 45 6.96 3 0.36 0.09 0 0 0 1937 64 4.07 3 0.28 0.02 0 0 0 1938 53 6.14 2 0.3 0.04 0.02 0 0 1939 83 6.78 3 0.39 0.06 0.01 0 0 1940 59 6.33 3 0.34 0.05 0 0 0 1941 86 4.74 2 0.27 0.02 0.01 0.01 0 1942 94 4.18 2 0.23 0.02 0 0 0 1943 139 3.48 2 0.19 0.02 0 0 0 1944 113 4.77 2 0.28 0.03 0 0 0 1945 127 5.46 3 0.39 0.02 0 0 0 1946 135 6.73 3 0.36 0.07 0.01 0 0 1947 67 6.24 2 0.37 0.04 0 0 0 1948 66 5.52 2.25 0.32 0.02 0 0 0 1949 80 6.64 3.5 0.39 0.05 0 0 0 1950 93 5.08 2 0.27 0.04 0 0 0 1951 115 5.91 2 0.36 0.07 0 0 0 1952 94 6.65 2 0.3 0.11 0 0 0 1953 77 12.76 2.5 0.39 0.13 0.05 0.05 0.04 1954 120 9.4 1.5 0.33 0.14 0.05 0.01 0 1955 172 4.7 1 0.26 0.03 0 0 0 1956 179 6.94 1.5 0.25 0.07 0.02 0.02 0

30
1957 189 5.31 1 0.22 0.04 0.02 0.01 0.01 1958 225 6.85 2 0.3 0.06 0.02 0.01 0.01 1959 219 7.04 2.5 0.33 0.07 0.03 0 0 1960 240 8.31 4 0.45 0.11 0.01 0.01 0 1961 222 9.55 5 0.55 0.09 0.02 0.01 0 1962 225 9.83 4 0.49 0.1 0.03 0.01 0 1963 220 8.06 3.25 0.41 0.1 0.02 0.01 0 1964 251 8.26 4 0.44 0.09 0.03 0 0 1965 585 4.82 2 0.26 0.04 0.01 0 0 1966 744 3.83 1.5 0.18 0.02 0.01 0.01 0 1967 942 4.86 1.5 0.21 0.04 0.01 0.01 0 1968 1054 5.01 1.5 0.26 0.03 0.01 0 0 1969 1452 4.01 1 0.2 0.03 0.01 0 0 1970 1678 5.26 1.5 0.26 0.05 0.01 0 0

31
Table 4 Number of unions participating in strikes, 1920 – 1970 Number of Unions per Strike
Total Number
Percentage of Total
1 7102 66.9 2 1823 17.2 3 1169 11.0 4 288 2.7 5 119 1.1 6 51 0.5
7 or more 56 0.5 Mean number of unions per strike = 1.58
32
Table 5: Strike incidence and the business cycle: annual national unemployment rates, 1920 – 1970
1920 – 1970
1920 – 1938 1946 – 1970
P N-P P N-P P N-P Companies -0.051* -0.024 -0.028 -0.017 -0.094 -0.047 (see equation (1)) (0.023) (0.019)
(0.019) (0.025) (0.126) (0.105)
Note: * indicates significant at 5% on two-tail-test. Standard errors in parentheses.

33
Table 6 Strike durations and the business cycle, 1920 – 1970 (Annual national unemployment rates)
All years (1920 – 1970) Pre-war (1920 – 1938) Post-war (1946 – 1970) (1) (2) (3) (4) (5) (6)
Estimation Method
P N-P P N-P P N-P Ordinary Least Squares
-0.016 (0.019)
-0.0001 (0.022)
-0.034 (0.021)
0.051 (0.028)
0.329* (0.159)
0.197 (0.160)
Union Fixed Effects
0.043** (0.016)
0.014 (0.018)
0.087** (0.014)
0.029 (0.028)
0.287 (0.165)
0.191 (0.140)
Company Fixed Effects
-0.034 (0.019)
-0.008 (0.012)
-0.057 (0.038)
-0.013 (0.037)
0.299* (0.125)
0.182 (0.123)
Union and Company Fixed Effects
0.035 (0.023)
-0.0006 (0.014)
0.087 (0.049)
-0.078 (0.041)
0.234** (0.088)
0.067 (0.136)
Sample sizes (number of clusters)
5274 (51)
5334 (51)
360 (19)
296 (19)
4583 (25)
4678 (25)
Union groups (company groups)
119 (1297)
107 (1241)
56 (274)
55 (182)
83 (1023)
77 (1053)
Mean duration (days)
9.2 4.8 46.3 9.5 6.6 4.5
Notes: Annual unemployment rates taken from Denham and McDonald (1996).All regressions include a quadratic time trend. Robust standard errors allow for clustering by year. ** (*) denotes two-tail significance at 0.01 (0.05) level.

34
Table 7 Strike durations and the business cycle, 1960-1970 (Monthly district unemployment rates)
Unemployment coefficients [Dependent Variable: log duration]
P N-P ORDINARY LEAST SQUARES
0.046 0.065* (a) (year dummies) (0.048) (0.032)
0.089* 0.089** (b) (quadratic time trend) (0.045)
(0.027)
UNION FIXED EFFECTS 0.044 0.068* (a) (year dummies)
(0.047) (0.030) (b) (quadratic time trend) 0.082* 0.090** (0.040) (0.026)
COMPANY FIXED EFFECTS 0.033 0.047 (a) (year dummies)
(0.048) (0.027)
0.047 0.055* (b) (quadratic time trend) (0.039) (0.023)
UNION and COMPANY FIXED EFFECTS
(a) (year dummies) 0.014 0.073** (0.054) (0.027) (b) (quadratic time trend) 0.020 0.063** (0.042) (0.024) Sample sizes (number of clusters)
3673 (987) 3461 (942)
Union groups (company groups)
69 (864) 61 (763)
Mean duration (days)
6.6 4
Notes: The data cover 11 years by 12 months by 54 districts. All regressions include district and month dummies. Robust standard errors allow for clustering at the year/month/district level. ** (*) denotes two-tail significance at 0.01 (0.05) level.

35
Table 8 Successful strike outcomes (from the union standpoint) and the business cycle: pre- and post-war periods (National
annual unemployment rates)
Pre-war (1920 – 1938) Post-war (1946 – 1970) (1) (2) (3) (4)
Estimation Method
P N-P P N-P Ordinary Least Squares
-0.032** (0.004)
-0.020* (0.009)
-0.019 (0.049)
-0.080 (0.050)
Union Fixed Effects -0.026** (0.007)
-0.006 (0.007)
-0.035 (0.051)
-0.067 (0.044)
Company Fixed Effects -0.042** (0.009)
-0.008 (0.006)
-0.029 (0.041)
-0.051* (0.026)
Union & Company Fixed Effects
-0.028* (0.013)
0.011 (0.012)
-0.061 (0.037)
-0.062* (0.029)
Sample sizes (number of clusters)
360 (19)
296 (19)
4583 (25)
4678 (25)
Union groups (company groups)
56 (274)
55 (182)
83 (1023)
77 (1053)
Mean duration (days)
46.3 9.5 6.6 4.5
Notes: Annual unemployment rates taken from Denham and McDonald (1996).All regressions include a quadratic time trend. Robust standard errors allow for clustering by year. ** (*) denotes two-tail significance at 0.01 (0.05) level. Appendix Table 4 gives the breakdown between successful strike outcomes and unsuccessful ones.

36
Appendix Table 1: Local Unemployment Districts used in 1960-1970 regressions
1 Aberdeen 28 Leicester 2 Barrow 29 Lincoln 3 Bedfordshire 30 Liverpool 4 Belfast Marine 31 London 5 Birkenhead 32 Manchester 6 Birmingham 33 Mid Anglian 7 Blackburn 34 North East Coast 8 Bolton 35 Northern Ireland 9 Border Counties 36 North Staffordshire 10 Bradford 37 North West Scotland 11 Burnley 38 Northern Counties 12 Burton 39 Nottinghm 13 Chester 40 Oldham 14 Coventry 41 Outer London 15 Derby 42 Peterborough 16 Dundee 43 Preston 17 East Anglia 44 Rochdale 18 East Midlands 45 South Wales 19 East Scotland 46 Scottish 20 Grimsby 47 Sheffield 21 Halifax 48 Shropshire 22 Huddersfield 49 South Eastern 23 Hull 50 St Helens 24 Keighley 51 West of England 25 Kilmarnock 52 Wakefield 26 Lancashire 53 West Midlands 27 Leeds 54 Wigan
Source: Ministry of Labour Gazette (various issues), ‘Numbers Unemployed in Principal Towns and Development Areas’, London (HMSO).

37
Appendix Table 2 Stoppages of work in the Metal, Engineering and Shipbuilding Industries, 1914-1945 Year Number of strikes* Number of workers
directly and indirectly involved* (000)
Number of working days lost**
(000) 1914 232 51 1308 1915 189 46 357 1916 105 75 305 1917 225 429 3063 1918 420 242 1499 1919 335 403 12284 1920 340 183 3414 1921 151 63 4420 1922 115 369 17484 1923 103 61 5997 1924 136 71 1400 1925 94 24 184 1926 62 14 221 1927 69 16 81 1928 51 8 60 1929 80 39 768 1930 70 10 92 1931 61 12 99 1932 46 4 48 1933 68 15 112 1934 81 15 160 1935 73 17 93 1936 148 47 206 1937 220 107 778 1938 138 44 243 1939 181 56 332 1940 229 40 163 1941 472 154 556 1942 476 141 526 1943 612 170 635 1944 610 194 1048 1945 591 123 528 Source: Knowles (1952, p. 308). * Relates to strikes beginning in year ** Relates to strikes in progress during year

38
Appendix Table 3 Strike frequency by union No. of Strikes Freq. Percent Cum.%
No. of Strikes Freq. Percent Cum.%
1 43 29.25 29.25 40 1 0.68 81.63 2 23 15.65 44.90 42 1 0.68 82.31 3 6 4.08 48.98 51 1 0.68 82.99 4 4 2.72 51.70 56 1 0.68 83.67 5 5 3.40 55.10 59 1 0.68 84.35 6 3 2.04 57.14 71 1 0.68 85.03 7 1 0.68 57.82 80 1 0.68 85.71 8 2 1.36 59.18 84 2 1.36 87.07 9 3 2.04 61.22 85 1 0.68 87.76 10 3 2.04 63.27 96 1 0.68 88.44 11 5 3.40 66.67 97 1 0.68 89.12 12 1 0.68 67.35 104 2 1.36 90.48 13 2 1.36 68.71 132 1 0.68 91.16 14 2 1.36 70.07 209 1 0.68 91.84 16 1 0.68 70.75 213 1 0.68 92.52 17 2 1.36 72.11 235 1 0.68 93.20 19 1 0.68 72.79 243 1 0.68 93.88 20 2 1.36 74.15 252 1 0.68 94.56 23 2 1.36 75.51 313 1 0.68 95.24 24 2 1.36 76.87 390 1 0.68 95.92 25 1 0.68 77.55 416 1 0.68 96.60 28 1 0.68 78.23 824 1 0.68 97.28 30 1 0.68 78.91 1107 1 0.68 97.96 31 1 0.68 79.59 1198 1 0.68 98.64 33 1 0.68 80.27 1482 1 0.68 99.32 39 1 0.68 80.95 1785 1 0.68 100.00 Total 147

39
Appendix Table 4
Classification of strike outcomes Unsuccessful Successful Work resumed unconditionally Discussions/Investigations opened Work resumed. Discussions resumed. Matter resolved pending discussions Strike continued into following year Partial concessions made Workers dismissed Full demands met Workers voluntarily left company Work resumed Miscellaneous Miscellaneous