Embed Size (px)
Citation preview
New Zealand Journal of Forestry Science Vol. 10 No. 2 (1980): 419-38
A GRADE INDEX FOR PRUNED BUTT LOGS
J. C. PARK Forest Research Institute, New Zealand Forest Service,
Private Bag, Rotorua, New Zealand
Sixty-three straight pruned radiata pine butt logs 4.9 m long were sawn exclusively to 25 mm boards under a standard pattern in three timber grade studies. Produce was graded by the National Timber Grading Rules (NZS 3631 : 1978) and timber prices from the Waipa Wholesale Price List 1978 were applied. No price was available for clears so a range of three was used. Variation in the price for clears was found to have a very significant effect on log values. Because the random occurrence of resin pockets can confound results, basic data used in this paper are from grades produced when resin pockets were ignored.
Results showed the production of clearwood and values and grades realised from pruned butt logs are determined by three major factors: log size, defect core size, and log conversion percentage. A Grade Index has been derived in which the relationship of these factors is expressed as:
dbh x log conversion Grade Index = .
defect core
Data from the 3 studies were combined in a Grade Index Model which defines a pruned log value gradient, the expected outturn in clears, and gives an approximation of the proportions in other grades. Results from an independent fourth sample of 12 logs were used to validate the Grade Index Model.
Because the Grade Index is an expression of the quality of pruned butt logs which may be used either predictively or reflectively, applications to stand planning, evaluations of silvicultural regimes, and evaluations of existing pruned stands are proposed. Future application of Grade Index to real stands would be facilitated by more detailed forest records on the timing, implementation, and result of pruning operations. Further research into the classification and effect of deviations from straightness in pruned butt logs is also necessary because at present the index is confined to straight logs.
Because the principles are fundamental, it is likely that the Grade Index could be applied to some species other than P. radiata and adapted to accommodate other sets of grading criteria which differentiate between pith and knotty grades, clearcuttings grades, and clear grades.
INTRODUCTION Although objectives in pruning may be to provide for fire protection and access,
the predominant reasons for pruning radiata pine in New Zealand are to maximise the production of clearwood and to reduce degrade (Sutton 1971). Thinning should be prescribed along with pruning in order to boost diameter growth on final crop trees and so produce a satisfactory clearwood sheath in the shortest possible time
Received 12 June 1980; revision 15 August 1980
420 New Zealand Journal of Forestry Science Vol. 10 No. 2 (1980)
(Fenton et al. 1912). The effect of these thinnings on the quality of the upper unpruned logs is under study in a separate project being undertaken at the Forest Research Institute. This paper deals with the quality of pruned butt logs only.
The quality of pruned butt logs when sawn must necessarily be determined by the proportions of grades in the sawn outturn and the relative values of these. The most obvious contribution to increases in value is the production of full length clears. However, if pruning is late and/or final log size small, the production of clears is minimised and at worst may not occur at all. A major result of pruning is an increase in clear-cuttings and therefore factory grade (Fenton & Familton 1961; Fenton 1967). A further result is grade improvement by the restriction of branch size and the prevention of bark encased knots. Therefore, to evaluate the effect of pruning it is not sufficient to look only at the production of clears but rather to examine the total produce of pruned logs.
Four studies, in which straight, pruned radiata pine butt logs were sawn exclusively to 25 mm thick boards, investigated the effect of the interaction between log size and defect core size on the values and grades of sawn outturn. Sample size was kept small (15-25 logs per sample) to allow very intensive measurements on each log and its produce. Because the object was to define basic relationships, logs were analysed as individuals. Samples did not represent the stands from which they were drawn but were aimed at covering the greatest number of log size/defect core combinations available. The Grade Index presented in this paper was derived as a means of expressing pruned log quality, and data from 3 of the studies have been used to construct a Grade Index Model. Results from the fourth study have been used to validate this model.
Because the principles put forward here are based on physical parameters, results should be adaptable to some species other than radiata pine and to other sets of grading criteria which differentiate between pith and knotty grades, clearcuttings grades, and clear grades.
BASIC DATA AND METHODS
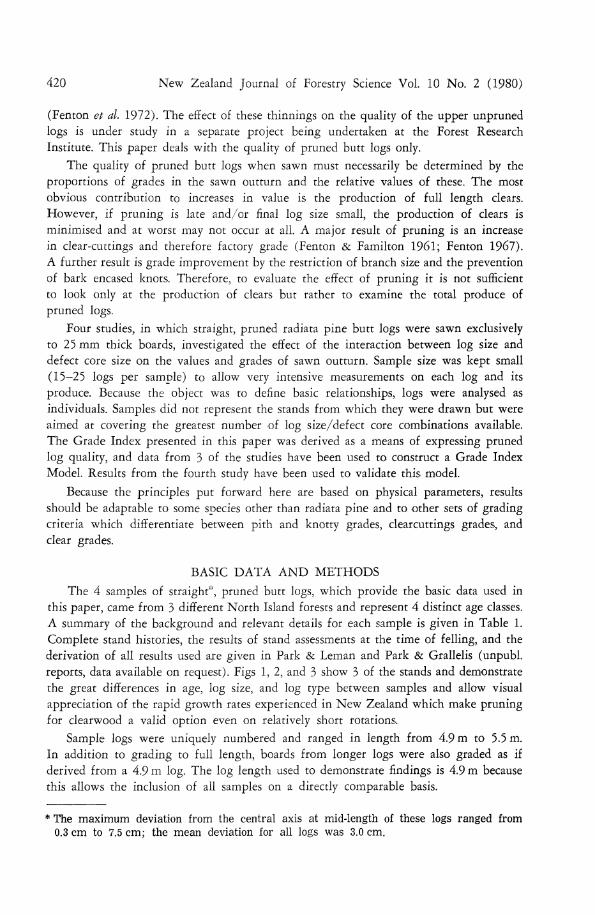
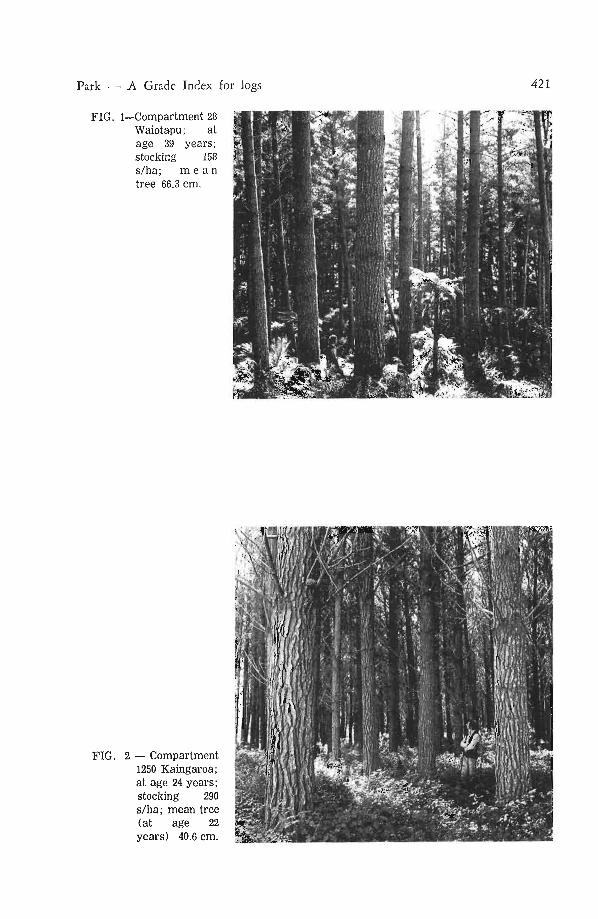
The 4 samples of straight*, pruned butt logs, which provide the basic data used in this paper, came from 3 different North Island forests and represent 4 distinct age classes. A summary of the background and relevant details for each sample is given in Table 1. Complete stand histories, the results of stand assessments at the time of felling, and the derivation of all results used are given in Park & Leman and Park & Grallelis (unpubl. reports, data available on request). Figs 1, 2, and 3 show 3 of the stands and demonstrate the great differences in age, log size, and log type between samples and allow visual appreciation of the rapid growth rates experienced in New Zealand which make pruning for clearwood a valid option even on relatively short rotations-
Sample logs were uniquely numbered and ranged in length from 4.9 m to 5.5 m. In addition to grading to full length, boards from longer logs were also graded as if derived from a 4.9 m log. The log length used to demonstrate findings is 4.9 m because this allows the inclusion of all samples on a directly comparable basis.
The maximum deviation from the central axis at mid-length of these logs ranged from 0.3 cm to 7.5 cm; the mean deviation for all logs was 3.0 cm.
Park — A Grade Index for logs 421
FIG. 1—Compartment 23 Waiotapu; at age 39 years; stocking 158 s/ha; m e a n tree 66.3 cm.
M
FIG. 2 — Compartment 1250 Kaingaroa; at age 24 years; stocking 290 s/ha; mean tree (at age 22 years) 40.6 cm.
422 New Zealand Journal of Forestry Science Vol. 10 No. 2 (1980)
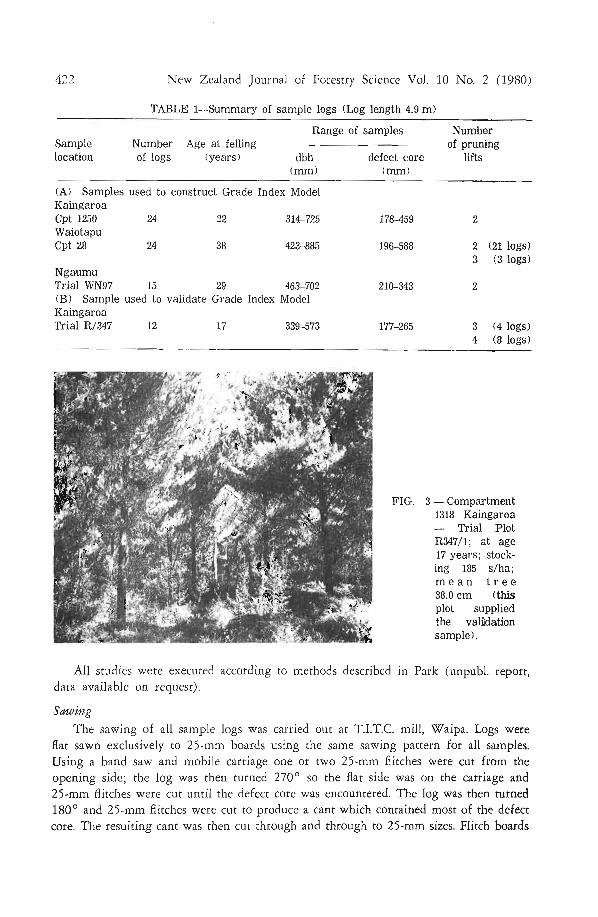
TABLE 1—Summary of sample logs (Log length 4.9 m)
Sample Number Age at felling location of logs (years)
Range of samples
dbh (mm)
(A) Samples used to construct Grade Index Model Kaingaroa Cpt 1250 24 22 314-725 Waiotapu Cpt 28 24 38 423-885
Ngaumu Trial WN97 15 29 463-702 (B) Sample used to validate Grade Index Model Kaingaroa Trial R/347 12 17 339-573
defect core (mm)
Number of pruning
lifts
178-459
196-588
210-343
177-265
2 (21 logs) 3 (3 logs)
3 (4 logs) 4 (8 logs)
FIG. 3 — Compartment 1318 Kaingaroa — Trial Plot R347/1; at age 17 years; stocking 185 s/ha; m e a n t r e e 38.0 cm (this plot supplied the validation sample).
All studies were executed according to methods described in Park (unpubl. report, data available on request).
Sawing
The sawing of all sample logs was carried out at T.I.T.C. mill, Waipa. Logs were flat sawn exclusively to 25-mm boards using the same sawing pattern for all samples. Using a band saw and mobile carriage one or two 25-mm flitches were cut from the opening side; the log was then turned 270° so the flat side was on the carriage and 25-mm flitches were cut until the defect core was encountered. The log was then turned 180° and 25-mm flitches were cut to produce a cant which contained most of the defect core. The resulting cant was then cut through and through to 25-mm sizes. Flitch boards
Park — A Grade Index for logs 423
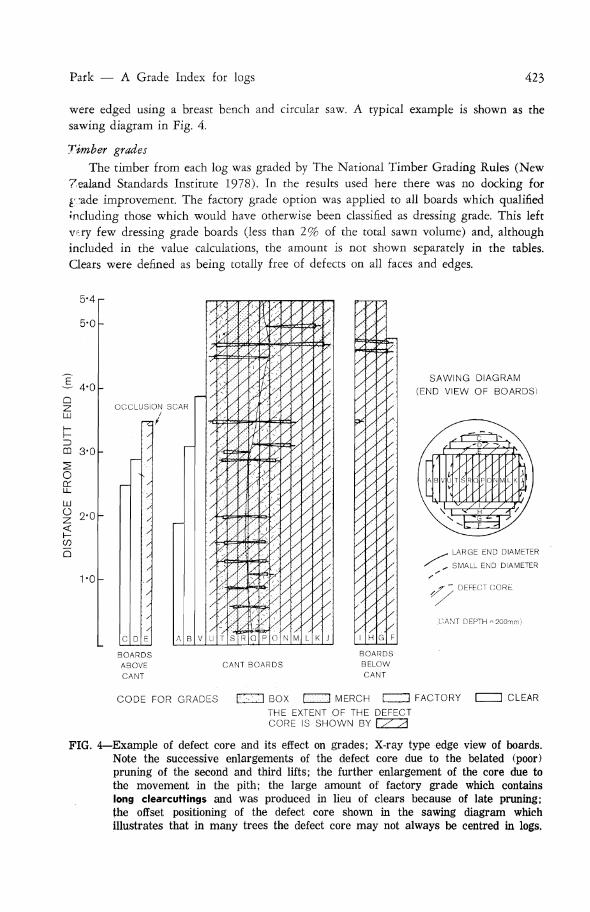
were edged using a breast bench and circular saw. A typical example is shown as the sawing diagram in Fig. 4.
Timber grades
The timber from each log was graded by The National Timber Grading Rules (New Zealand Standards Institute 1978). In the results used here there was no docking for £ *ade improvement. The factory grade option was applied to all boards which qualified <neluding those which would have otherwise been classified as dressing grade. This left very few dressing grade boards (less than 2% of the total sawn volume) and, although included in the value calculations, the amount is not shown separately in the tables. Clears were defined as being totally free of defects on all faces and edges.
5-4
5-0
— 4-0
CQ
o er LL
LU
o < I -Q
3-0
2-0
1-0
OC C LUSION SCAR /
3/
C D E
BOARDS ABOVE CANT
SAWING DIAGRAM (END VIEW OF BOARDS)
. LARGE END DIAMETER
SMALL END DIAMETER
" DEFECT CORE
;CANT DEPTH-200m r
CANT BOARDS
CODE FOR GRADES F ^ T I BOX MERCH D FACTORY CLEAR
THE EXTENT OF THE DEFECT CORE IS SHOWN BY 1 X A
FIG. 4—Example of defect core and its effect on grades; X-ray type edge view of boards. Note the successive enlargements of the defect core due to the belated (poor) pruning of the second and third lifts; the further enlargement of the core due to the movement in the pith; the large amount of factory grade which contains long cleat-cuttings and was produced in lieu of clears because of late pruning; the offset positioning of the defect core shown in the sawing diagram which illustrates that in many trees the defect core may not always be centred in logs.
424 New Zealand Journal of Forestry Science Vol. 10 No. 2 (1980)
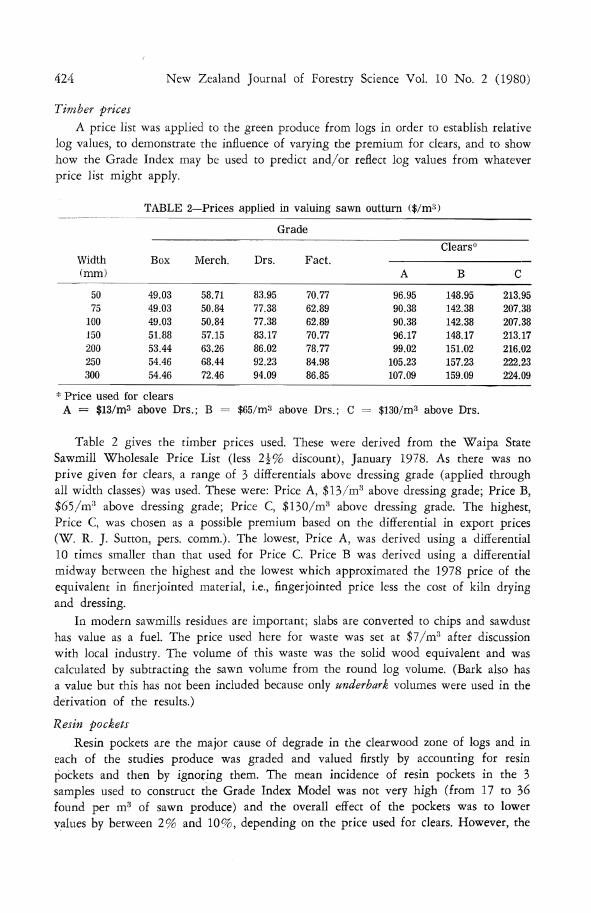
Timber prices
A price list was applied to the green produce from logs in order to establish relative log values, to demonstrate the influence of varying the premium for clears, and to show how the Grade Index may be used to predict and/or reflect log values from whatever price list might apply.
TABLE 2—Prices applied in valuing sawn outturn ($/m3)
Width (mm)
50 75
100 150 200 250 300
Box
49.03 49.03 49.03 51.88 53.44 54.46 54.46
* Pr ice used for clears A = $13/m3 above Drs
Merch.
58.71 50.84 50.84 57.15 63.26 68.44 72.46
.; B =
Grade
Drs.
83.95 77.38 77.38 83.17 86.02 92.23 94.09
Fact .
70.77 62.89 62.89 70.77 78.77 84.98 86.85
$65/m3 above Drs.; C
A
96.95 90.38 90.38 96.17 99.02
105.23 107.09
Clears*
B
148.95 142.38 142.38 148.17 151.02 157.23 159.09
= $130/m3 above Drs.
C
213.95 207.38 207.38 213.17 216.02 222.23 224.09
Table 2 gives the timber prices used. These were derived from the Waipa State Sawmill Wholesale Price List (less 2^% discount), January 1978. As there was no prive given for clears, a range of 3 differentials above dressing grade (applied through all width classes) was used. These were: Price A, $13/m3 above dressing grade; Price B, $65/m3 above dressing grade; Price C, $130/m3 above dressing grade. The highest, Price C, was chosen as a possible premium based on the differential in export prices (W. R. J. Sutton, pers. comm.). The lowest, Price A, was derived using a differential 10 times smaller than that used for Price C. Price B was derived using a differential midway between the highest and the lowest which approximated the 1978 price of the equivalent in finerjointed material, i.e., fingerjointed price less the cost of kiln drying and dressing.
In modern sawmills residues are important; slabs are converted to chips and sawdust has value as a fuel. The price used here for waste was set at $7/m3 after discussion with local industry. The volume of this waste was the solid wood equivalent and was calculated by subtracting the sawn volume from the round log volume. (Bark also has a value but this has not been included because only underbark volumes were used in the derivation of the results.)
Resin pockets
Resin pockets are the major cause of degrade in the clearwood zone of logs and in each of the studies produce was graded and valued firstly by accounting for resin pockets and then by ignoring them. The mean incidence of resin pockets in the 3 samples used to construct the Grade Index Model was not very high (from 17 to 36 found per m3 of sawn produce) and the overall effect of the pockets was to lower values by between 2% and 10%, depending on the price used for clears. However, the
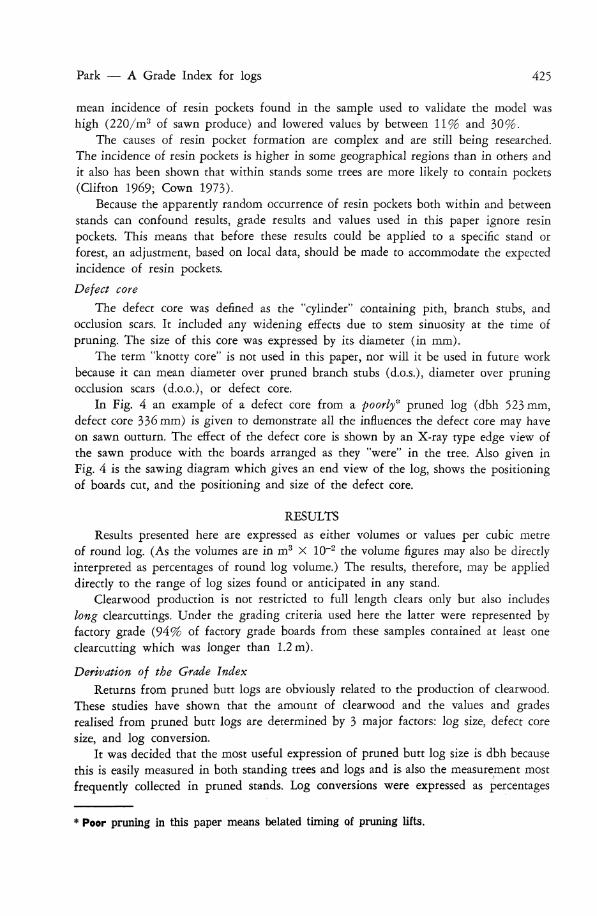
Park — A Grade Index for logs 425
mean incidence of resin pockets found in the sample used to validate the model was high (220/m3 of sawn produce) and lowered values by between 1 1 % and 30%.
The causes of resin pocket formation are complex and are still being researched. The incidence of resin pockets is higher in some geographical regions than in others and it also has been shown that within stands some trees are more likely to contain pockets (Clifton 1969; Cown 1973).
Because the apparently random occurrence of resin pockets both within and between stands can confound results, grade results and values used in this paper ignore resin pockets. This means that before these results could be applied to' a specific stand or forest, an adjustment, based on local data, should be made to accommodate the expected incidence of resin pockets.
Defect core
The defect core was defined as the "cylinder" containing pith, branch stubs, and occlusion scars. It included any widening effects due to stem sinuosity at the time of pruning. The size of this core was expressed by its diameter (in mm).
The term "knotty core" is not used in this paper, nor will it be used in future work because it can mean diameter over pruned branch stubs (d.o.s.), diameter over pruning occlusion scars (d.o.o.), or defect core.
In Fig. 4 an example of a defect core from a poorly* pruned log (dbh 523 mm, defect core 336 mm) is given to demonstrate all the influences the defect core may have on sawn outturn. The effect of the defect core is shown by an X-ray type edge view of the sawn produce with the boards arranged as they "were" in the tree. Also given in Fig. 4 is the sawing diagram which gives an end view of the log, shows the positioning of boards cut, and the positioning and size of the defect core.
RESULTS
Results presented here are expressed as either volumes or values per cubic metre of round log. (As the volumes are in m3 X IO-2 the volume figures may also be directly interpreted as percentages of round log volume.) The results, therefore, may be applied directly to the range of log sizes found or anticipated in any stand.
Clearwood production is not restricted to full length clears only but also includes long clear cuttings. Under the grading criteria used here the latter were represented by factory grade (94% of factory grade boards from these samples contained at least one clearcutting which was longer than 1.2 m).
Derivation of the Grade Index
Returns from pruned butt logs are obviously related to the production of clearwood. These studies have shown that the amount of clearwood and the values and grades realised from pruned butt logs are determined by 3 major factors: log size, defect core size, and log conversion.
It was decided that the most useful expression of pruned butt log size is dbh because this is easily measured in both standing trees and logs and is also the measurement most frequently collected in pruned stands. Log conversions were expressed as percentages
* Poor pruning in this paper means belated timing of pruning lifts.
426 New Zealand Journal of Forestry Science Vol. 10 No. 2 (1980)
(preceded by a decimal point) and derived by dividing the volume of sawn timber by the log volume. Defect core size has already been defined.
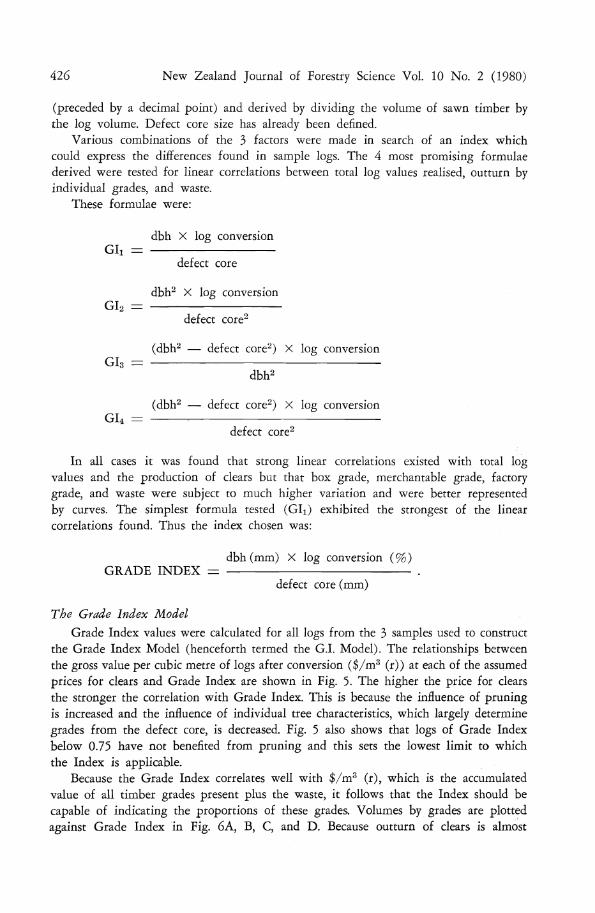
Various combinations of the 3 factors were made in search of an index which could express the differences found in sample logs. The 4 most promising formulae derived were tested for linear correlations between total log values realised, outturn by individual grades, and waste.
These formulae were:
dbh X log conversion GIi =
defect core
dbh2 X log conversion GI2 =
defect core2
(dbh2 — defect core2) X log conversion GI3 =
dbh2
(dbh2 — defect core2) X log conversion GI4 = •
defect core2
In all cases it was found that strong linear correlations existed with total log values and the production of clears but that box grade, merchantable grade, factory grade, and waste were subject to much higher variation and were better represented by curves. The simplest formula tested (GIi) exhibited the strongest of the linear correlations found. Thus the index chosen was:
dbh (mm) X log conversion (%) GRADE INDEX = .
defect core (mm)
The Grade Index Model
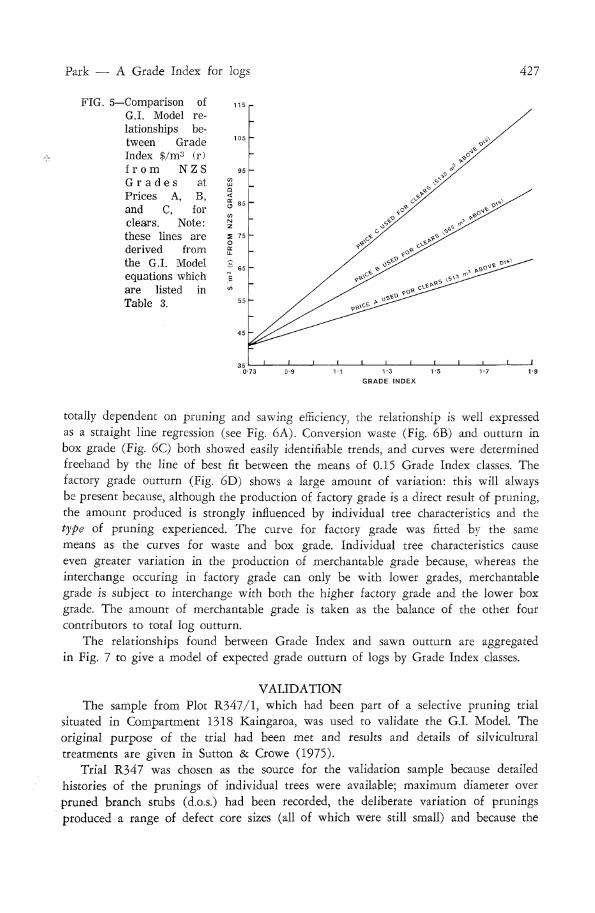
Grade Index values were calculated for all logs from the 3 samples used to construct the Grade Index Model (henceforth termed the G.I. Model). The relationships between the gross value per cubic metre of logs after conversion ($/m3 (r)) at each of the assumed prices for clears and Grade Index are shown in Fig. 5. The higher the price for clears the stronger the correlation with Grade Index. This is because the influence of pruning is increased and the influence of individual tree characteristics, which largely determine grades from the defect core, is decreased. Fig. 5 also shows that logs of Grade Index below 0.75 have not benefited from pruning and this sets the lowest limit to which the Index is applicable.
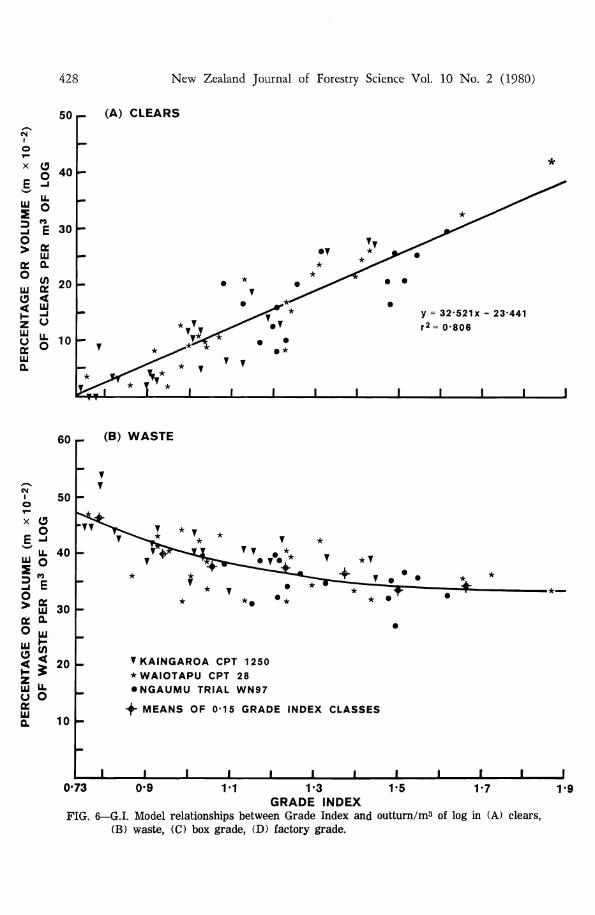
Because the Grade Index correlates well with $/m3 (r), which is the accumulated value of all timber grades present plus the waste, it follows that the Index should be capable of indicating the proportions of these grades. Volumes by grades are plotted against Grade Index in Fig. 6A, B, C, and D. Because outturn of clears is almost
Park — A Grade Index for logs 427
FIG. 5- -Comparison of G.I. Model relationships between Grade Index $/m3 (r) f r o m N Z S G r a d e s at Prices A, B, and C, for clears. Note: these lines are derived from the G.I. Model equations which are listed in Table 3.
5 75 O
,*v .»*:
0 5 ^ f O *
•*+>
C ^
l i l l i I I I I 1-3 1-5
GRADE INDEX
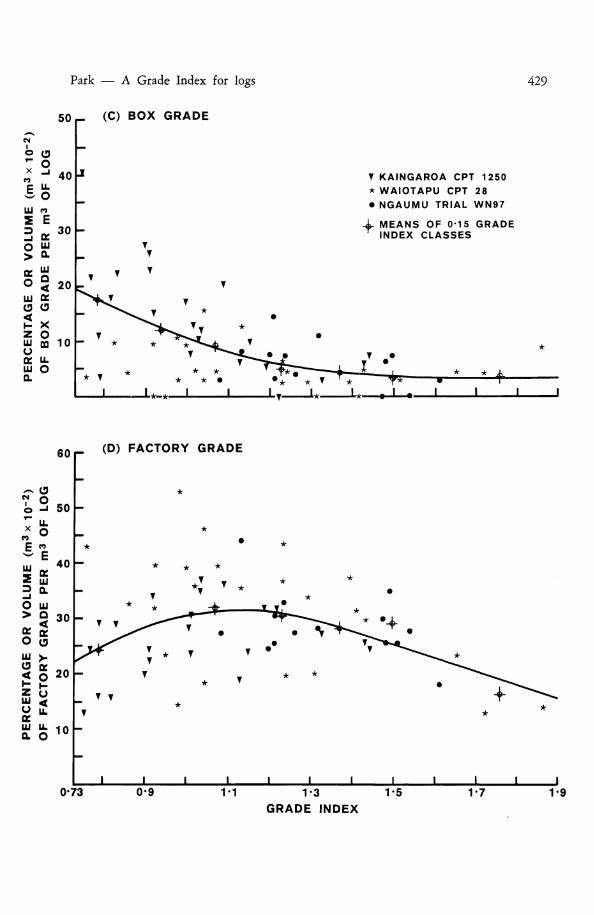
totally dependent on pruning and sawing efficiency, the relationship is well expressed as a straight line regression (see Fig. 6A). Conversion waste (Fig. 6B) and outturn in box grade (Fig. 6C) both showed easily identifiable trends, and curves were determined freehand by the line of best fit between the means of 0.15 Grade Index classes. The factory grade outturn (Fig. 6D) shows a large amount of variation: this will always be present because, although the production of factory grade is a direct result of pruning, the amount produced is strongly influenced by individual tree characteristics and the type of pruning experienced. The curve for factory grade was fitted by the same means as the curves for waste and box grade. Individual tree characteristics cause even greater variation in the production of merchantable grade because, whereas the interchange occuring in factory grade can only be with lower grades, merchantable grade is subject to interchange with both the higher factory grade and the lower box grade. The amount of merchantable grade is taken as the balance of the other four contributors to total log outturn.
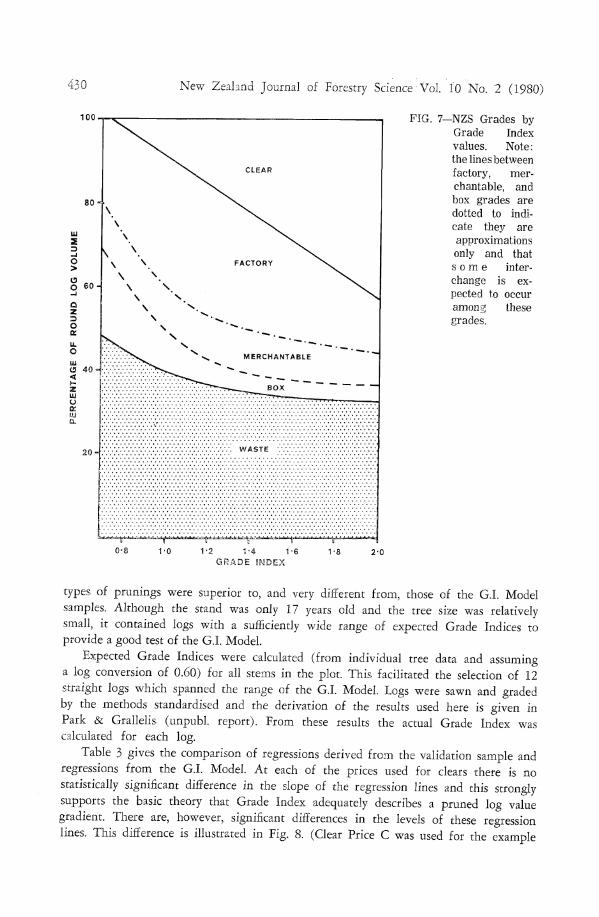
The relationships found between Grade Index and sawn outturn are aggregated in Fig. 7 to give a model of expected grade outturn of logs by Grade Index classes.
VALIDATION The sample from Plot R347/1, which had been part of a selective pruning trial
situated in Compartment 1318 Kaingaroa, was used to validate the G.I. Model. The original purpose of the trial had been met and results and details of silvicultural treatments are given in Sutton & Crowe (1975).
Trial R347 was chosen as the source for the validation sample because detailed histories of the prunings of individual trees were available; maximum diameter over pruned branch stubs (d.o.s.) had been recorded, the deliberate variation of prunings produced a range of defect core sizes (all of which were still small) and because the
428 New Zealand Journal of Forestry Science Vol. 10 No. 2 (1980)
50 r- (A) CLEARS
1
o T"
X
b >w
LU
2 D -J
O > OC
o LU
o
NTA
R
CE
LU
a
o o - i
IL
o E oc LU a er <
CLE
LL
o
40
30
20
10
y - 32-521X - 23441 r2= 0-806
1 * I I I I
6 0 - (B) WASTE
50
x O
E 2 LL 4 0
30
LU
2 3 - J O > tt o
TA
GE
Z LU O OC LU 0.
o CO
E OC LU 0 .
LU
WA
ST
u. O
20
10
T
0-73
T KAINGAROA CPT 1250 •WAIOTAPU CPT 28 • NGAUMU TRIAL WN97
- f MEANS OF 0-15 GRADE INDEX CLASSES
X x X X X X X X 0-9 1-1 1-5 1-7
X 1-3
GRADE INDEX FIG. 6—G.I. Model relationships between Grade Index and outturn/m8 of log in (A) clears,
(B) waste, (C) box grade, (D) factory grade.
Park — A Grade Index for logs 429
50 r- (C) BOX GRADE
40
30
20
10
T KAINGAROA CPT 1250
• WAIOTAPU CPT 28 • NGAUMU TRIAL WN97
+ MEANS OF 0-15 GRADE INDEX CLASSES
o -I 50 h
60
50
40
30
20
10
r (D)
•
" • T
_ f T
T
FACTORY GRADE
•
f * *
T
I
•
•
• *
* •
• •
- J I
•
• •
• *
- J I
•
i i
^ * ^ *
«
- j
*
J L
*
I 0-73 0-9 1-1 1-3
GRADE INDEX
1-5 1-7 1-9
430 New Zealand Journal of Forestry Science Vol. 10 No. 2 (1980)
100 FIG. 7—NZS Grades by Grade Index values. Note: the lines between factory, merchantable, and box grades are dotted to indicate they are approximations only and that s o m e interchange is expected to occur among these grades.
1-2 1-4 1-6 GRADE INDEX
types of prunings were superior to, and very different from, those of the G.I. Model samples. Although the stand was only 17 years old and the tree size was relatively small, it contained logs with a sufficiently wide range of expected Grade Indices to provide a good test of the G.I. Model.
Expected Grade Indices were calculated (from individual tree data and assuming a log conversion of 0.60) for all stems in the plot. This facilitated the selection of 12 straight logs which spanned the range of the G.I. Model. Logs were sawn and graded by the methods standardised and the derivation of the results used here is given in Park & Grallelis (unpubl. report). From these results the actual Grade Index was calculated for each log.
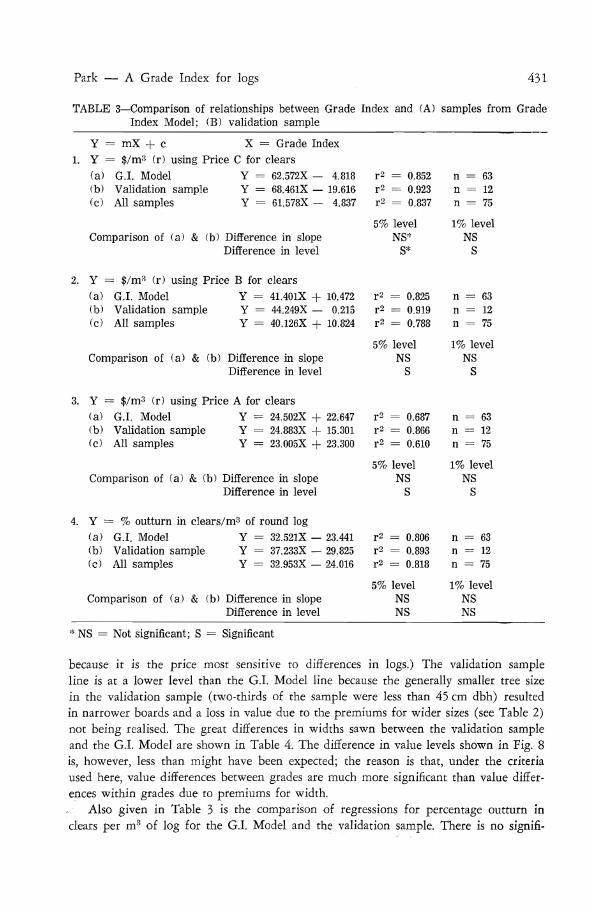
Table 3 gives the comparison of regressions derived from the validation sample and regressions from the G.I. Model. At each of the prices used for clears there is no statistically significant difference in the slope of the regression lines and this strongly supports the basic theory that Grade Index adequately describes a pruned log value gradient. There are, however, significant differences in the levels of these regression lines. This difference is illustrated in Fig. 8. (Clear Price C was used for the example
Park — A Grade Index for logs 431
TABLE 3—Comparison of relationships between Grade Index and (A) samples from Grade Index Model; (B) validation sample
Y = mX -f c X = Grade Index 1. Y = $/m3 (r) using Price C for clears
(a) G.I. Model Y = 62.572X — 4.818 (b) Validation sample Y = 68.461X — 19.616 (c) All samples Y = 61.578X — 4.837
Comparison of (a) & (b) Difference in slope Difference in level
2. Y = $/m3 (r) using Price B for clears (a) G.I. Model Y = 41.401X + 10.472 '"(b) Validation sample Y = 44.249X — 0.215 (c) All samples Y = 40.126X + 10.824
Comparison of (a) & (b) Difference in slope Difference in level
3. Y = $/m3 (r) using Price A for clears (a) G.I. Model Y = 24.502X + 22.647 (b) Validation sample Y = 24.883X + 15.301 (c) All samples Y = 23.005X + 23.300
Comparison of (a) & (b) Difference in slope Difference in level
4. Y = % outturn in clears/m3 of round log (a) G.I. Model Y = 32.521X — 23.441 (b) Validation sample Y = 37.233X — 29.825 (c) All samples Y = 32.953X — 24.016
Comparison of (a) & (b) Difference in slope Difference in level
* NS = Not significant; S = Significant
because it is the price most sensitive to differences in logs.) The validation sample line is at a lower level than the G.I. Model line because the generally smaller tree size in the validation sample (two-thirds of the sample were less than 45 cm dbh) resulted in narrower boards and a loss in value due to the premiums for wider sizes (see Table 2) not being realised. The great differences in widths sawn between the validation sample and the G.I. Model are shown in Table 4. The difference in value levels shown in Fig. 8 is, however, less than might have been expected; the reason is that, under the criteria used here, value differences between grades are much more significant than value differences within grades due to premiums for width.
Also given in Table 3 is the comparison of regressions for percentage outturn in clears per m3 of log for the G.I. Model and the validation sample. There is no signifi-
r2 = 0.852 r2 = 0.923 r2 = 0.837
5% level NS*
S*
r2 = 0.825 r2 = 0.919 r2 = 0.788
5% level NS
S
r2 = 0.687 r2 = 0.866 r2 = 0.610
5% level NS
S
r2 = 0.806 r2 = 0.893 r2 = 0.818
5% level NS NS
n = 63 n = 12 n = 75
1% level NS
S
n = 63 n = 12 n = 75
1% level NS
S
n = 63 n = 12 n = 75
1% level NS
S
n = 63 n = 12 n = 75
1% level NS NS
432 New Zealand Journal of Forestry Science Vol. 10 No. 2 (1980)
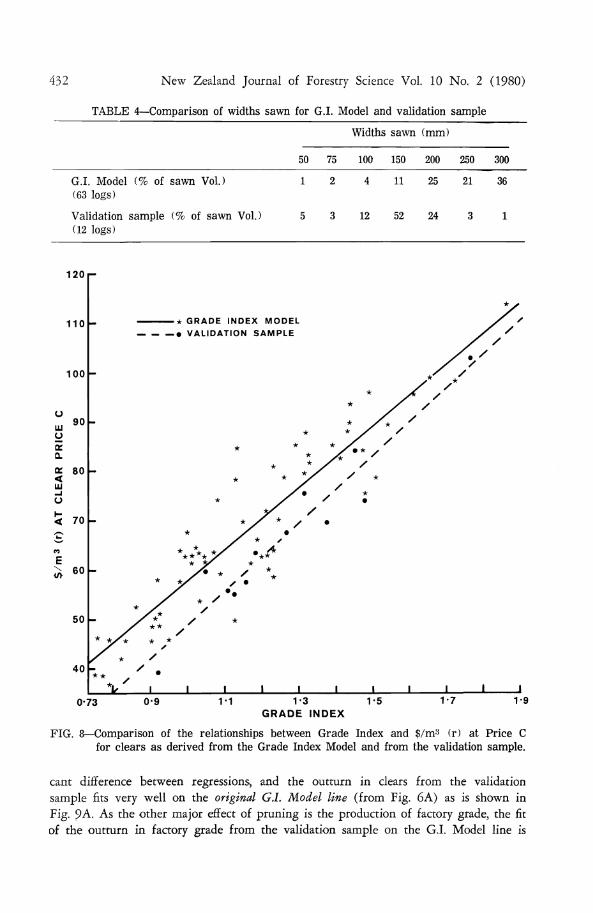
TABLE 4—Comparison of widths sawn for G.I. Model and validation sample
Widths sawn (mm)
50 75 100 150 200 250 300
G.I. Model (% of sawn Vol.) (63 logs)
Validation sample (% of sawn Vol.) (12 logs)
12
11
52
25
24
21 36
120i-
0-73 1-3 GRADE INDEX
1-9
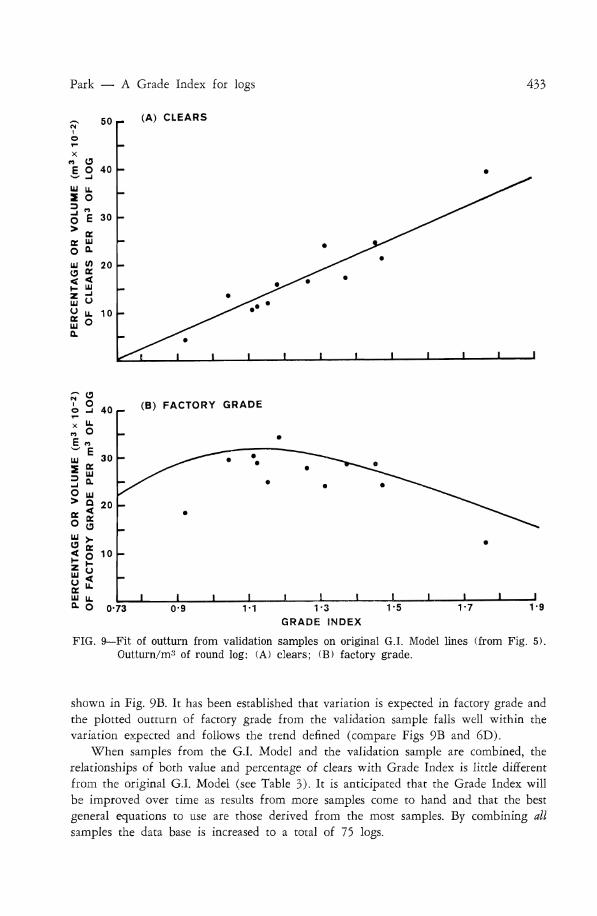
FIG. 8—Comparison of the relationships between Grade Index and $/m3 (r) at Price C for clears as derived from the Grade Index Model and from the validation sample.
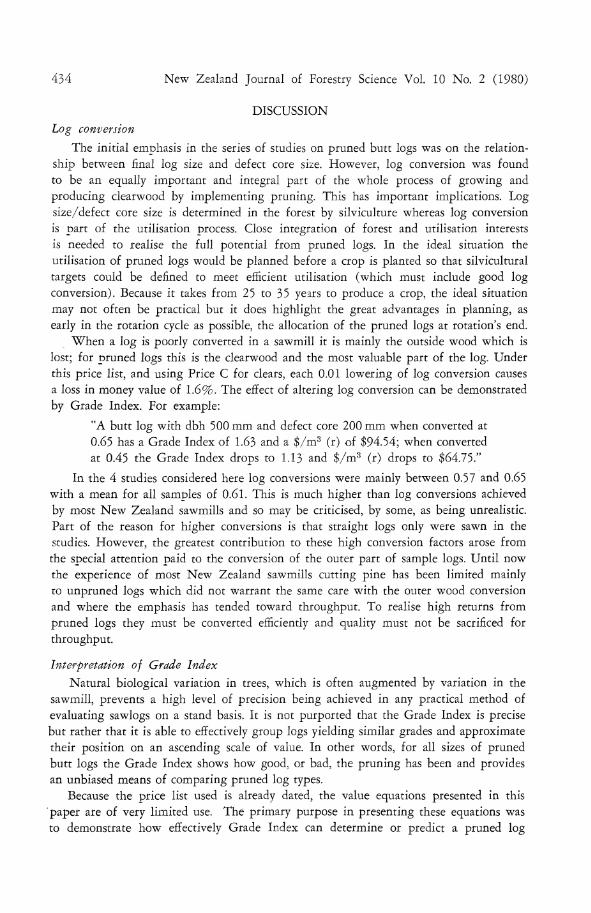
cant difference between regressions, and the outturn in clears from the validation sample fits very well on the original G.I. Model line (from Fig. 6A) as is shown in Fig. 9A. As the other major effect of pruning is the production of factory grade, the fit of the outturn in factory grade from the validation sample on the G.I. Model line is
Park — A Grade Index for logs 433
, _ (A) CLEARS
i O o - i 40 r-x fe w O E n w E
* LU
3 *
40
30
20
10
(B) FACTORY GRADE
•
^ * r *" yr %
•
J 1.™ _!,,._ J J
• •
± _
- - " •w*
• "̂*",**,***̂ I>|>
J \ 1
•
l .-1 J O 0-73 0-9 1-1 1-3 1-5
GRADE INDEX
1-7 1-9
FIG. 9—Fit of outturn from validation samples on original G.I. Model lines (from Fig. 5). Outturn/m3 of round log: (A) clears; (B) factory grade.
shown in Fig. 9B. It has been established that variation is expected in factory grade and the plotted outturn of factory grade from the validation sample falls well within the variation expected and follows the trend denned (compare Figs 9B and 6D).
When samples from the G.I. Model and the validation sample are combined, the relationships of both value and percentage of clears with Grade Index is little different from the original G.I. Model (see Table 3). It is anticipated that the Grade Index will be improved over time as results from more samples come to hand and that the best general equations to use are those derived from the most samples. By combining all samples the data base is increased to a total of 75 logs.
434 New Zealand Journal of Forestry Science Vol. 10 No. 2 (1980)
DISCUSSION
Log conversion
The initial emphasis in the series of studies on pruned butt logs was on the relationship between final log size and defect core size. However, log conversion was found to be an equally important and integral part of the whole process of growing and producing clearwood by implementing pruning. This has important implications. Log size/defect core size is determined in the forest by silviculture whereas log conversion is part of the utilisation process. Close integration of forest and utilisation interests is needed to realise the full potential from pruned logs. In the ideal situation the utilisation of pruned logs would be planned before a crop is planted so that silvicultural targets could be defined to meet efficient utilisation (which must include good log conversion). Because it takes from 25 to 35 years to produce a crop, the ideal situation may not often be practical but it does highlight the great advantages in planning, as early in the rotation cycle as possible, the allocation of the pruned logs at rotation's end.
When a log is poorly converted in a sawmill it is mainly the outside wood which is lost; for pruned logs this is the clearwood and the most valuable part of the log. Under this price list, and using Price C for clears, each 0.01 lowering of log conversion causes a loss in money value of 1.6%. The effect of altering log conversion can be demonstrated by Grade Index. For example:
"A butt log with dbh 500 mm and defect core 200 mm when converted at 0.65 has a Grade Index of 1.63 and a $/m3 (r) of $94.54; when converted at 0.45 the Grade Index drops to 1.13 and $/m3 (r) drops to $64.75."
In the 4 studies considered here log conversions were mainly between 0.57 and 0.65 with a mean for all samples of 0.61. This is much higher than log conversions achieved by most New Zealand sawmills and so may be criticised, by some, as being unrealistic. Part of the reason for higher conversions is that straight logs only were sawn in the studies. However, the greatest contribution to these high conversion factors arose from the special attention paid to the conversion of the outer part of sample logs. Until now the experience of most New Zealand sawmills cutting pine has been limited mainly to unpruned logs which did not warrant the same care with the outer wood conversion and where the emphasis has tended toward throughput. To realise high returns from pruned logs they must be converted efficiently and quality must not be sacrificed for throughput.
Interpretation of Grade Index
Natural biological variation in trees, which is often augmented by variation in the sawmill, prevents a high level of precision being achieved in any practical method of evaluating sawlogs on a stand basis. It is not purported that the Grade Index is precise but rather that it is able to effectively group logs yielding similar grades and approximate their position on an ascending scale of value. In other words, for all sizes of pruned butt logs the Grade Index shows how good, or bad, the pruning has been and provides an unbiased means of comparing pruned log types.
Because the price list used is already dated, the value equations presented in this paper are of very limited use. The primary purpose in presenting these equations was to demonstrate how effectively Grade Index can determine or predict a. pruned log
Park — A Grade Index for logs 435
value gradient. However, the data base used here is permanently stored on computer and so may be revalued at any time by substituting a different price list in the program. Results are immediate and new Grade Index value equations are easily derived.
In the author's opinion, general Grade Index/value equations are sufficient for most purposes but the Grade Index does become more accurate when confined to a specific sample. For example, the comparison of results from the validation sample and the G.I. Model (Fig. 8) identified value differences due to width premiums and this suggests that separate Grade Index/value equations may become necessary for smaller logs, i.e., less than 45 cm dbh, if greater accuracy is required or if width differentials become larger.
Because dollar values on logs are constantly changing, an expression of potential value which will remain constant over time is very useful; especially to those without access to a solid data base. The Grade Index fulfills this function for pruned butt logs and an interpretation of what Grade Indices mean is given below:
Grade Index values below 0.75 show pruning has not been effective;
Grade Index values below 1.00 unsatisfactory;
Grade Index values above 1.40 good;
Grade Index values above 1.70 very good.
Applications of the Grade Index
The Grade Index derived here provides a means by which the value at realisation and proportion of grades may be predicted for a range of pruned butt log types. Two applications of this index are suggested:
(a) Evaluating pruned logs at felling
Pruned logs are beginning to find their way to sawmills and soon will be available on a large scale. There will be great variation in quality because pruning was poorly timed in many of the "first" stands pruned. This is seldom obvious before logs are opened and information in the stand records gives little indication of defect core sizes. Higher prices cannot be expected for pruned logs unless increased returns through clearwood production and/or improved grade outturn can be guaranteed. On the other hand prices for pruned logs should not be depressed because of poor log conversion. The necessity is forseen to sample pruned logs from a stand before prices are fixed. The Grade Index is proposed as a. means of evaluating pruned logs which is independant of log size, sawmill efficiency, or any other bias. Minimum conversion rates could be agreed upon and substituted in the Grade Index formula. Dbh is readily available and defect cores could be measured either during the sawing of sample logs or by reconstruction from the sawn produce afterwards. Log prices could be set, or at least influenced, by the Grade Indices of logs in the sample.
(b) Aiding the design and execution of silviculture
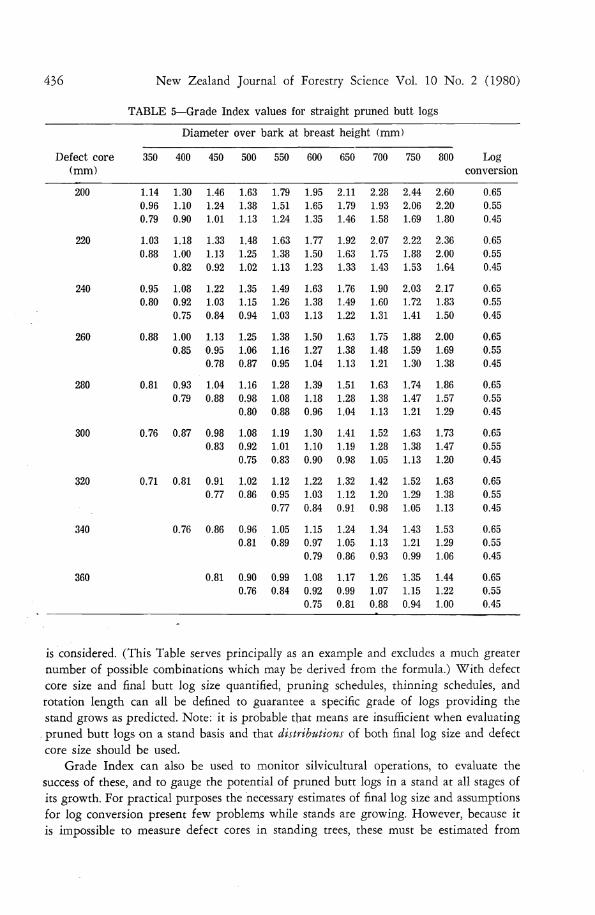
Grade Index is seen as a useful tool both in the planning of regimes and the execution of silviculture. With the aid of appropriate growth models, pruning and thinning combinations can be designed to achieve a target Grade Index. Given in Table 5 are specific Grade Index values which show the various combinations of defect core/final log sizes from which they are derived when a range of 3 log conversions
436 New Zealand Journal of Forestry Science Vol. 10 No. 2 (1980)
TABLE 5—Grade Index values for straight pruned butt logs
Defect core (mm)
200
220
240
260
280
300
320
340
360
350
1.14 0.96 0.79
1.03 0.88
0.95 0.80
0.88
0.81
0.76
0.71
Diameter
400
1.30 1.10 0.90
1.18 1.00 0.82
1.08 0.92 0.75
1.00 0.85
0.93 0.79
0.87
0.81
0.76
450
1.46 1.24 1.01
1.33 1.13 0.92
1.22 1.03 0.84
1.13 0.95 0.78
1.04 0.88
0.98 0.83
0.91 0.77
0.86
0.81
over bark at breast height (mm)
500
1.63 1.38 1.13
1.48 1.25 1.02
1.35 1.15 0.94
1.25 1.06 0.87
1.16 0.98 0.80
1.08 0.92 0.75
1.02 0.86
0.96 0.81
0.90 0.76
550
1.79 1.51 1.24
1.63 1.38 1.13
1.49 1.26 1.03
1.38 1.16 0.95
1.28 1.08 0.88
1.19 1.01 0.83
1.12 0.95 0.77
1.05 0.89
0.99 0.84
600
1.95 1.65 1.35
1.77 1.50 1.23
1.63 1.38 1.13
1.50 1.27 1.04
1.39 1.18 0.96
1.30 1.10 0.90
1.22 1.03 0.84
1.15 0.97 0.79
1.08 0.92 0.75
650
2.11 1.79 1.46
1.92 1.63 1.33
1.76 1.49 1.22
1.63 1.38 1.13
1.51 1.28 1.04
1.41 1.19 0.98
1.32 1.12 0.91
1.24 1.05 0.86
1.17 0.99 0.81
700
2.28 1.93 1.58
2.07 1.75 1.43
1.90 1.60 1.31
1.75 1.48 1.21
1.63 1.38 1.13
1.52 1.28 1.05
1.42 1.20 0.98
1.34 1.13 0.93
1.26 1.07 0.88
750
2.44 2.06 1.69
2.22 1.88 1.53
2.03 1.72 1.41
1.88 1.59 1.30
1.74 1.47 1.21
1.63 1.38 1.13
1.52 1.29 1.05
1.43 1.21 0.99
1.35 1.15 0.94
800
2.60 2.20 1.80
2.36 2.00 1.64
2.17 1.83 1.50
2.00 1.69 1.38
1.86 1.57 1.29
1.73 1.47 1.20
1.63 1.38 1.13
1.53 1.29 1.06
1.44 1.22 1.00
Log conversion
0.65 0.55 0.45
0.65 0.55 0.45
0.65 0.55 0.45
0.65 0.55 0.45
0.65 0.55 0.45
0.65 0.55 0.45
0.65 0.55 0.45
0.65 0.55 0.45
0.65 0.55 0.45
is considered. (This Table serves principally as an example and excludes a much greater number of possible combinations which may be derived from the formula.) With defect core size and final butt log size quantified, pruning schedules, thinning schedules, and rotation length can all be defined to guarantee a specific grade of logs providing the stand grows as predicted. Note: it is probable that means are insufficient when evaluating
. pruned butt logs on a stand basis and that distributions of both final log size and defect core size should be used.
Grade Index can also be used to monitor silvicultural operations, to evaluate the success of these, and to gauge the potential of pruned butt logs in a stand at all stages of its growth. For practical purposes the necessary estimates of final log size and assumptions for log conversion present few problems while stands are growing. However, because it is impossible to measure defect cores in standing trees, these must be estimated from
Park — A Grade Index for logs 437
other measurable parameters. In trees with straight butt logs there is a strong relationship between d.o.s. and defect core size and the following equation has been derived from the logs studies:
defect core (straight logs) — 0.975 d.o.s. + 59.411 (r2 = 0.93).
Therefore, the distribution of defect core sizes in the straight portion of a stand can be estimated if samples of d.o.s. are measured directly after each pruning operation is completed. Because some of these measurements may be difficult to take, probably requiring the use of ladders, and because "actual" measurements can be taken only after pruning (which means no alternative type or timing of pruning may then be considered) a prediction method for d.o.s. from other stand parameters is currently in preparation (R. L. Knowles, pers. comm.).
To implement Grade Index in predicting grades and returns from the population of pruned butts in a stand, it may be necessary to take account of the interchange in relative tree size which may occur after pruning is completed; preliminary work has indicated that the amount of interchange varies according to the silviculture prescribed and is also influenced by other factors. The importance of deviations from straightness, both at pruning and at felling, in pruned butt logs is also recognised but the deviations have not as yet been quantified. Varying proportions of the numbers of butt logs in all pruned stands are less than straight and classification of sweep and wobble should accompany d.o.s. measurements so that the enlarging effect on defect cores can be calculated. Until current research on classification, incidence, and effect of deviations from straightness is completed it is not possible to predict total grade outturn or total value of the pruned butts in a stand.
It may now be appreciated that an expansion of present forest record systems will be necessary if pruned crops are to be adequately monitored and evaluated; without more comprehensive records, while crops are growing, decisions must be made "in the dark" and expensive large-scale grade studies at felling may be necessary to establish suitable prices for pruned logs from individual stands.
The Grade Index presented in this paper has been derived from results of pruned butt logs cut exclusively to 25 mm boards under one sawing patter^i. Although results may indicate what value and outturn logs of any Grade Index are lively to have under different types of utilisation these are still to be tested. Current work aimed at determining what Grade Index means when alternative saw patterns, cutting to other dimension, and peeling pruned logs for veneer are considered.
It is of interest to note that results support Ralph & Bamping (1962) in showing that small logs are often more valuable, volume for volume, than many of their larger counterparts (due here to differences in pruning efficiency) and, as found by Lewis & Hallock (1973), where efforts are made to raise log conversions, it is the smaller logs which benefit the most. Smaller logs (35-45 cm dbh) can score highly on Grade Index but may not meet requirements when some end-uses are considered, e.g., 100 mm X 100 mm clear turnery blanks. In these circumstances it will be necessary to apply Grade Index within log size limitations. The optimum pruned butt log is large with a very small defect core; but this is most often an impractical target. The usefulness of Grade
438 New Zealand Journal of Forestry Science Vol. 10 No. 2 (1980)
Index to silvicultural planning is seen as identifying the best target for the pruned crop after all known constraints have been defined.
ACKNOWLEDGMENTS The assistance of all members of the Economics of Silviculture Section, F.R.I., who at
some time were involved with basic data collection and timber grading, and in particular C. S. E. Leman who wrote all the necessary computer programs, is gratefully acknowledged. Log volume formulae were furnished by J. C. Ellis and statistical testing of basic Grade Index formulae was carried out by I. A. Andrew. Dr W. R. J. Sutton's comments and editing of the unpublished Branch Reports which contain the basic data have also been most helpfulv
The series of sawing studies depended very much on the co-operation and willingness of other parties and those to be thanked are the management and staff of T.I.T.C. mill, Waipa, and the management and staff of Kaingaroa, Waiotapu, and Ngaumu Forests.
REFERENCES CLIFTON, N. C. 1969: Resin pockets in Canterbury radiata pine. New Zealand Journal of
Forestry 14: 38-49. COWN, D. J. 1973: Resin pockets: their occurrence and formation in New Zealand forests.
New Zealand Journal of Forestry 18: 233-51. FENTON, R. 1967: A timber grade study of first rotation Pinus radiata (D. Don) from
Kaingaroa Forest. N.Z. Forest Service, Forest Research Institute, Technical Paper 54.
FENTON, R.; FAMILTON, A. K. 1961: Tending Pinus radiata for optimum timber grade recovery. New Zealand Journal of Forestry 8: 415-39.
FENTON, R.; JAMES, R. N.; KNOWLES, R. L.; SUTTON, W. R. J. 1972: Growth, silviculture and the implications of two tending regimes for radiata pine: Pp. 15-22. Proceedings of The Seventh Geography Conference, N.Z. Geographical Society (Inc.), Hamilton.
LEWIS, D. W.; HALLOCK, H. 1973: Using computers to increase lumber yield — best opening face program. Forest Products Laboratory, Forest Service, U.S. Department of Agriculture. (Presented at 4th Wood Machining Seminar, Dec 4-6, 1973, Richmond, CA.).
NEW ZEALAND STANDARDS INSTITUTE 1978: "Classification and Grading of New Zealand Timbers". (National Timber Grading Rules) NZS 3631 : 1978. Standards Association of New Zealand. 91p.
RALPH, P.; BAMPING, J. H. 1962: Theoretical sawing of pine logs — a new technique for evaluating sawing methods. Forest Products Journal 12: 549-57.
SUTTON, W. R. J. 1971: Mechanization of pruning — a summary: Pp. 163-83. Paper presented at XV IUFRO Congress, Division 3, University of Florida, Gainesville, Florida, 1971.
SUTTON, W. R. J.; CROWE, J. B. 1975: Selective pruning of radiata pine. New Zealand Journal of Forestry Science 5: 171-95.