Embed Size (px)
Citation preview

Technical Report Pattern Recognition and Image Processing GroupInstitute of Computer Aided AutomationVienna University of TechnologyFavoritenstr. 9/183-2A-1040 Vienna AUSTRIAPhone: +43 (1) 58801-18351Fax: +43 (1) 58801-18392E-mail: {ion,yll,krw}@prip.tuwien.ac.atURL: http://www.prip.tuwien.ac.at/
PRIP-TR-98 January 10, 2006
A Graph-Based Concept for Spatiotemporal Information
in Cognitive Vision1
Adrian Ion and Yll Haxhimusa and Walter G. Kropatsch
Abstract
A concept relating story-board description of video sequences with spatio-temporal hierar-chies build by local contraction processes of spatio-temporal relations is presented. Objecttrajectories are curves in which their ends and junctions are identified. Junction pointshappen when two (or more) trajectories touch or cross each other, which we interpret asthe “interaction” of two objects. Trajectory connections are interpreted as the high leveldescriptions.
1Supported by the Austrian Science Fund under grant FSP-S9103-N04.

1 Introduction
Even though there is no generally accepted definition of cognitive vision yet,presumptions about the cognitive capabilities of a system can be made bycomparing it’s results with that of an entity, already ’known’ and accepted tohave these capabilities, the human. Also, the Research Roadmap of CognitiveVision [15], presents this emerging discipline as ’a point on a spectrum oftheories, models, and techniques with computer vision on one end and cog-nitive systems at the other’. A conclusion drawn from the previous, is that agood starting point for a representation would bring together the following:
• enable easy extraction of data for human comparison;
• bridge together high and low level abstraction data used for cognitiveand computer vision processes.
After ’watching’ (analyzing) a video of some complex action, one of thethings, that we would expect a cognitive vision system to do, is to be able tocorrectly answer queries regarding the relative position of occluded objects.Let us take the video 1 given by a simple scenario of two black cups and ayellow ball and describe the scene in simple English words (see the descriptionin Table 1). The description contains: objects: hand, cup, ball, table ;actions: grasp, release, move, shift etc., and relations: to-the-left, to-the-right, in-front-of etc.
Later, we could use this kind of description to compare the results givenby the system with ones made by humans. While observing a dynamic scene,an important kind of information is that of the change of an object’s location,i.e. the change of topological information. In most of the cases, this kind ofchange is caused by an active object (e.g. agent: hand, gravity, etc) actingon any number of passive objects (e.g. cup, ball, etc.). Queries like ’where isthe ball?’ could be answered if the history of topological changes is created.
From all the work done in the domain of qualitative spatial and temporalinformation we would like to enumerate the following: Interval calculus [1]is used in systems that require some form of temporal reasoning capabili-ties. In [1] 13 interval-interval relations are defined: ’before’, ’after’, ’meets’,’met-by’, ’overlaps’, ’overlapped-by’, ’started-by’, ’starts’, ’contains’, ’dur-ing’, ’ended-by’, ’ends’ and ’equals’. In [13], motivated by the work in [1, 7, 8],
1http://www.prip.tuwien.ac.at/Research/FSPCogVis/Videos/Sequence 2 DivX.avi
1

an interval calculus-like formalism for the spatial domain, the so called regionconnection calculus (RCC) was presented. The set of 8 region-region baserelations defined in [13] (RCC − 8) are: ’is disconnected from’, ’is externallyconnected with’, ’partially overlaps’, ’is a tangential proper part of’, ’is non-tangential proper part of’, ’has a tangential proper part’, ’has non-tangentialproper part’, and ’equals’. A more expressive calculus can be produced withadditional relations to describe regions that are either inside, partially inside,or outside other regions (RCC − 15). Different graph based representationshave been used to describe the changes/ events in a dynamic space. In [6]graphs are used to describe actions (vertices represent actions). Graphs arealso used in [2], but here vertices represent objects. Balder [2] argues thatarbitrary changes can be best described by state approach: the state of theworld before and after the change characterizes the change completely. TheUnified Modeling Language, in its state diagram, also defines a graph basedrepresentation for tracking temporal changes. The General Analysis Graph(GANAG) [14] is a hierarchical, shape-based graph that is build and usedin order to recognize and verify objects. The analysis graph can be seen asa ‘recipe’ for solving industrial applications, stating which kind of decisionshave to be made at which stage [14].
In Section 2 we give the spatiotemporal story-board of the video sequence.In Section 3 we describe two methods of contraction of trajectory of move-ments: first the spatial contraction followed by a temporal contraction (Sec-tion 3.1) and than the temporal contraction followed by a spatial contraction(Section 3.2).
2 Spatiotemporal Story Board of a Film
The scene history is a description of the actions and spatial changes in thescene. It should depict the spatiotemporal changes in the scene, in a waythat could be used to create a human-like description (similar to the one pre-sented in Section 4). For this we propose a graph based representation wherevertices represent spatial arrangement states and edges represent actions (seeFigure 1a).
Each vertex contains a topological description of the spatial arrangementof the objects in the scene, that results through a transition from a previousstate, by applying the actions that link it to the current. What we refer to asobjects are actually detected relevant visual entities, which in the ideal case
2

a)
grasp lift
b)lift(R-hand, R-cup)
lift(L-hand, L-cup)
Figure 1: a) History graph. b) Parallel actions. 2 Hand, © Ball, 4 Cup.
would be objects or, groups of objects in a “special” physical relation e.goccluding, containing, etc. Vertices are added when the topological descrip-tion of the spatial arrangement changes. There are no vertices that contain(identify) the same topological description (scene state). If the scene enters astate, which has a topological description identical to one of the descriptionsalready identified by a vertex in the scene history graph (it has been in thesame state in the past), then an edge/edges from the vertex identifying theprevious state, to the existing vertex should be added.
Edges are associated with actions and identify the type/class of the action.Also, each edge links to the objects (from the source and destination statevertex) involved in this particular action. If an object taking part in theaction cannot be identified as one of the known objects, a new instanceshould be created and the edge linked to it. Later on, through reasoning,the new created instance, can be identified as a previously known object or anew one (or some presumption can be made, using certain criteria). In caseof simultaneous actions, more than one edge is used to connect 2 vertices.Each edge should describe the actions that happened in parallel. (Figure 1b)shows how to describe 2 hands lifting 2 cups at the same time)
The representation of the scene history as a graph allows us to createhigher level abstractions. A straight forward example results from the ‘re-
3

usage’ of vertices (disallowing multiple vertices identifying the same state).Imagine the scenario of a hand grasping and releasing the cup 10 times in arow. Besides saving space by not adding a big number of additional vertices,by identifying cycles, we can easily determine repeated actions and find theshortest way from one configuration to another. Higher level abstractions re-place more complex subgraphs containing parallel actions and long sequencesof actions resulting in small or unimportant changes for the objects in thesystem’s attention.
A type of information that can be directly extracted from the spatiotem-poral graph is the one of ‘all known actions’. This information can be rep-resented by a directional graph in which vertices represent unique classes ofobjects part in any previous action and edges represent simple actions thatcan involve the connected vertices (usually actions that a class of objects canperform on another class). E.g.: a hand can lift, move, grasp, release, etc. acup.
We can observe that, in time, for a fixed set of classes of objects involved, ifthe actions vary enough, the graph of ‘all known actions’ will converge to thegraph of ‘all possible actions’ and the presented spatiotemporal history graph,will converge to the graph ‘of all possible states’ (The latter is somethingthat should be avoided, because storing/remembering everything up to thesmallest details is guaranteed to sooner or later cause time and memoryissues).
Another type of information, that is obtained directly (e.g. tracking) orthrough reasoning, is that of an object occluding or containing other objects(totally or partially, but still unrecognizable by the detection level). To storethis type of information, a relabeling of the class of the occluding objectshould be done i.e. a cup that has been found out to contain a ball shouldbe labeled ‘cup with ball inside’.
3 Contraction in Spatiotemporal Space
The idea here would be to contract in 3D (2D space + time) along ’the move-ment trajectory’. Every frame could be represented by a region adjacencygraph. In order to stretch this into time, these region adjacency graphs (re-gion adjacency combinatorial maps) should be matched to each other, i.e.the region adjacency graph at time t is matched with the one in t + 1 andso on. In this sense we could define a ’trajectory’ of each region This trajec-
4

tory becomes a curve in 3D and with the techniques analogous with that ofcontraction of a 2D curve pyramid in [11], we can contract regions adjacentalong this curve to produce the more abstract representation of the scene,e.g. where the movement started, where it ended etc (Figure 2).
If the analyzed scene has a structured background, then, depending onit’s granularity, this is enough to detect movement using only topologicalinformation. On the other hand, this will increase the number of consecu-tive frames that differ with respect to topological relations. To reduce theabundance of topological states, to a set containing the most relevant ones,a set of adaptive pyramids is used. There are no constraints regarding thetime intervals between 2 consecutive states. Actually, it is expected that inmost of the cases where natural movement is present (not robots repeatingsome predefined action) these time intervals will differ quite a lot.
In subsections 3.1 and 3.2 we present two approaches, to the problem,which basically differ only in the order in which contraction in the spatialand temporal domains, is done. The first, avoids the difficult problem ofgraph matching by creating pyramids in the first step and then doing thematching using the pyramids. The second, while needing graph matching tobe done, should have a lower memory usage. Moreover, in the ideal case, theresulting top level of the 2 approaches should be the same.
3.1 Spacial contraction followed by temporal contrac-
tion
For each frame, whose topological description is different from the one of theprevious frame, a space-contraction pyramid is build, that preserves only thespatial information required by the higher functionality levels (i.e reasoning)and by the time-contraction. A space-contraction pyramid is a pyramidwhere elements, from the same scene state, neighbored from a spatial pointof view are contracted, and a time-contraction pyramid is a pyramid whereelements, neighbored from a temporal point of view (consecutive scene states)are contracted.
To obtain the base level of the time-contraction pyramid from the set ofspace-contraction pyramids a matching step has to be performed (Figure 4).Each 2 consecutive pyramids (from a chronological perspective) have to bematched, and the vertices that represent the same object/visual entity shouldbe linked by an edge (if it is possible i.e. if the same object/visual entity exists
5

t
x
y
Start
Junction
Figure 2: Trajectory of movements.
in both structures - existed in both frames). If a certain object/visual entity,that exists in one of the pyramids, does not exists in the other (occlusion,moved out of the field of view, etc.), no connecting edge can be created, thusobtaining a trajectory endpoint. If similar entities disappear and reappearat different time intervals, it will be the job of the reasoning part to decidewhether it was the same instance of the same class or not.
The base level of the time-contraction pyramid contains a vertex for eachof the frames in the source video, that differ in topological relations from theprevious frame. Each vertex will contain the space-contraction pyramid forthe region adjacency graph of the respective scene state. These vertices arelinked together in a chronological manner i.e. each vertex is linked to the oneof the previous and next frames. Also, as a result of the pyramid matchingprocess mentioned before, the vertices from the consecutive space-contractionpyramids are linked together, showing the trajectories of the regions from thefirst through the last frame. For example: take the topological descriptionsfor each frame and represent them in a 3D space, where one of the dimensionsis time, and the other 2 are used to represent the planar region adjacencygraphs. If for every 2 consecutive graphs, the vertices representing the sameobject/visual entity are linked together by an edge, then following these
6

Figure 3: An example of trajectory of movements.
inter-state connection edges will produce the regions trajectory in 3D space.Each level of the time-contraction pyramid is a chronologically ordered
list of space-contraction pyramids, each element describing the topologicalrelations of a certain scene state. The space-contraction step reduces thespatial information in areas that are not of our interest. The purpose ofthe time-contraction pyramid is to skip the unnecessary frames caused bythe presence of the structured background (which is needed for movementdetection using only topological information).
7

framesrelevant (key)Pyramids for
1 2 3 4 nRAGs foreach input frame
each input framePyramids for
i2i1 im
1 2 3 4 n
Figure 4: Space time contraction.
3.2 Temporal contraction followed by spatial contrac-
tion
The base level of the time-contraction pyramid contains a vertex for each ofthe frames in the source video, that differ in topological relations from theprevious frame (Figure 5). Each of these vertices contains the region adja-cency graph (RAG) for the respective frames. Through a preliminary processof matching, each vertex in a region adjacency graph should be connectedwith the vertex(vertices), from the two neighboring graphs, that representthe same object/visual entity (if it is possible i.e. if the same object/visualentity exists in the neighboring region adjacency graphs frame). In otherwords, the base level of the pyramid is the discretized evolution of the re-gion adjacency graph of the presented scene with the exception that identicalconsecutive states are merged into a single state.
If we would represent the base level structure in a N dimensional space(3D for 2D state descriptions + time) we would see that we have obtainedcurves representing the trajectories of the different regions analyzed. A linesegment parallel to the time axis, will denote a static region through therespective time interval. Each level of the pyramid is made out of a sequence
8

1 2 3 4 n
i2i1 im
RAGs for
framesrelevant (key)
RAGs foreach input frame
framesrelevant (key)Pyramids for
i2i1 im
Figure 5: Time space contraction.
of region adjacency graphs. Each vertex in a region adjacency graph shouldbe connected with the vertex(vertices), from the two neighboring graphs,that represent the same object/visual entity.
With each new level added to the time contraction pyramid, the number oftopological states decreases. After reducing the number of topological states,a contraction of topological information for each state can be considered (atthis level the detail regarding the background should not be important anymore).
There are 2 ways that can be considered for doing this:
• contract each state independently (create a pyramid for each of thetopological states at the top level of the time-contraction pyramid)
• contract all the graphs together (allow contraction kernels to span alongmore than one state graph)
3.3 Spatiotemporal Entities
The trajectories of (moving) objects (visual entities resulted from segmenta-tion and tracked through the whole time span) represent curves connectingstart, end and the junction points. Junction points happen when two (or
9

more) trajectories touch or cross each other, which we interpret as the ‘in-teraction’ of two objects.
Following the work of Kropatsch [11] the trajectory, which is a curve in3D, and the cells, which are vertices of the graph, can be related as follows:
0-cell - an empty cell (no trajectory motion within the receptive field)
1-cell - the trajectory starts or ends in this cell (it leaves or enters the celland intersects only once the boundary of the receptive field)
2-cell - the trajectory crosses the receptive field (it intersect twice the bound-ary of the receptive field).
*-cell - a cell where more than one trajectory meet, a junction cell (the bound-aries of the receptive field are intersected more than twice).
1-edge - trajectory intersects the connected segment boundary of the receptivefield.
0-edge - no trajectory intersect the boundary of the receptive field.
It is assumed that: 1) the cells are consistent, i.e. if a trajectory crosses aboundary both cells adjacent to this boundary are in correct classes, and 2)all trajectories are well distinguishable in the base, e.g. there are no morethan one single curve in one single cell of the base (except at *-cells).
3.4 Selection of Contraction Kernels
Contraction should be done along the trajectory, like in curve pyramids in2D [11, 5]. In order to undertake the contraction process, the contractionkernels must be selected. The selection rules are 1-cells and *-cells mustalways survive. *-cells are not allowed to have children. This prevents thearea of unclear information2 from growing. Branches of contraction kernelsfollow the trajectory if possible and are selected in following order: 1-cells,2-cells, 0-cells. Receptive fields are merged as follows:
1. A 1-cell can merge with its adjacent 2-cells, then with any adjacent0-cell and will become an 1-cell again;
2trajectory may intersect or may be just close to each other
10

2. a 2-cell can merge with both adjacent 2-cells or with any adjacent 0-celland remains a 2-cell;
3. a 0-cell can merge with any adjacent cell and remains a 0 cell if it ismerged with another 0-cell.
If the rules do not determine the contraction kernels the random selectionmethods [12, 10, 9] are applied. Applying these rules, the trajectory remainsa simply connected curve in spatiotemporal space. At the top level (whereno more contraction is possible) we find only 1-cells and *-cells giving onoverview of all movements, when and where is started, when and where thecup was grasped, and this is compact for all types.
4 Example
A simple, human language like description of a scene with two cups and ayellow ball is shown in Table 1. Even though the frame numbers are given,they are only for orientation purposes and can be easily eliminated fromthe description by putting the adverb for example ’next’, ’after that’, ’then’etc. The “cell type” field corresponds to the type of the scene history cell(see Section 3.3). As expected, humans tend to skip details and mentiononly relevant interaction of objects, this is why most of the cells have type’*’. The previous description would be represented in the following way(see Figure 6) in the resulting top level of both approaches. The initialconfiguration contains 3 objects: 2 cups and 1 ball. So we initialize theobjects structure with the following: cup(1), ball and cup(2). (The numericalids in parenthesis are present to distinguish the two cups, identification couldbe done in many other ways. Also in the same interest, vertices are numberedto identify different positions in time.) Vertex(0) in Figure 6 depicts theinitial configuration. The next vertices and edges are as follows:
1. action move: creates object hand and adds vertex(1);
2. action grasp: links to objects hand and cup(1) and adds vertex(2)
3. action lift: links to objects hand and cup(1) and adds vertex(3)
4. action move: links to objects hand and cup(1) and adds vertex(4)
5. action move: links to objects hand and cup(1) and adds vertex(5)
6. action release: links to objects hand and cup(1) and adds vertex(6)
11

Table 1: Scene description.celltype
Frame Description celltype
Frame Description
0 16–21: hand from left * 92– 93: lifts the cup, no ball visi-ble on table
* 22: grasps left cup * 94–98: shows inside, no ball in-side cup
* 27–30: moves it over ball * 99–103: deposit cup on its originalplace
* 31: releases cup * 104: releases it* 32: grasp same cup (again) * 105–106: moves to the right cup* 33–36: shifts it to the left * 107: grasps it* 37: releases cup * 108–113: shifts it in front of other
cup* 38–40: moves to right cup * 114: releases it* 41: grasps right cup * 115–117: moves to cup in the back* 42–58: shifts right cup in front of
left cup (hiding left cup Fr46–54) to the left of theoriginal cup
* 118–121: shifts it with fingers to theright
* 58: releases cup * 122: releases cup and moves toother cup
* 59–61: moves to the other cup * 123: grasps it* 62: grasps it * 124–128: shifts it to the left* 63–65: shifts it to the right * 129: releases it* 66: releases it * 130: re-grasps it* 67–69: moves to the left (most)
cup* 131–136: shifts it to the right
* 70: grasps it * 137–139: releases it* 71–74: shifts it to the right (but
still to the left of the rightcup
* 140: grasps it again
* 75: releases it * 141: lifts cup* 76–77: moves to the right cup * 142–150: ball becomes visible, rolls
to right until touchingright
* 84: grasps it * 146: cup bounces back and thehand drops cup in left po-sition
* 85–86: moves it to the right (butleft of the right cup)
* 151: releases cup
* 87–90: releases it and moves upand down
* 152: hand removes to the left
* 91: grasps the same cup again 0 153–159: no more movement
12

(0)
(3)
(1)
(4)
(2)
(5) (6)
move grasp
lift move move release
Figure 6: Example history graph. 2 Hand, © Ball, 4 Cup.
Although the presented approaches would work in a different way (onewould first try to identify the important visual entities and then key events,while the other would start with the key events and then continue with keyentities), the expected result is the same.
5 Human Descriptions
To motivate the research in the direction of qualitative spatial representationand reasoning, we have conducted a small set of experiments focusing onhuman description of videos. As a first step, 7 students (mother tongueGerman, descriptions made in German) were shown 2 videos (“two cups”and “yellow ball”) containing 2 identical black cups, a ball, a table (supportfor the cups and ball), and a hand that acts only on the cups by changingtheir position (on the table by pushing/shifting and in the air by picking upand holding). The 2 videos are approximately 15 and 31 seconds long.
A description of the experiments is as follows: each of the students weregiven a piece of paper (size A5) and told that 2 videos will be shown to them,which they should describe. After watching each video, a limited amount oftime was given to describe it. No other clues were given. Of course, one cansay, that seeing the hand hiding the ball using one of the cups is enough fora human (knowing the game) to focus on the ball. Which is most probablytrue, and can be seen on the produced descriptions. But this just enforces
13

the hypothesis that humans focus on a given task and do not give attentionto details not related do it.
One of the first things that should be mentioned is that there were twoconstraints for the descriptions: one intended, which was the time allowed towrite the description (2 of the descriptions are not finished), and the otherone noticed, the space available on the paper for the description (more then70% of the descriptions use up all the allocated half of the A5 paper). We caneasily associate the 2 constraints with allowed processing time and availablememory, and notice that humans do very well on adapting to them.
Now, getting to the descriptions themselves. Except one, all of the par-ticipants have produced narrative descriptions, with very short sentences ofthe form object action direction/position, focusing on the movement of thecups and on the position of the ball at the end of the videos. The remain-ing participant has used a bullet-ed list with subsections and very schematicdescription.
All descriptions follow a 2 section pattern3:
1. - initial configuration: contains the 3 objects initially visible, 2 cups{Tasse, Schale}, 1 ball {Ball}, and for 8 descriptions also the spatialarrangement using words like “left” {links}, “right” {rechts}, and “cen-ter” {Mitte}
2. - actions: short sentences of the form object action direction/positionusing “left cup”, “right cup”, “ball”, and “hand” {Hand} to identifyobjects, a whole variety of verbs for actions (e.g. “move” {bewegen},see Table 2 for more examples) and and expressions to identify positions(e.g. “between two objects” {zwischen}, see Table 3 for more examples).
“left” and “right” are the relational/positional words with the highestappearance (about 25 times each), followed by center/middle (less then 10times).
One of the descriptions refers to one of the cups as “the cup with the ball”for all the time the cup is hiding the ball. On the other hand, the bullet-edlist descriptions (2, made by the same person) refer to all objects as “object”(colors are used at the initial configuration description, but only there). Theycontain no more than 3 actions to describe all the changes in the video and
3Words are given in the form English {German translation 1, German translation 2,etc.}
14
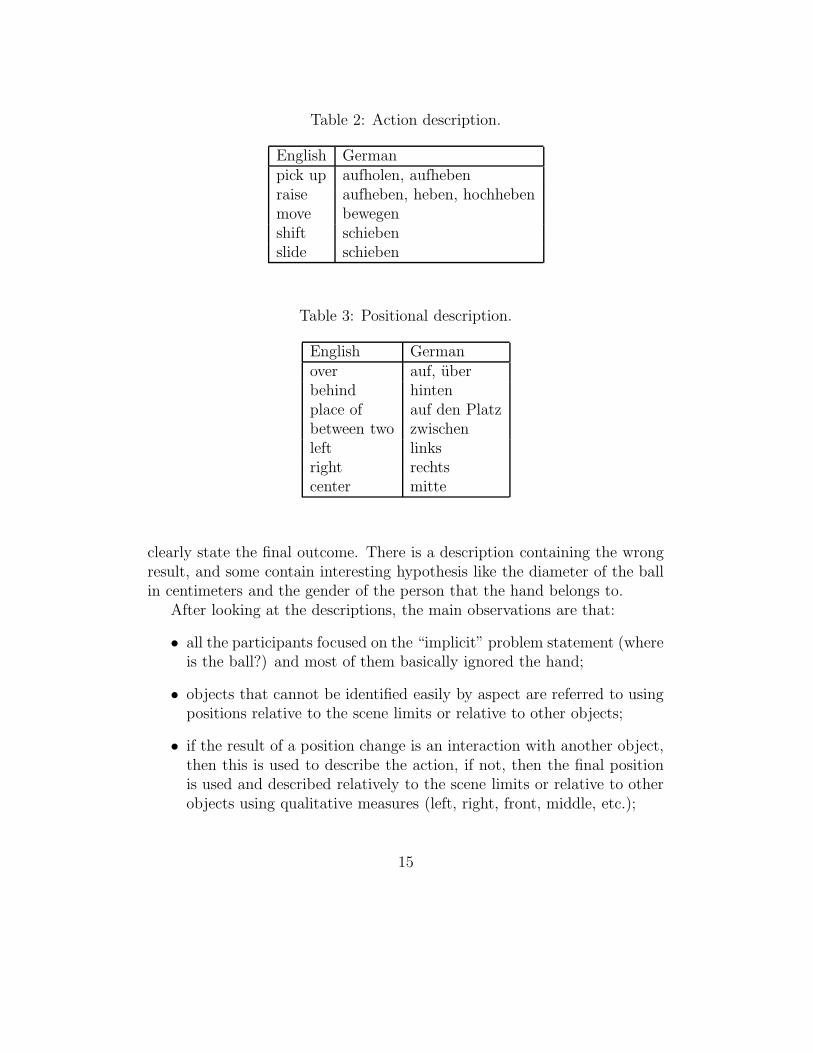
Table 2: Action description.
English Germanpick up aufholen, aufhebenraise aufheben, heben, hochhebenmove bewegenshift schiebenslide schieben
Table 3: Positional description.
English Germanover auf, uberbehind hintenplace of auf den Platzbetween two zwischenleft linksright rechtscenter mitte
clearly state the final outcome. There is a description containing the wrongresult, and some contain interesting hypothesis like the diameter of the ballin centimeters and the gender of the person that the hand belongs to.
After looking at the descriptions, the main observations are that:
• all the participants focused on the “implicit” problem statement (whereis the ball?) and most of them basically ignored the hand;
• objects that cannot be identified easily by aspect are referred to usingpositions relative to the scene limits or relative to other objects;
• if the result of a position change is an interaction with another object,then this is used to describe the action, if not, then the final positionis used and described relatively to the scene limits or relative to otherobjects using qualitative measures (left, right, front, middle, etc.);
15

Figure 7: The first frame of the videos shown to subjects.
• the descriptions focus on interaction between the objects, that couldbe considered relevant for the task.
6 The Experiments
The original samples of the experiments are given in the Figures 8–14. All thedescription are hand written, in German. The line in all the samples separatesthe description of the two videos (“Two-cups”4 and “yellow-ball”5), since thesubject knew at the beginning that there are two videos to describe. The“yellow-ball” video contains more complex events. Note that “not finished”has been put by us and the white rectangles cover a company name. A largerset of description experiments is planned and it would be interesting to makesome of them in different languages.
7 Conclusion
This report presents a concept relating story-board description of video se-quences with spatio-temporal hierarchies build by local contraction processesof spatio-temporal relations. Since object trajectories are connected curveswe identify their ends and junctions and their connections as the high leveldescriptions. Junction points happen when two (or more) trajectories touchor cross each other, which we interpret as the ‘interaction’ of two objects.
4http://www.prip.tuwien.ac.at/Research/FSPCogVis/Videos/Two-Cups.mpg5http://www.prip.tuwien.ac.at/Research/FSPCogVis/Videos/Yellow-Ball.mpg
16

We propose to derive them similar to the curve pyramid in 2D [11, 5], Forthe implementation we plan to use the concept of combinatorial pyramids in3D [3, 4]. As motivation for the approach, a set of human video descriptionexperiments and their results are presented.
References
[1] J. Allen. An Interval-based Representation of Temporal Knowledge. InProc. 7th Inter. Joint Conf. on AI, pages 221–226, 1981.
[2] N. I. Balder. Temporal Scene Analysis: Conceptual Descriptions of Ob-ject Movements. PhD thesis, University of Toronto, Canada, 1975.
[3] L. Brun and W. G. Kropatsch. The Construction of Pyramids withCombinatorial Maps. Technical Report PRIP-TR-63, Institute f. Com-puter Aided Automation 183/2, Pattern Recognition and Image Pro-cessing Group, TU Wien, Austria, 2000. Also available throughhttp://www.prip.tuwien.ac.at/ftp/pub/publications/trs/tr63.ps.gz.
[4] L. Brun and W. G. Kropatsch. Introduction to Combinatorial Pyramids.In G. Bertrand, A. Imiya, and R. Klette, editors, Digital and ImageGeometry, pages 108–128. Springer, Berlin, Heidelberg, 2001.
[5] M. Burge and W. G. Kropatsch. A Minimal Line Property PreservingRepresentation of Line Images. Computing, Devoted Issue on ImageProcessing, 62:355–368, 1999.
[6] A. Chella, M. Frixione, and S. Gaglio. Understanding Dynamic Scenes.Artificial intelligence, 123:89–132, 2000.
[7] B. Clarke. A Calculus of Individuals Based on Connection. Notre DameJournal of Formal Logic, 23(3):204–218, 1981.
[8] B. Clarke. Individuals and Points. Notre Dame Journal of Formal Logic,26(1):61–75, 1985.
[9] Y. Haxhimusa, R. Glantz, and W. G. Kropatsch. Constructing Stochas-tic Pyramids by MIDES - Maximal Independent Directed Edge Set. InE. Hancock and M. Vento, editors, 4th IAPR-TC15 Workshop on Graph-based Representation in Pattern Recognition, volume 2726 of Lecture
17

Notes in Computer Science, pages 35–46, York, UK, June-July 2003.Springer, Berlin Heidelberg, New York.
[10] Y. Haxhimusa, R. Glantz, M. Saib, G. Langs, and W. G. Kropatsch.Logarithmic Tapering Graph Pyramid. In L. van Gool, editor, Proceed-ings of 24th DAGM Symposium, pages 117–124, Swiss, 2002. SpringerVerlag LNCS 2449.
[11] W. G. Kropatsch. Property Preserving Hiearchical Graph Transforma-tion. In C. Arricelli, L. Cordella, and G. Sanniti di Baja, editors, Ad-vances in Visual Form Analysis, pages 340–349, Singapore, 1998. WorldScientific.
[12] P. Meer. Stochastic image pyramids. Computer Vision, Graphics, andImage Processing, 45(3):269–294, March 1989.
[13] D. Randell, Z. Cui, and A. Cohn. A Spatial Logic Based on Regions andConnection. In Proc. 3rd Intern. Conf. on Knowledge Representationand Reasoning, pages 165–176. Morgan Kaufmann, 1992.
[14] R. Sablatnig. Increasing flexibility for automatic visual inspection: thegeneral analysis graph. Mach. Vision Appl., 12(4):158–169, 2000.
[15] D. Vernon, editor. A Reasearch Roadmap of Cognitive Vision (DRAFTVersion 3.2). ECVision: The European Research Network for CognitiveComputer Vision Systems, 2004.
18

Figure 8: Subject 1.
19

Figure 9: Subject 2.
20

Figure 10: Subject 3.
21
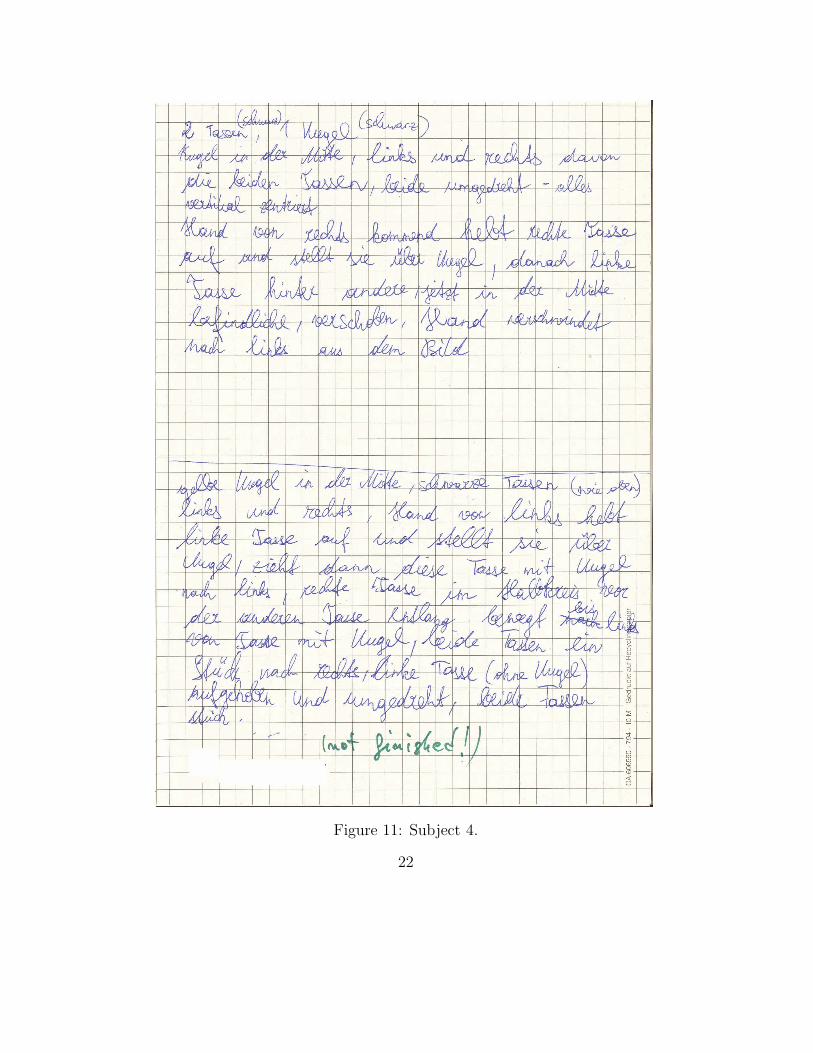
Figure 11: Subject 4.
22

Figure 12: Subject 5.
23

Figure 13: Subject 6.
24
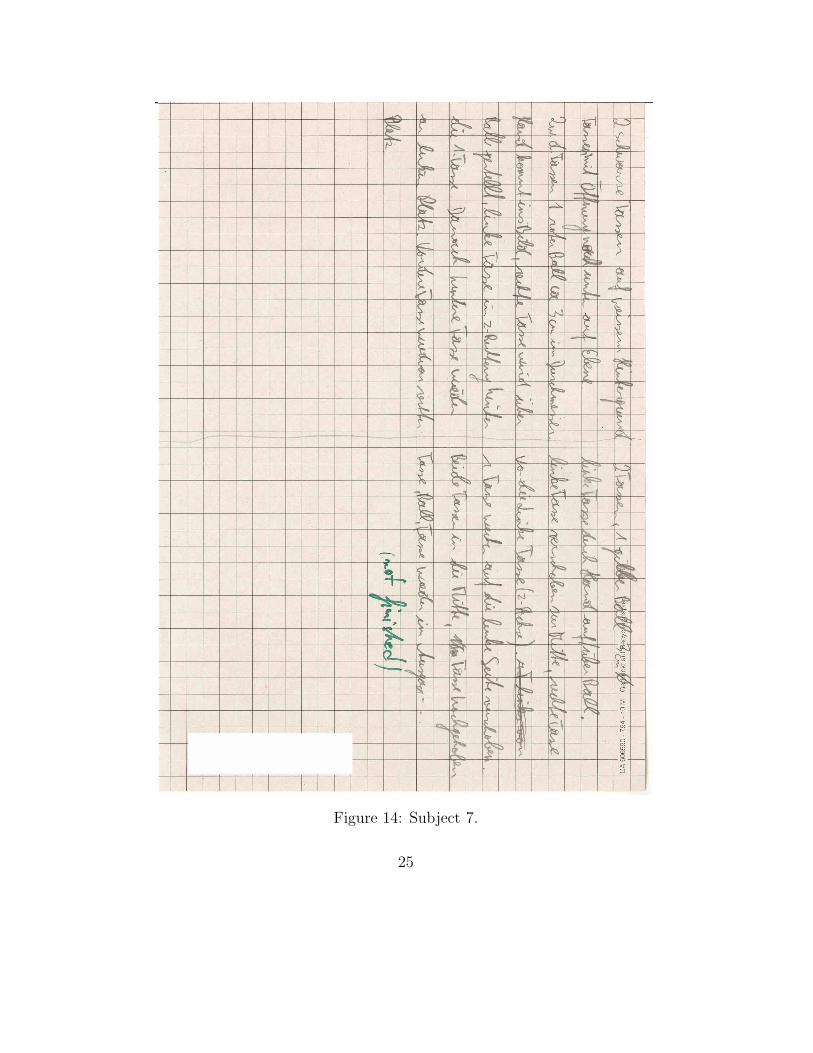
Figure 14: Subject 7.
25


![Bangla Document Categorization using Term Graph · 2019. 8. 19. · Bangla Document Categorization. In this research, Term Graph concept was mainly focused. TGM [5] is never used](https://img.pdfslide.net/doc/110x75/60b6dc382b55f060ab7cceb7/bangla-document-categorization-using-term-graph-2019-8-19-bangla-document-categorization.jpg)