Embed Size (px)
Citation preview

62
A Graphical Data Model For CASE
Andrew J. McAllister
School of Computer Science University of New Brunswick Fredericton, New Brunswick
E3B5A3
Paul G. Sorenson Jean-Paul Tremblay
Department of Computational Science University of Saskatchewan Saskatoon, Saskatchewan
S7NOWO
ABSTRACT
~omputer-aided software engineering (CASE) applications mvolve several special data modeling requirements, not the least of which is the need to store graphical representations of complex descriptive data. This paper describes the EARNG data model, which is designed to serve as the basis for storage of such data in the context of CASE support tools. The model enables integrated storage of graphical and non-graphical data. Advanced modeling features such as validity constraint conditions on graphical data and explicit identification of comP.lex design objects like software engineering diagrams are descnbed. The problem of automatically generating layouts for CASE diagrams is described, along with some of our initial efforts in this area.
1. INTRODUCTION
The Deview project at the University of Saskatchewan has been involved for a number of years with research in the area of computer-aided software engineering (CASE) tools [SORE86] . Such tools automate many of the software development tasks that have traditionally been performed by hand. This is meant to increase both the productivity of software development personnel and the quality of the resultant software. Results of the Deview project include a problem statement language called SPSL that is supported by its associated analyzer tool called SPSA [SORE81]. More recently, the Deview project has been investigating the problems associated with providing support for a broad class of CASE tools . The primary effort in this area is related to the design of a metasystem called Metaview [SORE88]. A metasystem is a system used to develop CASE tools in an analogous manner as compiler writing systems are used to develop compilers.
The approach taken for supporting the development of CASE tools is to provide a set of generic CASE tool components. The basic components include the following :
1. A database for storing software system definitions.
2. A user interface to allow software developers to enter software system definitions into the database.
3. An analysis function that examines the stored software system definitions to determine their validity.
The generic components to be provided with Metaview are designed so that their functionality can be customized to support a particular development methodology by providing a formal definition of that methodology. The task of a CASE tool developer is greatly simplified.
In this paper we describe a logical data model called the EARNG model (Entity Aggregate Relationship Attribute model with Graphical extensions) that forms the basis for the design of Metaview's generic database component. An important aspect of this database model is its ability to store the graphical data needed to provide a diagrarnmatical interface for CASE tools. Our discussion focuses on the graphical nature of software definitions and on those aspects of the EARA/G data model that address specifically the storage of graphical data.
We begin by describing a simple CASE tool supporting data flow diagrams [GANE79] to serve as an illustrative example. We then briefly discuss problems associated with storing nongraphical representations of software definitions and outline the basic EARA model. Following this is a list of requirements for storing graphical representations of design data. These requirements are used as the basis for a brief evaluation of existing graphical databases, followed by a presentation of the modeling capabilities provided by the full EARA/G data model. The problems associated with the automatic layout of a large class of CASE diagrams are presented. Some of our initial research efforts on Mondrian, a system for the automatic layout of data flow diagrams, are described. Finally, conclusions and directions for future work are discussed.
2. AN EXAMPLE TYPE OF SOFTWARE ENGINEERING DIAGRAM
The example method introduced in this section is based on the data flow diagrams of the structured systems analysis methodology [GANE79; DeMA 78] and thus we refer to it as the "data flow method". A data flow diagram presents a software system as a collection of processes. Each process is
Graphics Interface '88
named and represents a transformation of data performed by the system. Entities that are external to a system (people, other systems, etc.) and interact with that system are represented as named interfaces
Two broad classes of data are used in the data flow method. Data that flow between different parts of a system are represented as named data flows. There is also the concept of stored data, which are each associated with (stored in) a single data store. A data store may exist in one of several forms such as a filing cabinet or a computer file. Processes may update and read stored data.
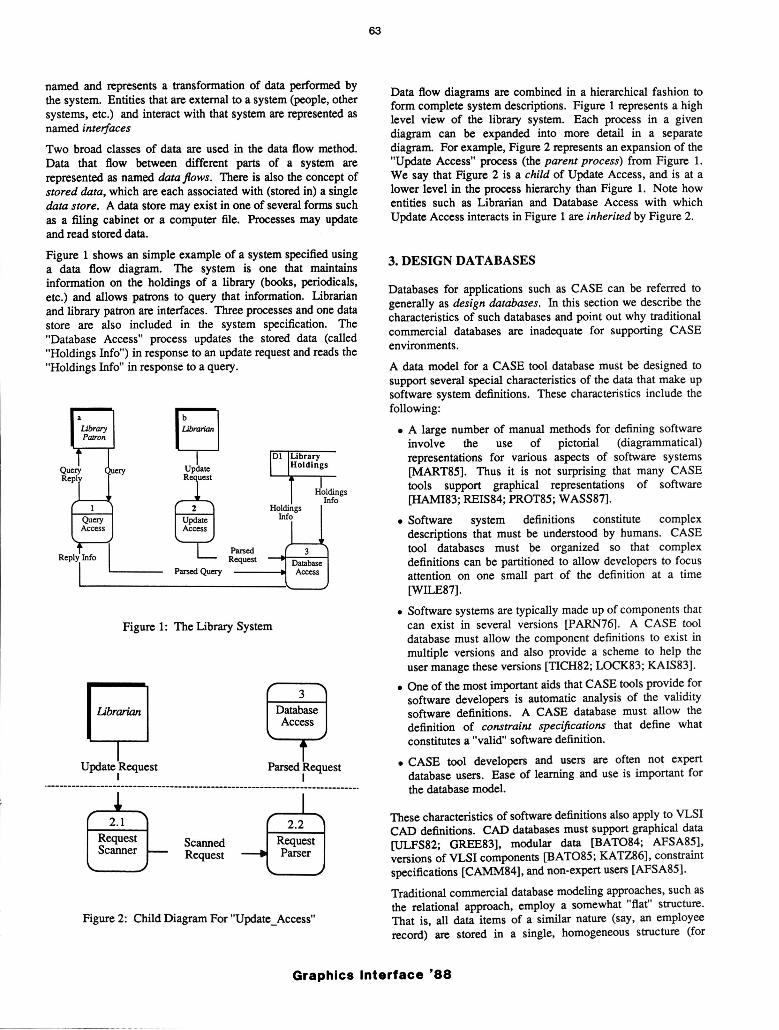
Figure 1 shows an simple example of a system specified using a data flow diagram. The system is one that maintains information on the holdings of a library (books, periodicals, etc.) and allows patrons to query that information. Librarian and library patron are interfaces. Three processes and one data store are also included in the system specification. The "Database Access" process updates the stored data (called "Holdings Info") in response to an update request and reads the "Holdings Info" in response to a query.
a Library Patron 9
Update R uest
2 Update Access
Holdings Info
Holdings Info
Parsed 3
RePIYL.1 In_fO _______ Parsed __ Q_Uery __ R_eq_U_es_t ---.!'-_J
Figure 1: The Library System
Q Update Request
I
3 Database Access
i Parsed Request
I ._--------------------------------------------------------------------------_.
2.1 Request Scanner
Scanned Request
2.2 Request Parser
Figure 2: Child Diagram For "Update_Access"
63
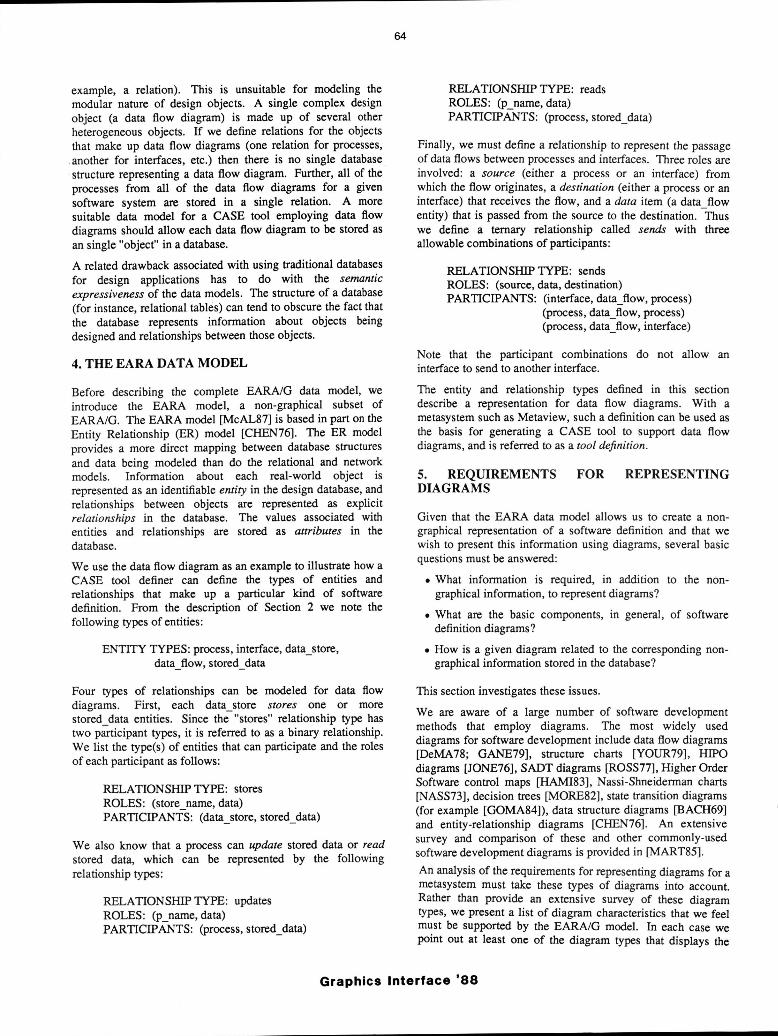
Data flow diagrams are combined in a hierarchical fashion to form complete system descriptions. Figure 1 represents a high level view of the library system. Each process in a given diagram can be expanded into more detail in a separate diagram. For example, Figure 2 represents an expansion of the "Update Access" process (the parent process) from Figure 1. We say that Figure 2 is a child of Update Access, and is at a lower level in the process hierarchy than Figure 1. Note how entities such as Librarian and Database Access with which Update Access interacts in Figure 1 are inherited by Figure 2.
3. DESIGN DAT ABASES
Databases for applications such as CASE can be referred to generally as design databases. In this section we describe the characteristics of such databases and point out why traditional commercial databases are inadequate for supporting CASE environments.
A data model for a CASE tool database must be designed to support several special characteristics of the data that make up software system definitions. These characteristics include the following:
• A large number of manual methods for defining software involve the use of pictorial (diagrammatical) representations for various aspects of software systems [MART85]. Thus it is not surprising that many CASE tools support graphical representations of software [HAMI83; REIS84; PROT85; WASS87].
• Software system definitions constitute complex descriptions that must be understood by humans. CASE tool databases must be organized so that complex definitions can be partitioned to allow developers to focus attention on one small part of the definition at a time [WILE87].
• Software systems are typically made up of components that can exist in several versions [p ARN76]. A CASE tool database must allow the component definitions to exist in multiple versions and also provide a scheme to help the user manage these versions [TICH82; LOCK83; KAIS83] .
• One of the most important aids that CASE tools provide for software developers is automatic analysis of the validity software definitions. A CASE database must allow the definition of constraint specifications that define what constitutes a "valid" software definition.
• CASE tool developers and users are often not expert database users. Ease of learning and use is important for the database model.
These characteristics of software definitions also apply to VLSI CAD definitions. CAD databases must support graphical data [ULFS82; GREE83], modular data [BAT084; AFSA85], versions of VLSI components [BAT085; KATZ86] , constraint specifications [CAMM84], and non-expert users [AFSA85].
Traditional commercial database modeling approaches, such as the relational approach, employ a somewhat "flat" structure. That is, all data items of a similar nature (say, an employee record) are stored in a single, homogeneous structure (for
Graphics Interface '88
example, a relation). This is unsuitable for modeling the modular nature of design objects. A single complex design object (a data flow diagram) is made up of several other heterogeneous objects. If we define relations for the objects that make up data flow diagrams (one relation for processes,
,another for interfaces, etc.) then there is no single database ' structure representing a data flow diagram. Further, all of the processes from all of the data flow diagrams for a given software system are stored in a single relation. A more suitable data model for a CASE tool employing data flow diagrams should allow each data flow diagram to be stored as an single "object" in a database.
A related drawback associated with using traditional databases for design applications has to do with the semantic expressiveness of the data models. The structure of a database (for instance, relational tables) can tend to obscure the fact that the database represents information about objects being designed and relationships between those objects.
4. THE EARA DATA MODEL
Before describing the complete EARA/G data model, we introduce the EARA model, a non-graphical subset of EARA/G. The EARA model [McAL87] is based in part on the Entity Relationship (ER) model [CHEN76]. The ER model provides a more direct mapping between database structures and data being modeled than do the relational and network models. Information about each real-world object is represented as an identifiable entity in the design database, and relationships between objects are represented as explicit relationships in the database. The values associated with entities and relationships are stored as attributes in the database.
We use the data flow diagram as an example to illustrate how a CASE tool definer can define the types of entities and relationships that make up a particular kind of software definition. From the description of Section 2 we note the following types of entities:
ENTITY TYPES: process, interface, data_store, data_flow , stored_data
Four types of relationships can be modeled for data flow diagrams. First, each data_store stores one or more stored_data entities. Since the "stores" relationship type has two participant types, it is referred to as a binary relationship. We list the type(s) of entities that can participate and the roles of each participant as follows:
RELATIONSHIP TYPE: stores ROLES: (store_name, data) PARTICIPANTS: (data_store, stored_data)
We also know that a process can update stored data or read stored data, which can be represented by the following relationship types:
RELATIONSHIP TYPE: updates ROLES : (p_name, data) PARTICIPANTS: (process, stored_data)
64
RELATIONSHIP TYPE: reads ROLES: (p_name, data) PARTICIPANTS: (process, stored_data)
Finally, we must define a relationship to represent the passage of data flows between processes and interfaces. Three roles are involved: a source (either a process or an interface) from which the flow originates, a destination (either a process or an interface) that receives the flow, and a data item (a data flow entity) that is passed from the source to the destination. -Thus we define a ternary relationship called sends with three allowable combinations of participants:
RELATIONSHIP TYPE: sends ROLES: (source, data, destination) PARTICIPANTS: (interface, data_flow, process)
(process, data_flow, process) (process, data_flow, interface)
Note that the participant combinations do not allow an interface to send to another interface.
The entity and relationship types defined in this section describe a representation for data flow diagrams. With a metasystem such as Metaview, such a definition can be used as the basis for generating a CASE tool to support data flow diagrams, and is referred to as a tool definition.
5. REQUIREMENTS FOR REPRESENTING DIAGRAMS
Given that the EARA data model allows us to create a nongraphical representation of a software definition and that we wish to present this information using diagrams, several basic questions must be answered:
• What information is required, in addition to the nongraphical information, to represent diagrams?
• What are the basic components, in general, of software definition diagrams?
• How is a given diagram related to the corresponding nongraphical information stored in the database?
This section investigates these issues.
We are aware of a large number of software development methods that employ diagrams. The most widely used diagrams for software development include data flow diagrams [DeMA78; GANE79] , structure charts [YOUR79], HIPO diagrams [JONE76], SADT diagrams [ROSS77], Higher Order Software control maps [HAMI83] , Nassi-Shneiderman charts [NASS73], decision trees [MORE82], state transition diagrams (for example [GOMA84]), data structure diagrams [BACH69] and entity-relationship diagrams [CHEN76]. An extensive survey and comparison of these and other commonly-used software development diagrams is provided in [MART85].
An analysis of the requirements for representing diagrams for a metasystem must take these types of diagrams into account. Rather than provide an extensive survey of these diagram types, we present a list of diagram characteristics that we feel must be supported by the EARA/G model. In each case we point out at least one of the diagram types that displays the
Graphics Interface 'SS

characteristic to indicate why this characteristic is relevant:
• Software development methods may employ any number of diagram types. For example, the Higher Order Software methodology [HAMI83] employs only the control map as a single notation to be used through the entire development process. On the other hand, a practitioner of structured systems analysis and design may use data flow diagrams, decision trees, structure charts and entity-relationship diagrams during various phases of development.
• The size of diagrams is typically meant to be limited so that diagrams do not become overly complex and difficult to interpret. Other practical reasons are sometimes given for this such as limiting the size of a diagram to fit on a single sheet of paper. Both of these reasons are cited with respect to SADT diagrams [ROSS77] and data flow diagrams [DeMA78]. The EARA data model includes the concept of an aggregate so that the components of a software definition can be of limited size. For these reasons, we define the EARNG data model so that each individual diagram represents the information associated with a single aggregate.
• Just as non-graphical information is composed of entities and relationships, diagrams are composed of graphical components. Each of these component parts can be thought of as representing a single entity or relationship. For example, one of the parts of a data flow diagram is a process symbol. The existence of a process symbol in the diagram can be thought of as corresponding to (and representative of) a single entity in a CASE database. Similarly, there is a one-to-one correspondence between each "sends" relationship in a given database and an arrow bearing the name of a "data_flow" entity in the corresponding diagram. (Note there is no such correspondence between the arrows and "data flow" entities since a given entity name may appear on several arrows.) We use the term icon to refer to a graphical component of a diagram.
• Some types of entities or relationships may be represented differently in different types of diagrams. For example, a "process" entity may be associated with a rectangle with rounded corners in a data flow diagram during a systems analysis phase but may also be associated with a rectangular icon representing a software module in a structure chart during a later design phase.
• Some types of icons appear in every diagram of a given type regardless of the software system being modeled. For example, the dashed line representing the aggregate boundary in Figure 2 appears in every data flow diagram for a "child" aggregate. Such icon types are not associated with the existence of particular entity or relationship types.
• Some diagram types allow a single entity or relationship to be represented by multiple icons in a given diagram. For example, a data flow diagram can be drawn with more than one interface icon representing a single interface entity. Similarly, a given "module" in a structure chart diagram may appear several times in that diagram. The rationale for the use of multiple copies of a given icon is that when a diagram becomes large and complex it becomes difficult to draw a large number of "connecting" arcs to a single icon.
65
• Although the information presented in a diagram is representative of the non-graphical information in a database, the non-graphical information does not necessarily determine the form of the diagram. For example, the existence of a "process" entity in a database means that the data flow diagram for that database must include a corresponding icon displaying the name of that entity. The existence of the non-graphical information (the entity) does not, however, determine where that icon must appear in the diagram. Thus icons have graphical attributes associated with them. These graphical attributes convey no information about the software system being defined. They are related only to a single diagram that provides a particular "view" of the software definition. The location coordinates associated with a process icon are graphical attributes that have no consequence in terms of the eventual implementation of the system.
• A pictorial representation of software represents abstract rather than physical objects. Thus a given type of nongraphical software definition can often be represented by several different styles of diagrams. This is evidenced in the different styles of data flow diagrams advocated by [GANE79] and [DeMA78].
• We believe that once an analyst has been presented with a particular diagram, the graphical attributes of the icons in that diagram can serve to help identify the components of the diagram. For example, once a "process" icon has been viewed in the upper left corner of a diagram, the "location" attributes for that icon can serve to help the analyst identify the icon in subsequent interaction with the diagram. Thus graphical attributes associated with icons should be stored in the CASE tool database so that diagrams appear the same over time. An example of a graphics display system that generates graphical attributes without storing them for later use is described in [REIS87]. Users of this system experience difficulties due to diagrams that are not consistent over time.
• As with non-graphical data, constraints are needed to provide automatic validity checking for graphical data. For example, data flow diagrams include icons for data stores and arrow icons that correspond to "reads" instances. The graphical attributes for each "reads" arrow in a diagram are constrained by the rule that the arrow must be shown as originating from the icon for the data_store that occupies the "store_name" role of the "reads" instance.
6. EXISTING GRAPHICAL DATABASES
Existing databases that are designed specifically to store graphical data (for example [GREE83; ULFS82]) recognize the need to store graphical information in an object-oriented fashion. This allows information about the components of a diagram or picture to be accessed individually as needed. These database systems do not, however, address issues such as (1) providing both a graphical and a non-graphical representation of a given application or (2) stating constraint conditions on graphical data.
Data models for CAD/CAM databases (for example [AFSA85; BAT085; CAMM84]) recognize the need to store both graphical and non-graphical information about a given
Graphics Interface '88

application in a single database, as well as the need for constraints on the database state. These models do not, however, explicitly differentiate between pictorial information that results from physical attributes of objects and information that is associated solely with a particular graphical "view" of the objects. In addition, much of the work in the area of CAD/CAM databases is based on the relational or network data models, with the associated drawbacks discussed in Section 3.
7. GRAPHICAL DATA MODEL: EARA/G
The EARA/G data model is an extension of the EARA model. The extensions provide features for defining and storing graphical data in a manner that is consistent with the requirements discussed in Section 5.
An EARA database includes three kinds of database objects: aggregates, entities and relationships. Each object may have associated attribute values. In addition to these objects, an EARA/G database includes diagrams and icons, each of which can also have attributes. A given CASE tool may support several different diagram types, each of which provides a graphical representation for some (or all) of the non-graphical object types defined for that tool. Each type of diagram includes one or more icon types. Each type of icon is associated with a type of entity or relationship. This means that a particular type of icon is stored as part of a diagram if and only if an instance of the associated entity or relationship type is also stored in the database.
For our example CASE tool supporting data flow diagrams, we define only a single type of diagram, which we call "data_flow_diagram". (This forms part of the tool definition.) Each diagram type is defined as a component of a particular aggregate type. For our example, "data_flow _diagram" is a component of "data_flow_aggregate". The icon types for data_flow _diagram are listed below along with the associated non-graphical object types :
Icon Type
process_icon interface icon data store icon sends arrow reads arrow updates_arrow
Associated With
process interface data store sends reads updates
The reader may notice that no icon types are defined for the "data_flow" and "stored_data" entity types. The names of these entities appear in data flow diagrams in conjunction with the arrows.
Each "data_flow_aggregate" instance includes one and only one "data flow diagram" instance. That diagram includes one icon for each instance of a non-graphical type that is associated with an icon type. For example, the "Library_System" aggregate that represents Figure 1 includes twenty-two nongraphical objects (thirteen entities and nine relationships). Seven of the entities are "data flow" or "stored data" entities which have no associated - icon types. Therefore the "data_flow_diagram" instance in the "Library_System" aggregate includes fifteen icons. In general, aggregates are composed of entities, relationships and diagrams, diagrams are
66
composed of icons, and icons are associated with entities and relationships. This organization is depicted in Figure 3.
Aggregate
Entity and Relationship Instances Diagram Instances
Diagram Type "y"
Icons o 0
b o I o
Figure 3: Components Of An EARAIG Aggregate
Diagrams and icons have the intrinsic icon "type". Unlike aggregates and entities, however, diagrams and icons are not assigned names. Since only one diagram of a given type exists in any aggregate, diagram instances can be identified based on an aggregate name and a diagram type. Identification of individual icons is achieved through their association with an entity or relationship. In addition, icons have an intrinsic "copy" attribute that makes it possible for a diagram to include multiple icons for a single entity or relationship. Each icon associated with a particular entity or relationship has a different "copy" value (such as "1", "2", etc.).
The next aspect of diagram definition involves specifying a geometric representation for the icons. In other words, an EARAlG tool definition must define how each type of icon is to appear in a diagram and how the appearance of an icon is related to the data stored in an EARA/G database. Some aspects of an icon's appearance are determined by the type of the icon and by the associated non-graphical data. For example, in defining our example CASE tool we can make the decision that all data store icons are to be displayed as four line segments with a width of seven units and a height of four units, as follows:
11
(We assume that the size units are relative; scaling can be used to display the icons with any desired size.) In addition, the name of the associated data_store entity is to appear as part of
the icon. The only aspect of the appearance of data store icons not determined by the data discussed so far is the location of the icons in a diagram. We assume that the location of each data store in a diagram is supplied by either the software system developer, through an interactive interface, or some automatic diagram layout algorithm at the time the diagram is
Graphics Interface '88

created, as will be discussed in Section 8. To enable the location of each data store icon to be stored in the CASE tool database, we define two graphical attributes for the "data_store_icon" type. These attributes have values of type "real" and are named "x" and "y" respectively. Every "data_store_icon" instance stored in a database is assigned one real number for "x" and another for "y". We use these numbers to represent the coordinates in two dimensions of the lower left hand corner of each icon.
In general, it is the task of the CASE tool definer to define sufficient graphical attributes for each icon type to enable icons to be displayed based on the stored data.
The mapping between stored data and geometric representation of icons is specified in procedural form. An EARAIG tool definition includes a geometric procedure for each icon type. Procedures are specified using some graphics programming language. The input parameters for such a procedure are the data values (both graphical and non-graphical) defined for the icon type. The result of the procedure is not a display of the icon on some graphical output device. Rather, geometric procedures return values of a special "picture" data type.
Consider the example geometric procedure shown in Figure 4. This procedure is written using a variant of the Ada programming language defined in [McAL87] and can be used to create a geometric representation of a "data store icon" instance based on the values associated with that ic~n. -
PROCEDURE create_data _store_image (x,y: graphic_in real; name: database_in identifier; image: out picture) is
-- This procedure creates a picture image of a -- data_store_icon.
BEGIN image := line (x, y, 0, 4)
END;
+ line(x, y+4, 7, 0) + line(X+ 7, y, -7, 0) + line(x+O.5, y, 0, 4) + stringimage(x+ 1, y+3, name);
Figure 4: An Example Geometric Procedure
The designation graphic _in used in Figure 4 indicates that the specified values ("x" and "y" in this case) are to be found as attributes of the icon in the database. Similarly, database_in parameters refer to either (a) attributes of the associated entity or relationship, or (b) participants of the associated relationship. The "name" parameter in Figure 4 is an attribute of the associated entity.
The output parameter ("image") is defined to be of the data type picture, for which a definition is proposed in [McAL87]. This graphical data type is similar to that defined in [MALL82]. A "picture" value is modeled as a partial function that maps a subset of the points in a two-dimensional plane to the set of integers. The integer value associated with each point can be interpreted as a colour value. Thus each picture value has two parts; a set of points and a colour for each point. Note that this definition does not imply that such values must
67
be stored pixel by pixel. More efficient storage schemes involve explicit representation of common groups of points like line segments and arcs.
Our proposed graphical language allows picture values to be created using function calls that return "primitive" picture values like points, lines, arcs and text. The value created by the procedure in Figure 4 is a union (denoted by the "+" symbol) of four line segments plus text. A graphics programming language that employs the picture data type can include any number of such functions.
Our primary reason for the use of a "set of points" representation of pictures is the need to define constraint conditions involving picture values. Suppose we wish to specify a constraint that prohibits two icons from overlapping in a diagram. If we must state the conditions to be tested in terms of the graphical attributes (coordinates, etc.) of the icons, the conditions can easily become extremely complicated. If, on the other hand, both icons are represented as a set of points then the condition is much easier to state. The reason for this is that the concept of a set and operations on sets (union, intersection, complement, etc.) are well defined. In this case we can test for non-overlapping icons by ensuring that the intersection of the two pictures results in a null set of points. A math-based notation for stating such graphical constraint specifications is defined in [McAL87], The following example constraint specifies that no two data store icons are permitted to overlap:
CONSTRAINT no_data_store_overlap IS -- No two data store icons may intersect.
OBJECTS dsl := (data_store_icon); ds2 := (data_store_icon: * /= dsl);
SATISFY (dsl.image & ds2.image) = nullpict;
END;
The first line in the OBJECTS clause directs the CASE tool to search for instances of type "data_store_icon", referring to each in turn as "dsl". For each "dsl" found, the second line directs a further iterative search to find (again) all instances of "data_store_icon", referring to each in turn as "ds2" but accepting only those that are not the same instance as the current "dsl". For each pair of icons found, the condition specified by the SATISFY clause is checked, ensuring that the intersection (&) of the two pictures is null.
8. CASE DIAGRAM LAYOUT
C. Martin [MART88] has stated that" second generation CASE tools will provide large time savings by automatically drawing the [CASE] diagrams from the the underlying data ... for example, a medium-sized entity-relationship diagram with 25 entities and 35 relationships may take three hours to draw with interactive diagramming software .. . [these] could be entered quickly in a data-entry process and generated automatically in only 5 minutes."
In this section we outline some of the preliminary investigations we have undertaken in this area and attempt to characterize the CASE diagram layout problem more generally. A system, MONDRIAN [PROT84], has been
Graphics Interface '88

developed as part of the Deview Project to generate automatically data flow diagram layouts from the system flow and system structure information contained in an SPSA requirements database. It represents a reasonable attempt at solving the layout problem for one particular CASE diagram type.
The development of MONDRIAN proceeded as follows . First, an investigation of several design automation techniques used in the automatic generation of circuit board layouts was completed. Next, an adjacency list structure was formulated to store the relevant entities (e.g., processes, data stores and interfaces) and relationships (Le., data flows). Mter some investigation of various placement strategies, an adaption of the pair linking design automation algorithm of [HANA 72] was selected (an overview of this algorithm is given later in this subsection). A regular grid structure was then devised that worked well with the placement strategy, keeping in mind the white space needed for readability and labeling of arcs. The predetermined end-point routing algorithm was then devised. The ordering strategy used in this algorithm was an adaption of Akers' algorithm [AKER72]. A major constraint on the routing strategy was to disallow arcs that were unnecessarily long, multiple bending, or intersecting. Once appropriate routes were found, the problem of text placement on data flow arcs was handled. After this was completed, the data flow diagram was printed on a graphics plotter. The placement and routing strategies are now outlined in more detail.
Placement Strategy
The placement algorithm begins by choosing, as a nucleus, the pair of nodes having the largest common weight signal set, where a signal set is a set of points (entities represented by icons) that are to be connected by one wire (relationships represented by data flow arcs). The next and all remaining nodes are selected in order on the basis of pair connectivity. The unplaced node that has the highest weighted pair connectivity with a placed node is selected and positioned as close as possible to the placed node. The connectivity is weighted, based on the type of icon participating in the connection. Process icons are given the highest weighting because they normally are not replicated in a data flow diagram and therefore should be placed early. Data stores are then weighted next highest so that they can be placed before interfaces, which are traditionally placed last and at the periphery of the diagram.
Routing Strategy
There are two major activities in the routing strategy: determining the order in which the arcs are considered for routing and performing the actual routing for each arc. A general description of the predetermined-endpoint algorithm is
as follows:
1. Order arcs based on number of intersections to a given arc. 2. Repeat thru step 5 for each arc in the order determined in
step 1: 3. Find all possible paths for an arc. 4. Rank paths. 5. Assign the highest ranked path to the predetermined
subgrid.
68
The general algorithm for ordering arcs is as follows:
1. Repeat thru step 4 for each arc: 2. Initialize the order list for current arc. 3. Determine boundary of rectangle for current arc. 4. Count the number of points lying in the boundary. 5. Sort order list structures in ascending order by point count.
The order list is a structure that records the location of two "entity" nodes and the "relationship" arc that links these two nodes. Figure 5 shows a set of nodes and the rectangles subscribed by each node pair. The point count for node pair <A, A'> is 5 because five points lie within the boundary of the rectangle subscribed by <A, A' >. The point counts of the other pairs are shown in the figure. The routing strategy would select the routes as shown in heavy lines in Fig. 5. It should be easy to see how this is accomplished, without intersections or more than one bend, providing the arcs are drawn in the order <C,C' >, <B,B'>, <D,D'>, <A,A'>.
A
Point
B Count Ordering
A: 5 4th C
B: 1 2nd D
C : 0 1st
B' 0 : 2 3rd
b)
0' C'
A' a)
Figure 5. Order of arcs a) example points b) point counts
Another major research effort undertaken in this area was that of Batini, et al [BATI86]. Their work was more formal and less heuristic-based than the approach used in MONDRIAN. Beginning with a conceptual graph of the data flow diagram, they 1) extracted a planar representation using Hopgroft and Tarjan's planarity algorithm, 2) derived an orthogonal representation of the graph using network flow algorithm techniques, and 3) from this representation, produced a compact grid structure representation using integer programming techniques. Their approach appears to handle a wider class of layouts but takes significantly longer than the more heuristic, predefined grid structure approach of MONDRIAN. (Note that we have not established that this is indeed the case, either empirically or analytically.)
An examination of these two attempts at data flow diagram layout can be of some help in formulating a general characterization of the CASE diagram layout problem. The following aspects appear to apply more generally:
Graphics Interface '88
1. Each entity is represented as a node on a diagram by the name of the entity and usually, but not necessarily, an icon.
2. Each relationship is represented on a diagram by an arc (either directed or undirected) between two entities.
3. The number of crossings between connections should be minimized.
4. External symbols (such as interfaces in DFDs and leaf modules in Structure Charts) should be placed on the external boundary of the diagram.
5. The global number of bends in arcs should be minimized.
6. The global length of arcs should be minimized.
7. The area of the smallest rectangle covering the diagram should be minimized.
8. Sufficient space (at least one grid cell) should be left between entity nodes to allow for display of arcs and labels associated with those arcs.
The above characteristics are general enough to cover a number of CASE diagrams, including those mentioned at the beginning of Section 5.
9. SUMMARY AND CONCLUSION
This paper provides an informal description of the EARA/G data model, a graphical model designed to serve as the basis for a generic CASE tool database. A formal definition of this model is provided in [McAL87]. The EARAIG model provides advanced support for modeling (a) complex aggregate design objects, (b) integrated graphical and non-graphical representations of software definitions and (c) validity constraint conditions on both graphical and non-graphical data.
Efforts are continuing in the design of a generic CASE tool database based on the EARA/G model. Important issues for the immediate future include the definition of how such a database should function in its interaction with other components of Metaview. In addition, design of physical structures for storing the EARAIG database objects is required. With regard to the layout problem, we need to develop a parameterized layout algorithm that can be interactively tailored to the specific needs of CASE diagram types. In the longer term, experimentation with models such as EARA/G for supporting various CASE development methodologies is needed to determine the ultimate effectiveness of the proposed modeling concepts.
REFERENCES 1. [AFSA85] Afsarmanesh, H., McLeod, D., Knapp, D. and Parker, A.
"An Extensible Object-Oriented Approach to Databases for VLSI/CAD" , Proc. 11th Very Large Database Conference, Stockholm, Sweden, August 1985, pp. 13-24.
2. [AKER72] Akers, S.B. "Routing", Design Automation in Digital Systems, Vol. I, Theory and Techniques, Prentice-Hall, Englewood Cliffs, NJ., 1972.
3. [BACH69] Bachman, C.W. "Data structure diagrams", Database, Vol. I, No. 2, 1969, pp. 4-10.
69
4. [BATI86] Batini, C., Nardelli, E. and Tamassia, R. "A Layout Algorithm for Data Flow Diagrams", IEEE Trans. on Software Engineering, April 1986, pp. 538-546.
5. [BAT084] Batory, D.S. and Buchmann, A.P. "Molecular Objects, Abstract Data Types and Data Models: A Framework", Proceedings Conference on Very Large Databases, Singapore, August 1984, pp. 172-184.
6. [BAT085] Batory, D.S. and Kim, W. "Modeling Concepts for VLSI CAD Objects", ACM Transactions on Database Systems, Vol. 10, No. 3, September 1985, pp. 18-32.
7. [CAMM84] Carnrnarata, S1. and Melkanoff, M.A. "An Interactive Data Dictionary Facility for CAD/CAM Data Bases", Proceedings of the First International Workshop on Expert Database Systems, Ed. Kerschley, L., Kiawah Island, South Carolina, Oct. 24-27, 1984, pp.360-377.
8. [CHEN76] Chen, P. "The Entity-Relationship Model: Toward a Unified View of Data", ACM Transactions on Database Systems, Vol. I, No. I, March 1976, pp. 9-36.
9. [DeMA78] DeMarco, T. Structured Analysis and System Specification, Yourdon Press, New York, 1978.
10. [GANE79] Gane, C. and Sarson, T. Structured Systems Analysis: Tools and Techniques, Prentice-Hall, Englewood-Cliffs, 1979.
11. [GOMA84] Gomaa, H. "A Software Design Method for Real-Time systems", Communications of the ACM, VO\. 27, No. 9, September 1984, pp. 938-949.
12. [GREE83] Green, M., Burnell, M., Vrenjak, H. and Vrenjak, M. "Experience With A Graphical Data Base System", Proceedings Graphics Interface' 83, Edmonton, Alberta, May 1983, pp. 257-270.
13. [HAMI83] Hamilton, M. and Zeldin, S. "The Functional Life Cycle and its Automation: USE.IT", The Journal of Systems and Software, Vo!. 3, 1983, pp. 25-62.
14. [HANA72] Hanan, M. and Kurtzberg, J.M., "Placement Techniques", Design Automation of Digital Systems. Vol. I, Theory and Techniques, Prentice-Hall, Englewood Cliffs, NJ., 1972.
15. [JONE76] Jones, M. "HIPO for developing Specifications", Datamation, March 1976, pp. 112-125.
16. [KAIS83] Kaiser, G.E. and Habermann, A.N. "An Environment for System Version Control", Spring COMPCON 83, (IEEE: New York), San Francisco, March 1983, pp. 415-420.
17. [KA1Z86] Katz, R.H., Chang, E. and Bhateja, R. "Version Modeling Concepts For Computer-Aided Design Databases", Proceedings ACM SIGMOD '86, May 1986, pp. 379-386.
18. [LOCK83] Lockemann, P.C. "Analysis of Version and Configuration Control in a Software Engineering Environment", Entity-Relationship Approach to Software Engineering, Elsevier Science Publishers, 1983. pp. 701-713.
19. [MALL82] Mallgren, W.R. "Formal Specification of Graphic Data Types", ACM Transactions on Programming Languages and Systems, Vo!. 4, No. 4, October 1982, pp. 687-710.
20. [MART88] Martin, C. "Second-Generation CASE Tools: A Challenge to Vendors", IEEE Software, March 1988, pp. 46-49.
21. [MART85] Martin, J. and McOure, C. Diagramming techniques for Analysts and Programmers, Prentice-Hall, Englewood Cliffs, New Jersey, 1985.
22. [McALS7] McAllister, A.1. "Modeling Concepts For Specification Environments", Ph.D. Dissertation, Dept. of Computational Science, Univ. of Saskatchewan, 1987.
23. [MORE82] Moret, B. "Decision Trees and Diagrams", ACM Computing Surveys, Vol. 14, No. 4, December, 1982, pp. 593-623.
24. [NASS73] Nassi, I. and Shneiderman, B. "An Experimental Study of Flowcharts as an Aid to Identification of Procedural Faults", ACM SIGPLAN Notices. Vo!. 8, No. 8, August 1973, pp.12-26.
Graphics Interface '88
25. [PARN76] Pamas, D.L. "On the Design and Development of Program Families", IEEE Transactions on Software Engineering, VO!. SE-2. No. I, March 1976, pp. 1-8.
26. [PR0T84] Protsko, L.B., Sorenson, P.G. and Tremblay, lP. "Automated Generation of Data Flow Diagrams from a Requirements Specification Language", Fifth Int' l Conf. on Information Systems, Tucson, Nov. 1984, pp. 157-172.
27 . [PR0T85] Protsko, L.B., Kurtenbach, G., Sorenson, P.G., and Tremblay, J.P. "DEPICT: A Graphical Interface For Systems Analysis And Design", Proceedings of the Eighteenth Annual Hawaii
International Conference on System Sciences, Honolulu, January 1985, pp. 128-139.
28. [REIS84] Reiss, S.P. "Graphical Program Development with PECAN Program Development Systems", SIGPI.AN Notices, Vol. 19, No. 5, May 1984, pp. 30-41.
29. [REIS87] Reiss, S.P. and Pato, J.N. "Displaying Program and Data Structures", Proceedings of the Twentieth Hawaii International Conference on System Sciences, Vo!. 2, 1987, pp. 391-402.
30. [ROSS77] Ross, D.T. "Structured Analysis (SA): A Language for Communicating Ideas", IEEE Transactions on Software Engineering, VO!. SE-3, No. I, January 1977, pp. 16-34.
31. [SORE81] Sorenson, P.G., Tremblay, J.P. and Friesen, A.W. "SPSU SPSA: A Minicomputer Database System for Structured Systems Analysis and Design." Proceedings of the Sigsmal/ Workshop, Orlando, Florida, 1981, pp. 109-118.
32. [SORE86] Sorenson, P.G. and Tremblay, J.P. "The DEVIEW Project Update", Tech. Report 86-3, Dept. of Computational Science, Univ. of Saskatchewan, March 1986.
33. [SORE88] Sorenson, P.G., Tremblay, J.P. and McAllister, AJ. "The Metaview System for Many Specification Environments", IEEE Software, March 1988, pp. 30-38.
34. [TICH82] Tichy, W.F. "A Data Model for Programming Support Environments and its Application", in Automated Tools for Information Systems Design, Schneider, HJ. and Wasserman, A.I. (Eds.), North-Holland, 1982, pp. 31-48.
35. [ULFS82] Ulfsby, S., Meen, S. and Oian, J. "Tornado: A Data-Base Management System for Graphics Applications", IEEE Computer Graphics and Applications, May, 1982, pp.71-79.
36. [WASS87] Wasserman, A.I. and Pircher, P.A. "A Graphical, Extensible Integrated Environment for Software Development", ACM SIGPI_AN Notices, Vo!. 22, No. I, January 1987, pp. 131-142.
37. [WILE87] Wile, D.S. and Allard, D.G. "Worlds: an Organizing Structure for Object-Bases", ACM SIGPI.AN Notices, Vol. 22, No.! , January 1987, pp.16-26.
38. [YOUR79] Yourdon, E. and Constantine, L. Structured Design: Fundamentals of a Discipline of Computer Program and Systems Design, Prentice-Hall, Englewood Cliffs, 1979.
70
Graphics Interface '88