Embed Size (px)
Citation preview

http://www.diva-portal.org
Postprint
This is the accepted version of a paper presented at 22nd International Conference on PatternRecognition, ICPR, Stockholm, Sweden, August 24-28, 2014.
Citation for the original published paper:
Hofbauer, H., Alonso-Fernandez, F., Wild, P., Bigun, J., Uhl, A. (2014)
A Ground Truth for Iris Segmentation.
In: Lisa O’Conner (ed.), 2014 22nd International Conference on Pattern Recognition (ICPR) (pp.
527-532). Los Alamitos: IEEE Computer Society
International Conference on Pattern Recognition
http://dx.doi.org/10.1109/ICPR.2014.101
N.B. When citing this work, cite the original published paper.
Permanent link to this version:http://urn.kb.se/resolve?urn=urn:nbn:se:hh:diva-24992
A Ground Truth for Iris Segmentation
Heinz Hofbauer ∗, Fernando Alonso-Fernandez †, Peter Wild ∗, Josef Bigun † and Andreas Uhl ∗∗ {hhofbaue, uhl, pwild}@cosy.sbg.ac.at
Department of Computer SciencesUniversity of SalzburgJakob-Haringer-Str. 2
5020 Salzburg, AUSTRIAhttp://wavelab.at
† {feralo, josef.bigun}@hh.seHalmstad UniversityBox 823, SE 301-18Halmstad, Sweden
http://islab.hh.se
Abstract—Classical iris biometric systems assume ideal envi-ronmental conditions and cooperative users for image acquisition.When conditions are less ideal or users are uncooperative orunaware of their biometrics being taken the image acquisitionquality suffers. This makes it harder for iris localization andsegmentation algorithms to properly segment the acquired imageinto iris and non-iris parts. Segmentation is a critical partin iris recognition systems, since errors in this initial stageare propagated to subsequent processing stages. Therefore, theperformance of iris segmentation algorithms is paramount to theperformance of the overall system. In order to properly evaluateand develop iris segmentation algorithm, especially under difficultconditions like off angle and significant occlusions or bad lighting,it is beneficial to directly assess the segmentation algorithm.Currently, when evaluating the performance of iris segmentationalgorithms this is mostly done by utilizing the recognition rate,and consequently the overall performance of the biometricsystem. In order to streamline the development and assessmentof iris segmentation algorithms with the dependence on thewhole biometric system we have generated a iris segmentationground truth database. We will show a method for evaluatingiris segmentation performance base on this ground truth databaseand give examples of how to identify problematic cases in orderto further analyse the segmentation algorithms.
I. INTRODUCTION
A generic iris recognition system [1] consists of the fol-lowing stages: iris image acquisition, image preprocessing, iristexture feature extraction and feature matching. The imagepreprocessing stage consist of iris segmentation, i.e. localiza-tion of the iris and boundary detection, and normalization,unrolling and histogram equalization, and occlusion detectionand masking. The correct localization and segmentation ofthe iris is of critical importance to the overall performanceof the biometric recognition system since errors during irissegmentation cannot be corrected at a later stage in theprocessing chain.
Classic iris recognition algorithms assume an ideal en-vironment and cooperative users. Traditionally, iris segmen-tations algorithms are based on circular iris boundaries [2],[3]. Circular iris detection is a good assumption given idealenvironments and cooperative users and a consequent frontaliris image recording. However, unaware or uncooperative users(e.g. a surveillance scenario) or non optimal environments (e.g.biometrics on the move, or gate based access systems) canresult in off angle iris images with bad illumination and orstronger occlusions due to hair or cilia. For such cases theiris segmentation becomes a harder task and assumptions likecircular iris boundaries no longer hold.
Iris image databases like UBIRIS [4], [5] or MobBIO[6] provide iris images acquired under non ideal conditions.Databases like UBIRIS can aid in the development of newerimage segmentation algorithms which can cope with non idealenvironments. However, the typical way to test such systems isto look at the performance of the full iris recognition system.With this way of testing, a failure of the iris segmentationsubsystem becomes readily apparent. However, a suboptimalperformance might not be so clearly noticeable [7]. Theoverall recognition performance is not only affected by thesegmentation accuracy, but also by the performance of theother subsystems based on possible suboptimal segmentationof the iris. As such it is difficult to differentiate between defectsin the iris segmentation system and effects which might beintroduced later in the system.
To allow the possibility of assessing iris segmentationsystems on their own, a ground truth for the iris segmentationis needed. In order to provide such a ground truth we havesegmented a total of 12621 iris images from 7 Databases.This data will be made publicly available, and can be usedto analyse existing and test new iris segmentation algorithms.
The rest of the paper is structured as follows. Sec-tion II gives information about the segmentation ground truthdatabases as well as the iris image databases it is based on. Inthe description we include the links to both the ground truthand the iris image databases as well as relevant papers. Insection III we will give a possible set of methods to evaluateiris segmentation performance and use them to evaluate a num-ber of iris segmentation algorithms, which are also publiclyavailable. Section IV will conclude the paper.
II. IRIS SEGMENTATION GROUND TRUTH DATABASE
The iris segmentation database (IRISSEG) contains a maskfor each iris image in form of parameters and a method toextract the mask. The database is partitioned into two datasetsbased on the shapes used for segmenting the iris and eye lid,the CC and EP dataset. For the CC dataset the parametersdefine circles which give the iris boundaries and eye lidmaskings. For the EP dataset the parameters define ellipsesfor the iris and polynomials for the eye lid. Note that the eyelid parameterization for both datasets was done in a way toensure the best possible separation of iris and eye lid in theiris region, i.e. outside the iris region the parameterization isnot necessarily accurate. The generation of the CC and EPdatasets were done independently, the CC dataset was createdat the Halmstad University, the EP dataset was created atthe University of Salzburg. Note that the ground truth was
manually generated. The result time and cost requirementsprevented the generation of the ground truth for the fullcontent of all databases. However, the casia4i (see below) wassegmented by two independent operators. This was done inorder to facilitate the estimation of level of conformity of theground truth generated by different operators.
The iris segmentation database is provided without theoriginal eye image databases. In the description of thedatabases a link to the actual iris database is included to makeit easier to obtain them. The dataset description also containsa list of relevant publications for each of the source iris imagedatabases.
A. IRISSEG-CC Dataset
The CC Dataset is available at http://islab.hh.se/mediawiki/index.php/Iris_Segmentation_Groundtruth.
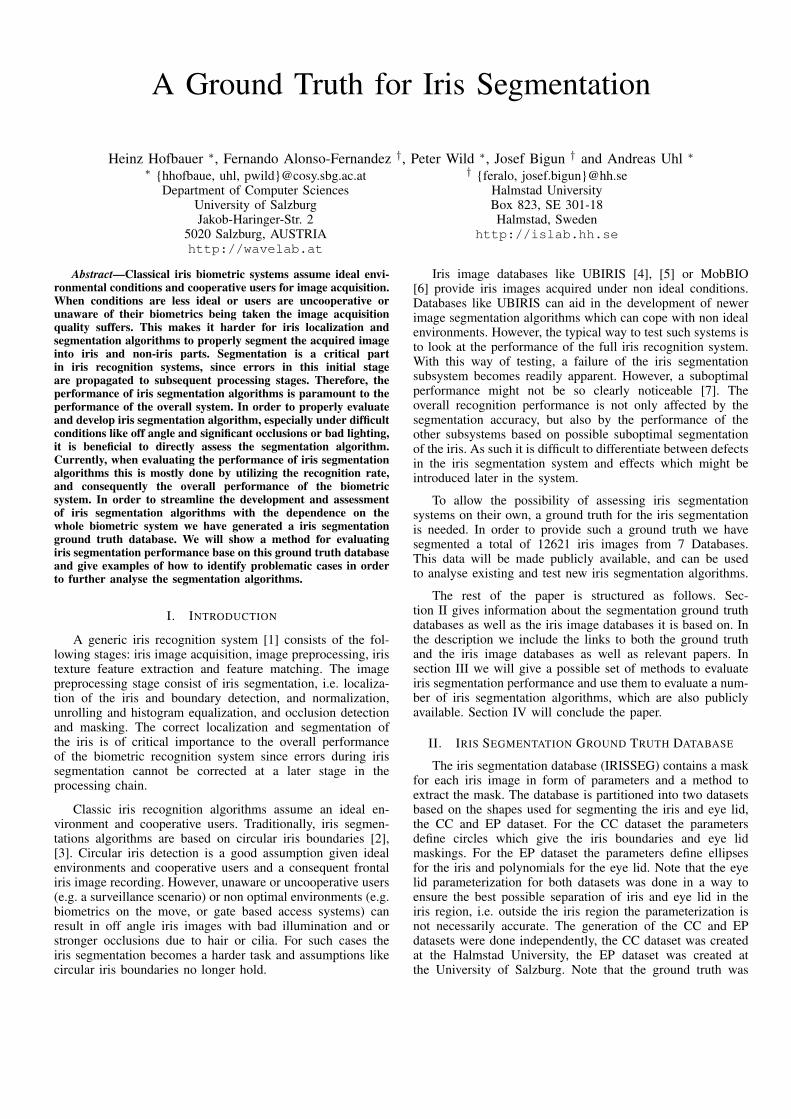
In the CC dataset the iris segmentation was done based oncircles. Both the two iris circumferences and the two eyelidsare modeled as circles, providing the radius and center of eachone. For this purpose, three points of each circle are markedby an operator, which are used to compute the correspondingradius and center. An example of annotated images is shownin Figure 1.
Fig. 1. Sample iris images with circles for both the iris circumferences andthe eyelids.
The CC dataset consists of ground truth pertaining to thefollowing iris image datasets.
BioSec Baseline database1 [8]The BioSec (biosec) database has 3,200 iris images of640×480 pixels from 200 subjects acquired with a LG IrisAc-cess EOU3000 close-up infrared iris camera. Here, we usea subset comprising data from 75 subjects (totalling 1,200iris images), for which iris and eyelids segmentation groundtruth is available. Segmentation was done by one operator. Theremaining 125 subjects only contain iris segmentation groundtruth, i.e. no eyelid segmentation, and therefore they are notused in our experiments (this data, however, is also availablein the distribution).
CASIA Iris Image Database version 3.02
The CASIA-Iris-Interval (casia3i) subset of the CASIA v3.0database, containing 2655 iris images of 320×280 pixels from249 subjects, was fully segmented. Images were acquired witha close-up infrared iris camera in an indoor environment,having images with very clear iris texture details thanks toa circular NIR LED array. The segmentation of iris imageswas performed by one operator.
1http://atvs.ii.uam.es/databases.jsp2http://biometrics.idealtest.org
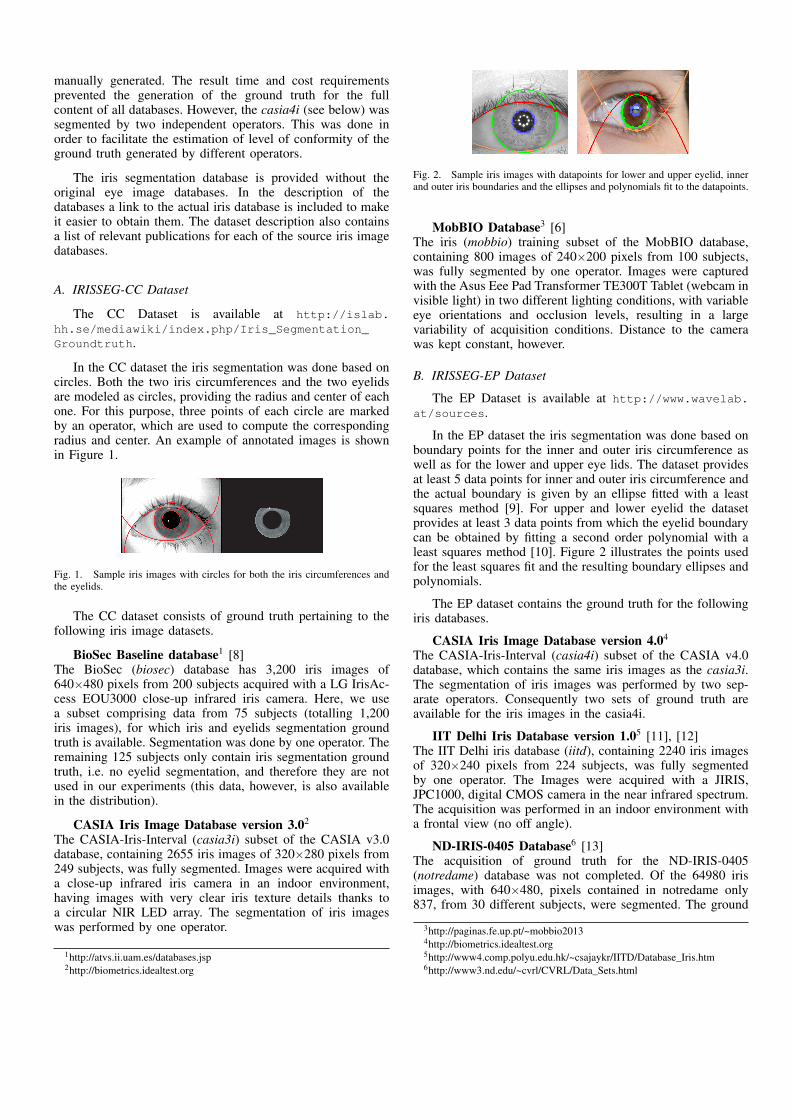
Fig. 2. Sample iris images with datapoints for lower and upper eyelid, innerand outer iris boundaries and the ellipses and polynomials fit to the datapoints.
MobBIO Database3 [6]The iris (mobbio) training subset of the MobBIO database,containing 800 images of 240×200 pixels from 100 subjects,was fully segmented by one operator. Images were capturedwith the Asus Eee Pad Transformer TE300T Tablet (webcam invisible light) in two different lighting conditions, with variableeye orientations and occlusion levels, resulting in a largevariability of acquisition conditions. Distance to the camerawas kept constant, however.
B. IRISSEG-EP Dataset
The EP Dataset is available at http://www.wavelab.at/sources.
In the EP dataset the iris segmentation was done based onboundary points for the inner and outer iris circumference aswell as for the lower and upper eye lids. The dataset providesat least 5 data points for inner and outer iris circumference andthe actual boundary is given by an ellipse fitted with a leastsquares method [9]. For upper and lower eyelid the datasetprovides at least 3 data points from which the eyelid boundarycan be obtained by fitting a second order polynomial with aleast squares method [10]. Figure 2 illustrates the points usedfor the least squares fit and the resulting boundary ellipses andpolynomials.
The EP dataset contains the ground truth for the followingiris databases.
CASIA Iris Image Database version 4.04
The CASIA-Iris-Interval (casia4i) subset of the CASIA v4.0database, which contains the same iris images as the casia3i.The segmentation of iris images was performed by two sep-arate operators. Consequently two sets of ground truth areavailable for the iris images in the casia4i.
IIT Delhi Iris Database version 1.05 [11], [12]The IIT Delhi iris database (iitd), containing 2240 iris imagesof 320×240 pixels from 224 subjects, was fully segmentedby one operator. The Images were acquired with a JIRIS,JPC1000, digital CMOS camera in the near infrared spectrum.The acquisition was performed in an indoor environment witha frontal view (no off angle).
ND-IRIS-0405 Database6 [13]The acquisition of ground truth for the ND-IRIS-0405(notredame) database was not completed. Of the 64980 irisimages, with 640×480, pixels contained in notredame only837, from 30 different subjects, were segmented. The ground
3http://paginas.fe.up.pt/~mobbio20134http://biometrics.idealtest.org5http://www4.comp.polyu.edu.hk/~csajaykr/IITD/Database_Iris.htm6http://www3.nd.edu/~cvrl/CVRL/Data_Sets.html
groundtruth
iris masktn fn fp tp
manualsegmentation
algorithmicsegmentation
intersect
Fig. 3. Example of intersection for calculation of precision and recall.
truth of one operator is available. The image acquisition wasdone in the near infrared spectrum in an indoor environmentwith the LG 2200 iris biometric system. The iris imagescontain samples of ’real-world’ type iris images, off-angle,blur, interlacing due to motion, occlusions and iris image cutoffby off center image acquisition.
UBIRIS.v2 Database7 [5]The segmentation of the UBIRIS.v2 database (ubiris) was notcompleted. Of the 11101 iris images, with 400×300 pixels,contained in ubiris only 2250 iris images, from 50 differentsubjects, were segmented by one operator. The images wereacquired with a Nikon E5700 camera and split into twosessions. The first session was performed under controlledconditions simulating the enrollment stage. A second sessionwas performed using a real-world type setup, with a naturalluminosity and corresponding heterogeneity in reflections, con-trast and focus. The database contains frontal and off-angle irisimages recorded from various distances with occlusions.
III. EXPERIMENTAL FRAMEWORK
A. Methodology
The goal of a segmentation algorithm is to retrieve the irisregion, or iris pixels, from an image. In order to evaluate theperformance of the algorithm we will utilize the precision (P),recall (R) and F-measure (F), which are well known measuresfrom the field of information retrieval [14]. We can splitthe mask produced by an algorithm into four result groups,illustrated in fig. 3: true positives (tp), the number of iris pixelswhich were correctly marked; false positives (fp), the numberof non-iris pixels which were marked; false negative (fn), thenumber of unmarked iris pixels; and true negative (tn), thenumber of unmarked non-iris pixel.
The precision defined as
P =tp
tp+ fp,
gives the percentage of retrieved iris pixels which are correct.The recall
R =tp
tp+ fn,
gives the percentage of iris pixels in the ground truth whichwere correctly retrieved. Since the target is to optimize bothrecall and precision these two scores are combined by the F-measure, which is the harmonic mean of P and R,
F =2RPR+ P .
7http://iris.di.ubi.pt/ubiris2.html
The recall, precision and F-measure can concisely describethe segmentation performance of a given algorithm basedon ground truth. The measures are good when comparingalgorithms. From the equations we can see that recall is ameasure for the original iris content retrieved by an algorithm,it can also be maximized by overestimating the iris. Precisionon the other hand can be optimized by underestimating theiris and is a measure of the non-iris content of the retrievediris mask. The F-measure combines precision and recall in away that will prevent optimization of results by over fitting orunder fitting the iris.
While the overall performance over a database is a goodperformance measure, it is often more useful to know bordercases when developing an algorithm. Iris images which areespecially good or especially bad show faults and strength ofan algorithm better than the overall performance. Especiallyduring development this information can be utilized to furtherimprove and algorithm. In order to find outliers we suggestthe following methods.
Precision, recall and the F-measure are calculated for everyimage I in a given database D. In order to find outliers wecalculate the z-score for a given measure m ∈ {R,P,F} as
z(I,D) =m(I)− µ(mi∈D(i))
σ(mi∈D(i)).
A given mask is defined as an outlier if |z| > 3 (µ± 3σ). Thiscannot only be done for individual iris images but also forusers, i.e. find users which overall exhibit interesting propertiesregarding an algorithm. To do this we partition D into groupsG, where each group contains all iris images of one user.Another possibility is to partition the groups by user and eyeid, either left or right. In this case we can also calculate thegroup outliers, for G ∈ G, with
z(G,G) =µ(mi∈G(i))− µ(µg∈G(mi∈g(i)))
σ(µg∈G(mi∈g(i))).
B. Evaluation
For the evaluation we utilize the following iris segmenta-tion algorithms: CAHT [1], WAHET[15], Osiris[16], IFFP [17]and GST [18]. The algorithms generate mask images for theiris. These images are compared to the ground truth providedin the database as discussed in the previous section.
However, in order to be able to put the performance ofthe algorithms into context we need a suitable baseline. Thenotion that a parameterized boundary exactly matches the irisis wrong, it is however preferable to a pixel perfect mask forthe subsequent rubbersheet normalisation. The (parameterized)circles, ellipses and polynomials cannot generate a pixel per-fect iris mask. Consequently, if an algorithm would generatea perfect pixel mask the F-measure would be lower than 1,since the ground truth is not that exact. However, the addressedsegmentation algorithms employ parameterized curves (circlesand ellipses) unlikely to generate a pixel perfect iris mask.The question then becomes: is it still plausible to assume anF-measure of 1 to be an attainable maximum.
In order to establish a proper baseline we use the casia4idataset for which we have the ground truth from two differentoperators. Since the operators independently assessed andmarked the iris circumference the resulting iris mask will be
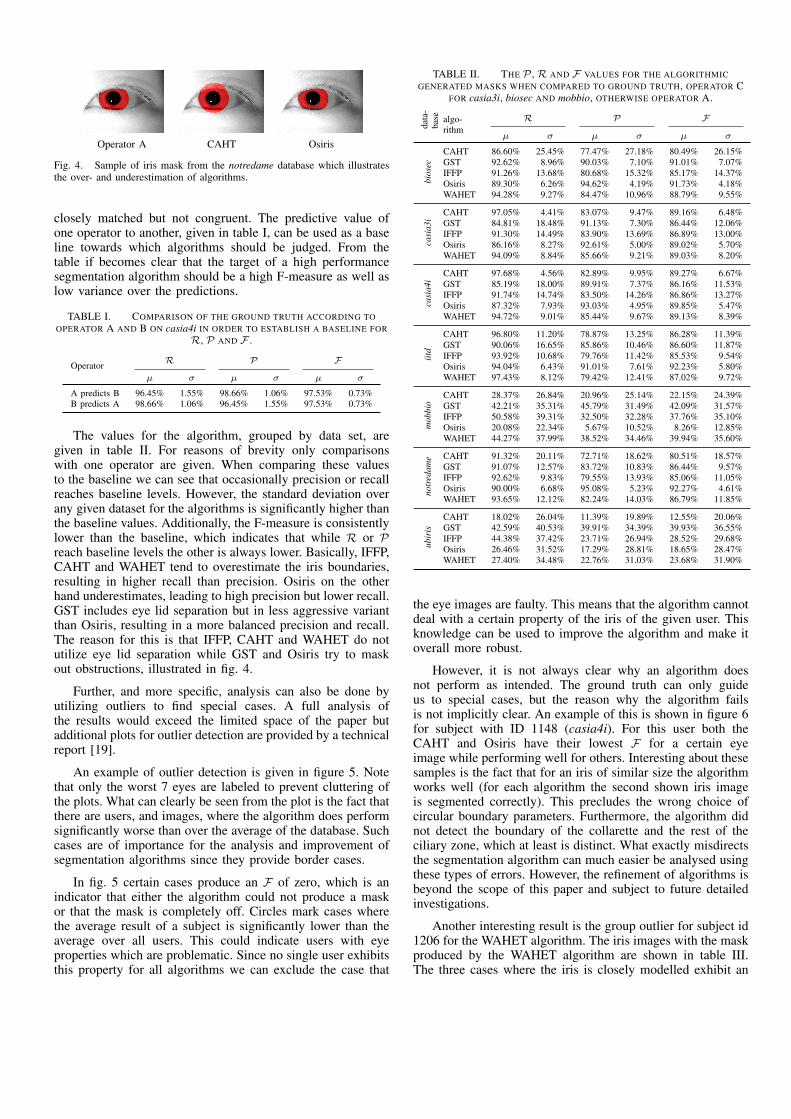
Operator A CAHT Osiris
Fig. 4. Sample of iris mask from the notredame database which illustratesthe over- and underestimation of algorithms.
closely matched but not congruent. The predictive value ofone operator to another, given in table I, can be used as a baseline towards which algorithms should be judged. From thetable if becomes clear that the target of a high performancesegmentation algorithm should be a high F-measure as well aslow variance over the predictions.
TABLE I. COMPARISON OF THE GROUND TRUTH ACCORDING TOOPERATOR A AND B ON casia4i IN ORDER TO ESTABLISH A BASELINE FOR
R, P AND F .
Operator R P F
µ σ µ σ µ σ
A predicts B 96.45% 1.55% 98.66% 1.06% 97.53% 0.73%B predicts A 98.66% 1.06% 96.45% 1.55% 97.53% 0.73%
The values for the algorithm, grouped by data set, aregiven in table II. For reasons of brevity only comparisonswith one operator are given. When comparing these valuesto the baseline we can see that occasionally precision or recallreaches baseline levels. However, the standard deviation overany given dataset for the algorithms is significantly higher thanthe baseline values. Additionally, the F-measure is consistentlylower than the baseline, which indicates that while R or Preach baseline levels the other is always lower. Basically, IFFP,CAHT and WAHET tend to overestimate the iris boundaries,resulting in higher recall than precision. Osiris on the otherhand underestimates, leading to high precision but lower recall.GST includes eye lid separation but in less aggressive variantthan Osiris, resulting in a more balanced precision and recall.The reason for this is that IFFP, CAHT and WAHET do notutilize eye lid separation while GST and Osiris try to maskout obstructions, illustrated in fig. 4.
Further, and more specific, analysis can also be done byutilizing outliers to find special cases. A full analysis ofthe results would exceed the limited space of the paper butadditional plots for outlier detection are provided by a technicalreport [19].
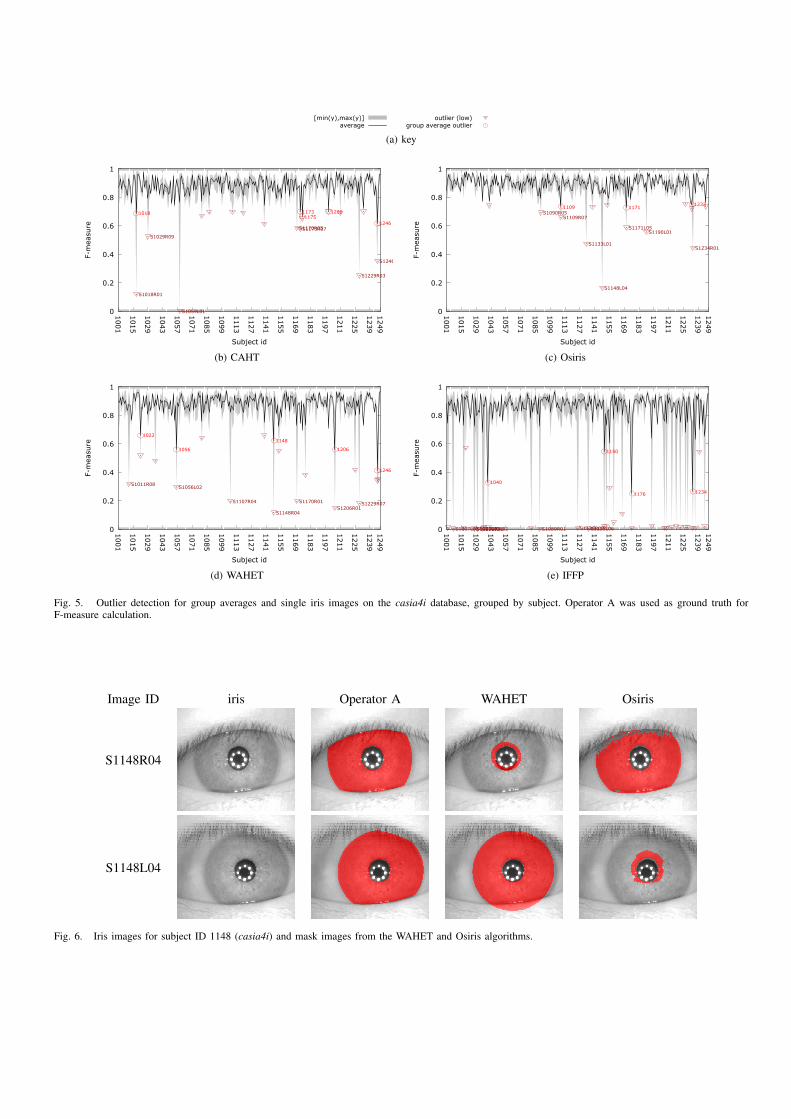
An example of outlier detection is given in figure 5. Notethat only the worst 7 eyes are labeled to prevent cluttering ofthe plots. What can clearly be seen from the plot is the fact thatthere are users, and images, where the algorithm does performsignificantly worse than over the average of the database. Suchcases are of importance for the analysis and improvement ofsegmentation algorithms since they provide border cases.
In fig. 5 certain cases produce an F of zero, which is anindicator that either the algorithm could not produce a maskor that the mask is completely off. Circles mark cases wherethe average result of a subject is significantly lower than theaverage over all users. This could indicate users with eyeproperties which are problematic. Since no single user exhibitsthis property for all algorithms we can exclude the case that
TABLE II. THE P , R AND F VALUES FOR THE ALGORITHMICGENERATED MASKS WHEN COMPARED TO GROUND TRUTH, OPERATOR C
FOR casia3i, biosec AND mobbio, OTHERWISE OPERATOR A.
data
-ba
se algo-rithm
R P F
µ σ µ σ µ σ
bios
ec
CAHT 86.60% 25.45% 77.47% 27.18% 80.49% 26.15%GST 92.62% 8.96% 90.03% 7.10% 91.01% 7.07%IFFP 91.26% 13.68% 80.68% 15.32% 85.17% 14.37%Osiris 89.30% 6.26% 94.62% 4.19% 91.73% 4.18%WAHET 94.28% 9.27% 84.47% 10.96% 88.79% 9.55%
casi
a3i
CAHT 97.05% 4.41% 83.07% 9.47% 89.16% 6.48%GST 84.81% 18.48% 91.13% 7.30% 86.44% 12.06%IFFP 91.30% 14.49% 83.90% 13.69% 86.89% 13.00%Osiris 86.16% 8.27% 92.61% 5.00% 89.02% 5.70%WAHET 94.09% 8.84% 85.66% 9.21% 89.03% 8.20%
casi
a4i
CAHT 97.68% 4.56% 82.89% 9.95% 89.27% 6.67%GST 85.19% 18.00% 89.91% 7.37% 86.16% 11.53%IFFP 91.74% 14.74% 83.50% 14.26% 86.86% 13.27%Osiris 87.32% 7.93% 93.03% 4.95% 89.85% 5.47%WAHET 94.72% 9.01% 85.44% 9.67% 89.13% 8.39%
iitd
CAHT 96.80% 11.20% 78.87% 13.25% 86.28% 11.39%GST 90.06% 16.65% 85.86% 10.46% 86.60% 11.87%IFFP 93.92% 10.68% 79.76% 11.42% 85.53% 9.54%Osiris 94.04% 6.43% 91.01% 7.61% 92.23% 5.80%WAHET 97.43% 8.12% 79.42% 12.41% 87.02% 9.72%
mob
bio
CAHT 28.37% 26.84% 20.96% 25.14% 22.15% 24.39%GST 42.21% 35.31% 45.79% 31.49% 42.09% 31.57%IFFP 50.58% 39.31% 32.50% 32.28% 37.76% 35.10%Osiris 20.08% 22.34% 5.67% 10.52% 8.26% 12.85%WAHET 44.27% 37.99% 38.52% 34.46% 39.94% 35.60%
notr
edam
e CAHT 91.32% 20.11% 72.71% 18.62% 80.51% 18.57%GST 91.07% 12.57% 83.72% 10.83% 86.44% 9.57%IFFP 92.62% 9.83% 79.55% 13.93% 85.06% 11.05%Osiris 90.00% 6.68% 95.08% 5.23% 92.27% 4.61%WAHET 93.65% 12.12% 82.24% 14.03% 86.79% 11.85%
ubir
is
CAHT 18.02% 26.04% 11.39% 19.89% 12.55% 20.06%GST 42.59% 40.53% 39.91% 34.39% 39.93% 36.55%IFFP 44.38% 37.42% 23.71% 26.94% 28.52% 29.68%Osiris 26.46% 31.52% 17.29% 28.81% 18.65% 28.47%WAHET 27.40% 34.48% 22.76% 31.03% 23.68% 31.90%
the eye images are faulty. This means that the algorithm cannotdeal with a certain property of the iris of the given user. Thisknowledge can be used to improve the algorithm and make itoverall more robust.
However, it is not always clear why an algorithm doesnot perform as intended. The ground truth can only guideus to special cases, but the reason why the algorithm failsis not implicitly clear. An example of this is shown in figure 6for subject with ID 1148 (casia4i). For this user both theCAHT and Osiris have their lowest F for a certain eyeimage while performing well for others. Interesting about thesesamples is the fact that for an iris of similar size the algorithmworks well (for each algorithm the second shown iris imageis segmented correctly). This precludes the wrong choice ofcircular boundary parameters. Furthermore, the algorithm didnot detect the boundary of the collarette and the rest of theciliary zone, which at least is distinct. What exactly misdirectsthe segmentation algorithm can much easier be analysed usingthese types of errors. However, the refinement of algorithms isbeyond the scope of this paper and subject to future detailedinvestigations.
Another interesting result is the group outlier for subject id1206 for the WAHET algorithm. The iris images with the maskproduced by the WAHET algorithm are shown in table III.The three cases where the iris is closely modelled exhibit an
[min(y),max(y)]average
outlier (low)group average outlier
(a) key
0
0.2
0.4
0.6
0.8
1
1001
1015
1029
1043
1057
1071
1085
1099
1113
1127
1141
1155
1169
1183
1197
1211
1225
1239
1249
F-m
easu
re
Subject id
S1059L01
S1018R01
S1229R03
S1246R03
S1029R09
S1173R07S1170R05
1018
1246
1173 12001175
(b) CAHT
0
0.2
0.4
0.6
0.8
1
1001
1015
1029
1043
1057
1071
1085
1099
1113
1127
1141
1155
1169
1183
1197
1211
1225
1239
1249
F-m
easu
re
Subject id
S1148L04
S1234R01S1133L01
S1190L01S1171L05
S1109R07S1090R05
11711233
1109
(c) Osiris
0
0.2
0.4
0.6
0.8
1
1001
1015
1029
1043
1057
1071
1085
1099
1113
1127
1141
1155
1169
1183
1197
1211
1225
1239
1249
F-m
easu
re
Subject id
S1148R04S1206R01
S1229R07S1107R04 S1170R01
S1056L02S1011R08
1148
1056
1022
1206
1246
(d) WAHET
0
0.2
0.4
0.6
0.8
1
1001
1015
1029
1043
1057
1071
1085
1099
1113
1127
1141
1155
1169
1183
1197
1211
1225
1239
1249
F-m
easu
re
Subject id
S1030R10 S1089R01S1027L02S1007L05 S1035L02 S1135L06S1125R07
1150
1176
1040
1234
(e) IFFP
Fig. 5. Outlier detection for group averages and single iris images on the casia4i database, grouped by subject. Operator A was used as ground truth forF-measure calculation.
Image ID iris Operator A WAHET Osiris
S1148R04
S1148L04
Fig. 6. Iris images for subject ID 1148 (casia4i) and mask images from the WAHET and Osiris algorithms.
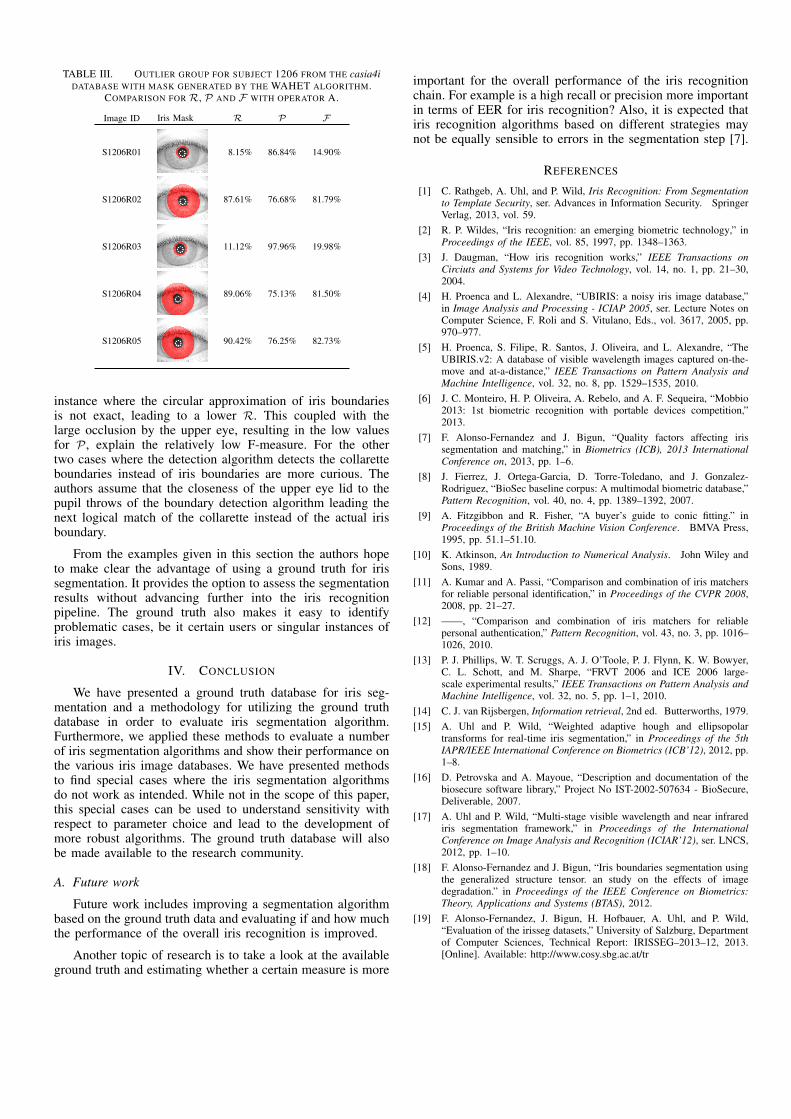
TABLE III. OUTLIER GROUP FOR SUBJECT 1206 FROM THE casia4iDATABASE WITH MASK GENERATED BY THE WAHET ALGORITHM.
COMPARISON FOR R, P AND F WITH OPERATOR A.
Image ID Iris Mask R P F
S1206R01 8.15% 86.84% 14.90%
S1206R02 87.61% 76.68% 81.79%
S1206R03 11.12% 97.96% 19.98%
S1206R04 89.06% 75.13% 81.50%
S1206R05 90.42% 76.25% 82.73%
instance where the circular approximation of iris boundariesis not exact, leading to a lower R. This coupled with thelarge occlusion by the upper eye, resulting in the low valuesfor P, explain the relatively low F-measure. For the othertwo cases where the detection algorithm detects the collaretteboundaries instead of iris boundaries are more curious. Theauthors assume that the closeness of the upper eye lid to thepupil throws of the boundary detection algorithm leading thenext logical match of the collarette instead of the actual irisboundary.
From the examples given in this section the authors hopeto make clear the advantage of using a ground truth for irissegmentation. It provides the option to assess the segmentationresults without advancing further into the iris recognitionpipeline. The ground truth also makes it easy to identifyproblematic cases, be it certain users or singular instances ofiris images.
IV. CONCLUSION
We have presented a ground truth database for iris seg-mentation and a methodology for utilizing the ground truthdatabase in order to evaluate iris segmentation algorithm.Furthermore, we applied these methods to evaluate a numberof iris segmentation algorithms and show their performance onthe various iris image databases. We have presented methodsto find special cases where the iris segmentation algorithmsdo not work as intended. While not in the scope of this paper,this special cases can be used to understand sensitivity withrespect to parameter choice and lead to the development ofmore robust algorithms. The ground truth database will alsobe made available to the research community.
A. Future work
Future work includes improving a segmentation algorithmbased on the ground truth data and evaluating if and how muchthe performance of the overall iris recognition is improved.
Another topic of research is to take a look at the availableground truth and estimating whether a certain measure is more
important for the overall performance of the iris recognitionchain. For example is a high recall or precision more importantin terms of EER for iris recognition? Also, it is expected thatiris recognition algorithms based on different strategies maynot be equally sensible to errors in the segmentation step [7].
REFERENCES
[1] C. Rathgeb, A. Uhl, and P. Wild, Iris Recognition: From Segmentationto Template Security, ser. Advances in Information Security. SpringerVerlag, 2013, vol. 59.
[2] R. P. Wildes, “Iris recognition: an emerging biometric technology,” inProceedings of the IEEE, vol. 85, 1997, pp. 1348–1363.
[3] J. Daugman, “How iris recognition works,” IEEE Transactions onCirciuts and Systems for Video Technology, vol. 14, no. 1, pp. 21–30,2004.
[4] H. Proenca and L. Alexandre, “UBIRIS: a noisy iris image database,”in Image Analysis and Processing - ICIAP 2005, ser. Lecture Notes onComputer Science, F. Roli and S. Vitulano, Eds., vol. 3617, 2005, pp.970–977.
[5] H. Proenca, S. Filipe, R. Santos, J. Oliveira, and L. Alexandre, “TheUBIRIS.v2: A database of visible wavelength images captured on-the-move and at-a-distance,” IEEE Transactions on Pattern Analysis andMachine Intelligence, vol. 32, no. 8, pp. 1529–1535, 2010.
[6] J. C. Monteiro, H. P. Oliveira, A. Rebelo, and A. F. Sequeira, “Mobbio2013: 1st biometric recognition with portable devices competition,”2013.
[7] F. Alonso-Fernandez and J. Bigun, “Quality factors affecting irissegmentation and matching,” in Biometrics (ICB), 2013 InternationalConference on, 2013, pp. 1–6.
[8] J. Fierrez, J. Ortega-Garcia, D. Torre-Toledano, and J. Gonzalez-Rodriguez, “BioSec baseline corpus: A multimodal biometric database,”Pattern Recognition, vol. 40, no. 4, pp. 1389–1392, 2007.
[9] A. Fitzgibbon and R. Fisher, “A buyer’s guide to conic fitting.” inProceedings of the British Machine Vision Conference. BMVA Press,1995, pp. 51.1–51.10.
[10] K. Atkinson, An Introduction to Numerical Analysis. John Wiley andSons, 1989.
[11] A. Kumar and A. Passi, “Comparison and combination of iris matchersfor reliable personal identification,” in Proceedings of the CVPR 2008,2008, pp. 21–27.
[12] ——, “Comparison and combination of iris matchers for reliablepersonal authentication,” Pattern Recognition, vol. 43, no. 3, pp. 1016–1026, 2010.
[13] P. J. Phillips, W. T. Scruggs, A. J. O’Toole, P. J. Flynn, K. W. Bowyer,C. L. Schott, and M. Sharpe, “FRVT 2006 and ICE 2006 large-scale experimental results,” IEEE Transactions on Pattern Analysis andMachine Intelligence, vol. 32, no. 5, pp. 1–1, 2010.
[14] C. J. van Rijsbergen, Information retrieval, 2nd ed. Butterworths, 1979.[15] A. Uhl and P. Wild, “Weighted adaptive hough and ellipsopolar
transforms for real-time iris segmentation,” in Proceedings of the 5thIAPR/IEEE International Conference on Biometrics (ICB’12), 2012, pp.1–8.
[16] D. Petrovska and A. Mayoue, “Description and documentation of thebiosecure software library,” Project No IST-2002-507634 - BioSecure,Deliverable, 2007.
[17] A. Uhl and P. Wild, “Multi-stage visible wavelength and near infrarediris segmentation framework,” in Proceedings of the InternationalConference on Image Analysis and Recognition (ICIAR’12), ser. LNCS,2012, pp. 1–10.
[18] F. Alonso-Fernandez and J. Bigun, “Iris boundaries segmentation usingthe generalized structure tensor. an study on the effects of imagedegradation.” in Proceedings of the IEEE Conference on Biometrics:Theory, Applications and Systems (BTAS), 2012.
[19] F. Alonso-Fernandez, J. Bigun, H. Hofbauer, A. Uhl, and P. Wild,“Evaluation of the irisseg datasets,” University of Salzburg, Departmentof Computer Sciences, Technical Report: IRISSEG–2013–12, 2013.[Online]. Available: http://www.cosy.sbg.ac.at/tr


![1992-8645 IMAGE FUSION TECHNIQUES FOR IRIS AND · PDF fileand iris boundary. In iris segmentation the iris ... lower eyelid using the linear Hough transform [13]. In this paper Iris](https://img.pdfslide.net/doc/110x75/5aac91c37f8b9aa06a8d31f9/1992-8645-image-fusion-techniques-for-iris-and-iris-boundary-in-iris-segmentation.jpg)