Embed Size (px)
Citation preview

A growing asset class in difficult times
LIUC
April 2009
1
Investing in High Yield and Distressed Debt
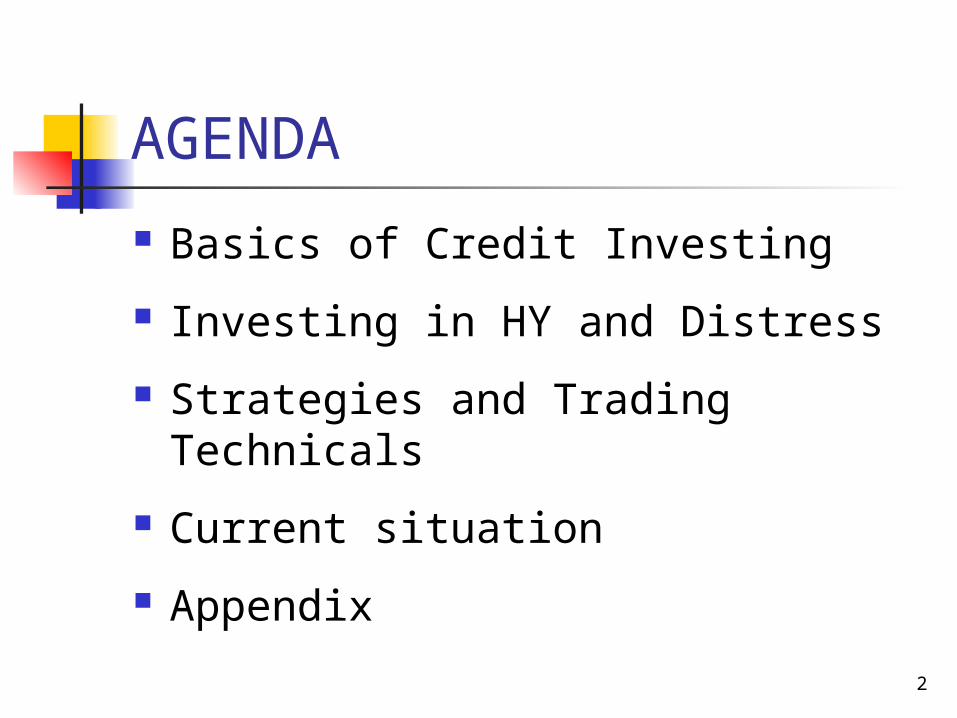
AGENDA
Basics of Credit Investing
Investing in HY and Distress
Strategies and Trading Technicals
Current situation
Appendix
2
Basics of Credit Investing
A Focus on High Yield Bonds and
Leverage Loans
3
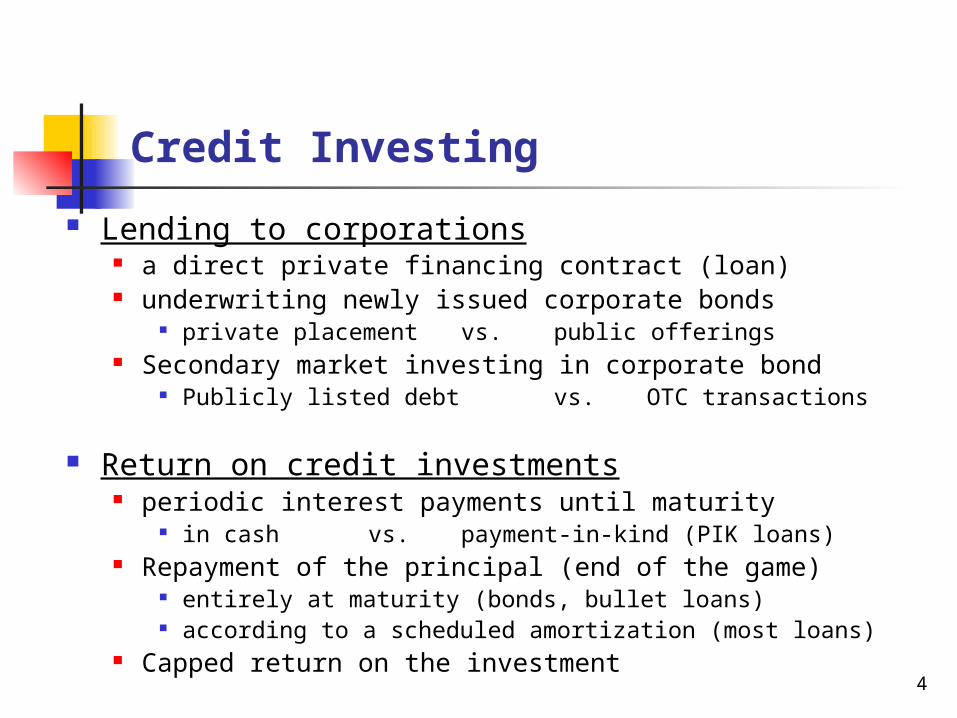
Credit Investing
Lending to corporations a direct private financing contract (loan) underwriting newly issued corporate bonds
private placement vs. public offerings Secondary market investing in corporate bond
Publicly listed debt vs. OTC transactions
Return on credit investments periodic interest payments until maturity
in cash vs. payment-in-kind (PIK loans) Repayment of the principal (end of the game)
entirely at maturity (bonds, bullet loans) according to a scheduled amortization (most loans)
Capped return on the investment 4
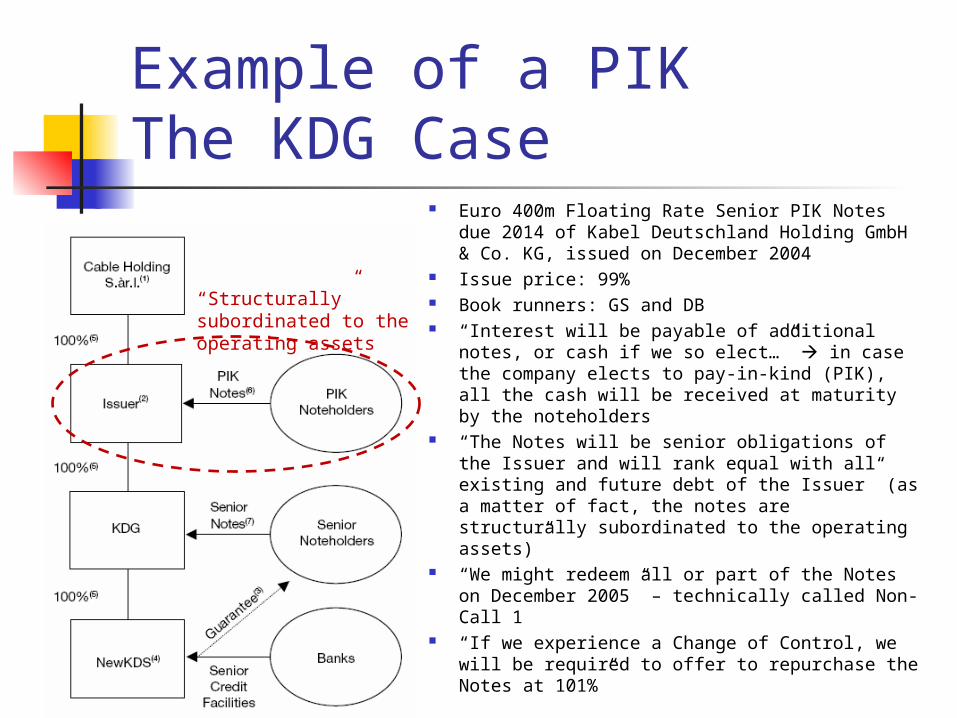
Example of a PIK The KDG Case
Euro 400m Floating Rate Senior PIK Notes due 2014 of Kabel Deutschland Holding GmbH & Co. KG, issued on December 2004
Issue price: 99% Book runners: GS and DB “Interest will be payable of additional notes, or
cash if we so elect…” in case the company elects to pay-in-kind (PIK), all the cash will be received at maturity by the noteholders
“The Notes will be senior obligations of the Issuer and will rank equal with all existing and future debt of the Issuer” (as a matter of fact, the notes are structurally subordinated to the operating assets)”
“We might redeem all or part of the Notes on December 2005” – technically called Non-Call 1
“If we experience a Change of Control, we will be required to offer to repurchase the Notes at 101%”
“Structurally” subordinated to the operating assets
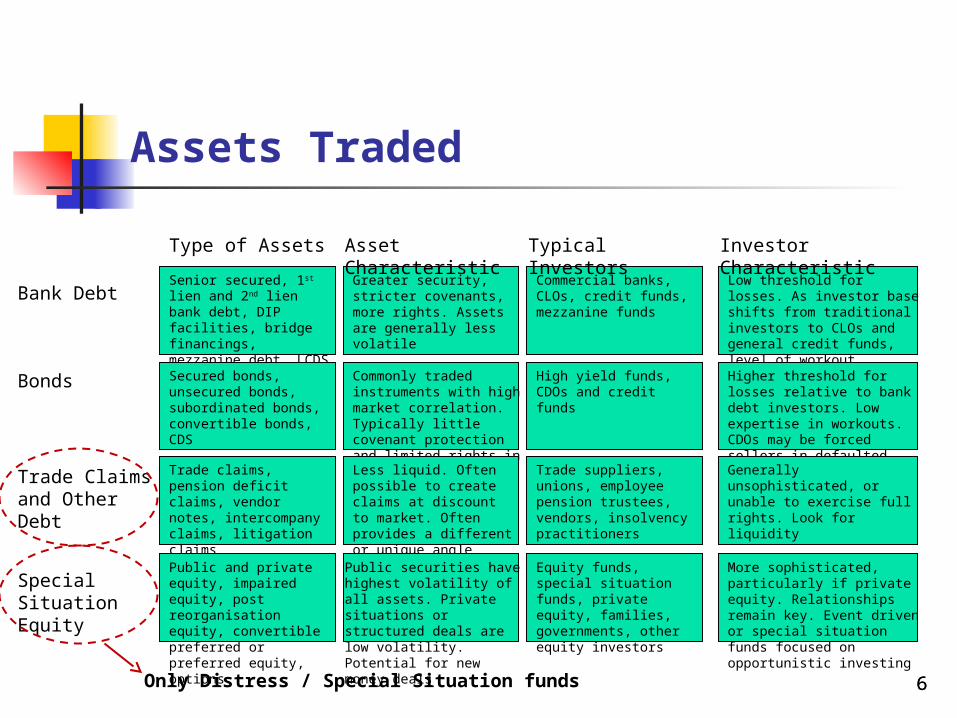
Assets Traded
Senior secured, 1st lien and 2nd lien bank debt, DIP facilities, bridge financings, mezzanine debt, LCDS
Greater security, stricter covenants, more rights. Assets are generally less volatile
Commercial banks, CLOs, credit funds, mezzanine funds
Low threshold for losses. As investor base shifts from traditional investors to CLOs and general credit funds, level of workout expertise is decreasing
Secured bonds, unsecured bonds, subordinated bonds, convertible bonds, CDS
Commonly traded instruments with high market correlation. Typically little covenant protection and limited rights in a workout
High yield funds, CDOs and credit funds
Higher threshold for losses relative to bank debt investors. Low expertise in workouts. CDOs may be forced sellers in defaulted situations
Trade claims, pension deficit claims, vendor notes, intercompany claims, litigation claims
Less liquid. Often possible to create claims at discount to market. Often provides a different or unique angle
Trade suppliers, unions, employee pension trustees, vendors, insolvency practitioners
Generally unsophisticated, or unable to exercise full rights. Look for liquidity
Public and private equity, impaired equity, post reorganisation equity, convertible preferred or preferred equity, options
Public securities have highest volatility of all assets. Private situations or structured deals are low volatility. Potential for new money deals
Equity funds, special situation funds, private equity, families, governments, other equity investors
More sophisticated, particularly if private equity. Relationships remain key. Event driven or special situation funds focused on opportunistic investing
Type of Assets Asset CharacteristicTypical Investors Investor Characteristic
Bank Debt
Bonds
Trade Claims and Other Debt
Special Situation Equity
6Only Distress / Special Situation funds 6
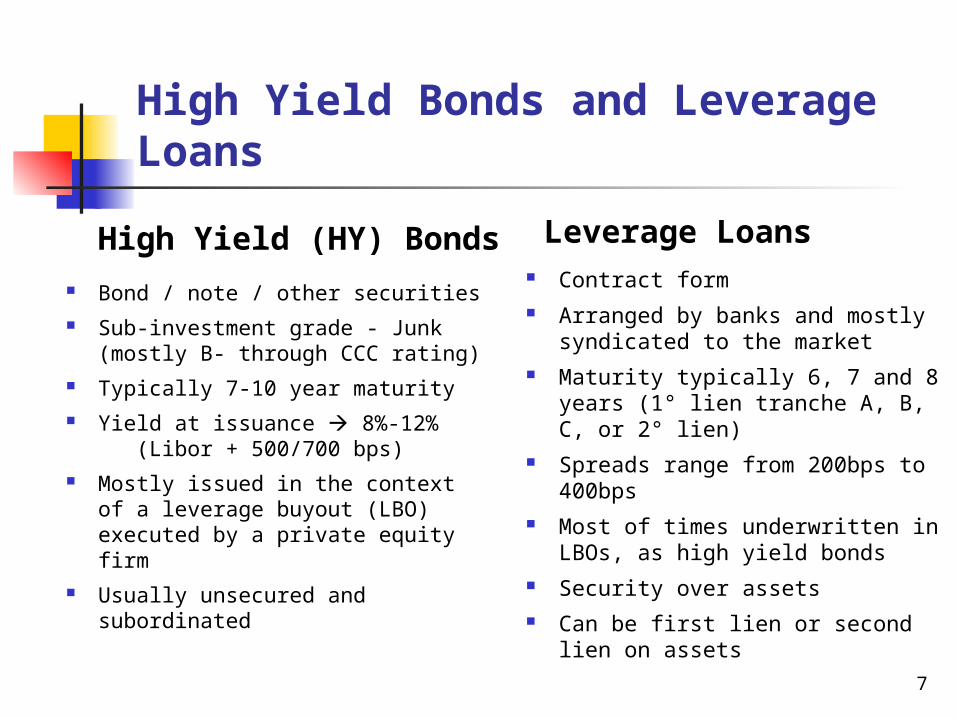
High Yield Bonds and Leverage Loans
High Yield (HY) Bonds
Bond / note / other securities Sub-investment grade - Junk
(mostly B- through CCC rating) Typically 7-10 year maturity Yield at issuance 8%-12%
(Libor + 500/700 bps) Mostly issued in the context of
a leverage buyout (LBO) executed by a private equity firm
Usually unsecured and subordinated
Leverage Loans Contract form Arranged by banks and mostly
syndicated to the market Maturity typically 6, 7 and 8
years (1° lien tranche A, B, C, or 2° lien)
Spreads range from 200bps to 400bps
Most of times underwritten in LBOs, as high yield bonds
Security over assets Can be first lien or second lien
on assets7
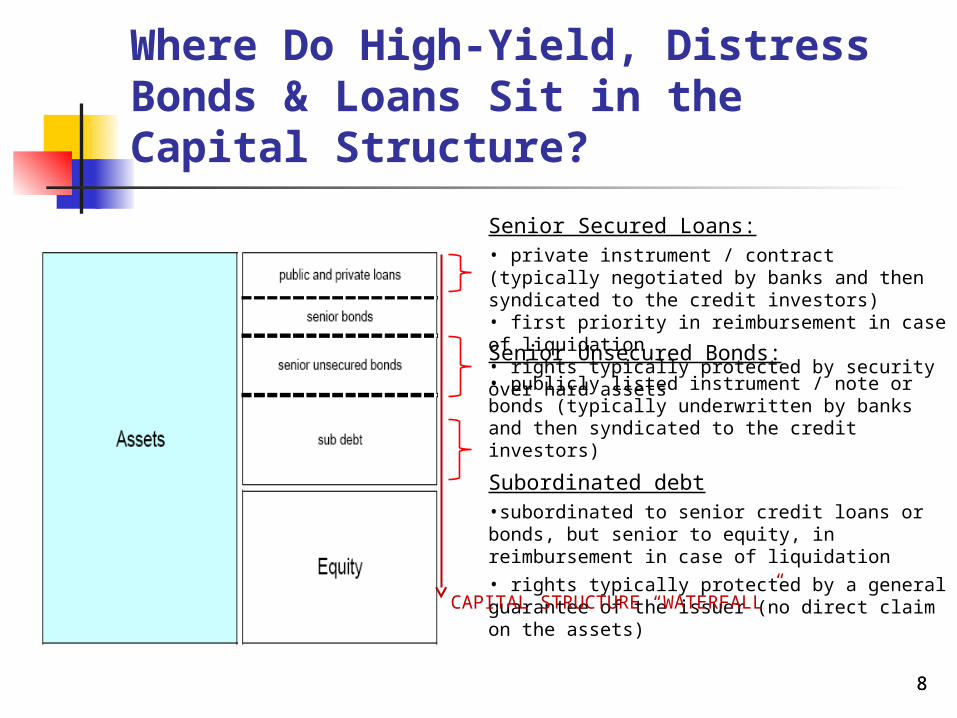
Where Do High-Yield, Distress Bonds & Loans Sit in the Capital Structure?
• private instrument / contract (typically negotiated by banks and then syndicated to the credit investors)• first priority in reimbursement in case of liquidation• rights typically protected by security over hard assets• publicly listed instrument / note or bonds (typically underwritten by banks and then syndicated to the credit investors)
Subordinated debt•subordinated to senior credit loans or bonds, but senior to equity, in reimbursement in case of liquidation
• rights typically protected by a general guarantee of the issuer (no direct claim on the assets)
Senior Secured Loans:
Senior Unsecured Bonds:
8
CAPITAL STRUCTURE “WATERFALL”
8
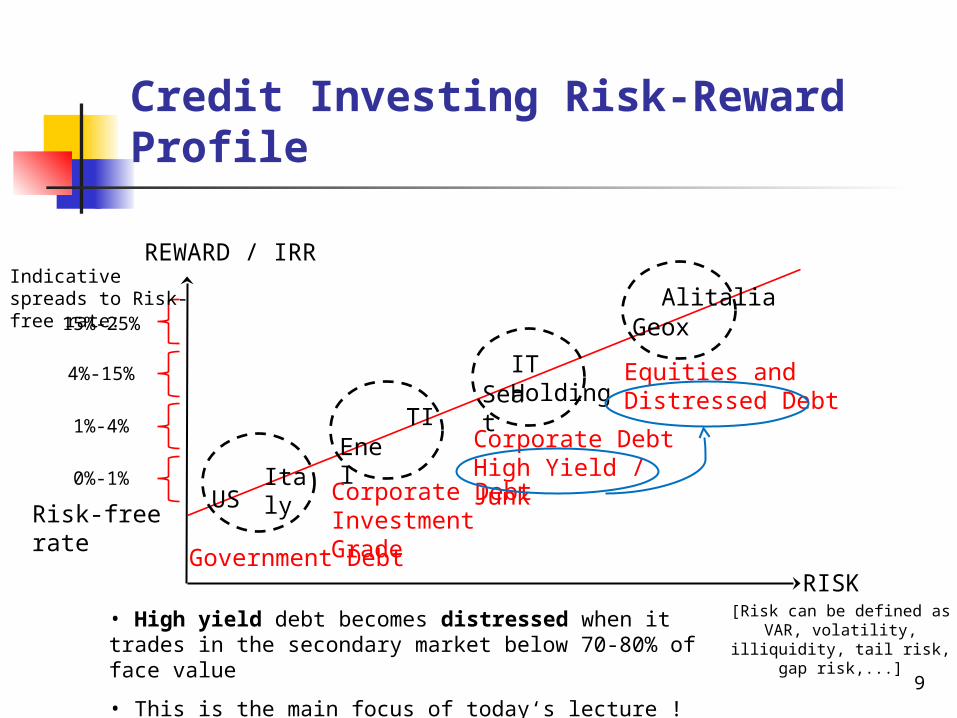
Credit Investing Risk-Reward Profile
RISK
REWARD / IRR
Risk-free rate
USItaly
Government Debt
Enel
TI
Corporate DebtInvestment Grade
Seat
IT Holding
Corporate DebtHigh Yield / Junk
GeoxAlitalia
Equities andDistressed Debt
Indicative spreads to Risk-free rate:
15%-25%
4%-15%
1%-4%
0%-1%
• High yield debt becomes distressed when it trades in the secondary market below 70-80% of face value
• This is the main focus of today‘s lecture !
[Risk can be defined as VAR, volatility, illiquidity,
tail risk, gap risk,...]
9
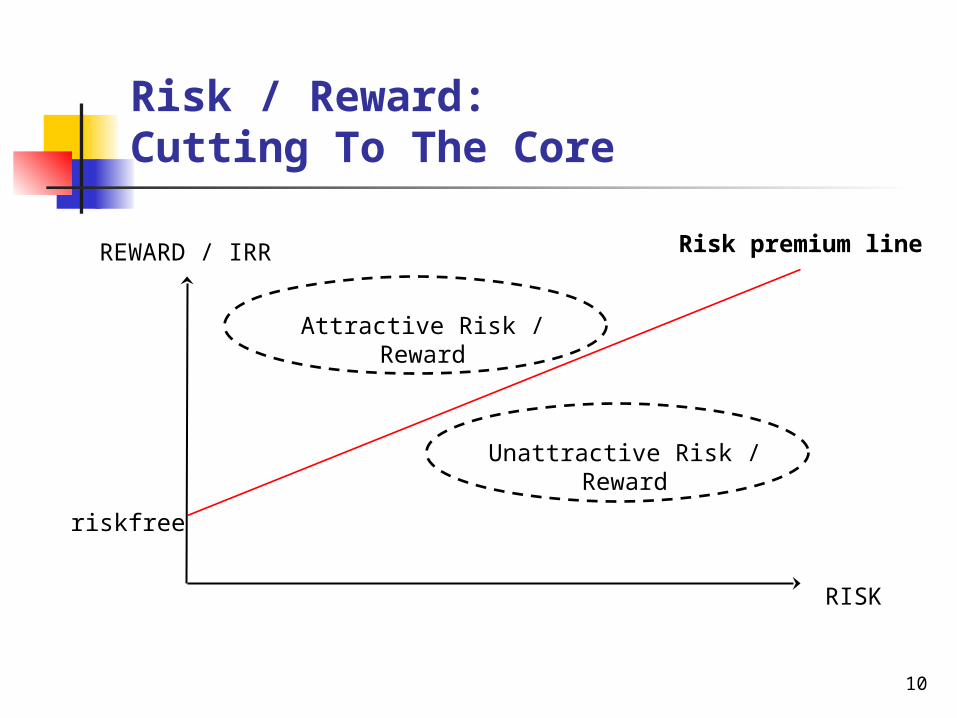
Risk / Reward: Cutting To The Core
RISK
REWARD / IRR
Attractive Risk / Reward
Unattractive Risk / Reward
10
Risk premium line
riskfree
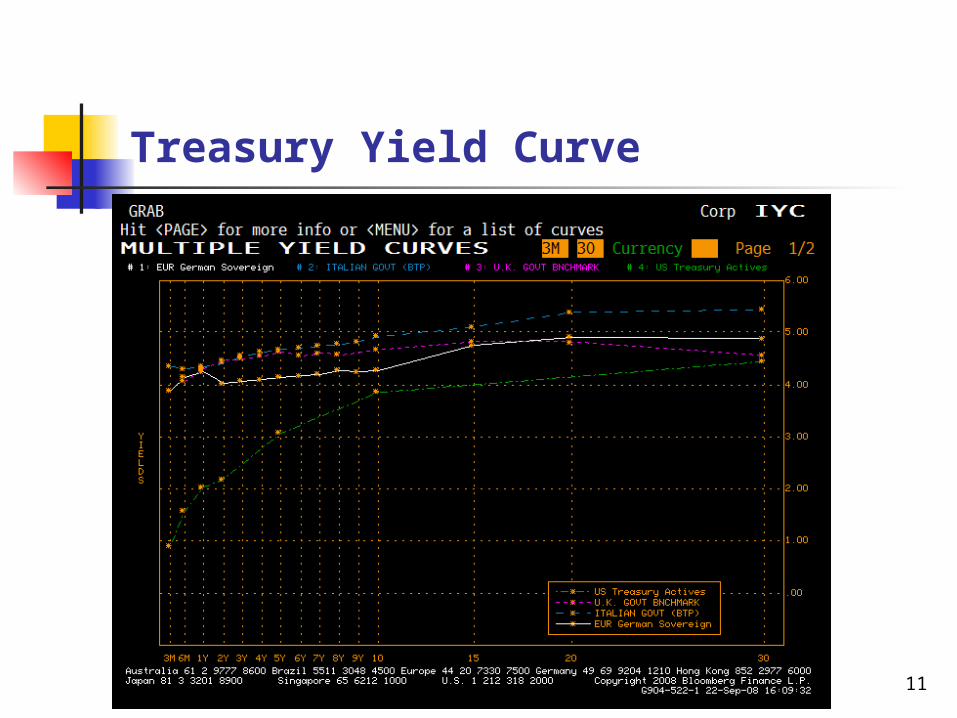
Treasury Yield Curve
11
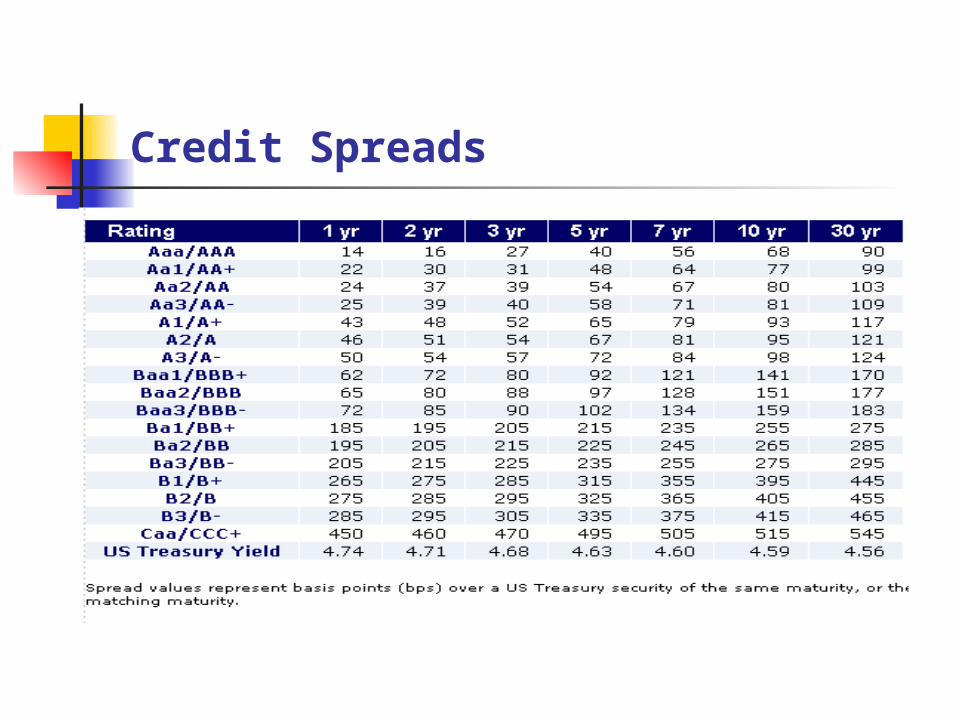
Credit Spreads
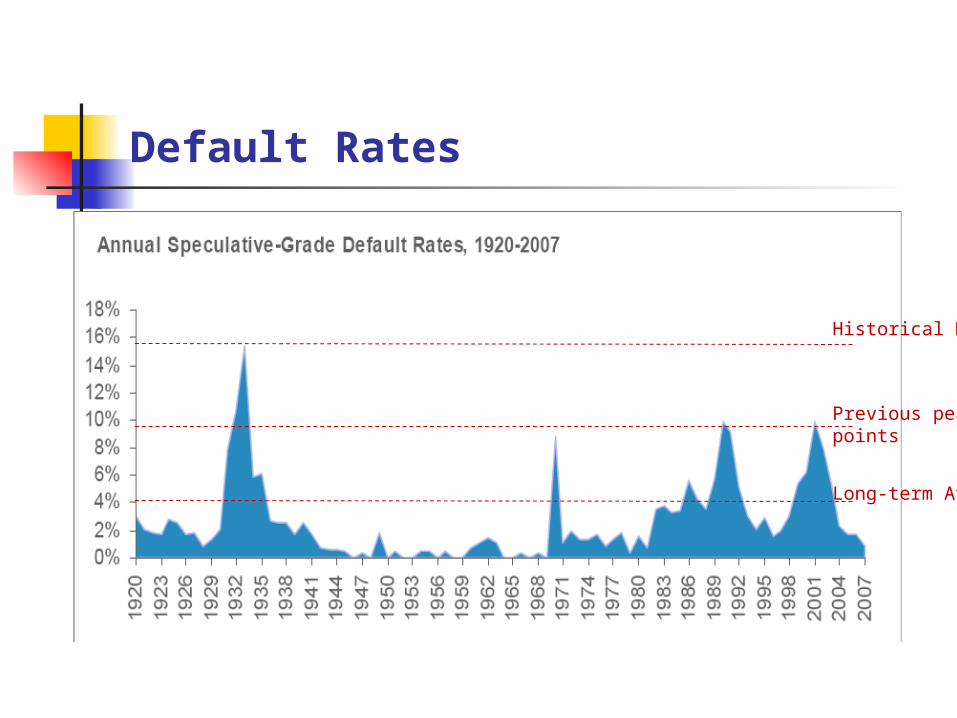
Default Rates
Long-term Avg
Previous peakpoints
Historical Max
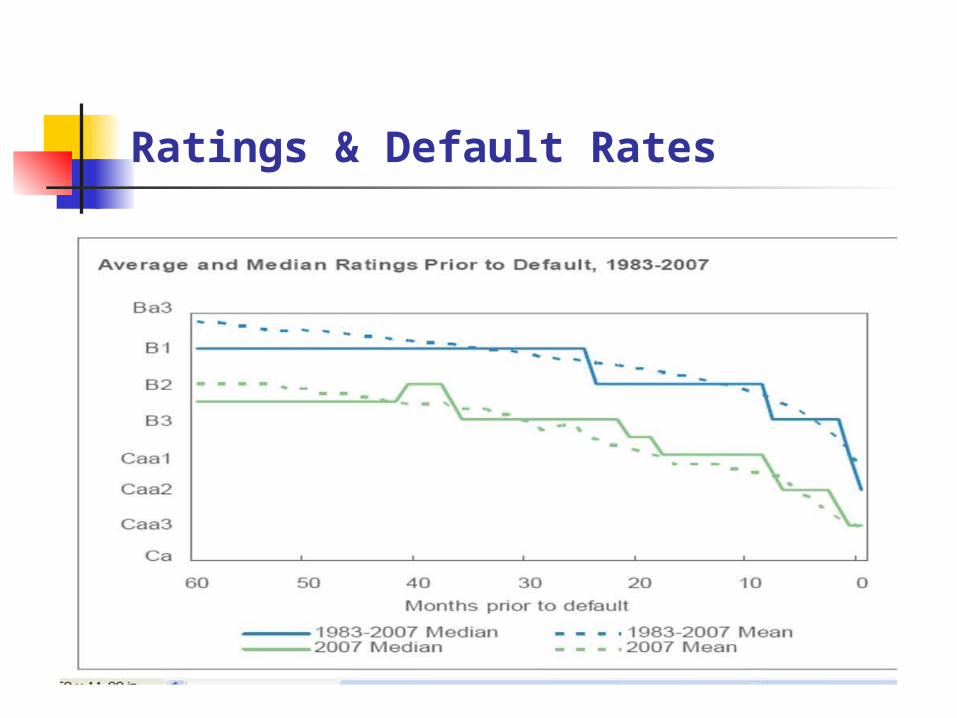
Ratings & Default Rates
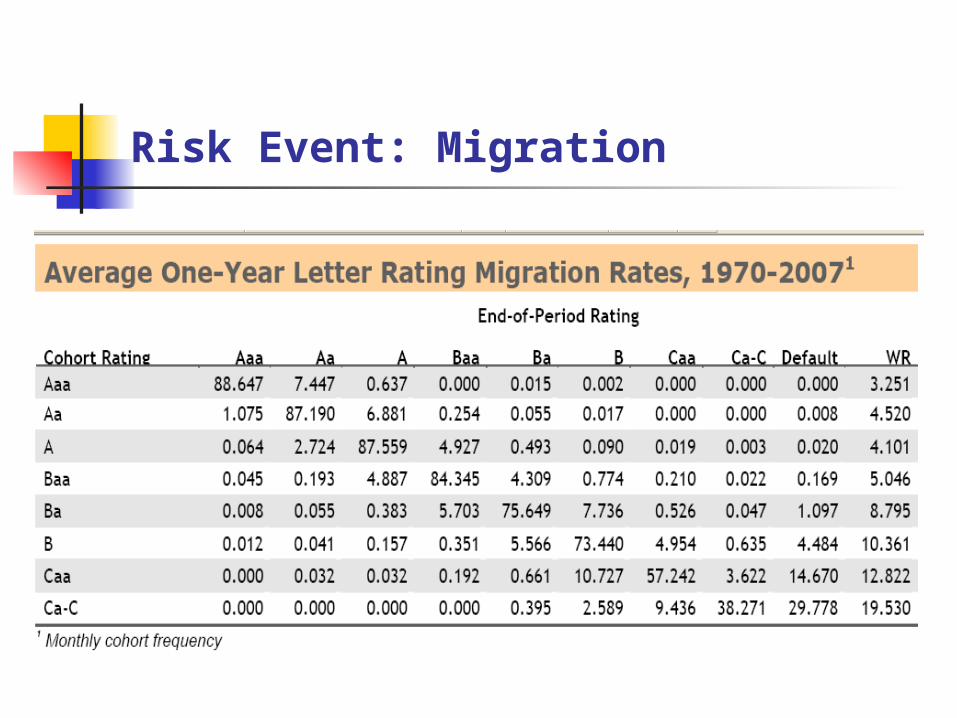
Risk Event: Migration
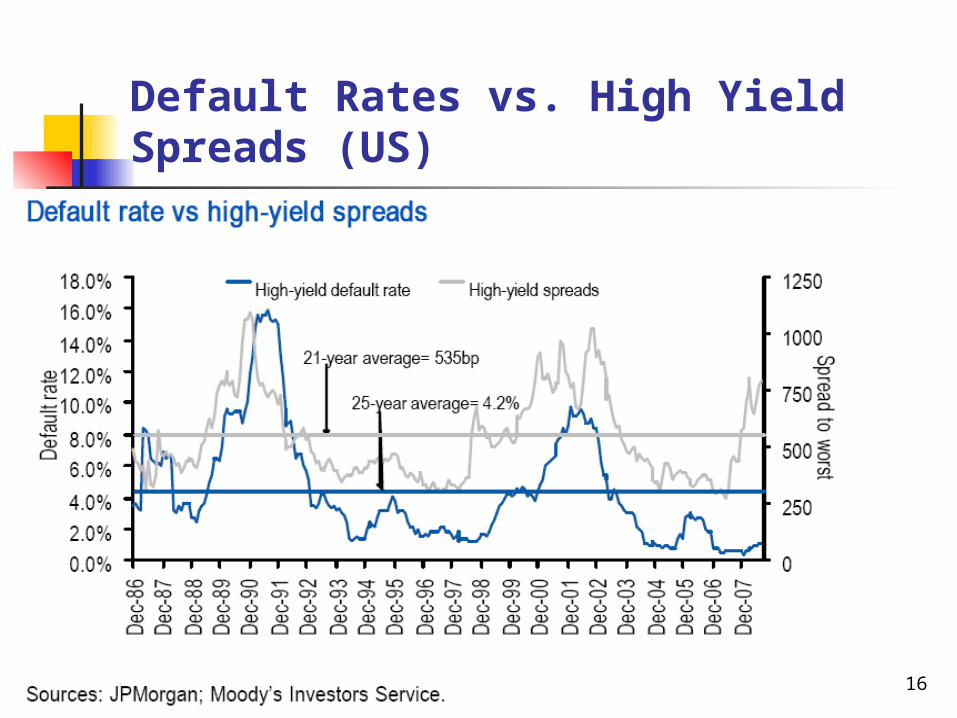
Default Rates vs. High Yield Spreads (US)
16
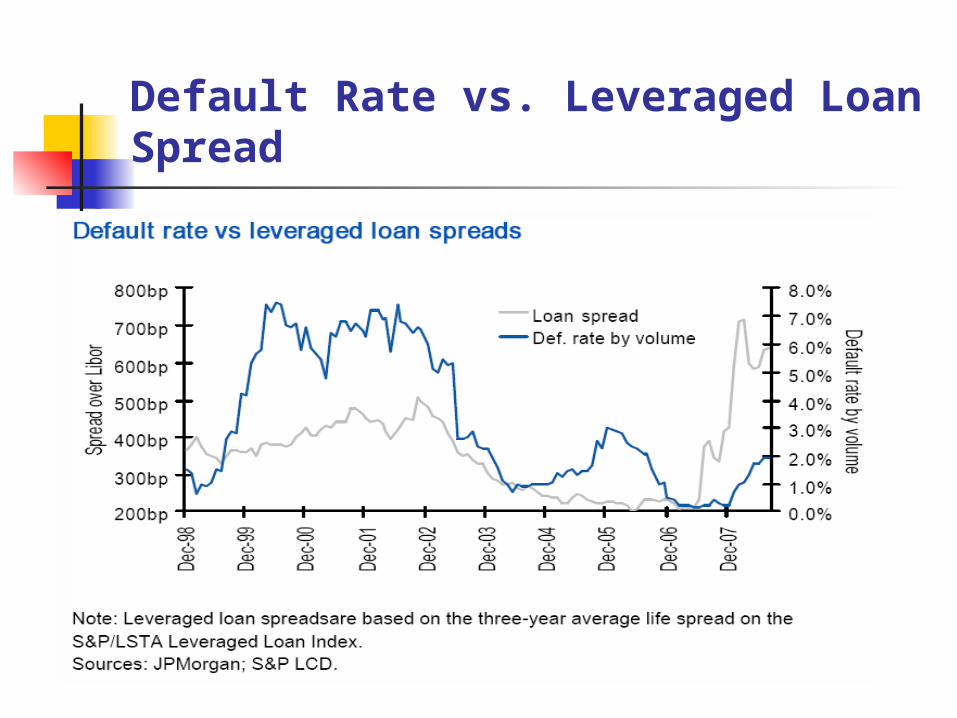
Default Rate vs. Leveraged Loan Spread
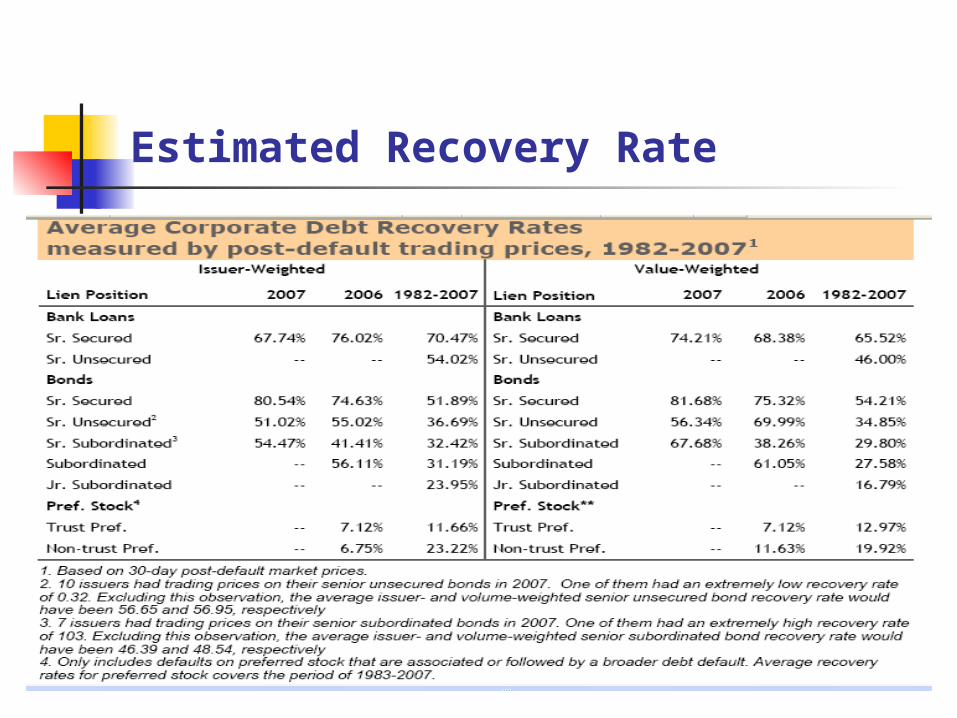
Estimated Recovery Rate
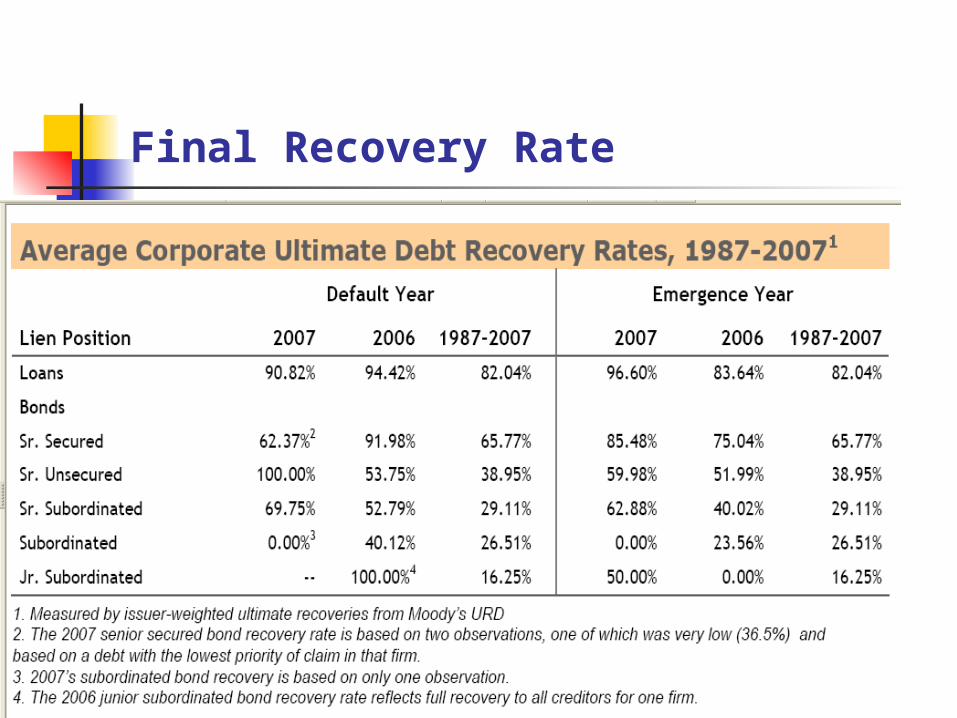
Final Recovery Rate
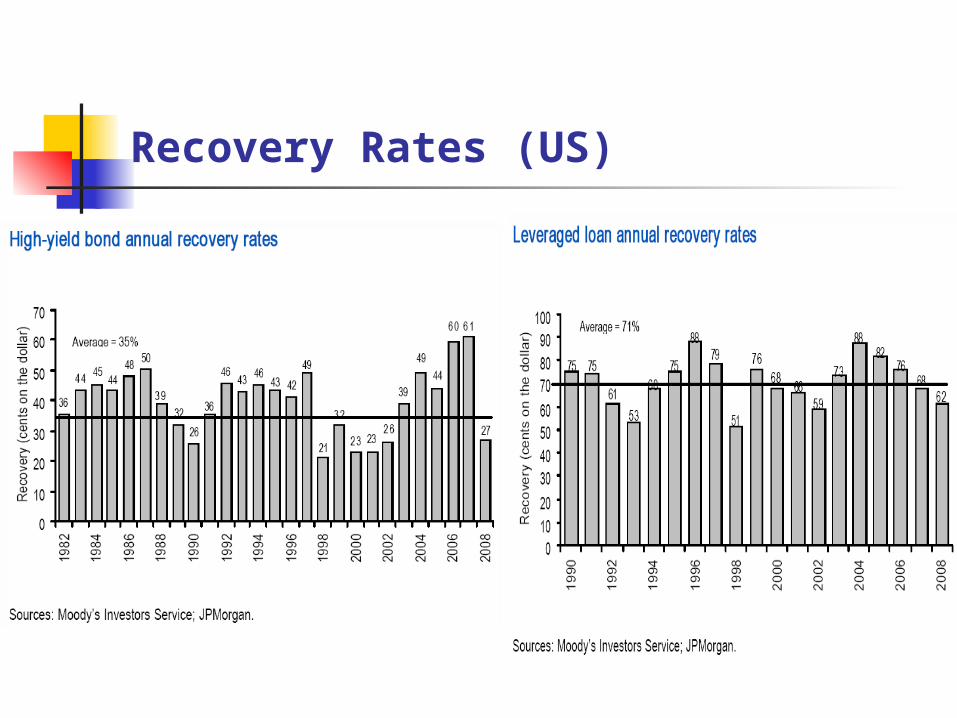
Recovery Rates (US)
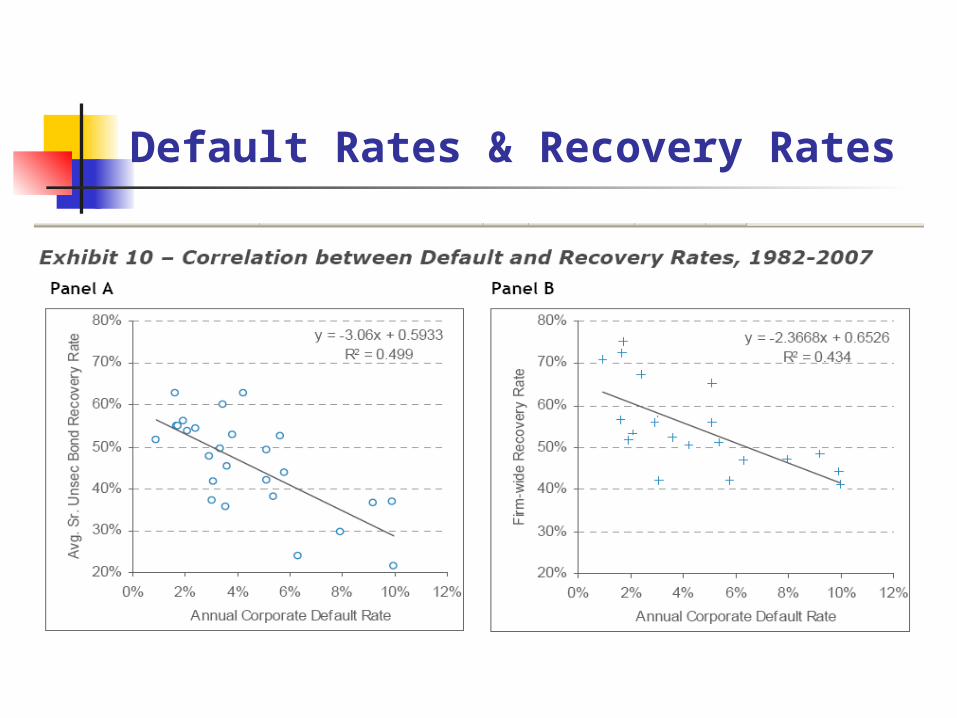
Default Rates & Recovery Rates
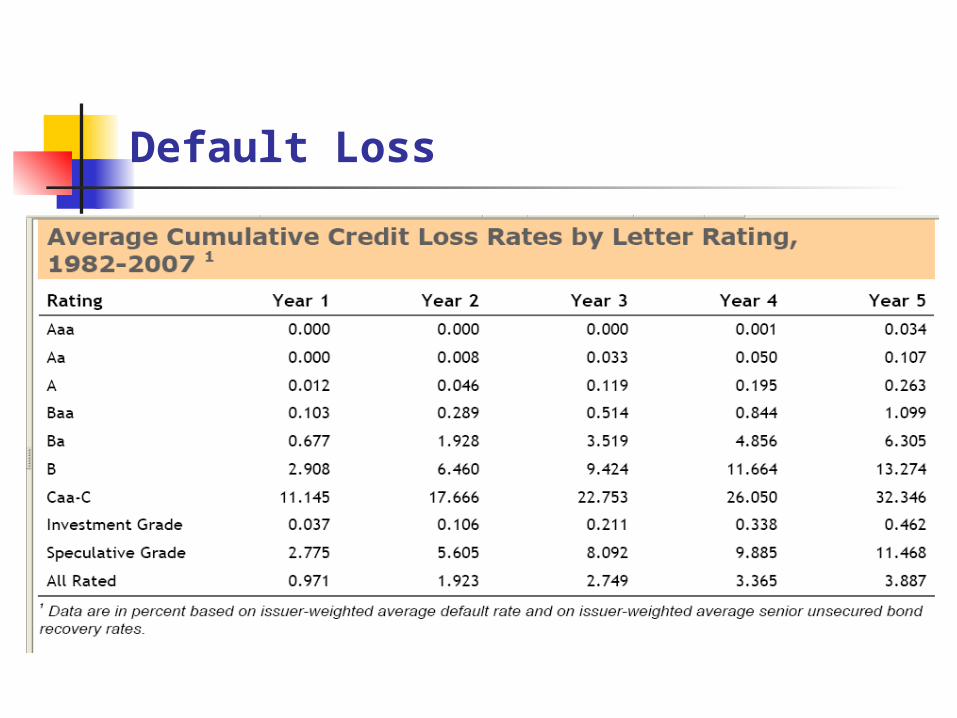
Default Loss
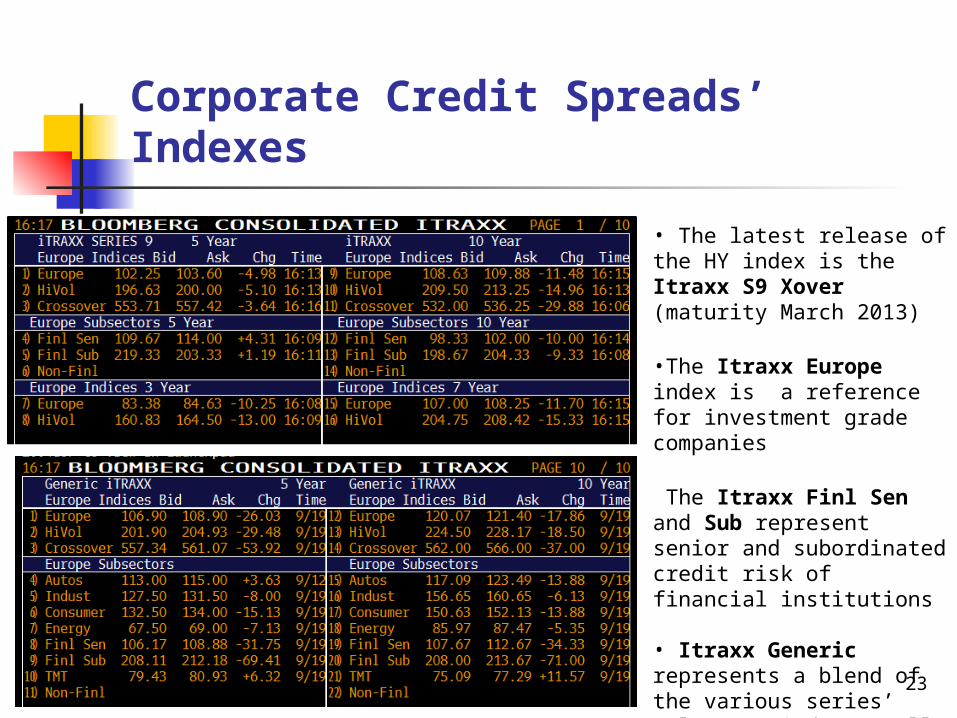
Corporate Credit Spreads’ Indexes
• The latest release of the HY index is the Itraxx S9 Xover (maturity March 2013)
•The Itraxx Europe index is a reference for investment grade companies
The Itraxx Finl Sen and Sub represent senior and subordinated credit risk of financial institutions
• Itraxx Generic represents a blend of the various series’ releases (indexes roll every 6 months into a new release with new constituents)
23
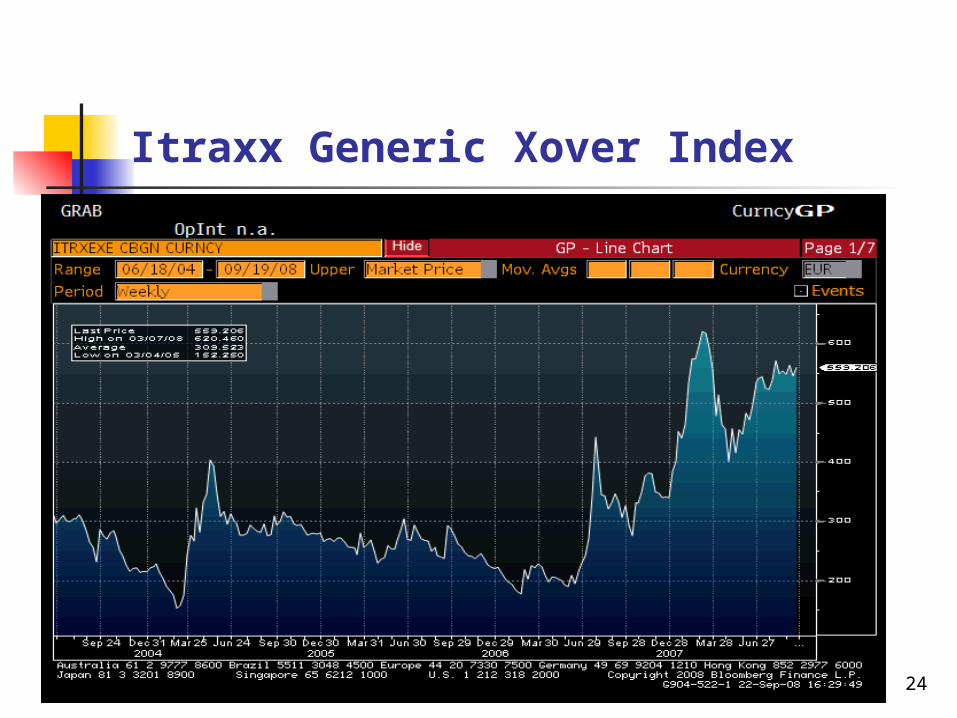
Itraxx Generic Xover Index
24
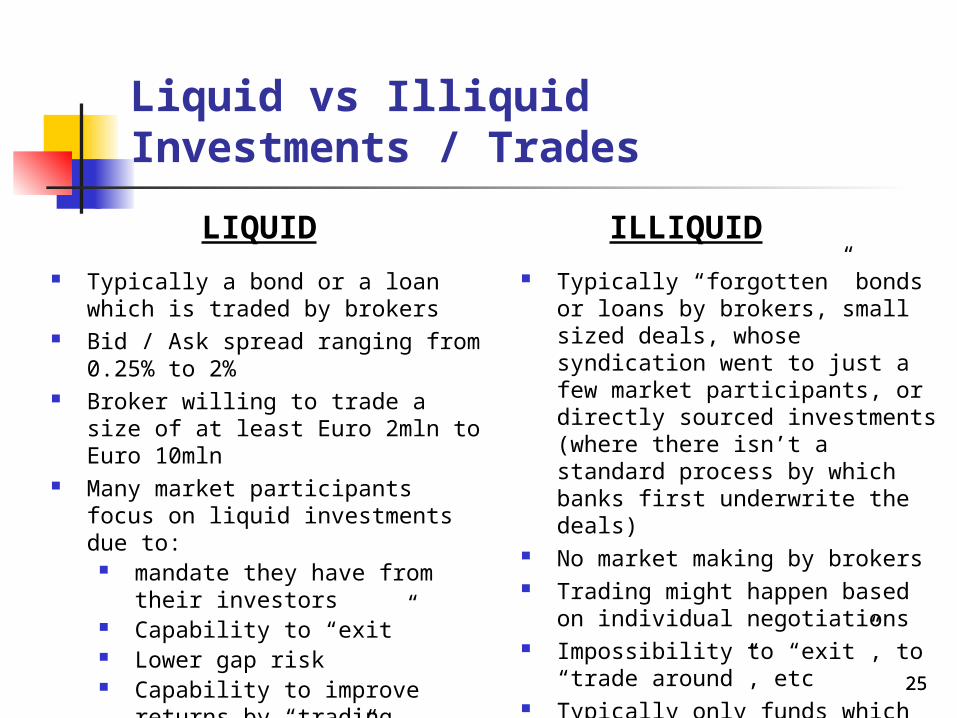
Liquid vs Illiquid Investments / Trades
Typically a bond or a loan which is traded by brokers
Bid / Ask spread ranging from 0.25% to 2%
Broker willing to trade a size of at least Euro 2mln to Euro 10mln
Many market participants focus on liquid investments due to:
mandate they have from their investors
Capability to “exit” Lower gap risk Capability to improve returns
by “trading around positions”, hence benefitting from volatility
Typically “forgotten” bonds or loans by brokers, small sized deals, whose syndication went to just a few market participants, or directly sourced investments (where there isn’t a standard process by which banks first underwrite the deals)
No market making by brokers Trading might happen based on
individual negotiations Impossibility to “exit”, to “trade
around”, etc Typically only funds which have a
lock-up period and who target a return premium for the illiquidity
LIQUID ILLIQUID
2525
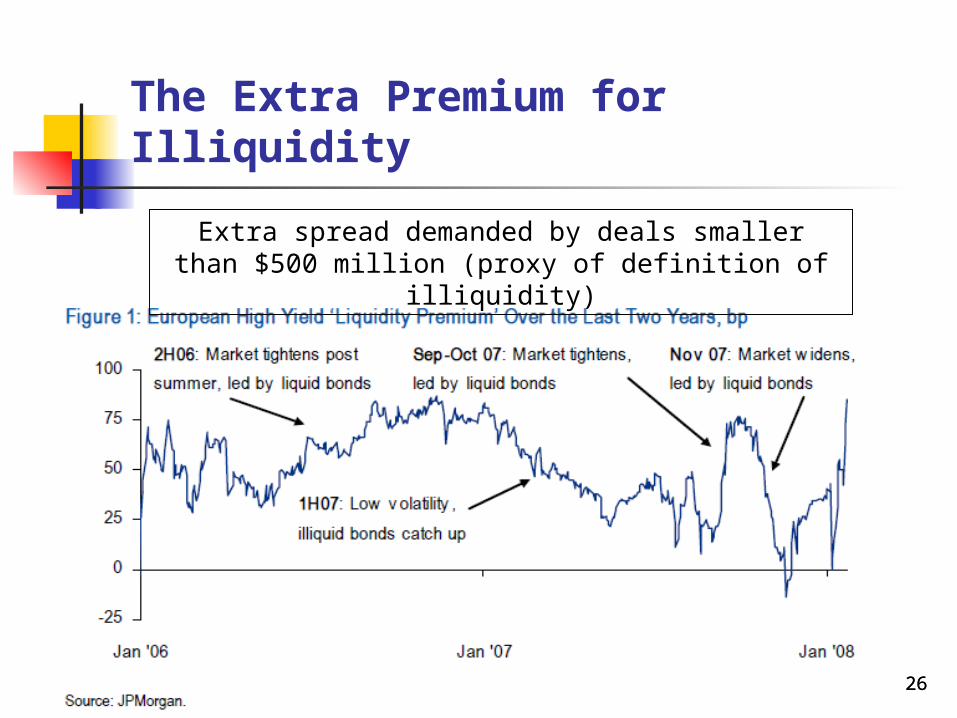
The Extra Premium for Illiquidity
Extra spread demanded by deals smaller than $500 million (proxy of definition of illiquidity)
2626
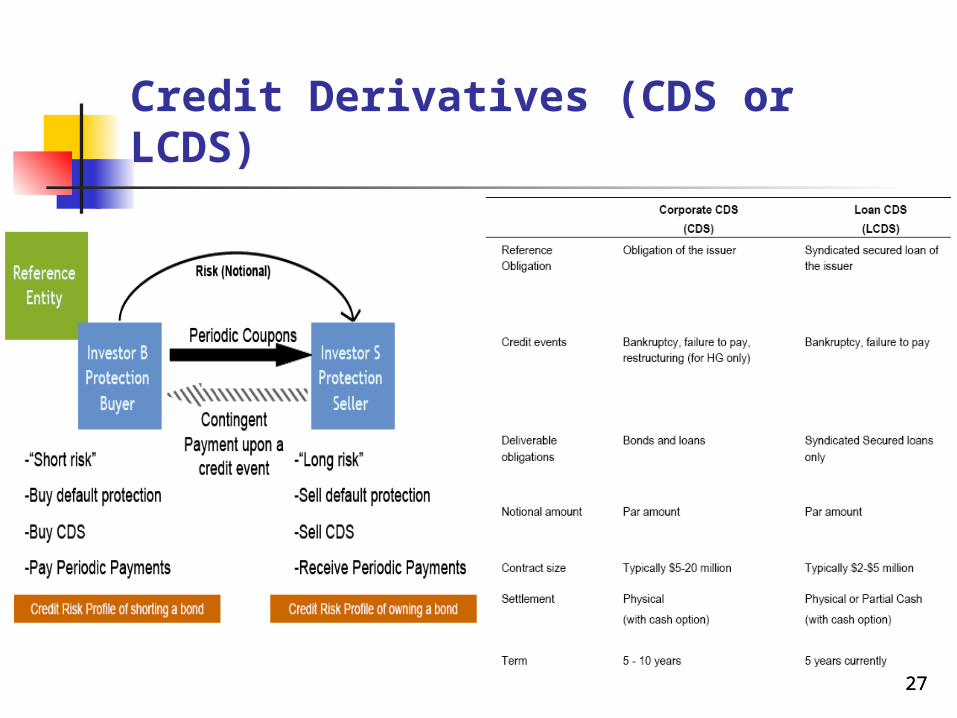
Credit Derivatives (CDS or LCDS)
2727
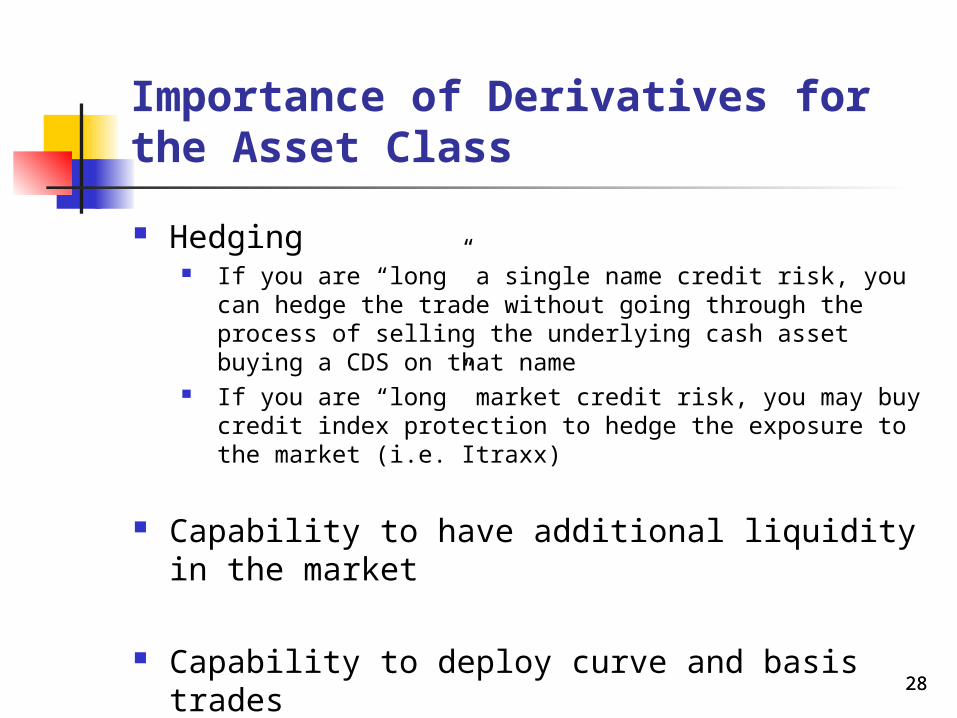
Importance of Derivatives for the Asset Class
Hedging If you are “long” a single name credit risk, you can hedge
the trade without going through the process of selling the underlying cash asset buying a CDS on that name
If you are “long” market credit risk, you may buy credit index protection to hedge the exposure to the market (i.e. Itraxx)
Capability to have additional liquidity in the market
Capability to deploy curve and basis trades relative value market neutral
2828
Invest in HY and Distress
Evolving Asset Class by the Day
2929
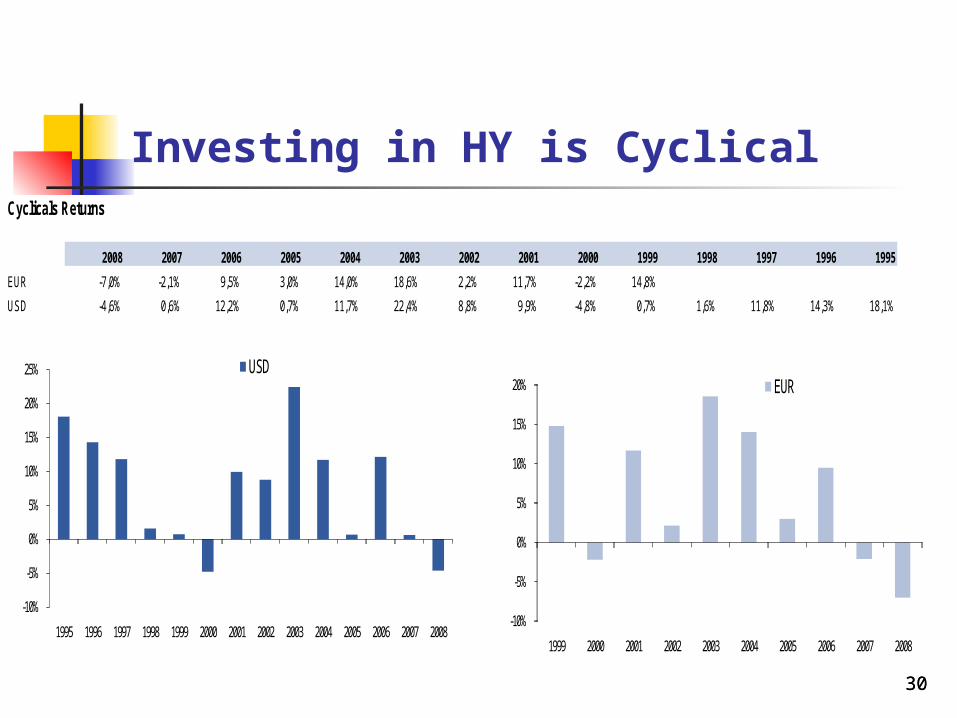
Investing in HY is CyclicalCyclicals Returns
2008 2007 2006 2005 2004 2003 2002 2001 2000 1999 1998 1997 1996 1995
EUR -7,0% -2,1% 9,5% 3,0% 14,0% 18,6% 2,2% 11,7% -2,2% 14,8%
USD -4,6% 0,6% 12,2% 0,7% 11,7% 22,4% 8,8% 9,9% -4,8% 0,7% 1,6% 11,8% 14,3% 18,1%
-10%
-5%
0%
5%
10%
15%
20%
25%
20082007200620052004200320022001200019991998199719961995
USD
-10%
-5%
0%
5%
10%
15%
20%
2008200720062005200420032002200120001999
EUR
3030
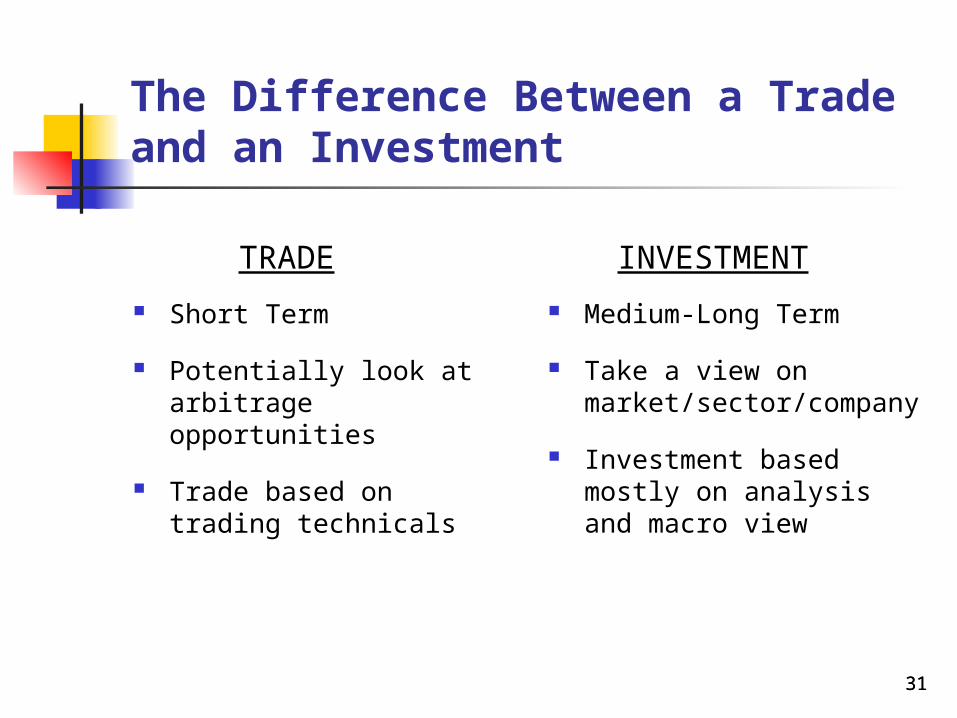
The Difference Between a Trade and an Investment
Short Term
Potentially look at arbitrage opportunities
Trade based on trading technicals
Medium-Long Term
Take a view on market/sector/company
Investment based mostly on analysis and macro view
TRADE INVESTMENT
3131
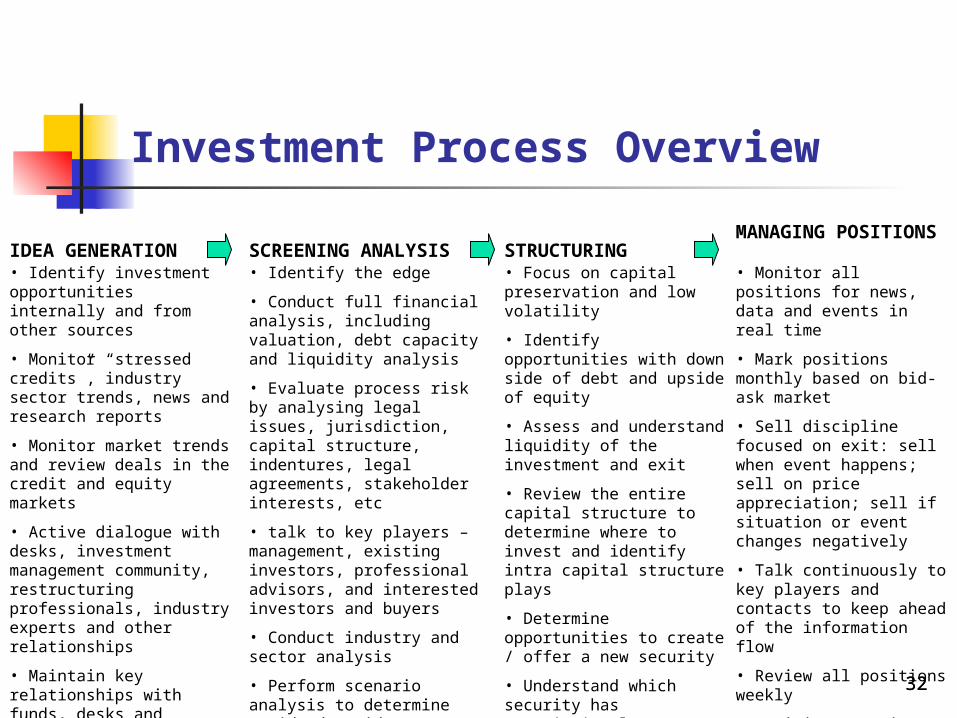
Investment Process Overview
• Identify investment opportunities internally and from other sources
• Monitor “stressed credits”, industry sector trends, news and research reports
• Monitor market trends and review deals in the credit and equity markets
• Active dialogue with desks, investment management community, restructuring professionals, industry experts and other relationships
• Maintain key relationships with funds, desks and professionals and industrial players
• Identify the edge
• Conduct full financial analysis, including valuation, debt capacity and liquidity analysis
• Evaluate process risk by analysing legal issues, jurisdiction, capital structure, indentures, legal agreements, stakeholder interests, etc
• talk to key players – management, existing investors, professional advisors, and interested investors and buyers
• Conduct industry and sector analysis
• Perform scenario analysis to determine upside/downside cases
• Identify events and timing to events
• Focus on capital preservation and low volatility
• Identify opportunities with down side of debt and upside of equity
• Assess and understand liquidity of the investment and exit
• Review the entire capital structure to determine where to invest and identify intra capital structure plays
• Determine opportunities to create / offer a new security
• Understand which security has negotiating leverage, and assess stakeholder interests
• Determine size, liquidity and overall fit with portfolio
• Monitor all positions for news, data and events in real time
• Mark positions monthly based on bid-ask market
• Sell discipline focused on exit: sell when event happens; sell on price appreciation; sell if situation or event changes negatively
• Talk continuously to key players and contacts to keep ahead of the information flow
• Review all positions weekly
• Revisit scenarios constantly
• Advisory panel input during portfolio review process
• Structure hedges
IDEA GENERATION SCREENING ANALYSIS
STRUCTURINGMANAGING POSITIONS
3232
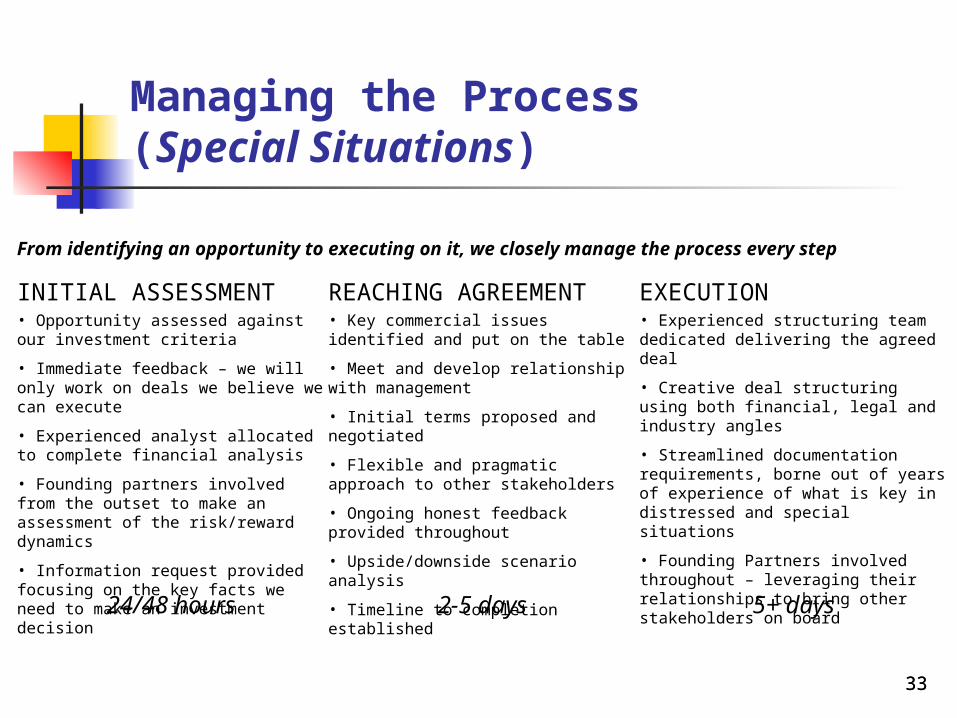
Managing the Process (Special Situations)
INITIAL ASSESSMENT• Opportunity assessed against our investment criteria
• Immediate feedback – we will only work on deals we believe we can execute
• Experienced analyst allocated to complete financial analysis
• Founding partners involved from the outset to make an assessment of the risk/reward dynamics
• Information request provided focusing on the key facts we need to make an investment decision
24/48 hours
REACHING AGREEMENT• Key commercial issues identified and put on the table
• Meet and develop relationship with management
• Initial terms proposed and negotiated
• Flexible and pragmatic approach to other stakeholders
• Ongoing honest feedback provided throughout
• Upside/downside scenario analysis
• Timeline to completion established2-5 days
EXECUTION• Experienced structuring team dedicated delivering the agreed deal
• Creative deal structuring using both financial, legal and industry angles
• Streamlined documentation requirements, borne out of years of experience of what is key in distressed and special situations
• Founding Partners involved throughout – leveraging their relationships to bring other stakeholders on board
5+ days
From identifying an opportunity to executing on it, we closely manage the process every step
3333
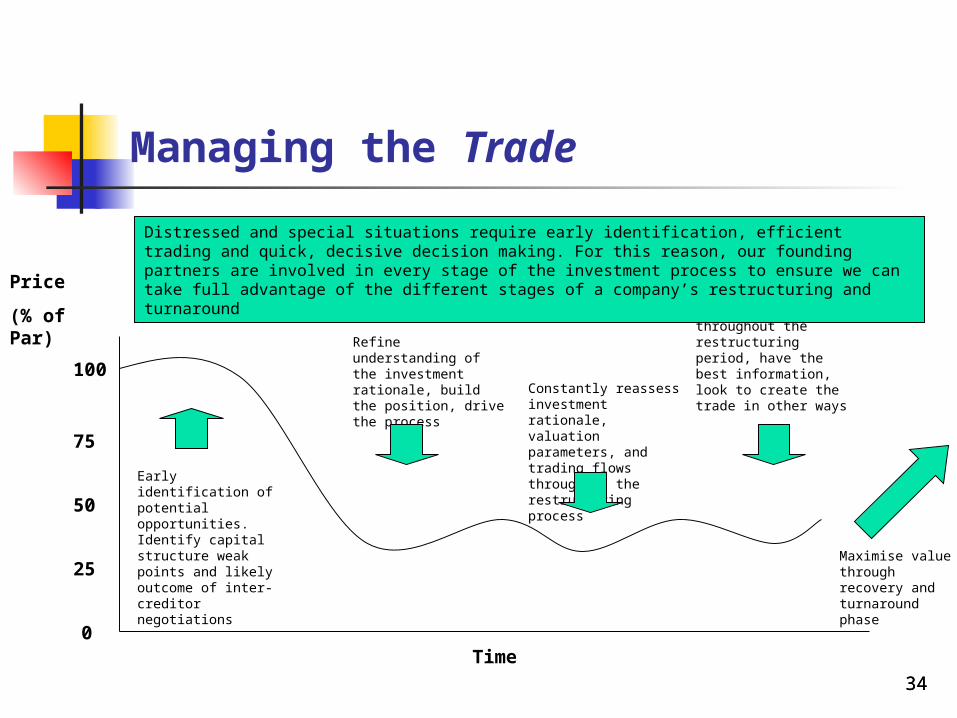
Managing the Trade
Price
(% of Par)
100
75
25
0
50
Time
Early identification of potential opportunities. Identify capital structure weak points and likely outcome of inter-creditor negotiations
Refine understanding of the investment rationale, build the position, drive the process
Constantly reassess investment rationale, valuation parameters, and trading flows throughout the restructuring process
Efficiently trade throughout the restructuring period, have the best information, look to create the trade in other ways
Maximise value through recovery and turnaround phase
Distressed and special situations require early identification, efficient trading and quick, decisive decision making. For this reason, our founding partners are involved in every stage of the investment process to ensure we can take full advantage of the different stages of a company’s restructuring and turnaround
3434
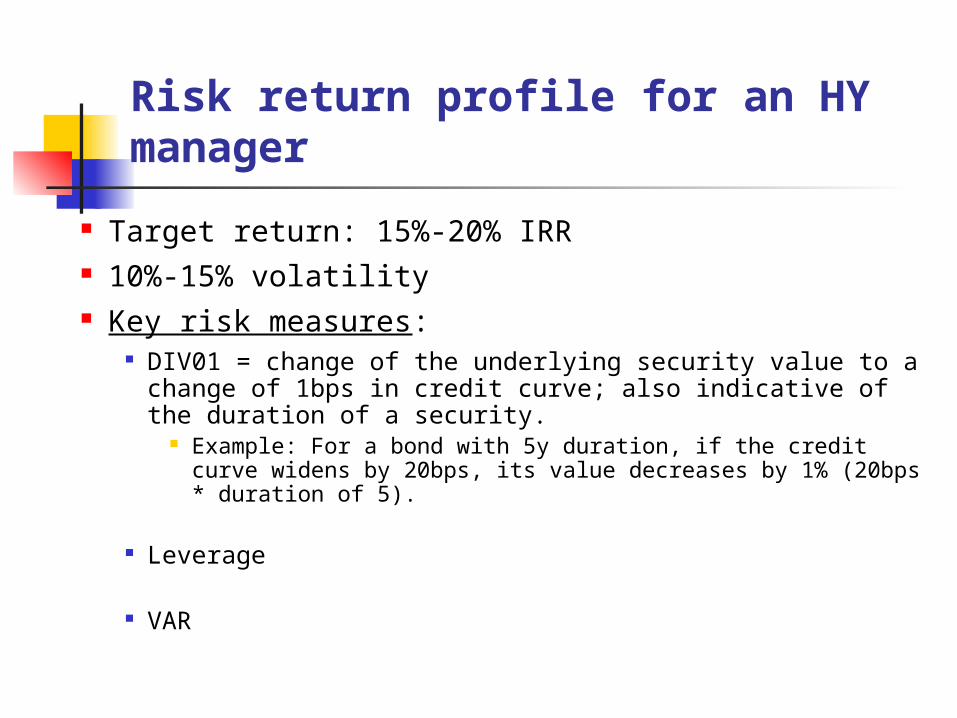
Risk return profile for an HY manager
Target return: 15%-20% IRR 10%-15% volatility Key risk measures:
DIV01 = change of the underlying security value to a change of 1bps in credit curve; also indicative of the duration of a security.
Example: For a bond with 5y duration, if the credit curve widens by 20bps, its value decreases by 1% (20bps * duration of 5).
Leverage
VAR
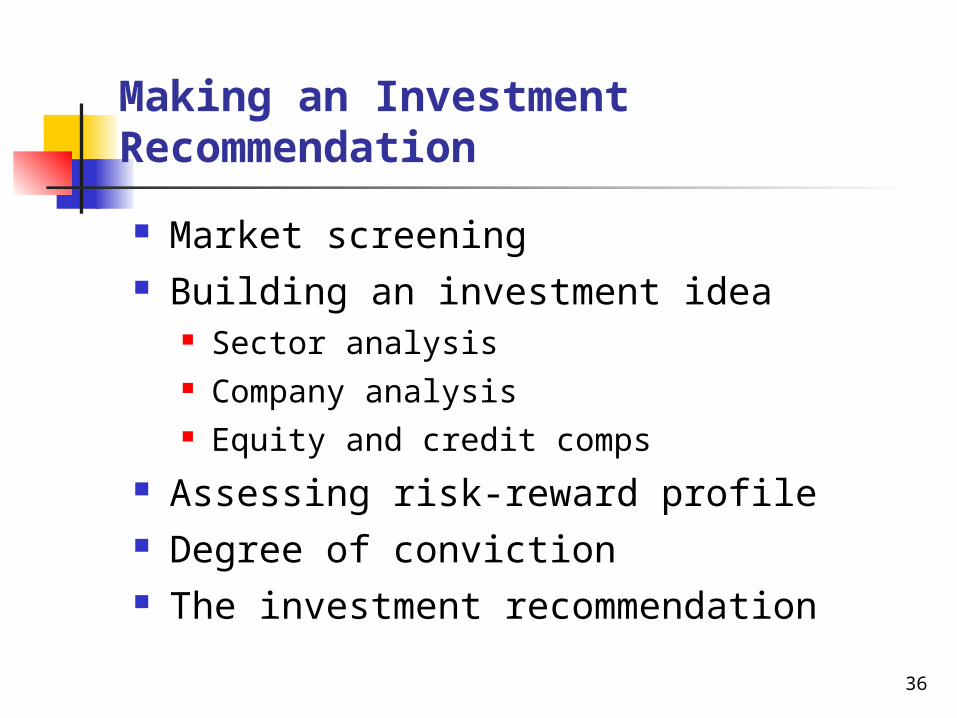
Making an Investment Recommendation
Market screening Building an investment idea
Sector analysis Company analysis Equity and credit comps
Assessing risk-reward profile Degree of conviction The investment recommendation
36
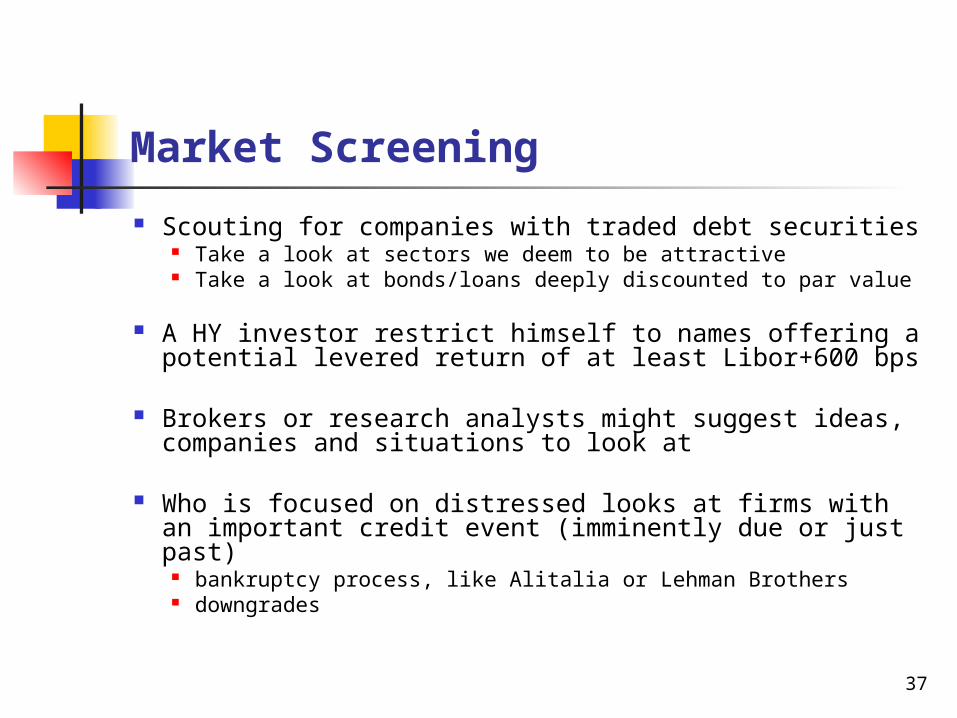
Market Screening
Scouting for companies with traded debt securities Take a look at sectors we deem to be attractive Take a look at bonds/loans deeply discounted to par value
A HY investor restrict himself to names offering a potential levered return of at least Libor+600 bps
Brokers or research analysts might suggest ideas, companies and situations to look at
Who is focused on distressed looks at firms with an important credit event (imminently due or just past)
bankruptcy process, like Alitalia or Lehman Brothers downgrades
37
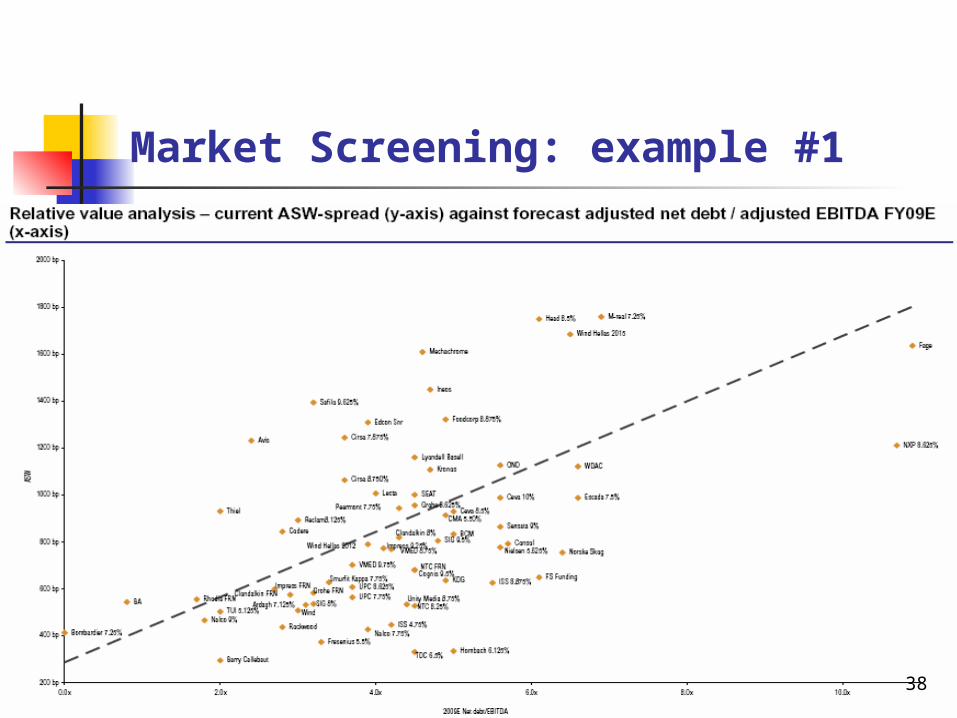
Market Screening: example #1
38
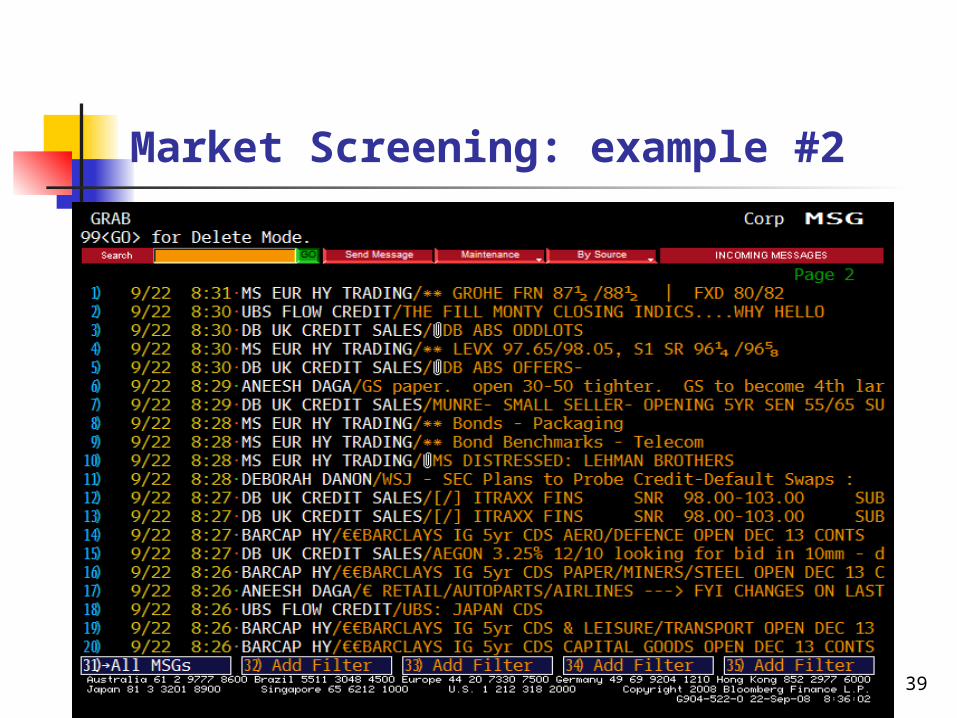
Market Screening: example #2
39
Building an Investment Idea
Choose the right sector
Choose a company with a very good management team in that sector
Pick cheap debt securities of that company in relative value terms
40
(1) Sector Analysis Most of our actual return on capital depends on the sector we invest
in
A deep understanding of all the challenges faced by the companies in the sector are facing is then of paramount importance
e.g. raw material price increases, price pressure, intense competition,…
To gain an educated view on the company sector condition and outlook
look at the competitors/peers in terms of their operating and financial stats (sales growth, EBITDA margin, leverage, cashflow conversion, etc)
when a listed competitor / peer reports its quarterly numbers, we might find a lot of information from its reports and subsequent brokers’ analysis
In the current context (recession) we favor sectors like utilities, telecom, healthcare, aerospace, niche
technologies (“defensive” sectors, uncorrelated with economic cycles) avoid retail, fashion and luxury, financials, automotive and related,
airlines, consumer goods (“cyclical” sector, highly correlated with the economic environment) 41
(2) Company Analysis
Review of Financial accounts (annual reports, quarterly financials statements) Sell side research (equity and credit analyst research)
Interviews to suppliers, customers, peers, etc.
Aim to gain a deep knowledge of: firm’s business model and business plan firm’s financial structure firm’s traded debt securities or loans
The end product is an excel-based output, including a granular operating and financial model of the company
42
(3) Equity and Credit Comps
Need to understand if the debt securities we are considering investing in are “cheap” or “expensive” - compared to the securities of other companies in the same sector or with similar leverage
Especially true if we are trying to deploy a relative value investment strategy to isolate the “ALFA”
One of the key features to make money over time is to invest in cheap securities
Often we find better investment opportunities (better risk/reward and better companies) in comps/peers we look at
By analyzing comps’ securities as well, we might find a better way to express our views by combining together various trades
43
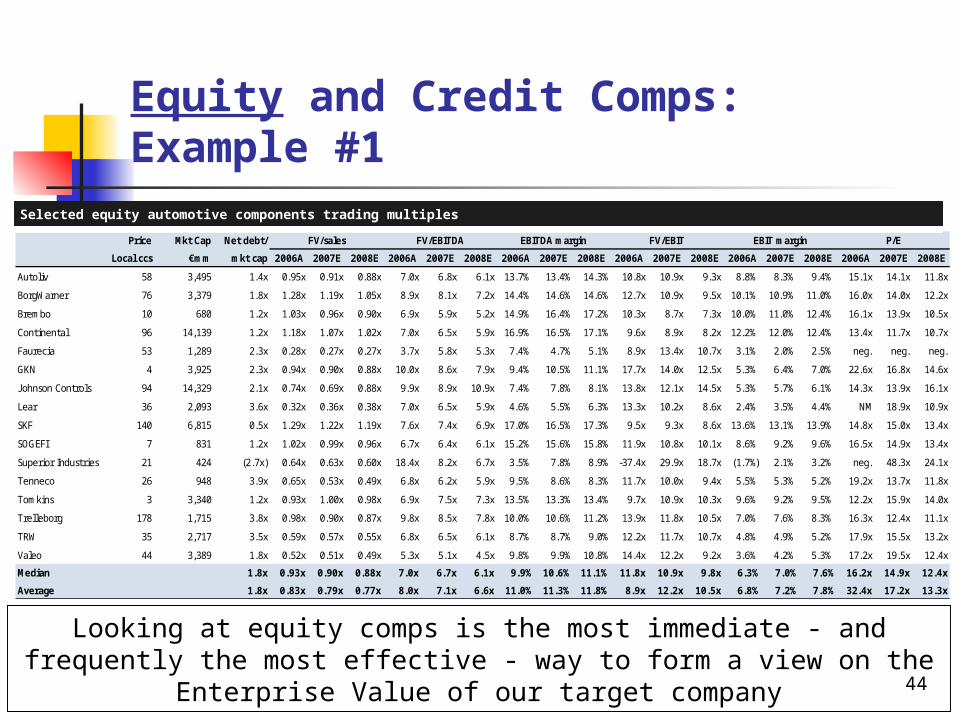
Equity and Credit Comps: Example #1
Price Mkt Cap Net debt/ FV/sales FV/EBITDA EBITDA margin FV/EBIT EBIT margin P/E
Local ccs €mm mkt cap 2006A 2007E 2008E 2006A 2007E 2008E 2006A 2007E 2008E 2006A 2007E 2008E 2006A 2007E 2008E 2006A 2007E 2008E
Autoliv 58 3,495 1.4x 0.95x 0.91x 0.88x 7.0x 6.8x 6.1x 13.7% 13.4% 14.3% 10.8x 10.9x 9.3x 8.8% 8.3% 9.4% 15.1x 14.1x 11.8x
BorgWarner 76 3,379 1.8x 1.28x 1.19x 1.05x 8.9x 8.1x 7.2x 14.4% 14.6% 14.6% 12.7x 10.9x 9.5x 10.1% 10.9% 11.0% 16.0x 14.0x 12.2x
Brembo 10 680 1.2x 1.03x 0.96x 0.90x 6.9x 5.9x 5.2x 14.9% 16.4% 17.2% 10.3x 8.7x 7.3x 10.0% 11.0% 12.4% 16.1x 13.9x 10.5x
Continental 96 14,139 1.2x 1.18x 1.07x 1.02x 7.0x 6.5x 5.9x 16.9% 16.5% 17.1% 9.6x 8.9x 8.2x 12.2% 12.0% 12.4% 13.4x 11.7x 10.7x
Faurecia 53 1,289 2.3x 0.28x 0.27x 0.27x 3.7x 5.8x 5.3x 7.4% 4.7% 5.1% 8.9x 13.4x 10.7x 3.1% 2.0% 2.5% neg. neg. neg.
GKN 4 3,925 2.3x 0.94x 0.90x 0.88x 10.0x 8.6x 7.9x 9.4% 10.5% 11.1% 17.7x 14.0x 12.5x 5.3% 6.4% 7.0% 22.6x 16.8x 14.6x
J ohnson Controls 94 14,329 2.1x 0.74x 0.69x 0.88x 9.9x 8.9x 10.9x 7.4% 7.8% 8.1% 13.8x 12.1x 14.5x 5.3% 5.7% 6.1% 14.3x 13.9x 16.1x
Lear 36 2,093 3.6x 0.32x 0.36x 0.38x 7.0x 6.5x 5.9x 4.6% 5.5% 6.3% 13.3x 10.2x 8.6x 2.4% 3.5% 4.4% NM 18.9x 10.9x
SKF 140 6,815 0.5x 1.29x 1.22x 1.19x 7.6x 7.4x 6.9x 17.0% 16.5% 17.3% 9.5x 9.3x 8.6x 13.6% 13.1% 13.9% 14.8x 15.0x 13.4x
SOGEFI 7 831 1.2x 1.02x 0.99x 0.96x 6.7x 6.4x 6.1x 15.2% 15.6% 15.8% 11.9x 10.8x 10.1x 8.6% 9.2% 9.6% 16.5x 14.9x 13.4x
Superior Industries 21 424 (2.7x) 0.64x 0.63x 0.60x 18.4x 8.2x 6.7x 3.5% 7.8% 8.9% -37.4x 29.9x 18.7x (1.7%) 2.1% 3.2% neg. 48.3x 24.1x
Tenneco 26 948 3.9x 0.65x 0.53x 0.49x 6.8x 6.2x 5.9x 9.5% 8.6% 8.3% 11.7x 10.0x 9.4x 5.5% 5.3% 5.2% 19.2x 13.7x 11.8x
Tomkins 3 3,340 1.2x 0.93x 1.00x 0.98x 6.9x 7.5x 7.3x 13.5% 13.3% 13.4% 9.7x 10.9x 10.3x 9.6% 9.2% 9.5% 12.2x 15.9x 14.0x
Trelleborg 178 1,715 3.8x 0.98x 0.90x 0.87x 9.8x 8.5x 7.8x 10.0% 10.6% 11.2% 13.9x 11.8x 10.5x 7.0% 7.6% 8.3% 16.3x 12.4x 11.1x
TRW 35 2,717 3.5x 0.59x 0.57x 0.55x 6.8x 6.5x 6.1x 8.7% 8.7% 9.0% 12.2x 11.7x 10.7x 4.8% 4.9% 5.2% 17.9x 15.5x 13.2x
Valeo 44 3,389 1.8x 0.52x 0.51x 0.49x 5.3x 5.1x 4.5x 9.8% 9.9% 10.8% 14.4x 12.2x 9.2x 3.6% 4.2% 5.3% 17.2x 19.5x 12.4x
Median 1.8x 0.93x 0.90x 0.88x 7.0x 6.7x 6.1x 9.9% 10.6% 11.1% 11.8x 10.9x 9.8x 6.3% 7.0% 7.6% 16.2x 14.9x 12.4x
Average 1.8x 0.83x 0.79x 0.77x 8.0x 7.1x 6.6x 11.0% 11.3% 11.8% 8.9x 12.2x 10.5x 6.8% 7.2% 7.8% 32.4x 17.2x 13.3x
Selected equity automotive components trading multiplesSelected equity automotive components trading multiples
44
Looking at equity comps is the most immediate - and frequently the most effective - way to form a view on the Enterprise Value of our
target company
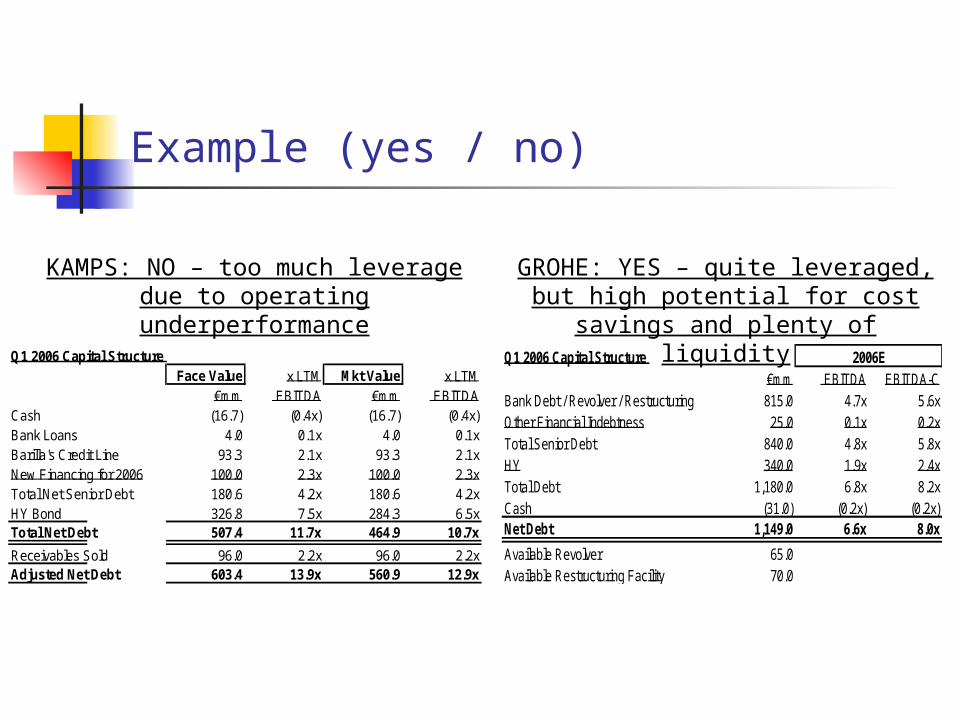
Example (yes / no)
Q1 2006 Capital Structure Face Value x LTM Mkt Value x LTM
€mm EBITDA €mm EBITDACash (16.7) (0.4x) (16.7) (0.4x)Bank Loans 4.0 0.1x 4.0 0.1xBarilla's Credit Line 93.3 2.1x 93.3 2.1xNew Financing for 2006 100.0 2.3x 100.0 2.3xTotal Net Senior Debt 180.6 4.2x 180.6 4.2xHY Bond 326.8 7.5x 284.3 6.5xTotal Net Debt 507.4 11.7x 464.9 10.7x
Receivables Sold 96.0 2.2x 96.0 2.2xAdjusted Net Debt 603.4 13.9x 560.9 12.9x
KAMPS: NO – too much leverage due to operating
underperformance
GROHE: YES – quite leveraged, but high potential for cost savings and
plenty of liquidityQ1 2006 Capital Structure 2006E
€mm EBITDA EBITDA-CBank Debt / Revolver / Restructuring 815.0 4.7x 5.6xOther Financial Indebtness 25.0 0.1x 0.2xTotal Senior Debt 840.0 4.8x 5.8xHY 340.0 1.9x 2.4xTotal Debt 1,180.0 6.8x 8.2xCash (31.0) (0.2x) (0.2x)Net Debt 1,149.0 6.6x 8.0x
Available Revolver 65.0Available Restructuring Facility 70.0
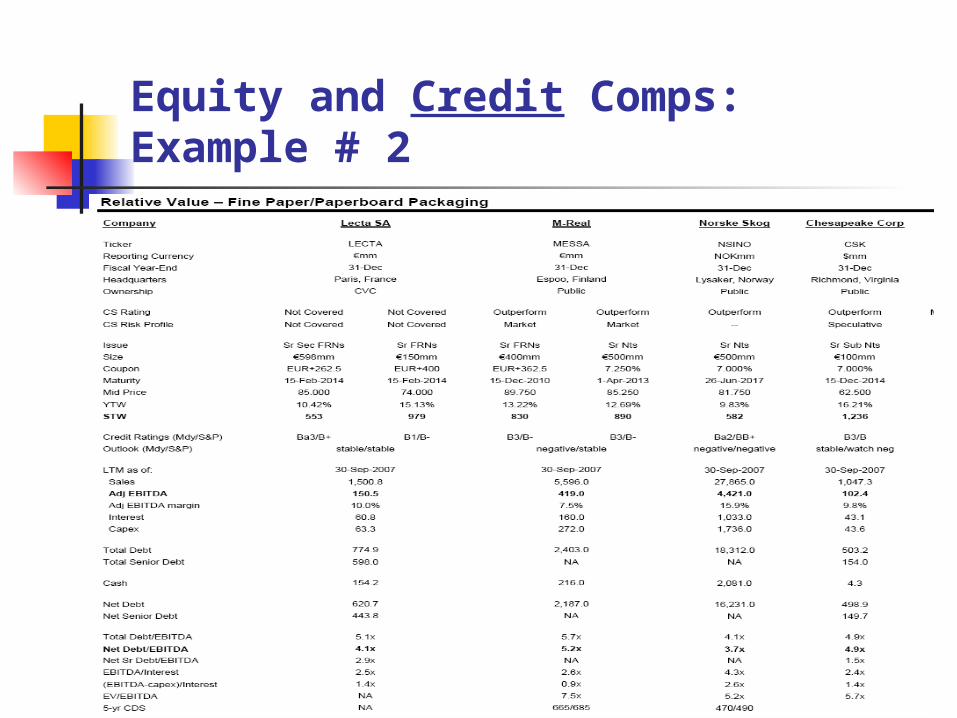
Equity and Credit Comps: Example # 2
46
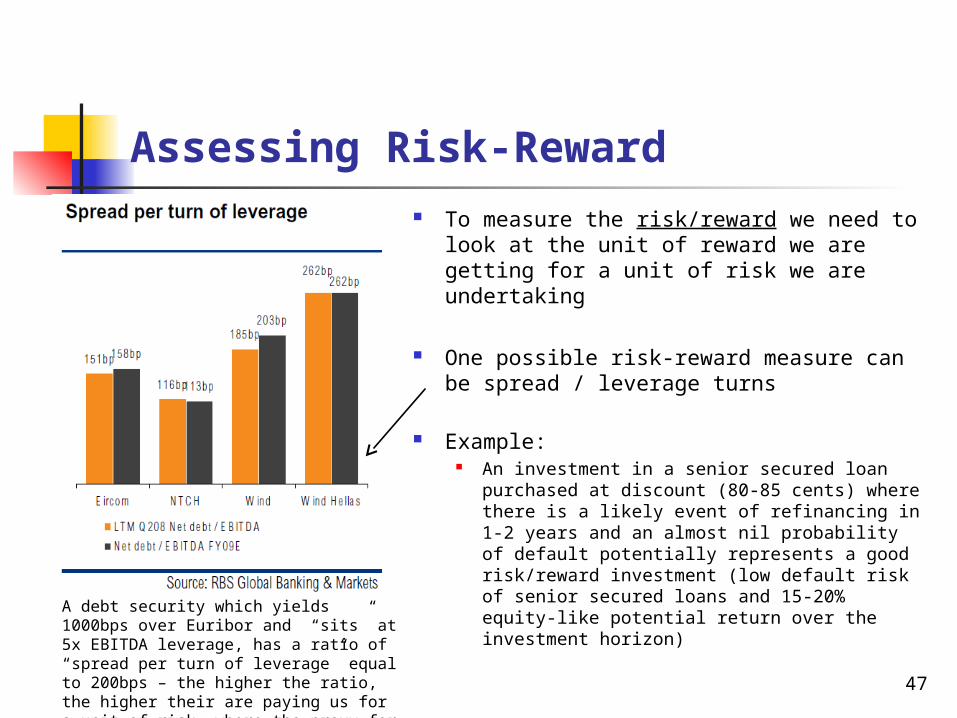
Assessing Risk-Reward To measure the risk/reward we need to
look at the unit of reward we are getting for a unit of risk we are undertaking
One possible risk-reward measure can be spread / leverage turns
Example: An investment in a senior secured loan
purchased at discount (80-85 cents) where there is a likely event of refinancing in 1-2 years and an almost nil probability of default potentially represents a good risk/reward investment (low default risk of senior secured loans and 15-20% equity-like potential return over the investment horizon)
47
A debt security which yields 1000bps over Euribor and “sits” at 5x EBITDA leverage, has a ratio of “spread per turn of leverage” equal to 200bps – the higher the ratio, the higher their are paying us for a unit of risk, where the proxy for the unit of risk is the EBITDA leverage
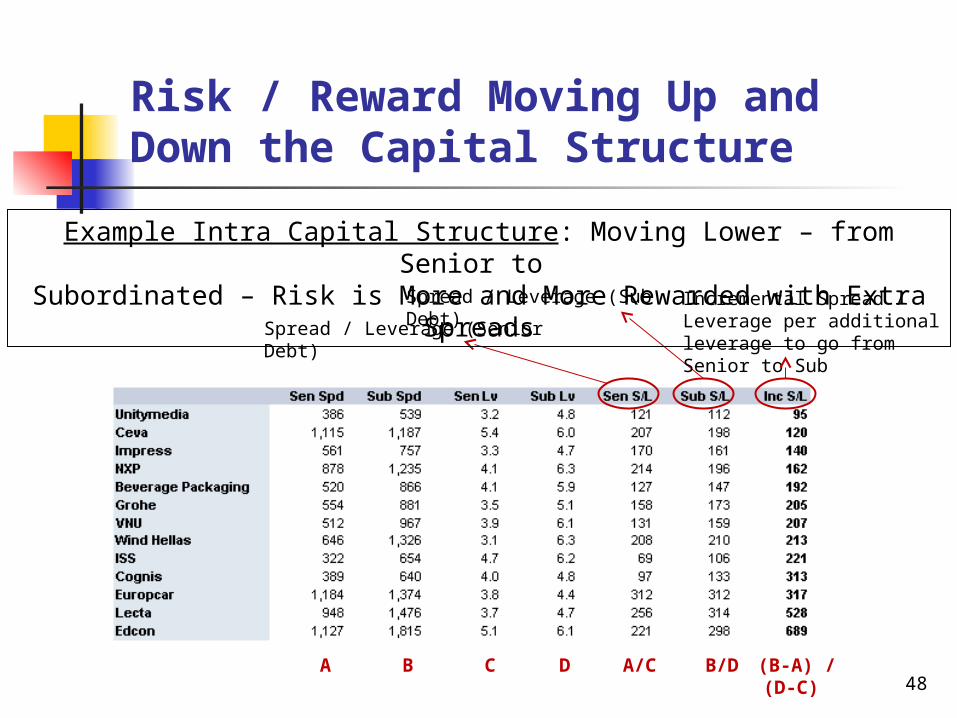
Risk / Reward Moving Up and Down the Capital Structure
Spread / Leverage (Senior Debt)
Spread / Leverage (Sub Debt)Incremental Spread / Leverage per additional leverage to go from Senior to Sub
A B C D A/C B/D (B-A) / (D-C) 48
Example Intra Capital Structure: Moving Lower – from Senior to Subordinated – Risk is More and More Rewarded with Extra Spreads
Degree of Conviction
The degree of conviction represents how comfortable we are in the numbers and in the judgment calls at the basis of our analysis
Having a high degree of conviction in high yield and distress investing is of paramount importance since the loss can be huge Exit may be difficult
49
Degree of Conviction: Examples
50
Situations where we might have a high degree of conviction:
We have been studying the company for a long time and we have had the chance to verify that our financial model works well in terms of forecasting
We have a good relationship with the CEO or CFO of the target company and we feel we have a better understanding of their body language
We know the sector well because we have been investing in it for a long time
We have already invested in the company
Situations where we might NOT have a high degree of conviction:
It is the first time we are looking at the sector of our target company We have little historical financial information on the target company Earnings have historically proven to be very volatile The sector is going through a transformational period
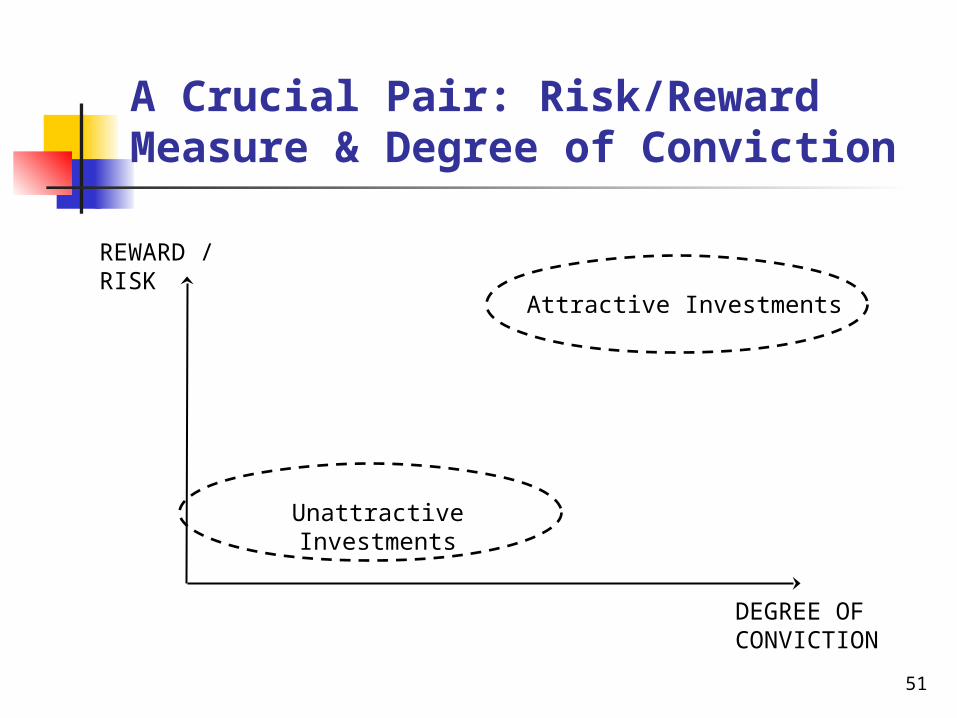
A Crucial Pair: Risk/Reward Measure & Degree of Conviction
REWARD / RISK
Attractive Investments
Unattractive Investments
DEGREE OF CONVICTION
51
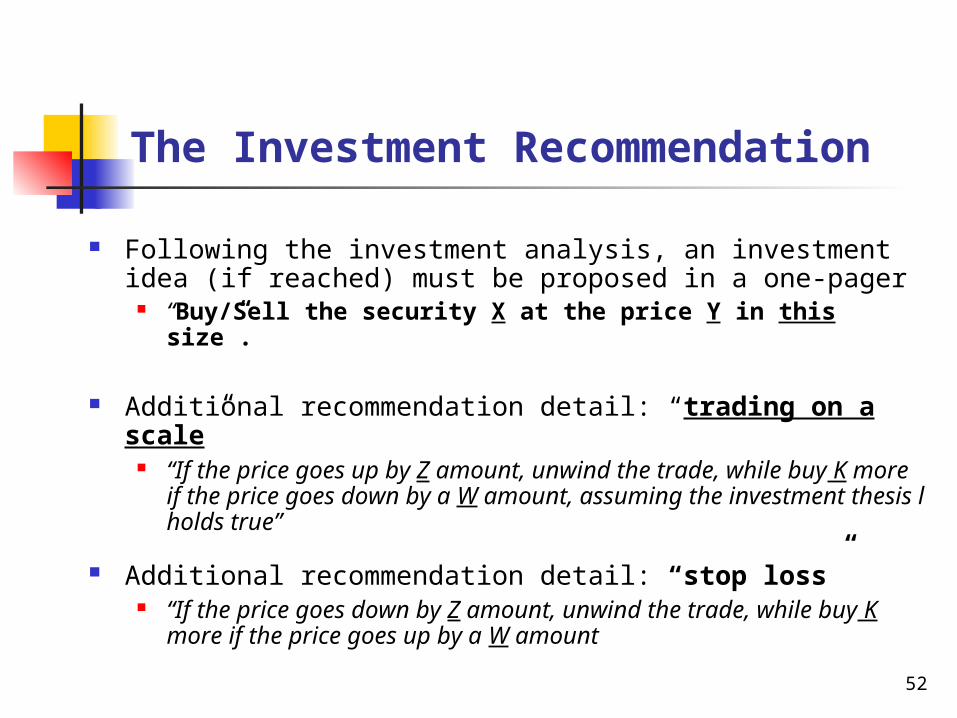
The Investment Recommendation
Following the investment analysis, an investment idea (if reached) must be proposed in a one-pager
“Buy/Sell the security X at the price Y in this size”.
Additional recommendation detail: “trading on a scale” “If the price goes up by Z amount, unwind the trade, while buy
K more if the price goes down by a W amount, assuming the investment thesis l holds true”
Additional recommendation detail: “stop loss” “If the price goes down by Z amount, unwind the trade, while
buy K more if the price goes up by a W amount
52
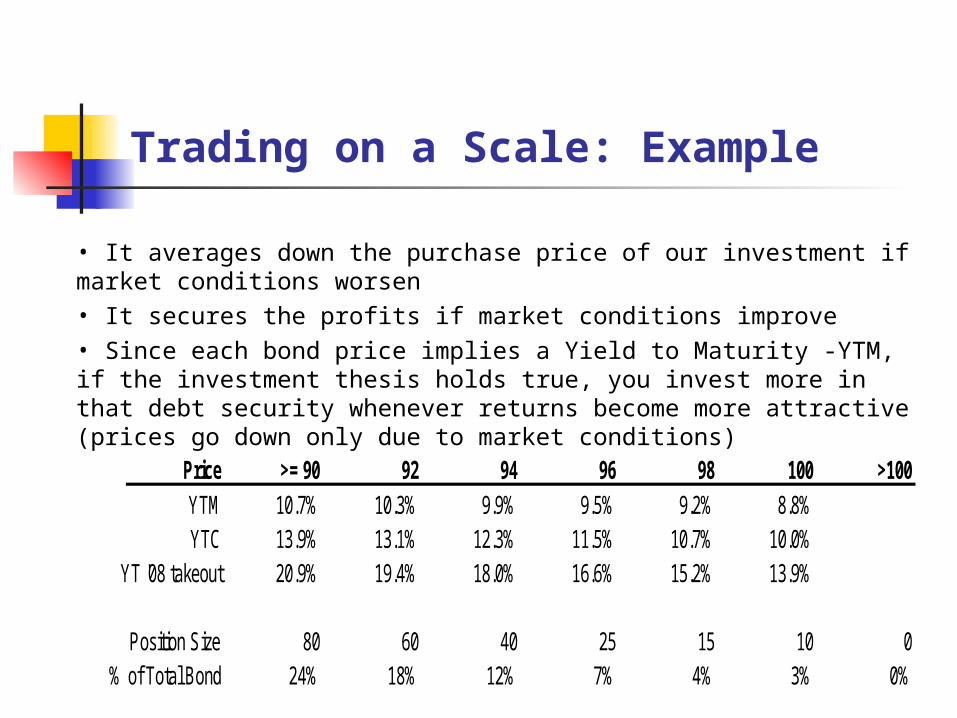
Trading on a Scale: Example
Price >= 90 92 94 96 98 100 >100YTM 10.7% 10.3% 9.9% 9.5% 9.2% 8.8%YTC 13.9% 13.1% 12.3% 11.5% 10.7% 10.0%
YT '08 takeout 20.9% 19.4% 18.0% 16.6% 15.2% 13.9%
Position Size 80 60 40 25 15 10 0% of Total Bond 24% 18% 12% 7% 4% 3% 0%
• It averages down the purchase price of our investment if market conditions worsen• It secures the profits if market conditions improve• Since each bond price implies a Yield to Maturity -YTM, if the investment thesis holds true, you invest more in that debt security whenever returns become more attractive (prices go down only due to market conditions)
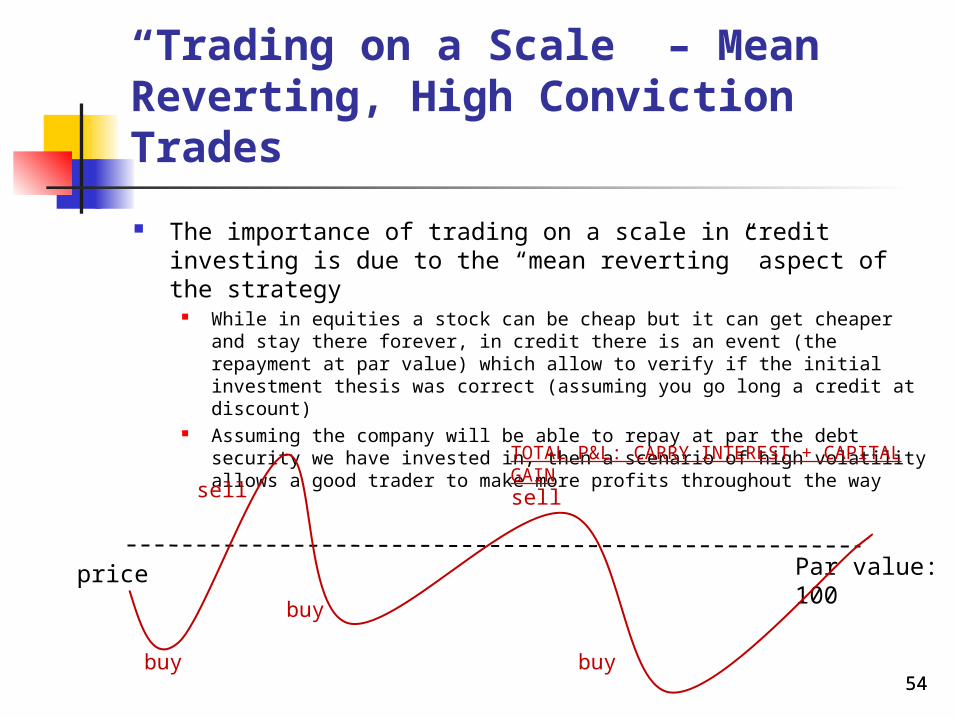
“Trading on a Scale” – Mean Reverting, High Conviction Trades
The importance of trading on a scale in credit investing is due to the “mean reverting” aspect of the strategy
While in equities a stock can be cheap but it can get cheaper and stay there forever, in credit there is an event (the repayment at par value) which allow to verify if the initial investment thesis was correct (assuming you go long a credit at discount)
Assuming the company will be able to repay at par the debt security we have invested in, then a scenario of high volatility allows a good trader to make more profits throughout the way
Par value: 100price
buy
sell
buy
sell
buy
TOTAL P&L: CARRY INTEREST + CAPITAL GAIN
5454
Strategies and Trading Technicals
The Devil is in the Detail
5555
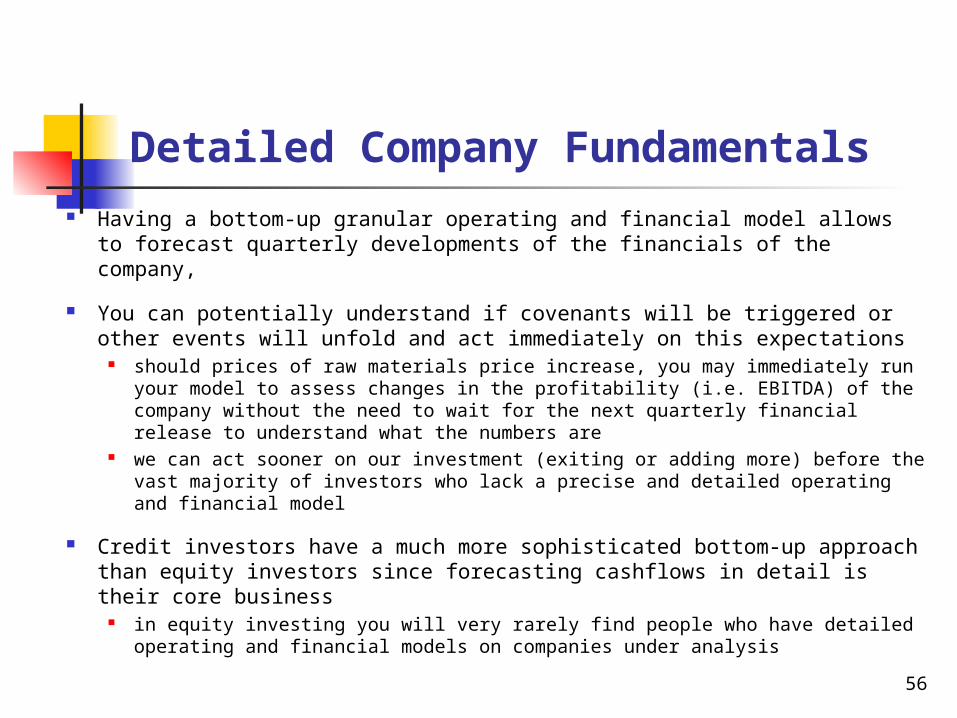
Detailed Company Fundamentals Having a bottom-up granular operating and financial model allows to
forecast quarterly developments of the financials of the company,
You can potentially understand if covenants will be triggered or other events will unfold and act immediately on this expectations
should prices of raw materials price increase, you may immediately run your model to assess changes in the profitability (i.e. EBITDA) of the company without the need to wait for the next quarterly financial release to understand what the numbers are
we can act sooner on our investment (exiting or adding more) before the vast majority of investors who lack a precise and detailed operating and financial model
Credit investors have a much more sophisticated bottom-up approach than equity investors since forecasting cashflows in detail is their core business
in equity investing you will very rarely find people who have detailed operating and financial models on companies under analysis
56
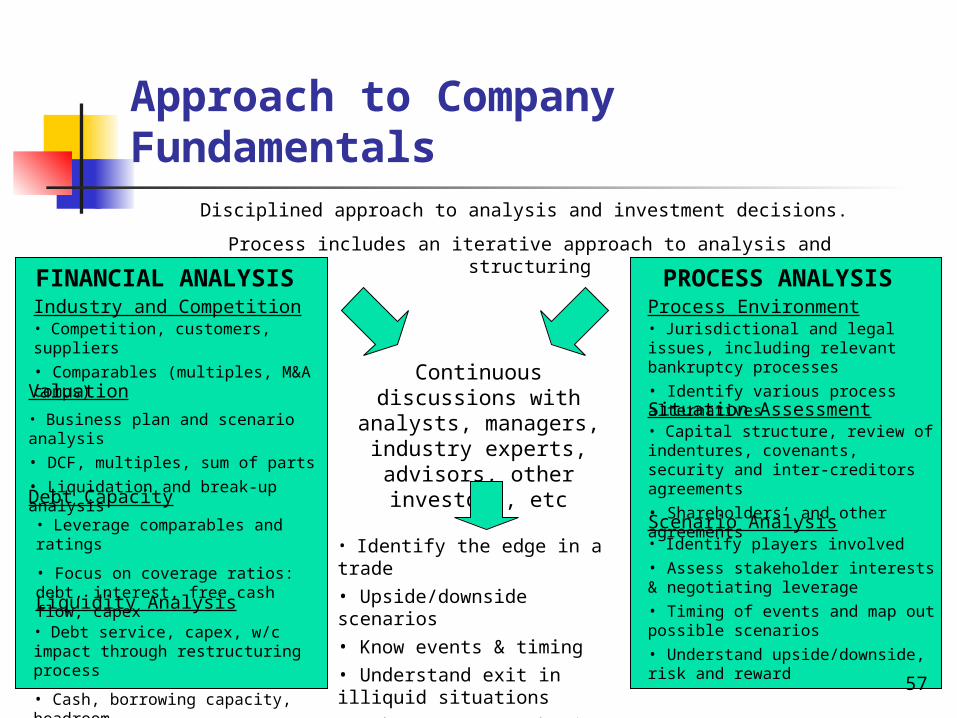
Approach to Company Fundamentals
FINANCIAL ANALYSISIndustry and Competition
• Competition, customers, suppliers
• Comparables (multiples, M&A comps)Valuation• Business plan and scenario analysis
• DCF, multiples, sum of parts
• Liquidation and break-up analysis
Debt Capacity• Leverage comparables and ratings
• Focus on coverage ratios: debt, interest, free cash flow, capex
Liquidity Analysis
• Debt service, capex, w/c impact through restructuring process
• Cash, borrowing capacity, headroom
PROCESS ANALYSISProcess Environment• Jurisdictional and legal issues, including relevant bankruptcy processes
• Identify various process alternativesSituation Assessment• Capital structure, review of indentures, covenants, security and inter-creditors agreements
• Shareholders’ and other agreementsScenario Analysis• Identify players involved
• Assess stakeholder interests & negotiating leverage
• Timing of events and map out possible scenarios
• Understand upside/downside, risk and reward
Disciplined approach to analysis and investment decisions.
Process includes an iterative approach to analysis and structuring
Continuous discussions with analysts,
managers, industry experts, advisors, other
investors, etc
• Identify the edge in a trade
• Upside/downside scenarios
• Know events & timing
• Understand exit in illiquid situations
• Take process or business risk
(not both)
57
58
Company Fundamentals: Example I/IV
[SEE ATTACHMENT]
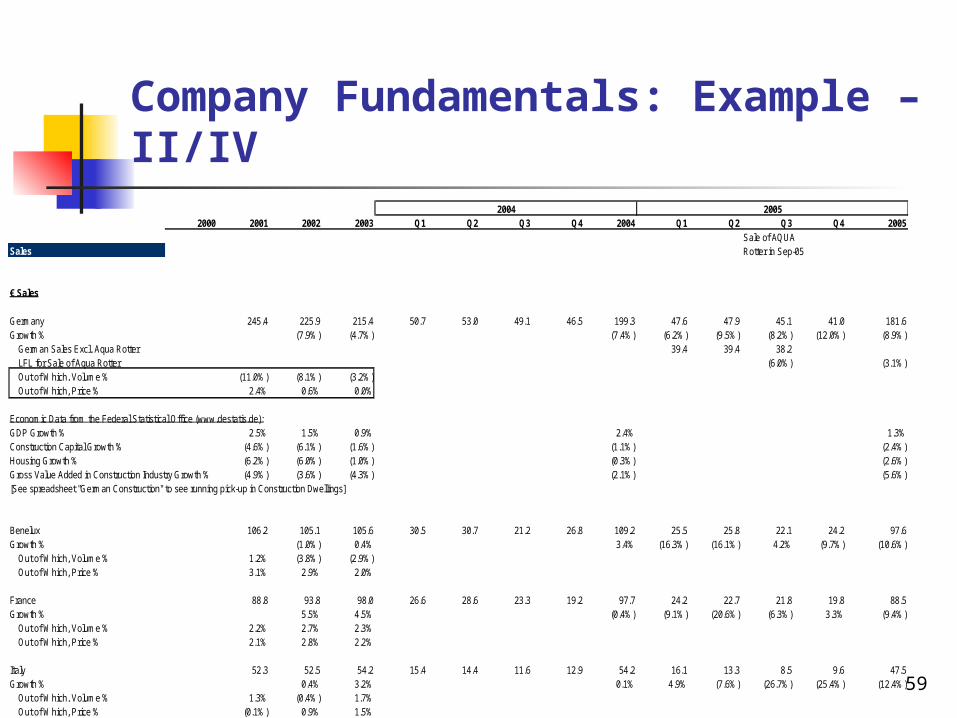
Company Fundamentals: Example – II/IV
59
2004 20052000 2001 2002 2003 Q1 Q2 Q3 Q4 2004 Q1 Q2 Q3 Q4 2005
Sale of AQUASales Rotter in Sep-05
€ Sales
Germany 245.4 225.9 215.4 50.7 53.0 49.1 46.5 199.3 47.6 47.9 45.1 41.0 181.6Growth % (7.9%) (4.7%) (7.4%) (6.2%) (9.5%) (8.2%) (12.0%) (8.9%)
German Sales Excl. Aqua Rotter 39.4 39.4 38.2LFL for Sale of Aqua Rotter (6.0%) (3.1%)Out of Which, Volume % (11.0%) (8.1%) (3.2%)Out of Which, Price % 2.4% 0.6% 0.0%
Economic Data from the Federal Statistical Office (www.destatis.de):GDP Growth % 2.5% 1.5% 0.9% 2.4% 1.3%Construction Capital Growth % (4.6%) (6.1%) (1.6%) (1.1%) (2.4%)Housing Growth % (6.2%) (6.0%) (1.0%) (0.3%) (2.6%)Gross Value Added in Construction Industry Growth % (4.9%) (3.6%) (4.3%) (2.1%) (5.6%)[See spreadsheet "German Construction" to see running pick-up in Construction Dwellings]
Benelux 106.2 105.1 105.6 30.5 30.7 21.2 26.8 109.2 25.5 25.8 22.1 24.2 97.6Growth % (1.0%) 0.4% 3.4% (16.3%) (16.1%) 4.2% (9.7%) (10.6%)
Out of Which, Volume % 1.2% (3.8%) (2.9%)Out of Which, Price % 3.1% 2.9% 2.0%
France 88.8 93.8 98.0 26.6 28.6 23.3 19.2 97.7 24.2 22.7 21.8 19.8 88.5Growth % 5.5% 4.5% (0.4%) (9.1%) (20.6%) (6.3%) 3.3% (9.4%)
Out of Which, Volume % 2.2% 2.7% 2.3%Out of Which, Price % 2.1% 2.8% 2.2%
Italy 52.3 52.5 54.2 15.4 14.4 11.6 12.9 54.2 16.1 13.3 8.5 9.6 47.5Growth % 0.4% 3.2% 0.1% 4.9% (7.6%) (26.7%) (25.4%) (12.4%)
Out of Which, Volume % 1.3% (0.4%) 1.7%Out of Which, Price % (0.1%) 0.9% 1.5%
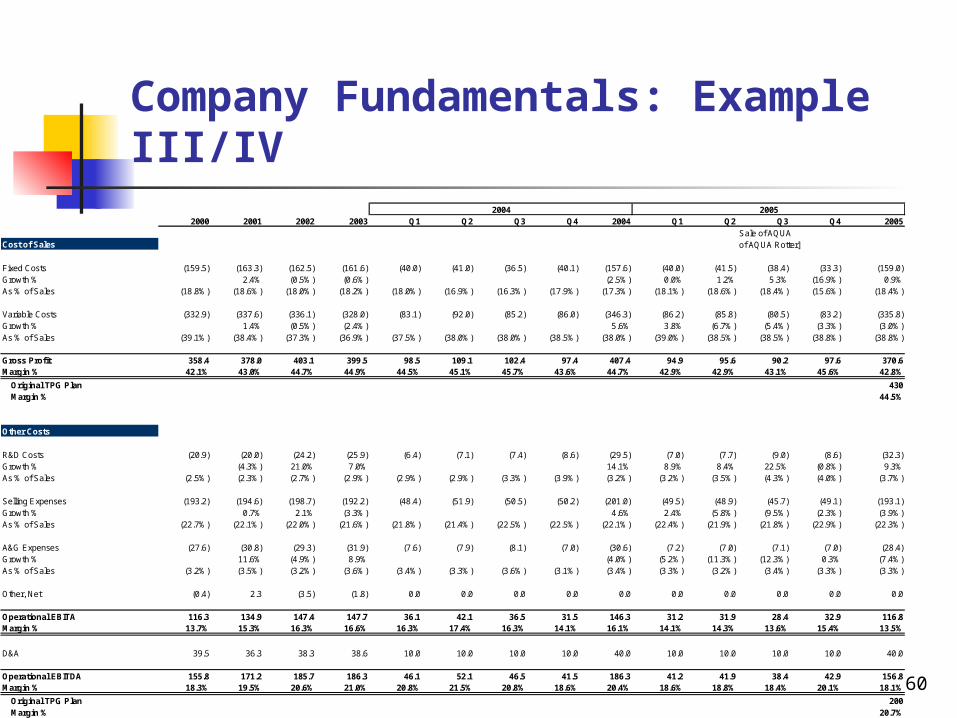
Company Fundamentals: Example III/IV
60
2004 20052000 2001 2002 2003 Q1 Q2 Q3 Q4 2004 Q1 Q2 Q3 Q4 2005
Sale of AQUACost of Sales of AQUA Rotter]
Fixed Costs (159.5) (163.3) (162.5) (161.6) (40.0) (41.0) (36.5) (40.1) (157.6) (40.0) (41.5) (38.4) (33.3) (159.0)Growth % 2.4% (0.5%) (0.6%) (2.5%) 0.0% 1.2% 5.3% (16.9%) 0.9%As % of Sales (18.8%) (18.6%) (18.0%) (18.2%) (18.0%) (16.9%) (16.3%) (17.9%) (17.3%) (18.1%) (18.6%) (18.4%) (15.6%) (18.4%)
Variable Costs (332.9) (337.6) (336.1) (328.0) (83.1) (92.0) (85.2) (86.0) (346.3) (86.2) (85.8) (80.5) (83.2) (335.8)Growth % 1.4% (0.5%) (2.4%) 5.6% 3.8% (6.7%) (5.4%) (3.3%) (3.0%)As % of Sales (39.1%) (38.4%) (37.3%) (36.9%) (37.5%) (38.0%) (38.0%) (38.5%) (38.0%) (39.0%) (38.5%) (38.5%) (38.8%) (38.8%)
Gross Profit 358.4 378.0 403.1 399.5 98.5 109.1 102.4 97.4 407.4 94.9 95.6 90.2 97.6 370.6Margin % 42.1% 43.0% 44.7% 44.9% 44.5% 45.1% 45.7% 43.6% 44.7% 42.9% 42.9% 43.1% 45.6% 42.8%
Original TPG Plan 430Margin % 44.5%
Other Costs
R&D Costs (20.9) (20.0) (24.2) (25.9) (6.4) (7.1) (7.4) (8.6) (29.5) (7.0) (7.7) (9.0) (8.6) (32.3)Growth % (4.3%) 21.0% 7.0% 14.1% 8.9% 8.4% 22.5% (0.8%) 9.3%As % of Sales (2.5%) (2.3%) (2.7%) (2.9%) (2.9%) (2.9%) (3.3%) (3.9%) (3.2%) (3.2%) (3.5%) (4.3%) (4.0%) (3.7%)
Selling Expenses (193.2) (194.6) (198.7) (192.2) (48.4) (51.9) (50.5) (50.2) (201.0) (49.5) (48.9) (45.7) (49.1) (193.1)Growth % 0.7% 2.1% (3.3%) 4.6% 2.4% (5.8%) (9.5%) (2.3%) (3.9%)As % of Sales (22.7%) (22.1%) (22.0%) (21.6%) (21.8%) (21.4%) (22.5%) (22.5%) (22.1%) (22.4%) (21.9%) (21.8%) (22.9%) (22.3%)
A&G Expenses (27.6) (30.8) (29.3) (31.9) (7.6) (7.9) (8.1) (7.0) (30.6) (7.2) (7.0) (7.1) (7.0) (28.4)Growth % 11.6% (4.9%) 8.9% (4.0%) (5.2%) (11.3%) (12.3%) 0.3% (7.4%)As % of Sales (3.2%) (3.5%) (3.2%) (3.6%) (3.4%) (3.3%) (3.6%) (3.1%) (3.4%) (3.3%) (3.2%) (3.4%) (3.3%) (3.3%)
Other, Net (0.4) 2.3 (3.5) (1.8) 0.0 0.0 0.0 0.0 0.0 0.0 0.0 0.0 0.0 0.0
Operational EBITA 116.3 134.9 147.4 147.7 36.1 42.1 36.5 31.5 146.3 31.2 31.9 28.4 32.9 116.8Margin % 13.7% 15.3% 16.3% 16.6% 16.3% 17.4% 16.3% 14.1% 16.1% 14.1% 14.3% 13.6% 15.4% 13.5%
D&A 39.5 36.3 38.3 38.6 10.0 10.0 10.0 10.0 40.0 10.0 10.0 10.0 10.0 40.0
Operational EBITDA 155.8 171.2 185.7 186.3 46.1 52.1 46.5 41.5 186.3 41.2 41.9 38.4 42.9 156.8Margin % 18.3% 19.5% 20.6% 21.0% 20.8% 21.5% 20.8% 18.6% 20.4% 18.6% 18.8% 18.4% 20.1% 18.1%
Original TPG Plan 200Margin % 20.7%
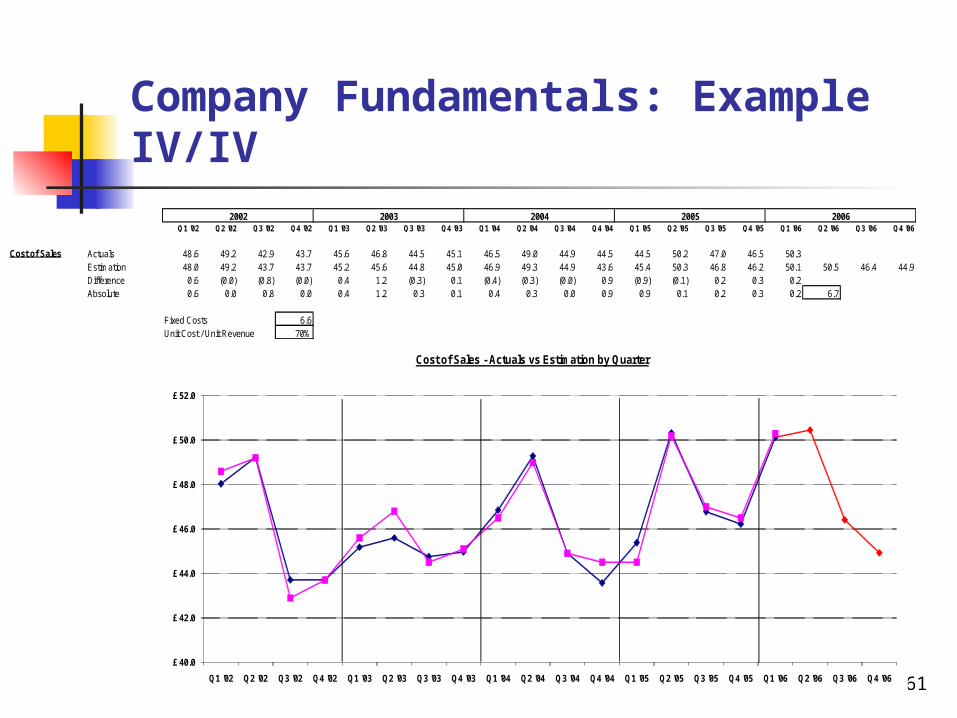
Company Fundamentals: Example IV/IV
61
2002 2003 2004 2005 2006Q1 '02 Q2 '02 Q3 '02 Q4 '02 Q1 '03 Q2 '03 Q3 '03 Q4 '03 Q1 '04 Q2 '04 Q3 '04 Q4 '04 Q1 '05 Q2 '05 Q3 '05 Q4 '05 Q1 '06 Q2 '06 Q3 '06 Q4 '06
Cost of Sales Actuals 48.6 49.2 42.9 43.7 45.6 46.8 44.5 45.1 46.5 49.0 44.9 44.5 44.5 50.2 47.0 46.5 50.3Estimation 48.0 49.2 43.7 43.7 45.2 45.6 44.8 45.0 46.9 49.3 44.9 43.6 45.4 50.3 46.8 46.2 50.1 50.5 46.4 44.9Difference 0.6 (0.0) (0.8) (0.0) 0.4 1.2 (0.3) 0.1 (0.4) (0.3) (0.0) 0.9 (0.9) (0.1) 0.2 0.3 0.2Absolute 0.6 0.0 0.8 0.0 0.4 1.2 0.3 0.1 0.4 0.3 0.0 0.9 0.9 0.1 0.2 0.3 0.2 6.7
Fixed Costs 6.6Unit Cost / Unit Revenue 70%
£ 40.0
£ 42.0
£ 44.0
£ 46.0
£ 48.0
£ 50.0
£ 52.0
Q1 '02 Q2 '02 Q3 '02 Q4 '02 Q1 '03 Q2 '03 Q3 '03 Q4 '03 Q1 '04 Q2 '04 Q3 '04 Q4 '04 Q1 '05 Q2 '05 Q3 '05 Q4 '05 Q1 '06 Q2 '06 Q3 '06 Q4 '06
Cost of Sales - Actuals vs Estimation by Quarter
£ 6.0
£ 6.5
£ 7.0
£ 7.5
£ 8.0
£ 8.5
£ 9.0
Other Net Operating Expenses - Actuals vs Estimation by Quarter
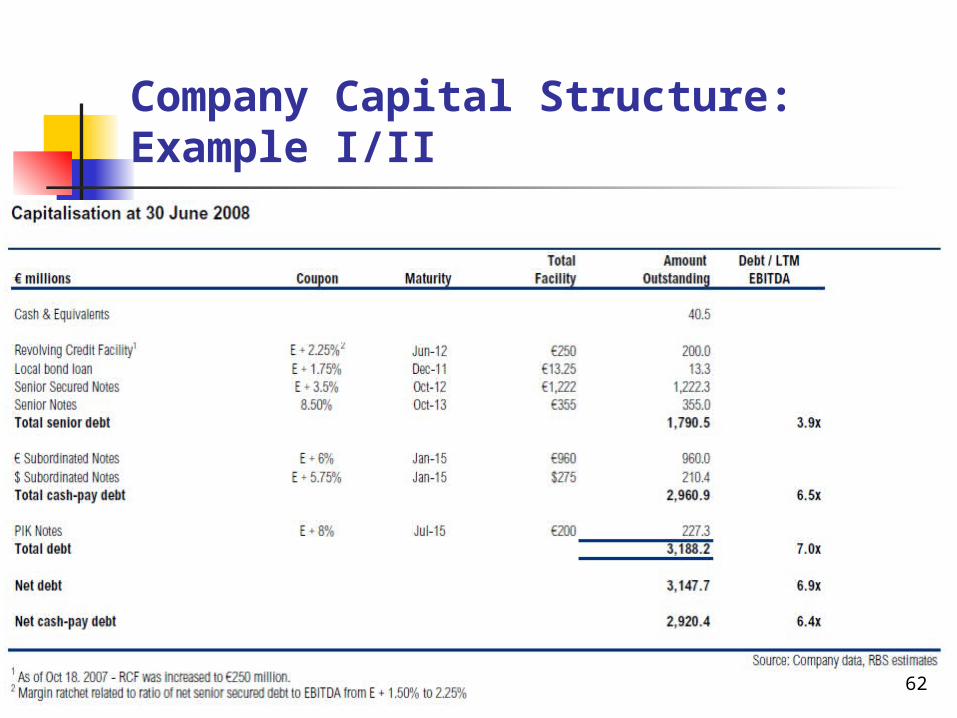
Company Capital Structure: Example I/II
62
Company Capital Structure: Example II/II
63
Combining capital structure analysis with the equity and credit comps’ analysis, we are effectively able to “price” the distress securities
Previous example of Wind Hellas, the Greek telecom operator: from equity comps’ analysis we have that similar type of assets trade between 6x and
7x a 6.5x value would then “break through” Wind Hellas’ capital structure, allowing to
recover par value on the subordinated notes (which sit at 6.5x leverage) and nil on the PIK notes (which sit at 7x leverage)
Among Wind Hellas’ securities, subordinated notes currently trade in the 70s while the PIK notes trade in the 50s implying a return of approx 15-20% on the subordinated notes and of approx 35-40% on the PIK notes
The market is not pricing the subordinated notes at par while the PIK notes at zero The company in two to three years might or might not improve its profitability, hence
the PIK notes might get or do not get value The price of the subordinated notes and the PIK notes tell us that the market on one
hand is pricing the possibility that the company might lower its EBITDA/Valuation (that’s why the subordinated notes are trading at discount) and on the other hand is pricing the possibility that the company might improve its EBITDA/Valuation (that’s why the PIK notes have some value)
Credit Statistics There is a set of credit statistics coming out of financial
models which are what most credit investors look at in order to form an opinion about the credit soundness of the target company
Pro forma Year 1 Year 2 Year 3 Year 4
Lack of deleveraging distress situation
64
The analysis of the credit stats varies according to: the cash-flow conversion of the company, its earnings’ growth,
its predictability of earnings, etc new issue or secondary trade; the sector we are looking at
Legal and Structure Analysis Investing in credit offers a variety of legal rights as outlined
in legal norms and either loan provisions or bond indenture Basic one: priority be reimbursed vs equity in case of liquidation That’s why credit return is capped
Being able to identify our own rights as creditor is an important step of the investment decision process
the priority in the capital structure, covenants’ protection, majority clauses to change the contract if loan or the bond
indenture if bond, etc The legal and structure analysis becomes more and more
important the more distress the situation we are looking at is When investing in high yield, hopefully we will not get to the
point where we have to worry about liquidation priorities, etc In distress, instead, the legal and structure analysis is
paramount 65
Legal and Structure Analysis When investing in debt securities, the legal
documentation analysis and the understanding of our own and other creditors’ rights rights is of paramount importance
Security / collateral (mainly in case of loans, but also bonds sometimes) Seniority in the capital structure (structural and contractual) Change of control clause Super majority clauses (specifically in case of loans) Covenants and events of default Application of excess cashflow ….. …… …..
66
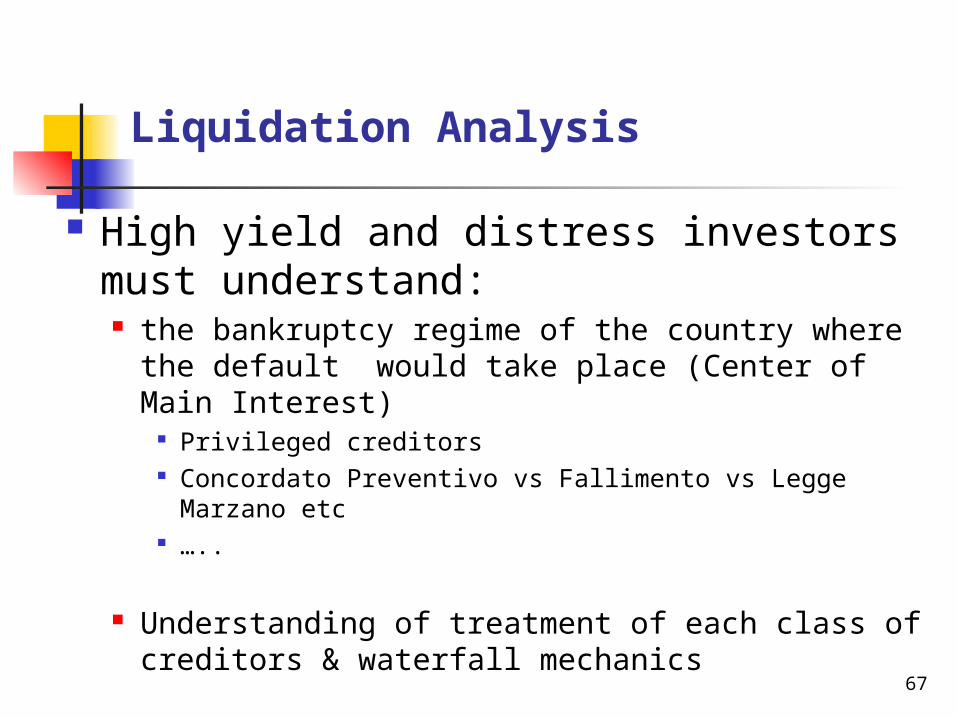
Liquidation Analysis
High yield and distress investors must understand: the bankruptcy regime of the country where the
default would take place (Center of Main Interest)
Privileged creditors Concordato Preventivo vs Fallimento vs Legge Marzano
etc …..
Understanding of treatment of each class of creditors & waterfall mechanics 67
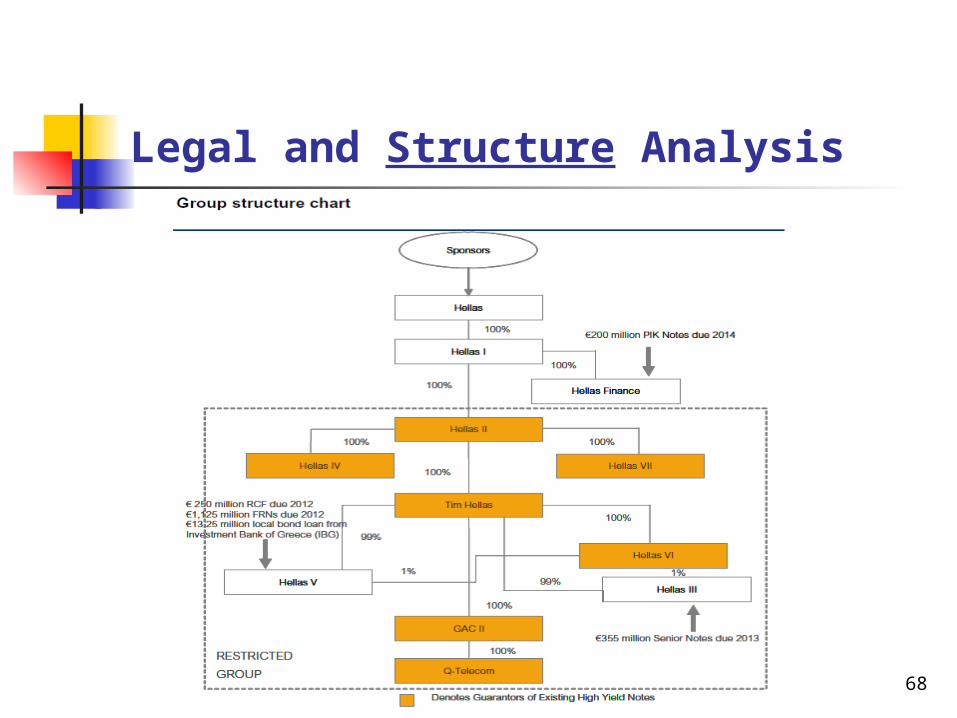
Legal and Structure Analysis
68
Trading Dynamics and Scale Given the illiquidity of the product, being able to rightly
identify which broker to deal with in order to build up a position, which timing to use, etc is a key aspect of investing in high yield and distress bonds/loans
While stocks can be cheap/expensive but can always get cheaper/more expansive, credit investing is mean reverting, i.e. the company will pay you back par value unless it defaults
This feature makes the trading scale strategy crucial
When prices deteriorate because of market conditions, usually high yield and distress investors who have a high degree of conviction would tend to add to their positions (technically called “double down”)
69
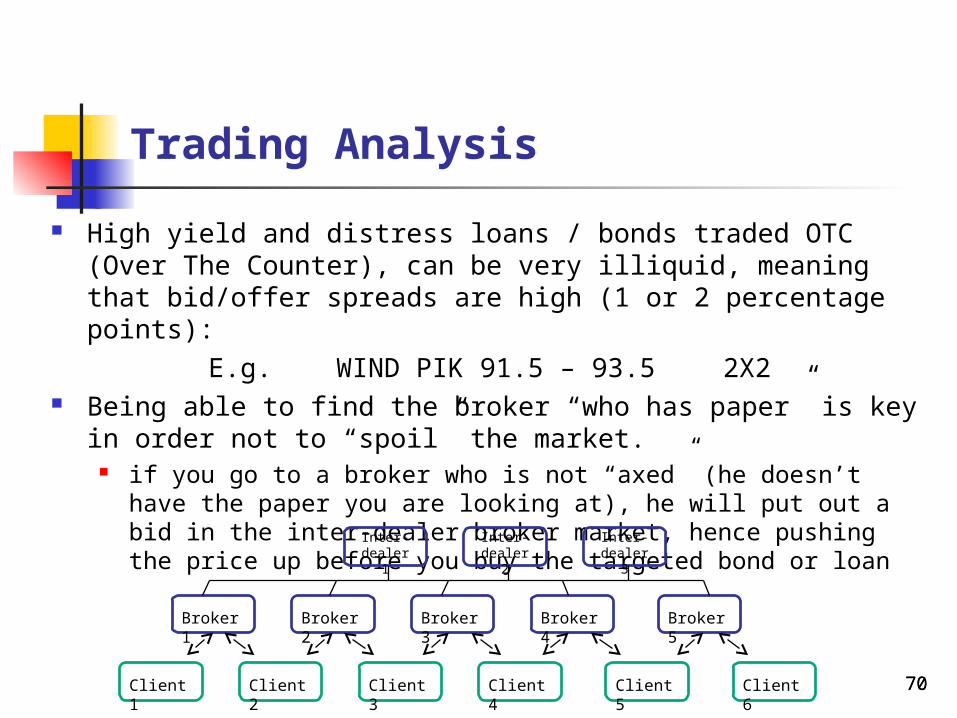
Trading Analysis High yield and distress loans / bonds traded OTC (Over The
Counter), can be very illiquid, meaning that bid/offer spreads are high (1 or 2 percentage points):
E.g. WIND PIK 91.5 – 93.5 2X2 Being able to find the broker “who has paper” is key in order
not to “spoil” the market. if you go to a broker who is not “axed” (he doesn’t have the
paper you are looking at), he will put out a bid in the inter-dealer broker market, hence pushing the price up before you buy the targeted bond or loan
Client 1 Client 2 Client 3 Client 4 Client 5 Client 6
Broker 1
Broker 2
Broker 3
Broker 4
Broker 5
Inter-dealer 1
Inter-dealer 2
Inter-dealer 3
7070
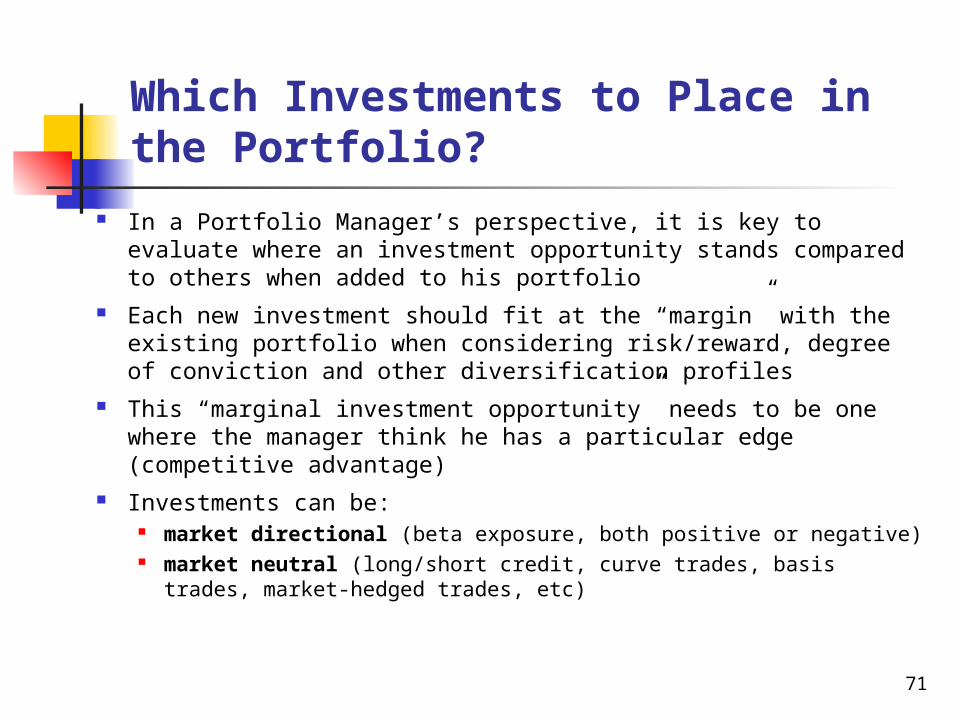
Which Investments to Place in the Portfolio?
In a Portfolio Manager’s perspective, it is key to evaluate where an investment opportunity stands compared to others when added to his portfolio
Each new investment should fit at the “margin” with the existing portfolio when considering risk/reward, degree of conviction and other diversification profiles
This “marginal investment opportunity” needs to be one where the manager think he has a particular edge (competitive advantage)
Investments can be: market directional (beta exposure, both positive or negative) market neutral (long/short credit, curve trades, basis trades,
market-hedged trades, etc)
71
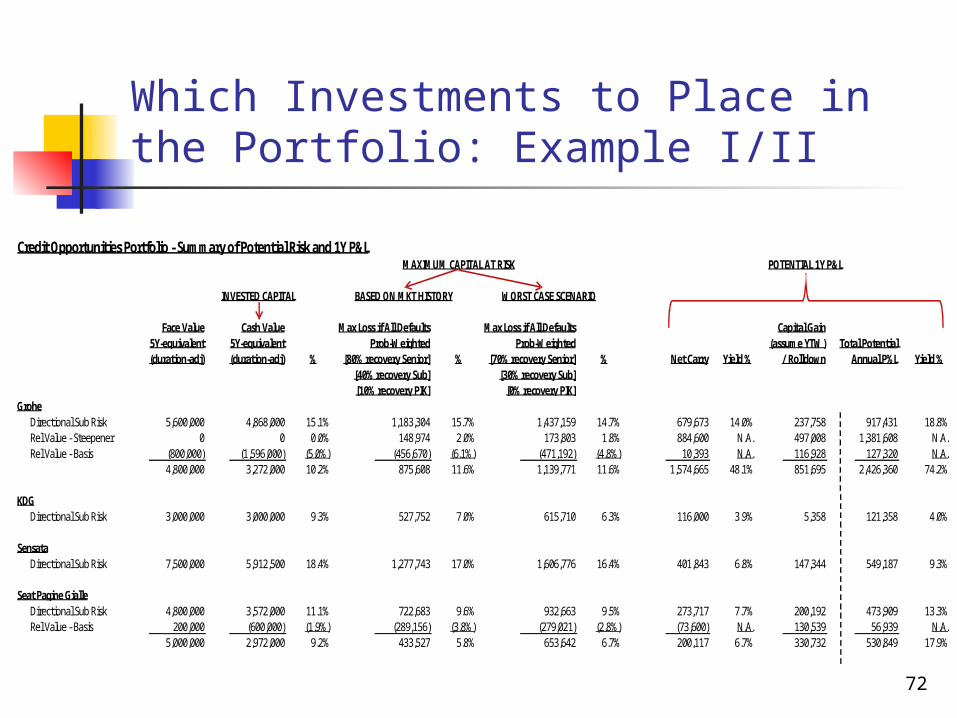
Which Investments to Place in the Portfolio: Example I/II
72
Credit Opportunities Portfolio - Summary of Potential Risk and 1Y P&LMAXIMUM CAPITAL AT RISK POTENTIAL 1Y P&L
INVESTED CAPITAL BASED ON MKT HISTORY WORST CASE SCENARIO
Face Value Cash Value Max Loss if All Defaults Max Loss if All Defaults Capital Gain5Y-equivalent 5Y-equivalent Prob-Weighted Prob-Weighted (assume YTW) Total Potential(duration-adj) (duration-adj) % [80% recovery Senior] % [70% recovery Senior] % Net Carry Yield % / Rolldown Annual P%L Yield %
[40% recovery Sub] [30% recovery Sub][10% recovery PIK] [0% recovery PIK]
GroheDirectional Sub Risk 5,600,000 4,868,000 15.1% 1,183,304 15.7% 1,437,159 14.7% 679,673 14.0% 237,758 917,431 18.8%Rel Value - Steepener 0 0 0.0% 148,974 2.0% 173,803 1.8% 884,600 N.A. 497,008 1,381,608 N.A.Rel Value - Basis (800,000) (1,596,000) (5.0%) (456,670) (6.1%) (471,192) (4.8%) 10,393 N.A. 116,928 127,320 N.A.
4,800,000 3,272,000 10.2% 875,608 11.6% 1,139,771 11.6% 1,574,665 48.1% 851,695 2,426,360 74.2%
KDGDirectional Sub Risk 3,000,000 3,000,000 9.3% 527,752 7.0% 615,710 6.3% 116,000 3.9% 5,358 121,358 4.0%
SensataDirectional Sub Risk 7,500,000 5,912,500 18.4% 1,277,743 17.0% 1,606,776 16.4% 401,843 6.8% 147,344 549,187 9.3%
Seat Pagine GialleDirectional Sub Risk 4,800,000 3,572,000 11.1% 722,683 9.6% 932,663 9.5% 273,717 7.7% 200,192 473,909 13.3%Rel Value - Basis 200,000 (600,000) (1.9%) (289,156) (3.8%) (279,021) (2.8%) (73,600) N.A. 130,539 56,939 N.A.
5,000,000 2,972,000 9.2% 433,527 5.8% 653,642 6.7% 200,117 6.7% 330,732 530,849 17.9%
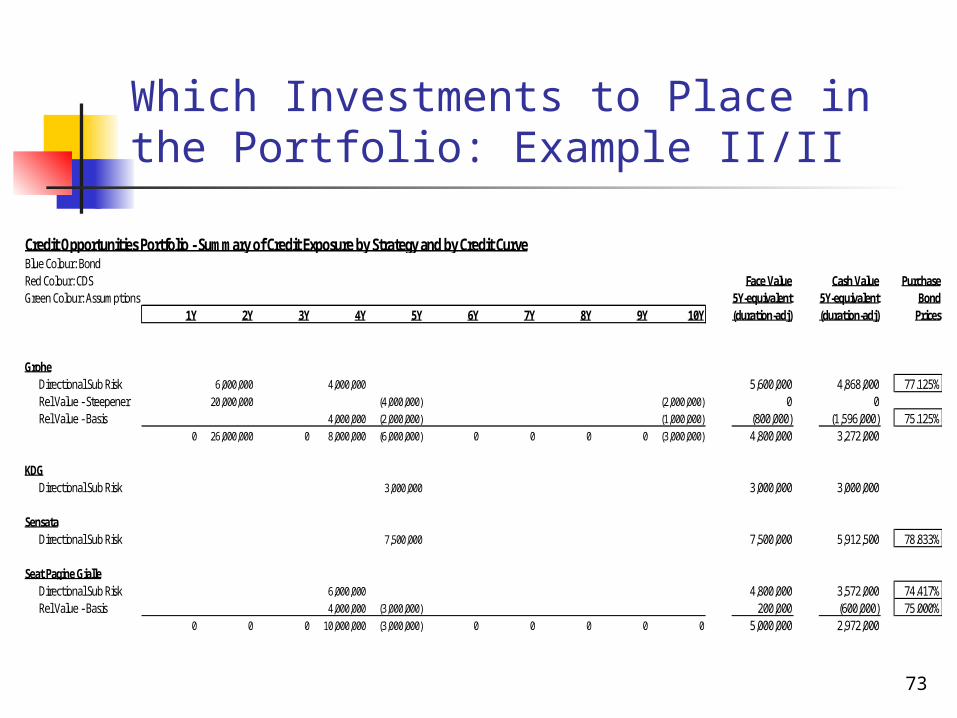
Which Investments to Place in the Portfolio: Example II/II
73
Credit Opportunities Portfolio - Summary of Credit Exposure by Strategy and by Credit CurveBlue Colour: BondRed Colour: CDS Face Value Cash Value PurchaseGreen Colour: Assumptions 5Y-equivalent 5Y-equivalent Bond
1Y 2Y 3Y 4Y 5Y 6Y 7Y 8Y 9Y 10Y (duration-adj) (duration-adj) Prices
GroheDirectional Sub Risk 6,000,000 4,000,000 5,600,000 4,868,000 77.125%Rel Value - Steepener 20,000,000 (4,000,000) (2,000,000) 0 0Rel Value - Basis 4,000,000 (2,000,000) (1,000,000) (800,000) (1,596,000) 75.125%
0 26,000,000 0 8,000,000 (6,000,000) 0 0 0 0 (3,000,000) 4,800,000 3,272,000
KDGDirectional Sub Risk 3,000,000 3,000,000 3,000,000
SensataDirectional Sub Risk 7,500,000 7,500,000 5,912,500 78.833%
Seat Pagine GialleDirectional Sub Risk 6,000,000 4,800,000 3,572,000 74.417%Rel Value - Basis 4,000,000 (3,000,000) 200,000 (600,000) 75.000%
0 0 0 10,000,000 (3,000,000) 0 0 0 0 0 5,000,000 2,972,000
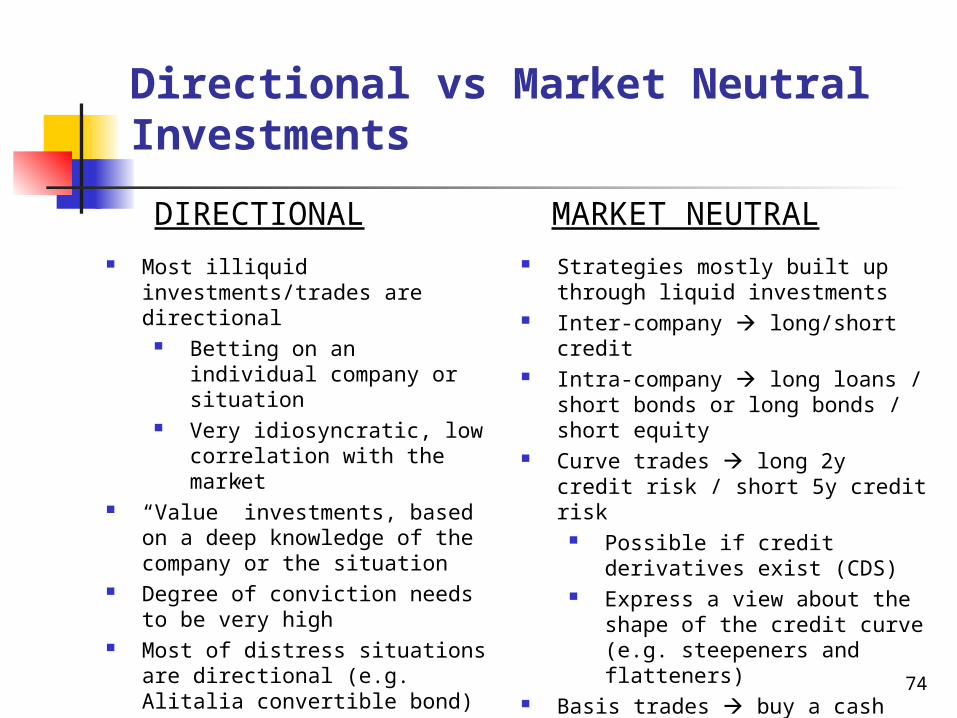
Directional vs Market Neutral Investments
Most illiquid investments/trades are directional
Betting on an individual company or situation
Very idiosyncratic, low correlation with the market
“Value” investments, based on a deep knowledge of the company or the situation
Degree of conviction needs to be very high
Most of distress situations are directional (e.g. Alitalia convertible bond)
Strategies mostly built up through liquid investments
Inter-company long/short credit Intra-company long loans /
short bonds or long bonds / short equity
Curve trades long 2y credit risk / short 5y credit risk
Possible if credit derivatives exist (CDS)
Express a view about the shape of the credit curve (e.g. steepeners and flatteners)
Basis trades buy a cash bond and buy CDS protection, yielding a net interest income (virtually risk free)
DIRECTIONAL MARKET NEUTRAL
74
Relative Value, Basis & Curve Trades: Another Way to Express Investment Views
Buy CDS protection X-year and Sell CDS protection Y-year Trade can be
DIV01 neutral (ratio to neutralize market risk) Jump to default neutral (ratio to completely neutralize default risk)
Trade can be Flattener (to “play” the flattening of the curve), generally a bearish trade Steepener (to “play” the steepening of the curve), generally a bullish trade
Trade need to be rebalanced quarterly, since with time going by the ratios (to make the trade DIV01 neutral or jump-to-default neutral) change
If short term credit risk is attractive but a market exposure is not wanted, then a trade where to go long the short end of the credit curve (i.e. sell CDS protection) and short the long end of the credit curve (buy CDS protection) makes sense - specifically if the trade is carry positive and roll-down positive
The roll-down is when a 5y CDS becomes a 4y because 1 year has gone by roll-down is positive when 4y spread is lower than 5y spread, hence your contract is in the money after 1y
7575
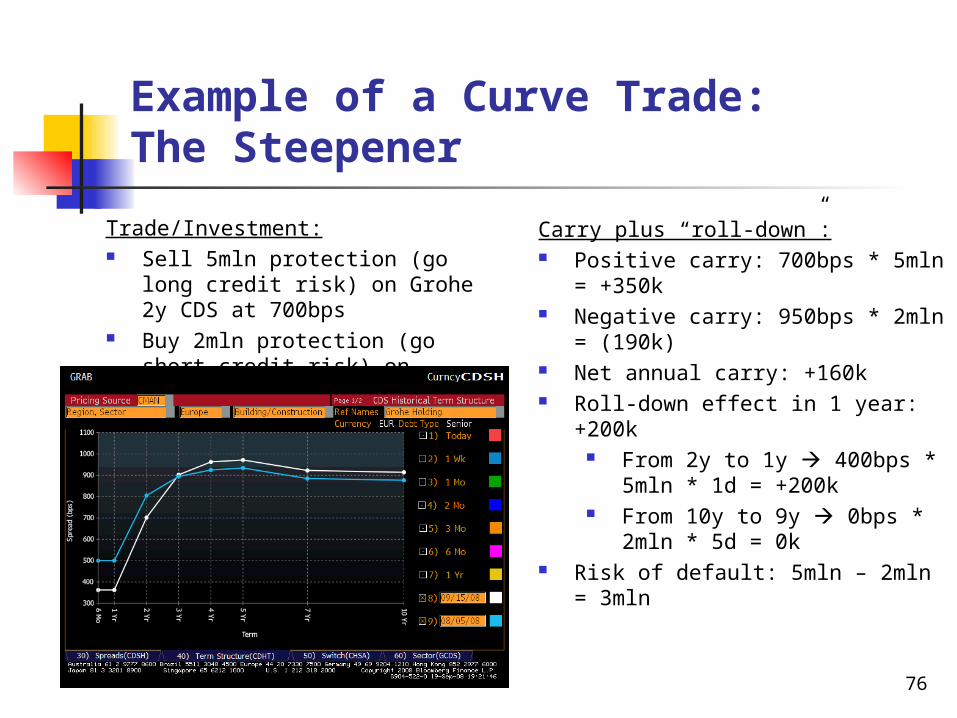
Example of a Curve Trade: The Steepener
Trade/Investment: Sell 5mln protection (go long
credit risk) on Grohe 2y CDS at 700bps
Buy 2mln protection (go short credit risk) on Grohe 10y CDS at 950bps
Carry plus “roll-down”: Positive carry: 700bps * 5mln =
+350k Negative carry: 950bps * 2mln =
(190k) Net annual carry: +160k Roll-down effect in 1 year: +200k
From 2y to 1y 400bps * 5mln * 1d = +200k
From 10y to 9y 0bps * 2mln * 5d = 0k
Risk of default: 5mln – 2mln = 3mln
76
Liquidating a Position
Liquidating a position in high yield can be very expensive (in distress is virtually impossible)
Bid / Ask spread can be up to 5 points in the less liquid names, and most likely would work in max 2mln size
Once you hit a bid of a broker in 2mln, the next “market” the broker might offer you can be 1 or 2 points lower
In a market where there is lack of liquidity, e.g. the days after the Lehman bankruptcy, there is literally no bid for the higher yielding products
The CDS is much more liquid, however not all the cash bonds do have CDS protection outstanding (only the more traded and liquid names)
77
Monitoring Risk
Risk monitoring is done through a portfolio management tool
Interest rate or currency risk exposure Breakdown of exposure by sector Breakdown of exposure by seniority of securities in the capital structure Analysis of carry interest vs accrual of principal (PIK or capital
appreciation when securities purchased at discount) Analysis of liquidity of the instruments Analysis of volatility by instruments Analysis of estimated tail risk (capital at risk in case of financial shocks)
Risk management performed daily with update of prices Risk management need to be put into the overall hedge
fund context
78
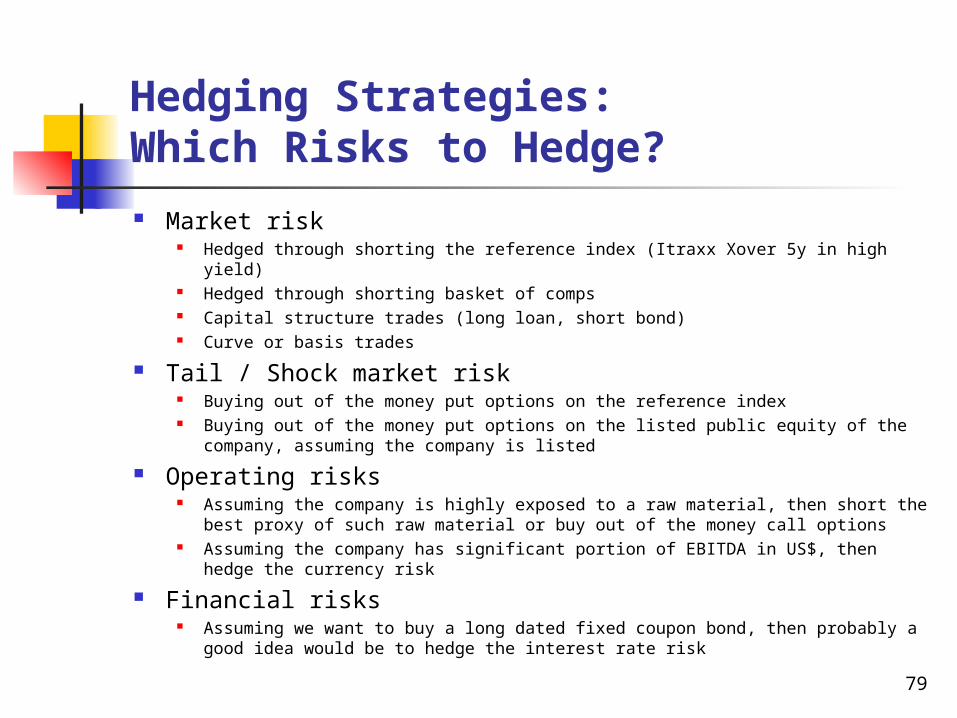
Hedging Strategies: Which Risks to Hedge?
Market risk Hedged through shorting the reference index (Itraxx Xover 5y in high yield) Hedged through shorting basket of comps Capital structure trades (long loan, short bond) Curve or basis trades
Tail / Shock market risk Buying out of the money put options on the reference index Buying out of the money put options on the listed public equity of the
company, assuming the company is listed
Operating risks Assuming the company is highly exposed to a raw material, then short the
best proxy of such raw material or buy out of the money call options Assuming the company has significant portion of EBITDA in US$, then
hedge the currency risk
Financial risks Assuming we want to buy a long dated fixed coupon bond, then probably a
good idea would be to hedge the interest rate risk 79
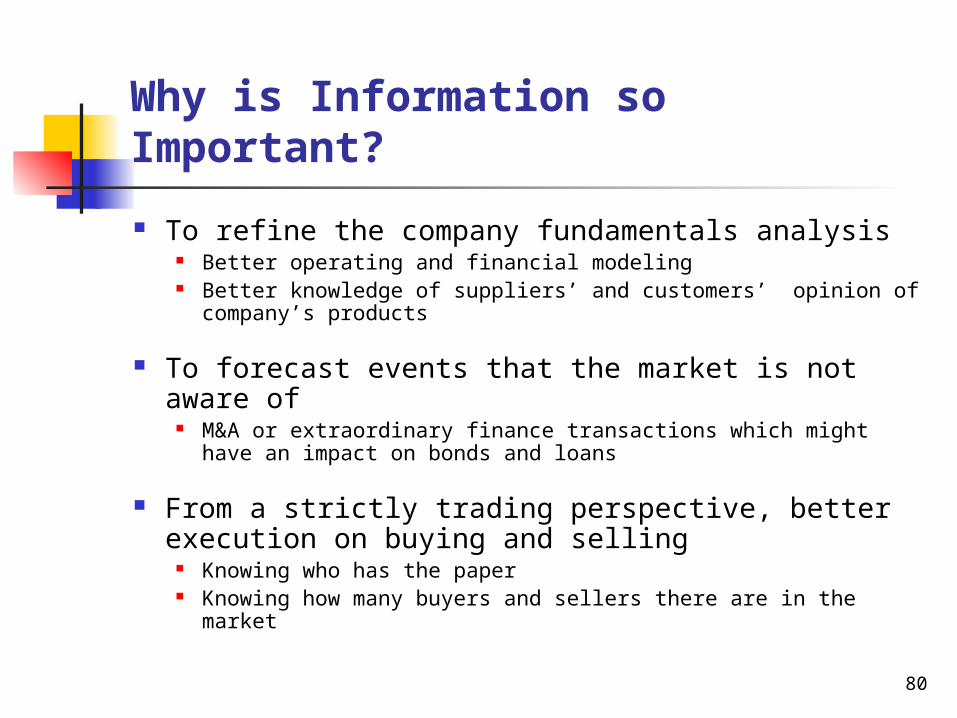
Why is Information so Important?
To refine the company fundamentals analysis Better operating and financial modeling Better knowledge of suppliers’ and customers’ opinion of
company’s products
To forecast events that the market is not aware of
M&A or extraordinary finance transactions which might have an impact on bonds and loans
From a strictly trading perspective, better execution on buying and selling
Knowing who has the paper Knowing how many buyers and sellers there are in the market
80
Current Market Conditions
Are You Ready for Distress?
81
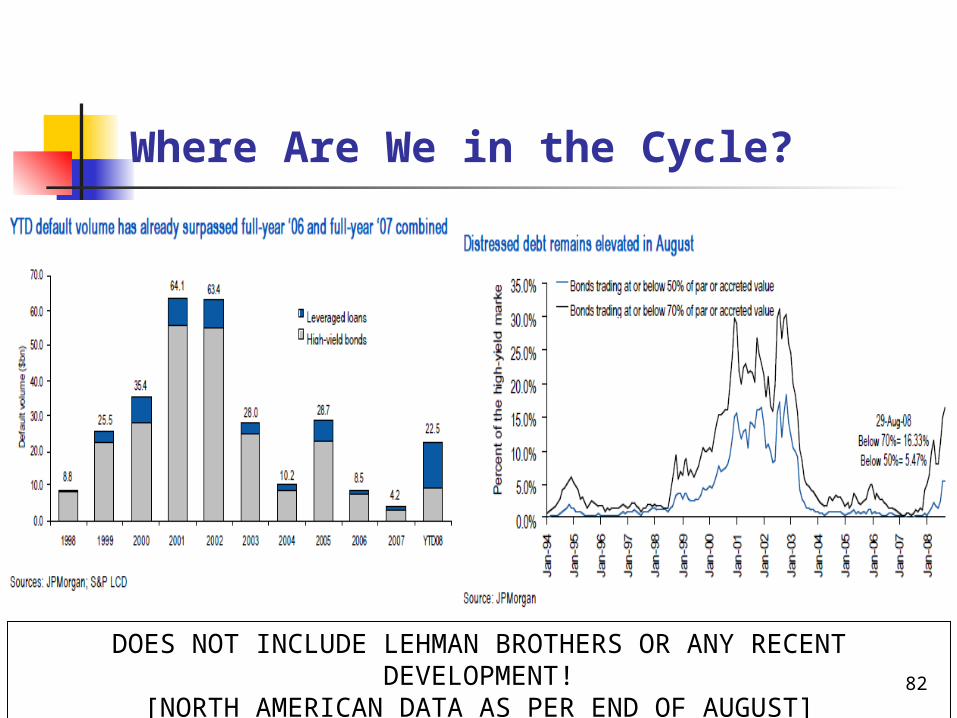
Where Are We in the Cycle?
82
DOES NOT INCLUDE LEHMAN BROTHERS OR ANY RECENT DEVELOPMENT!
[NORTH AMERICAN DATA AS PER END OF AUGUST]
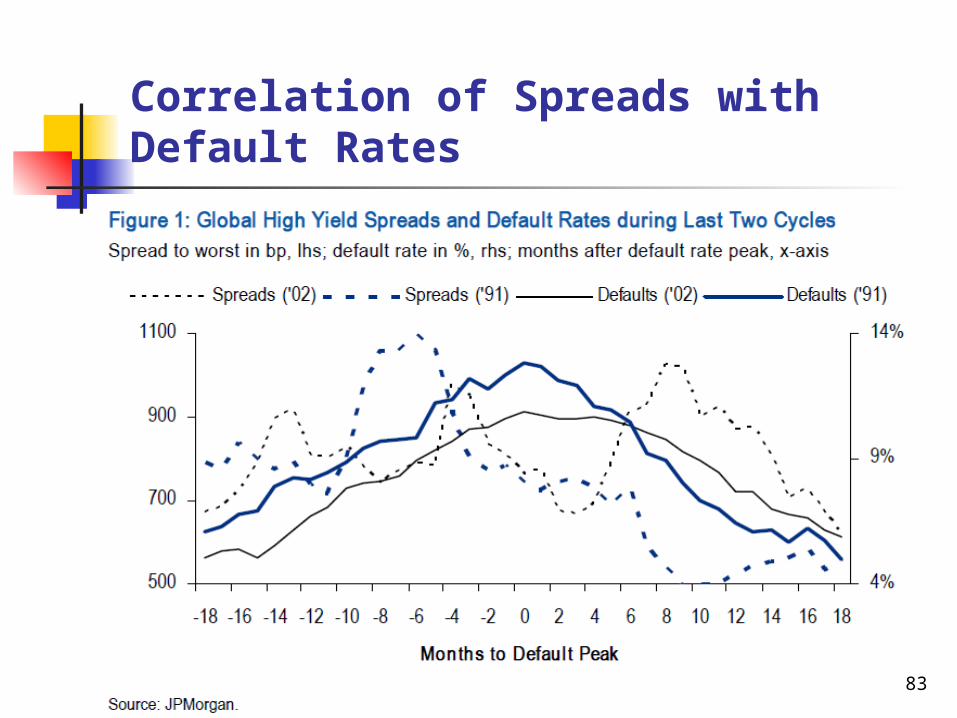
Correlation of Spreads with Default Rates
83
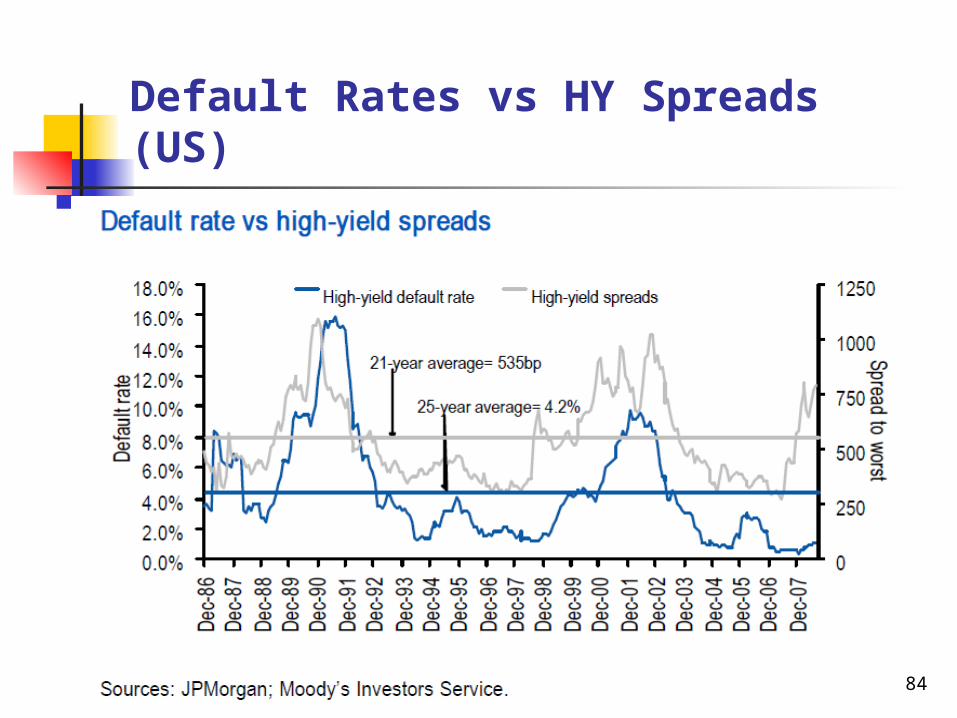
Default Rates vs HY Spreads (US)
84
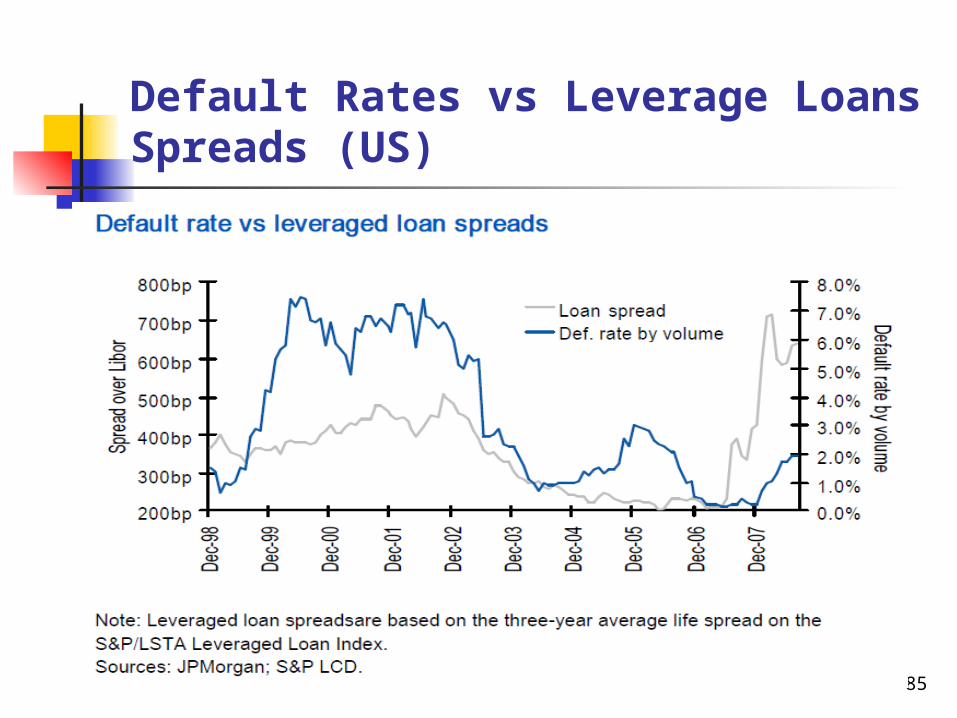
Default Rates vs Leverage Loans Spreads (US)
85
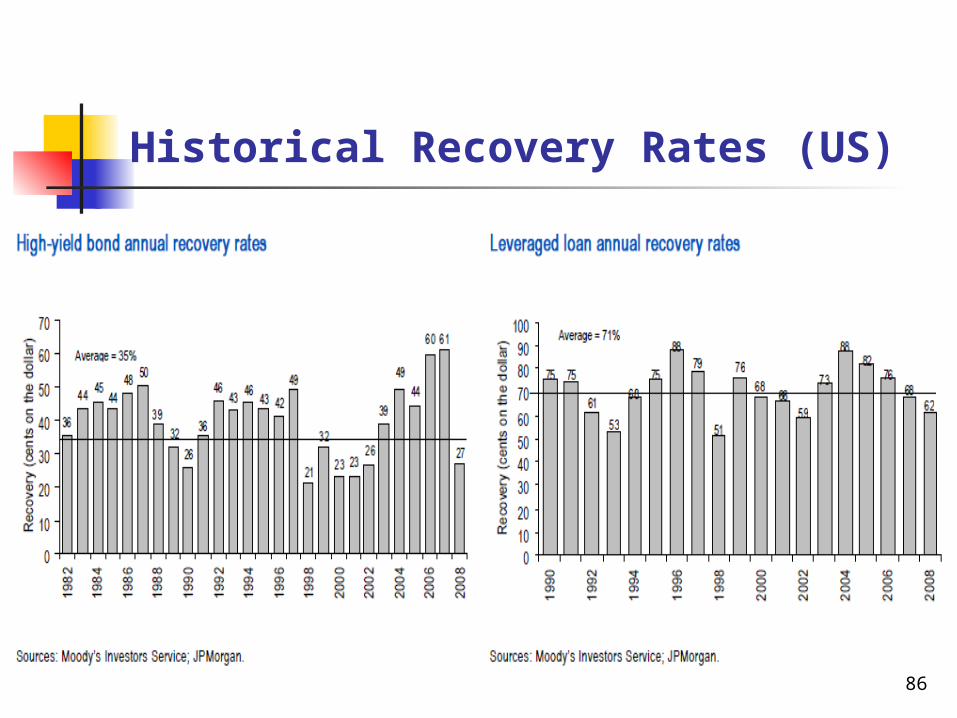
Historical Recovery Rates (US)
86
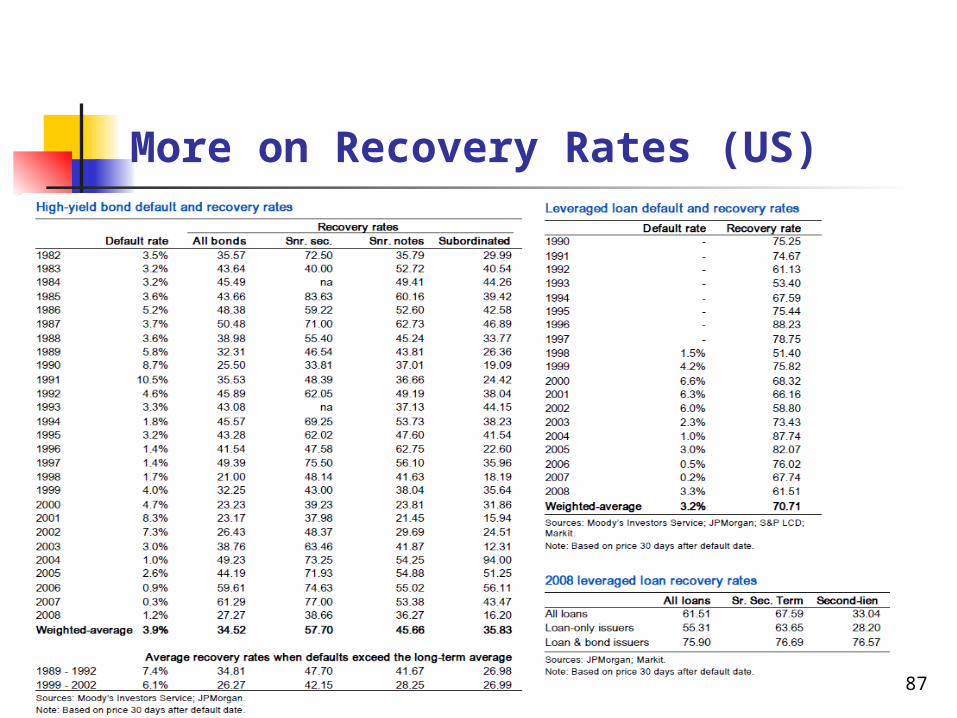
More on Recovery Rates (US)
87
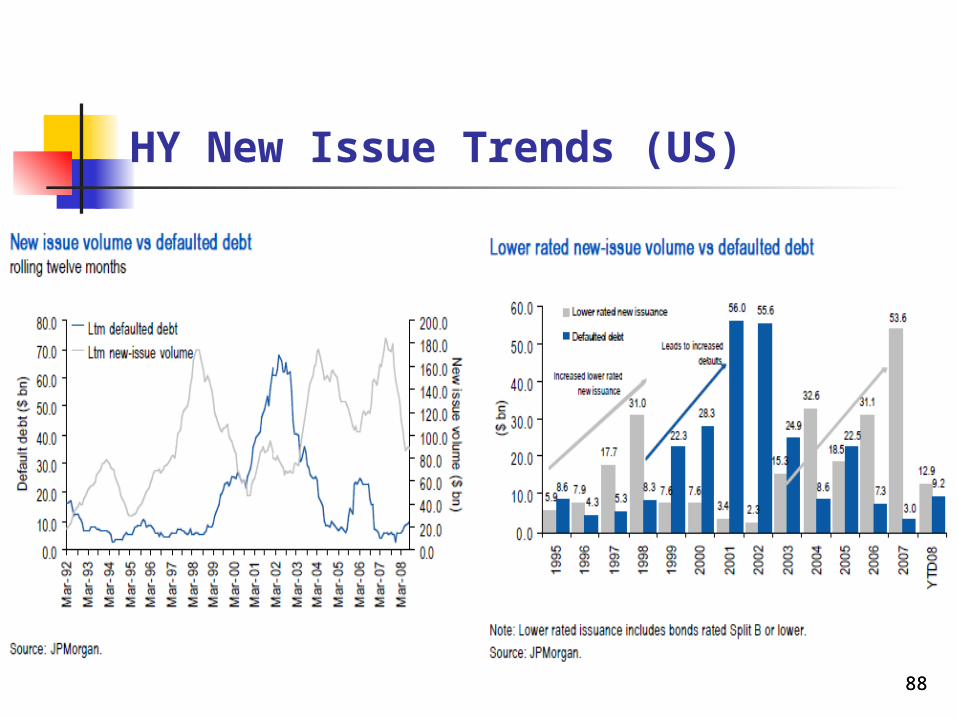
HY New Issue Trends (US)
8888
Conclusions
Distressed debt is already out there Many private equity funds and other institutional funds
are setting up more and more dedicated funds to this asset class
Spreads are currently on the rise, and there to stay for 12-24 months
Carry interest is currently high, looking at historical average, which makes the asset class already attractive
Default rates will peak in the next 12-24 months Market prices (hence spreads) anticipate default rates
89