Embed Size (px)
Citation preview

HAL Id: hal-00298127https://hal.archives-ouvertes.fr/hal-00298127
Submitted on 4 May 2006
HAL is a multi-disciplinary open accessarchive for the deposit and dissemination of sci-entific research documents, whether they are pub-lished or not. The documents may come fromteaching and research institutions in France orabroad, or from public or private research centers.
L’archive ouverte pluridisciplinaire HAL, estdestinée au dépôt et à la diffusion de documentsscientifiques de niveau recherche, publiés ou non,émanant des établissements d’enseignement et derecherche français ou étrangers, des laboratoirespublics ou privés.
A guide for digitising manuscript climate dataS. Brönnimann, J. Annis, W. Dann, T. Ewen, A. N. Grant, T. Griesser, S.
Krähenmann, C. Mohr, M. Scherer, C. Vogler
To cite this version:S. Brönnimann, J. Annis, W. Dann, T. Ewen, A. N. Grant, et al.. A guide for digitising manuscriptclimate data. Climate of the Past Discussions, European Geosciences Union (EGU), 2006, 2 (3),pp.191-207. �hal-00298127�

CPD2, 191–207, 2006
A guide for digitisingmanuscript climate
data
S. Bronnimann et al.
Title Page
Abstract Introduction
Conclusions References
Tables Figures
J I
J I
Back Close
Full Screen / Esc
Printer-friendly Version
Interactive Discussion
EGU
Clim. Past Discuss., 2, 191–207, 2006www.clim-past-discuss.net/2/191/2006/© Author(s) 2006. This work is licensedunder a Creative Commons License.
Climateof the Past
Discussions
Climate of the Past Discussions is the access reviewed discussion forum of Climate of the Past
A guide for digitising manuscript climatedataS. Bronnimann, J. Annis, W. Dann, T. Ewen, A. N. Grant, T. Griesser,S. Krahenmann, C. Mohr, M. Scherer, and C. Vogler
Institute for Atmospheric and Climate Science, ETH Zurich, Universitatstr. 16, CH-8092Zurich, Switzerland
Received: 1 March 2006 – Accepted: 14 March 2006 – Published: 4 May 2006
Correspondence to: S. Bronnimann ([email protected])
191
CPD2, 191–207, 2006
A guide for digitisingmanuscript climate
data
S. Bronnimann et al.
Title Page
Abstract Introduction
Conclusions References
Tables Figures
J I
J I
Back Close
Full Screen / Esc
Printer-friendly Version
Interactive Discussion
EGU
Abstract
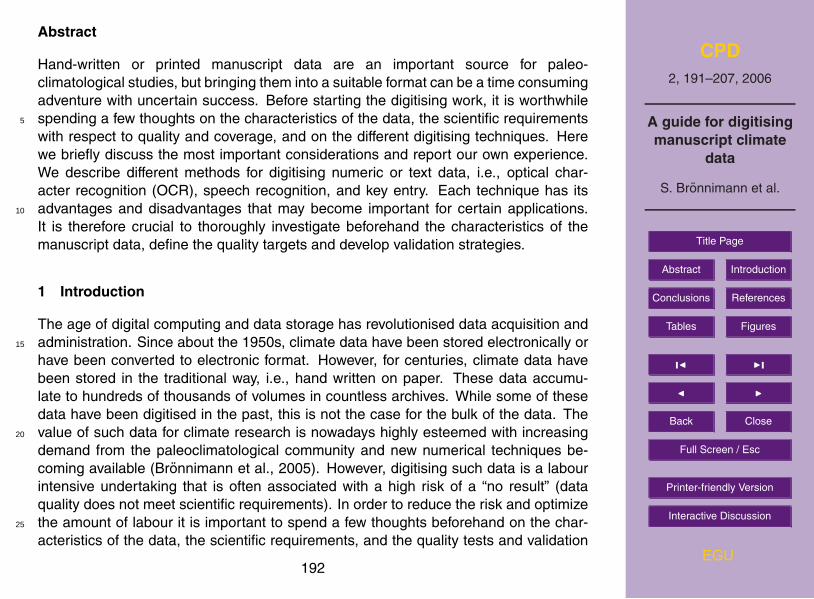
Hand-written or printed manuscript data are an important source for paleo-climatological studies, but bringing them into a suitable format can be a time consumingadventure with uncertain success. Before starting the digitising work, it is worthwhilespending a few thoughts on the characteristics of the data, the scientific requirements5
with respect to quality and coverage, and on the different digitising techniques. Herewe briefly discuss the most important considerations and report our own experience.We describe different methods for digitising numeric or text data, i.e., optical char-acter recognition (OCR), speech recognition, and key entry. Each technique has itsadvantages and disadvantages that may become important for certain applications.10
It is therefore crucial to thoroughly investigate beforehand the characteristics of themanuscript data, define the quality targets and develop validation strategies.
1 Introduction
The age of digital computing and data storage has revolutionised data acquisition andadministration. Since about the 1950s, climate data have been stored electronically or15
have been converted to electronic format. However, for centuries, climate data havebeen stored in the traditional way, i.e., hand written on paper. These data accumu-late to hundreds of thousands of volumes in countless archives. While some of thesedata have been digitised in the past, this is not the case for the bulk of the data. Thevalue of such data for climate research is nowadays highly esteemed with increasing20
demand from the paleoclimatological community and new numerical techniques be-coming available (Bronnimann et al., 2005). However, digitising such data is a labourintensive undertaking that is often associated with a high risk of a “no result” (dataquality does not meet scientific requirements). In order to reduce the risk and optimizethe amount of labour it is important to spend a few thoughts beforehand on the char-25
acteristics of the data, the scientific requirements, and the quality tests and validation
192
CPD2, 191–207, 2006
A guide for digitisingmanuscript climate
data
S. Bronnimann et al.
Title Page
Abstract Introduction
Conclusions References
Tables Figures
J I
J I
Back Close
Full Screen / Esc
Printer-friendly Version
Interactive Discussion
EGU
strategies. This can help choosing the optimal digitising technique.In our own projects we have digitised historical upper-level data from various sources
that differed in format, quality and layout (Bronnimann, 2003), total ozone from originalobservation sheets (Vogler et al., 2006), as well as meteorological observations fromMount Washington, USA (Grant et al., 2005). We used optical character recognition5
(OCR), speech recognition, and key entry to digitise the data. Following our publi-cations we have repeatedly been contacted by other research groups concerning ourexperience with different techniques. In this paper we would like to share our experi-ence.
2 Properties of manuscript data10
Before describing digitising techniques, we would like to categorise the most impor-tant properties of manuscript data and their relation to the specific requirements ofthe planned research. In the following we distinguish between formal characteristics(format of the source and format of the information) and informational characteristics(information content in relation to the requirements, i.e., quality, redundancy, see Ta-15
ble 1).The source can be available as an original (in any format), as photocopies, scanned
images, or any other form. If originals are available, reproduction is sometimes neces-sary (see Sect. 4). Image processing or also photocopying may enhance the legibilityof the source (e.g., in the case of faint pencil writing on yellowed paper) and is worth20
testing. Bound books often pose special problems. Photocopying is sometimes notpossible, and even when photographing it can be difficult getting the bound books tolie flat. This is especially the case for old, fragile books. If OCR will later be applied, itcan be advisable to make one-sided photocopies of the bound books as an intermedi-ate step (rather than photographing or scanning directly). This preserves (most of) the25
information, while the actual scanning later on takes not much additional time, but canbe optimised later on for speed and resolution.
193

CPD2, 191–207, 2006
A guide for digitisingmanuscript climate
data
S. Bronnimann et al.
Title Page
Abstract Introduction
Conclusions References
Tables Figures
J I
J I
Back Close
Full Screen / Esc
Printer-friendly Version
Interactive Discussion
EGU
The information type can be numeric, text, an alphanumeric code, or graphical. Inthis paper we mainly refer to numeric data; other considerations apply to other typesof data. The format of the information can be a table, a text, a map (such as a weathermap with station information on it), a graph, or a mixture of all these. This is probablythe most important factor in deciding which technique to use. Thereby it should be5
kept in mind that the format and type of the information may frequently change withinthe same archival source over the period of time desired. This concerns not only thereporting (e.g., units, resolution), but also the layout (tables, weather maps). Anotherimportant issue is the typing of the data. Is it printed, typed, or hand-written? Finally,the legibility can be the most important constraint and is something that certainly needs10
consideration in advance.A second set of criteria refers to the information content of the data (informational
characteristics). The first question that often arises is: What part of the information isneeded? Everything? Or just parts of it? Here one has to keep in mind that redundantinformation is valuable for quality checks. For instance, in our upper-air data project15
we were confronted with the problem of a large number of station records, from whichwe had to choose (due to limited resources) a small subset. This is a very commonproblem, and an obvious approach is to estimate the amount of additional informationthat can be gained in relation to the digitising costs, leading to a cost-benefit function(Jones and Trewin, 2002). However, in addition to the spatial and temporal coverage20
of the data series one has to take into account the varying quality as well as the waysof assuring the quality. Here, redundant information is important. We used historicalliterature research to obtain information on the quality and chose pairs of neighbouringstations wherever possible (especially when dealing with different networks). A secondimportant question concerns the expected (based on theory and literature) quality of25
the data and its relation to the required accuracy and precision of the end product.Finally, it is important to think about the meta-information: What kinds of meta-dataare available, what conclusions can possibly be drawn (what is the role of these datain the re-evaluation process), and how will the meta-data be archived? Answering
194

CPD2, 191–207, 2006
A guide for digitisingmanuscript climate
data
S. Bronnimann et al.
Title Page
Abstract Introduction
Conclusions References
Tables Figures
J I
J I
Back Close
Full Screen / Esc
Printer-friendly Version
Interactive Discussion
EGU
this question can be important, e.g., when the same data are available from differentsources, one of which would be cheaper to digitise than others. For all questionsrelated to the informational characteristics, thorough literature research is necessary.
3 Digitising techniques
In our project we have used three techniques for digitising numeric or text data, which5
are discussed in the following. Special techniques are necessary for digitising graphicaldata such printed figures or hand-drawn isolines on weather maps or for analogue datasuch as registering strips from barographs or meteographs, photographed spectra, orthe like.
Optical character recognition (OCR) is a powerful technique to convert scanned or10
photographed documents into text. We used ScanSoft OmniPage Pro 14 for our work.The user can select the area of interest and choose between standard output formats(e.g., text, table, worksheet). We used OCR in conjunction with an Epson documentscanner that allows scanning piles of sheets (in all cases, photocopies of the originals)to a series of files. We performed limited tests also with scanning pens, but decided15
not to use this method operationally in our project.The second method discussed is speech recognition. We used Dragon Natu-
rallySpeaking, Versions 5 and 7 Preferred (digitising languages German and English)in combination with an Excel spreadsheet. In this application, the speaker dictatesnumbers or text along with spoken commands (e.g., “new line”). There is a number20
mode that constrains the program to understanding only numbers and commands.Numbers can be spoken as numbers (e.g., 4267), sequences of ciphers (4-2-6-7), ormixed (42-67). The software must be trained by each speaker according to the specificneeds.
The third method considered is key entry, which is self-explanatory. All software25
programmes are very inexpensive compared to the salaries and hardware and hencetheir price is not considered a factor in this paper.
195

CPD2, 191–207, 2006
A guide for digitisingmanuscript climate
data
S. Bronnimann et al.
Title Page
Abstract Introduction
Conclusions References
Tables Figures
J I
J I
Back Close
Full Screen / Esc
Printer-friendly Version
Interactive Discussion
EGU
4 Procedure
In this section we describe the digitising procedure, thereby putting emphasis on thosesteps where decisions concerning the digitising techniques must be made. The orig-inals are often not at hand. Sometimes the material can be loaned, or an archive iswilling to scan the documents. But mostly a trip to the archive is required, which needs5
careful planning. How much time is needed? Can the digitising be made directly inthe archive based on the originals? Or should one just photocopy everything, takethe paper back home and start browsing through the material? Or should one bringa digital camera and a powerful laptop? It is very important to find people at the cor-responding archives that are willing to provide sample photocopies of the data sheets10
in advance. In historical time periods, data reporting was less standardized, the lay-out of data sheets changed frequently, and it is advisable to ask for as many samplephotocopies as possible.
Digitising directly in the archive using key entry or speech recognition is only rarelyadvisable (e.g., if there are just small pieces of information on a large number of over-15
sized data sheets so that photocopying would take as much time as digitising). Havingthe data sheets at hand for later checks is very important, hence, it is mostly advisableto make photocopies or photographs (the latter requires careful testing, a good tripodor copy stand, and a fast connection to the computer). We normally photocopied allmaterial. Per archive day, around 2000 copies can normally be made (make sure to20
discuss this with the archive beforehand).Before deciding which method to use, it is worthwhile performing extensive tests.
Following are the advantages and disadvantages we found for the three methods usedin our project.
4.1 Optical Character Recognition (OCR)25
OCR is usually the fastest way to digitise data, especially for printed or tape written,tabulated data. Combined with an automatic scanner (we usually used a resolution
196

CPD2, 191–207, 2006
A guide for digitisingmanuscript climate
data
S. Bronnimann et al.
Title Page
Abstract Introduction
Conclusions References
Tables Figures
J I
J I
Back Close
Full Screen / Esc
Printer-friendly Version
Interactive Discussion
EGU
of 300 dpi in greyscale), OCR is many times faster than the other two techniques.However, we found that the error rate is normally higher. Figure 1 gives a typicalexample of an OCR’ed data table. The right panel shows the uncorrected output. Whilethe recognition of the numbers worked relatively well despite the somewhat blurredtypewriting, there are still a lot of errors that have to be corrected: shifts in the columns,5
decimal separations (points or commas), strange characters, or tiny spots on the paperthat became symbols. The correction is relatively time intensive. Many misrepresentedcharacters for any sample may be repetitively represented as the same character, butautomatic search algorithms can not easily be defined for all cases.
For one application (data were given in blocks of code rather than a table) we consid-10
ered using a scanning pen and performed a few tests. The two tested models (MyPenby C-Channel and QuickLink pen by WizCom) both were slower and produced moreerrors than other methods. However, scanning pens should certainly be considered inspecial cases.
4.2 Speech recognition and key entry15
Speech recognition and key entry share similar characteristics. They are normally usedif OCR is not possible (e.g., for hand-written or hardly legible data) or would make toomany errors, if only a small portion of the table or sheet is used, or if the data arescattered. Figures 2 and 3 give examples of data sheets where speech recognition isthe most effective method. The first example is a weather map that includes station in-20
formation, the second example is a data table that is printed in two parts, with columnsin different order. Note that in both cases, the format of the resulting spreadsheet ismuch simpler than the original layout.
We found the error rate of both methods to be smaller than for OCR. If this differencemeans that a double-check or a double entry can be avoided (see below), speech25
recognition or key entry may turn out faster than OCR.When dictating or typing directly into a spreadsheet, a template has to be created.
This should be done in such a way that it allows fast digitising, but also minimizes197

CPD2, 191–207, 2006
A guide for digitisingmanuscript climate
data
S. Bronnimann et al.
Title Page
Abstract Introduction
Conclusions References
Tables Figures
J I
J I
Back Close
Full Screen / Esc
Printer-friendly Version
Interactive Discussion
EGU
later reformatting (e.g. transpose rows into columns, skip lines, merge columns directlywhen speaking or typing, see Figs. 2 and 3). This can be an advantage over OCR,which reproduces the layout of the source (including all of the frequent changes ofreporting). The range of the numbers accepted can be constrained in the worksheetsettings, so that a large fraction of the errors can already be excluded when speaking5
or typing.Whether speech recognition or key entry works better also depends on the person
doing it. Some would get tired faster (and thus make more errors and be slower) whenkey punching the data. Speech recognition is probably faster and easier for persons notused to key entry because it allows you to fully concentrate on the manuscript sheet.10
In the cases shown in Figs. 2 and 3, speech recognition allows using the fingers ofboth hands to keep track. Also, the spoken commands (e.g., “seven lines down”) havesome advantages. A frequent error (when digitising in German) was that the softwareconfounded 14 (“vierzehn”) with 4 10 (“vier zehn”), which in the worksheet became 410.We found similar problems while digitizing in English, but these problems varied from15
person to person. Speaking the ciphers individually (2-3-1 instead of 231) reduces theerror, but is slower.
Provided that the hardware is good (computer, sound card), the software can keeppace with any reasonable speed of speaking. The numbers are stored in a buffer andwritten to the spreadsheet during a breathing pause. We find that a trained speaker20
can digitise around 2400 5-digit numbers with speech recognition in a 2-h period. Thatincludes the correction of visually (in the work sheet) apparent errors, but not a sys-tematic error correction. We found, after two hours of digitising, attentiveness usuallydropped and the error rate increased. One of us had problems with a sore throat.
Key entry has its own advantages and drawbacks. While for a trained, fast-typing25
person, the speed can be similar to speech recognition, someone who is merely a fasttypist but not experienced in 10-key entry, the error rate can be high. Similar attentiveissues occur as for speech recognition. Errors tend to include both keying mistakesand duplication or skipping of a line of data. The latter error is aggravated by having
198

CPD2, 191–207, 2006
A guide for digitisingmanuscript climate
data
S. Bronnimann et al.
Title Page
Abstract Introduction
Conclusions References
Tables Figures
J I
J I
Back Close
Full Screen / Esc
Printer-friendly Version
Interactive Discussion
EGU
paper sheets to work from (rather than a digital image which can often be lined upto match the key punch template on the computer screen). Some people developrepetitive stress injuries. Outsourcing to data entry professionals is also an option.Many firms offer guarantees of 99.9% accuracy or higher, generally achieved throughdouble keying. In some cases using a professional, who has no information about5
what the data represents, can be a drawback. For example, if the data being keyed istemperature and dew point, someone familiar with atmospheric variables will know thatdew point is lower than (or equal to) temperature and will be able to correctly deciphersemi-illegible numbers more often than someone without that knowledge.
4.3 Correcting and formatting10
After digitising, the data must normally be reformatted. In the case of OCR, a largenumber of individual tables must be concatenated or sorted. There are often layoutchanges, so that this step must be done carefully. In the case of key entry and speechrecognition, this step may be mostly done during data entry simply by choosing anappropriate template beforehand (see Fig. 3). This has to be considered when deter-15
mining the overall speed of the different methods.In the next step the data need to be tested and errors corrected. Double entry (hav-
ing two persons digitising the same data and then comparing the differences) or adouble check (checking each number) are the best ways of avoiding digitising errors.However, resources for this step are often not available, or not justified due to a high20
risk of a “no result”, and in the case of OCR, double “entry” may not offer any ad-vantage since the software algorithm is static. If one decides for a double check (ordouble entry), then choosing the fastest method (regardless of the error rate) mightgive the best overall benefit. Otherwise choosing the method that produces the fewesterrors may help avoiding a double check. In the case of our upper-air data (tempera-25
ture and pressure from historical radio soundings; a high-risk data set with redundantinformation) we decided not to double check the data but used the redundancy withinthe measurements to find errors. We plotted correlated variables (e.g., temperature at
199

CPD2, 191–207, 2006
A guide for digitisingmanuscript climate
data
S. Bronnimann et al.
Title Page
Abstract Introduction
Conclusions References
Tables Figures
J I
J I
Back Close
Full Screen / Esc
Printer-friendly Version
Interactive Discussion
EGU
neighbouring levels) against each other, or the thickness between two layers againsttheir mean temperature (hydrostatic check). This sequence of tests proved sufficient todetect even small errors (some digitising errors, some errors in the originally recordeddata) with statistical techniques, but it took clearly more time for OCR’ed data than forthose stemming from speech recognition or key entry. After this procedure, we period-5
ically tested samples of 1000 randomly selected numbers. In total, around 25 sampleswere tested, and the number of errors was between 1 and 10 in all cases. Hence, theerror rate after this step was clearly less than 1% (0.5% on average) and the errorsmostly concerned the least significant digit. This was sufficient compared to our qualityrequirements.10
In the case of the Mount Washington data (Grant et al., 2005), we found keyingerror rates of around 0.2% to 3% depending on the person doing it. After the qualityassurance procedures the error rate was 0.2% or less, but the latter procedure includeda manual check of almost all the keyed entries which was very time consuming andprobably not worth the small increment in error rate.15
5 Summary
In order to optimise the overall goals, i.e., to digitise the data correctly, quickly, andinexpensively and to preserve the meta data, considering the following questions mightsave time and trouble:
1. What fraction of the available data is needed? What are the available resources?20
Include the data quality, redundancy, and validation options in any cost-benefitanalysis.
2. What is the expected error and what is the required quality? Is a double entryor double check possible or necessary? If yes, use fastest method. If no, usemethod with fewest possible errors (key entry or speech recognition better than25
OCR) or optimise quality assurance.
200
CPD2, 191–207, 2006
A guide for digitisingmanuscript climate
data
S. Bronnimann et al.
Title Page
Abstract Introduction
Conclusions References
Tables Figures
J I
J I
Back Close
Full Screen / Esc
Printer-friendly Version
Interactive Discussion
EGU
3. Is enough information available in order to prepare the stay in the archive (i.e.,thorough literature research, enough sample copies or scans, assessment of leg-ibility, test of reproduction methods, test of digitising methods)?
4. Are the data printed (OCR), type written (OCR) or hand written (speech recogni-tion or key entry)?5
5. Are the data organised in tables (OCR) or scattered (speech recognition or keyentry, possibly scanning pen)?
6. Is the whole table needed (OCR) or just small excerpts (speech recognition or keyentry)?
7. Are the numbers clearly legible (OCR) or faint (speech recognition or key entry)?10
Acknowledgements. This work was funded by the Swiss National Science Foundation. Wewould like to thank all archive staff we had the pleasure to meet during our project.
Sources
Deutsche Seewarte: Taglicher Wetterbericht, Ubersicht uber die Hohenaufstiege,Hamburg, January, 1939.15
Reichsamt fur Wetterdienst: Aerologische Berichte, Zusammenstellungen vondeutschen aerologischen Messungen, Monthly issues, Parts I and II, 1935.
References
Bronnimann, S.: A historical upper-air data set for the 1939–1944 period, Int. J. Climatol., 23,769–791, 2003.20
Bronnimann, S., Compo, G. P., Sardeshmukh, P. D., Jenne, R., and Sterin A.: New approachesfor extending the 20th century climate record, Eos, Trans. AGU, 86, 2–7, 2005.
201
CPD2, 191–207, 2006
A guide for digitisingmanuscript climate
data
S. Bronnimann et al.
Title Page
Abstract Introduction
Conclusions References
Tables Figures
J I
J I
Back Close
Full Screen / Esc
Printer-friendly Version
Interactive Discussion
EGU
Grant, A. N., Pszenny, A. A. P., and Fischer E. V.: The 1935–2003 Air Temperature Recordfrom the Summit of Mount Washington, New Hampshire, J. Clim., 18, 4445–4453, 2005.
Jones, D. A. and Trewin, B.: On the adequacy of digitised historical Australian daily temperaturedata for climate monitoring, Austral. Meteorol. Mag., 51, 237–250, 2002.
Vogler, C., Bronnimann, S., and Hansen, G.: Re-evaluation of the 1950–1962 total ozone5
record from Longyearbyen, Svalbard, Atmos. Chem. Phys. Discuss., in press, 2006.
202

CPD2, 191–207, 2006
A guide for digitisingmanuscript climate
data
S. Bronnimann et al.
Title Page
Abstract Introduction
Conclusions References
Tables Figures
J I
J I
Back Close
Full Screen / Esc
Printer-friendly Version
Interactive Discussion
EGU
Table 1. Characteristics of the data to be digitised and their relation to the requirements of theplanned scientific application.
Formal
Source format Original (hardbound, loose sheets, etc.),carbon copy, photocopy, photograph, mi-crofilm, image file
Information type Numeric, text, code, graphical
Information format Table, text, map, graph, mixture
Typing Printed, typewritten, hand written
Legibility Clear, faint, strike through, blurred, correc-tions on top of each other etc.
Informational
Data needed Choice of stations, time periods, alternativesources
Quality Expected quality with respect to requiredaccuracy/precision
Redundancy Possibilities to check quality and consis-tency, validation
Meta information What is available? How valuable? Howarchived?
203

CPD2, 191–207, 2006
A guide for digitisingmanuscript climate
data
S. Bronnimann et al.
Title Page
Abstract Introduction
Conclusions References
Tables Figures
J I
J I
Back Close
Full Screen / Esc
Printer-friendly Version
Interactive Discussion
EGU
Table 2. Characteristics of the data digitising techniques. Approximate speed is in 5-digitnumbers per hour and refers to a trained person and well organised data. Note that these arerough approximations and that the actual speed may deviate considerably from these values.The qualitative assessment of error rate and post-processing is a subjective rating based onthe experience of the authors (ten persons).
Speed (num/h) Error rate Post-processing
OCR (scanner) 3000 High HighScanning Pen* 1200 Very high HighSpeech recognition 1200 Middle MiddleKey entry 1000 Low Middle
*no operational experience was gained, just limited testing.
204

CPD2, 191–207, 2006
A guide for digitisingmanuscript climate
data
S. Bronnimann et al.
Title Page
Abstract Introduction
Conclusions References
Tables Figures
J I
J I
Back Close
Full Screen / Esc
Printer-friendly Version
Interactive Discussion
EGU
Fig. 1. (left) Excerpt from “Aerologische Berichte” as an example of a data source that easilyundergoes OCR (Reichsamt fur Wetterdienst, 1935). (right) Screen shot of the spreadsheetproduced by OmniPage Pro 14.
205

CPD2, 191–207, 2006
A guide for digitisingmanuscript climate
data
S. Bronnimann et al.
Title Page
Abstract Introduction
Conclusions References
Tables Figures
J I
J I
Back Close
Full Screen / Esc
Printer-friendly Version
Interactive Discussion
EGU
Fig. 2. (left) Map of the 500/1000 hPa thickness that includes handwritten station data (fromTaglicher Wetterbericht, Deutsche Seewarte, 22 May 1939). (right) Screen shot of the corre-sponding spreadsheet time series per station in columns. In this case, data from three stationsare digitised. The layout is complex and only a fraction of the information is needed. Speechrecognition allows using the fingers of both hands to track the data on the weather map whiledigitising and at the same time produces a suitable data format.
206

CPD2, 191–207, 2006
A guide for digitisingmanuscript climate
data
S. Bronnimann et al.
Title Page
Abstract Introduction
Conclusions References
Tables Figures
J I
J I
Back Close
Full Screen / Esc
Printer-friendly Version
Interactive Discussion
EGU
Fig. 3. (left) Table with handwritten aerological data in two parts, from Taglicher Wetterbericht(Deutsche Seewarte, 3 January 1939). (right) Screen shot of the corresponding spreadsheet.The data table is split into two parts and the columns are not in the same order in both tables.Speech recognition allows using the fingers of both hands to keep track on the paper sheetwhile digitising and thus allows reformatting the data into a suitable format in the same step.The speaker starts with field A in the lower part of the table, then moves up to B in the upperpart of the table, then C and D. The time required for digitising one record in this way is notmuch longer than if it were in a well-organised format. Even if the numbers could be decipheredwith OCR (which is not the case here), concatenating the different parts of the table would takea lot of time. 207