Embed Size (px)
Citation preview
PREPARING FOR CLIMATE CHANGEA Guidebook for Local, Regional, and State Governments
With an introduction by King County Executive Ron Sims
Written byCenter for Science in the Earth System (The Climate Impacts Group)Joint Institute for the Study of the Atmosphere and OceanUniversity of Washington
King County, Washington
In association with

�
Prepar�ng for Cl�mate Change: A Gu�debook for Local,
Reg�onal, and State Governments
Written by
Center for Science in the Earth System (The Climate Impacts Group)Joint Institute for the Study of the Atmosphere and Ocean
University of Washingtonand
King County, Washington
In association with
ICLEI – Local Governments for Sustainability
With an introduction by King County Executive Ron Sims
September 2007

��
© 2007 The Climate Impacts Group, King County, Washington, and ICLEI – Local Governments for Sustainability. All rights reserved.
iii
acknowledgementsThe writing team for this guidebook consisted of the following individuals at the Climate Impacts Group, King County, Washington, and ICLEI – Local Governments for Sustainability.
Climate Impacts Group:Dr. Amy K. Snover, Research Scientist and Assistant Director to the Center for Science in the Earth System
Lara C. Whitely Binder, Outreach Specialist
Dr. Jennifer Kay, postdoctoral research fellow, Climate and Global Dynamics (CGD) division of the National Center for Atmospheric Research (NCAR)
King County, Washington:Ron Sims, Executive, King County, Washington
Jim Lopez, Deputy Chief of Staff, King County Executive Office
Elizabeth Willmott, Global Warming Coordinator, King County Executive Office
ICLEI – Local Governments for Sustainability:Michelle Wyman, Executive Director of ICLEI – Local Governments for Sustainability – USA
Margit Hentschel, Regional Director, Western States, ICLEI – Local Governments for Sustainability – USA
Annie Strickler, Communications Director of ICLEI – Local Governments for Sustainability – USA
Special thanks to: Josh Foster and the National Oceanic and Atmospheric Administration’s Climate Program Office for funding that has made this collaboration possible; Bruce Laing, Kurt Triplett, Pam Bissonnette, Don Theiler, Bob Burns, and many others in King County government whose public service over the years has provided the foundation for this guidebook; Dr. Edward Miles for his role in establishing the Climate Impacts Group as an internationally recognized institution of climate science and public policy advice; Doug Howell, Washington State Senator Erik Poulsen, and Jim Simmonds for their early contributions to the guidebook; Becky Spithill and Sheila Roehm for their editorial suggestions and support; Rich Hoey, Danielle Harrington, Vince McGowan and Dorothy Craig, staff and consultants from the City of Olympia, Washington, for a summary of Olympia’s activities related to climate change; Dr. Jennifer Penney of Toronto’s Clean Air Partnership for an adapted version of that organization’s report, Cities Preparing for Climate Change: A Study of Six Urban Regions; and Wendy Gable Collins of King County’s Department of Natural Resources and Parks for design and layout.
The writing team is indebted to all of the reviewers listed below. This list includes the officials and staff of local, regional, and state governments who are on the front lines of preparing for climate change impacts, and climate science experts at NOAA-funded Regional Integrated Systems Assessment (RISA) branches across the United States.
PREPARING FOR CLIMATE CHANGE�v
Reviewers:Dr. Cheryl L Anderson, Director, Hazards, Climate & Environment Program, University of Hawaii Social Science Research Institute
Anne Biklé, Environmental Planner, Seattle-King County Department of Public Health
Dr. Kirstin Dow, Associate Professor, Department of Geography, University of South Carolina
Dr. Greg Carbone, Associate Professor, Department of Geography, University of South Carolina
Amanda Eichel, Climate Protection Advisor, City of Seattle Office of Sustainability and the Environment
Mikaela L. Engert, City Planner, City of Keene, New Hampshire
Paul Fleming, Seattle Public Utilities
Matthew M. Fontaine, Civil / Environmental Engineer, Herrera Environmental Consultants
Nancy Gilliam, Executive Director, Model Forest Policy Program
Angela Grout, Oceanographer, King County Department of Natural Resources and Parks
Dr. Holly Hartmann, Acting Program Manager, Climate Assessment for the Southwest (CLIMAS), Institute for the Study of Planet Earth, University of Arizona
Kathy Jacobs, Executive Director, Arizona Water Institute
Dr. Melanie Lenart, Research Associate, University of Arizona Institute for the Study of Planet Earth
Karl Pepple, Director of Environmental Programming, Mayor’s Office, City of Houston, Texas
Eric Rosenberg, Research Assistant, Department of Civil and Environmental Engineering, University of Washington
Dave Monthie, Regional Water Policy Analyst, King County Department of Natural Resources and Parks
Dr. Philip Mote, Research Scientist for the Climate Impacts Group and Washington State Climatologist
David Noble, Principal, 2degreesC
Linda Giannelli Pratt, Office of Environmental Protection and Sustainability Chief, City of San Diego Environmental Services Department
Jill Simmons, Climate Protection Program Manager, City of Seattle Office of Sustainability and the Environment
Eileen L. Shea, Director, NOAA Integrated Data and Environmental Applications Center and Member, Pacific Islands RISA Team, East-West Center, University of Hawaii
Carl Spector, Executive Director, Boston Air Pollution Control Commission
Dr. Anne C. Steinemann, Professor, Department of Civil and Environmental Engineering and the Evans School of Public Affairs, University of Washington
Clinton E. Trammel, Education Director, Model Forest Policy Program
Brad Udall, Director, Western Water Assessment, University of Colorado at Boulder
Bud Watson, Research Director, Model Forest Policy Program
Emily Young, Associate Vice President, San Diego Foundation
Suggested format for citing this publication:
Snover, A.K., L. Whitely Binder, J. Lopez, E. Willmott, J. Kay, D. Howell, and J. Simmonds. 2007. Preparing for Climate Change: A Guidebook for Local, Regional, and State Governments. In association with and published by ICLEI – Local Governments for Sustainability, Oakland, CA.
v
about the authors and the cl�mate res�l�ent commun�t�es programTM
The Climate Impacts Group at the University of Washington The Climate Impacts Group (CIG) is an interdisciplinary research group studying the impacts of natural climate variability and global climate change (“global warming”) on the U.S. Pacific Northwest. Through research and interaction with regional stakeholders, the CIG works to increase the resilience of the Pacific Northwest to fluctuations in climate. The CIG is unique in its focus on the intersection of climate science and public policy. The group performs fundamental research on climate impacts and works with Pacific Northwest planners and policy makers to apply this information to regional decision making processes.
The CIG is part of the Center for Science in the Earth System at the University of Washington’s Joint Institute for the Study of the Atmosphere and Ocean, and is one of eight Regional Integrated Sciences and Assessment (RISA) teams studying regional impacts of climate variability and climate change in the United States. The RISA program is funded by the National Oceanic and Atmospheric Administration’s Climate Program Office. CIG also receives additional financial and technical support from the University of Washington.
King County, WashingtonLocated on Puget Sound in Washington State and covering an area of 2,134 square miles, King County is nearly twice as large as the average county in the United States. With almost 1.8 million people, it also ranks as the 14th most populous county in the nation.
King County’s terrain ranges from farmland and the Cascade Mountains on the east side to Puget Sound and urban coastline on the west side. King County’s rural and metropolitan areas are vulnerable to many projected climate change impacts, including declining mountain snowpack (which is directly linked to water supplies), increased risk of drought, sea level rise, and increased flooding in coastal and freshwater river systems.
King County provides regional services to all residents of the county, including people who live in cities. These include courts and related legal services, public health services, the county jail, records and elections, property tax appraisals and regional parks and facilities, including the King County International Airport (Boeing Field). The county government also has responsibility for public transit and sewage disposal. The King County Executive is the elected executive officer of county government, and the Metropolitan King County Council is the elected legislative body of county government.
Now in his third term as King County Executive, Ron Sims has built his career in public service around the progressive principles of environmental stewardship, social justice, and good government. He has a national reputation for boldness and vision, and has an established record of environmental protection. In early 2007, under his leadership, King County’s Executive Action Group on Climate Change released its inaugural climate plan, which included aggressive strategies to reduce greenhouse gas emissions from government operations and the region, as well as practical steps to make the region more resilient to projected climate change impacts. He has been honored with the Sierra Club’s prestigious 2006 Edgar Wayburn Award, which celebrates outstanding service to the environment by a person in government, Governing Magazine’s 2006 national Public Official of the Year award, and the United States Environmental Protection Agency’s 2007 Climate Protector Award.
PREPARING FOR CLIMATE CHANGEvi
ICLEI – Local Governments for Sustainability and the Climate Resilient Communities Program™ ICLEI – Local Governments for Sustainability is an international association of almost 1,000 local governments worldwide and more than 250 in the United States that have made commitments to sustainable development and climate protection. ICLEI, founded in 1990 as the International Council on Local Environmental Initiatives and now known officially as ICLEI – Local Governments for Sustainability, strives to advance solutions to global climate change through cumulative local action. ICLEI provides technical and policy assistance, software training, climate expertise, information services and peer networking to help members build capacity, share knowledge and implement sustainable development and climate protection at the local level.
In 1993, ICLEI launched its Cities for Climate Protection Campaign© to assist local and regional governments in adopting policies and implementing quantifiable measures to reduce local greenhouse gas emissions, improve air quality, and enhance urban livability and sustainability. More than 800 local governments participate in the Cities for Climate Protection Campaign and have begun to integrate sustainability and climate change mitigation into their decision-making processes. ICLEI runs this highly successful and widely recognized campaign either regionally or nationally in Australia, Canada, Europe, Japan, Latin America, Mexico, New Zealand, South Africa, South Asia, Southeast Asia, and the United States. The campaign is based on an innovative performance framework structured around five milestones that local governments commit to undertake. The milestones allow local governments to understand how municipal decisions affect energy use and how these decisions can be used to mitigate global climate change while improving community quality of life.
In fall 2005, ICLEI launched its Climate Resilient Communities Program with funding from the National Oceanic and Atmospheric Administration (NOAA) to help local governments throughout the United States improve their resiliency to climate change impacts. The Climate Resilient Communities Program helps local governments develop tools to protect their communities from the impacts and costs associated with climate change. Program participants learn to use tools and develop strategies that reduce hazards and manage risks related to regulations, planning, urban design, and investments. The program also helps communities identify and pursue creative opportunities that arise from change. Early partners have included: Keene, New Hampshire; Fort Collins, Colorado; Anchorage, Alaska; Miami-Dade County, Florida; and Homer, Alaska.
As in the Cities for Climate Protection Campaign framework, local and regional governments in the Climate Resilient Communities Program can measure their progress according to five milestones of preparedness. The Five Milestones – 1) Initiate a climate resiliency effort, 2) Conduct a climate resiliency study, 3) Set preparedness goals and develop your preparedness plan, 4) Implement your preparedness plan, and 5) Measure your progress and update your plan – are consistent with the material of this guidebook.
In addition to making this guidebook available to its members and local government leaders, ICLEI is ready to assist any municipalities that want to implement the milestones, strategies and recommendations of the guidebook. ICLEI is a leading resource for cities, towns and counties on climate mitigation and adaptation, and its growing peer network of members is an excellent venue for municipalities to communicate with one another, share best practices, and address the challenge of climate change together at the local level. To learn more about ICLEI or the Climate Resilient Communities program and to become a member, please visit http://www.iclei.org.
v��
table of contentsExecutive Summary ....................................................................................................................1
Key Terms ..................................................................................................................................5
Suggested Checklist for Governments on How to Prepare for Climate Change ...................7
Chapter 1 Take Action, Take Advantage: An Introduction by King County Executive Ron Sims ...........................................9
Chapter 2 A Scientific Overview of Climate Change and Its Impacts .................................152.1 A Brief Overview of Climate Change .................................................................. 152.2 How Warm Will The World Get? ....................................................................... 172.3 Projected National and Regional Consequences of Climate Change ................... 20
Chapter 3 The Case for Governments to Prepare for Climate Change ...............................253.1 Why Governments Cannot Wait ........................................................................ 253.2 Reasons for Local, Regional and State Governments to Be Proactive ................... 263.3 Moving Beyond Common “Barriers” .................................................................. 28
Chapter 4 Scope the Climate Change Impacts to Your Major Sectors ................................334.1 Collect and Review Important Climate Information ........................................... 33 4.1.1 Information Sources .................................................................................. 33 4.1.2 How is Climate Expected to Change in Your Region? ............................... 35 4.1.3 What are the Projected Impacts of Climate Change in Your Region? ......... 40 4.1.4 How to Work with Little Information ....................................................... 434.2 What Will Your Level of Commitment Be?......................................................... 44
Chapter 5 Build and Maintain Support to Prepare for Climate Change .............................475.1 Identify or Cultivate a “Champion” for Preparedness .......................................... 475.2 Identify and Understand Your Audience for Outreach ........................................ 485.3 Develop a Preparedness Message ......................................................................... 495.4 Spread the Message ............................................................................................. 51
Chapter 6 Build Your Climate Change Preparedness Team ..................................................556.1 Why to Form a Team .......................................................................................... 556.2 How to Select Members for Your Team ............................................................... 566.3 How to Select a Team Leader .............................................................................. 596.4 What the Team Will Do ..................................................................................... 606.5 How to Make Progress with Limited Resources: Assign a Point Person ............... 61
Chapter 7 Identify Your Planning Areas Relevant to Climate Change ................................65
Chapter 8 Conduct a Climate Change Vulnerability Assessment ........................................678.1 Review and Supplement Important Climate Information ................................... 678.2 Conduct Your Climate Sensitivity Analysis ......................................................... 68 8.2.1 Questions to Help You Analyze Degree of Sensitivity ................................ 69 8.2.2 Working with Limited Resources: Combining Resources .......................... 71 8.3 Evaluate the Adaptive Capacity Associated with Systems in Your Planning Areas ................................................................................................... 788.4 Completing the Assessment: How Vulnerable Are You to Climate Change? ........ 83
v���
Chapter 9 Conduct a Climate Change Risk Assessment .......................................................879.1 Assess Your Climate Change Risks ...................................................................... 879.2 Establish Your List of Priority Planning Areas ..................................................... 90
Chapter 10 Set Preparedness Goals and Develop Your Preparedness Plan ..........................9310.1 Establish a Vision and Guiding Principles for a Climate Resilient Community .......................................................................... 9310.2 Set Preparedness Goals ...................................................................................... 9510.3 Identify Potential Preparedness Actions ............................................................. 9710.4 Select and Prioritize Preparedness Actions ....................................................... 105
Chapter 11 Implement Your Preparedness Plan ...................................................................10911.1 Ensure that You Have the Right Implementation Tools .................................. 10911.2 Manage Uncertainty and Risk ......................................................................... 110
Chapter 12 Measure Your Progress and Update Your Plan ..................................................11312.1 Measure Your Progress .................................................................................... 11312.2 Review Your Assumptions ............................................................................... 11712.3 Update Your Plans .......................................................................................... 11812.4 Share Your Learning........................................................................................ 119
Chapter 13 Taking the Long View: Final Thoughts on Preparing for Climate Change....................................................................................................121
Chapter 14 Sources .................................................................................................................123
Appendix A. Summary of Observed Changes in the United States. ...................................129
Appendix B. Climate Change Impacts Science Primer ..........................................................133
Appendix C. U.S. National Assessment Regional Summaries ..............................................137
Appendix D. Sources of Information on Climate Change Science, Impacts, and Adaptation ..................................................................................147
�x
Figures Figure 2.1 Illustration of the Greenhouse Effect ..................................................................... 16Figure 2.2 Changes in the Atmospheric Concentration of Three Important Greenhouse Gases.................................................................................................. 18Figure 2.3 Rapid Changes in Glaciers Reveal the Impact of 20th Century Warming. ............. 19Figure 2.4 Global Temperature Projections for the 21st Century ............................................ 21Figure 2.5 Mega Regions Analyzed in the U.S. National Assessment ...................................... 23Figure 8.1 Recent and Projected Average August Surface Air Temperature in the Columbia River Basin, Compared to Temperature Thresholds for Local Salmon Populations ..................................................................................... 72Figure 8.2 Watersheds Participating in a Regional Water Supply Planning Process for the Central Puget Sound Region of Washington State ................................................. 73Figure 8.3 Inundation Levels in the City of Olympia, Washington, from Current and Projected Changes in High Tides ........................................................................... 86Figure 9.1 Sample Vulnerability-risk Matrix for Identifying Priority Planning Areas. .............. 91Figure B.1 Climate Change Impacts Science Primer: How Do Scientists Project Future Climate and Its Impact on Local Resources? ............................................ 133Figure D.5.1 Currently Funded Regional Integrated Sciences and Assessment (RISA) Teams ... 171
Tables Table 2.1 Changes in greenhouse gas concentrations between 1750 (the start of the Industrial Age) and 2005. ............................................................. 15Table 3.1 Examples of greenhouse gas lifetimes ..................................................................... 26Table 4.1 Sample summary table for projected regional climate change................................. 38Table 4.2 Sample of sectors and potential climate change impacts ......................................... 40Table 6.1 Potential participants in a climate change preparedness team. ................................ 57Table 7.1 Current and expected stresses to systems in sample planning areas of water supply, stormwater management, and road operations and maintenance ...... 66Table 8.1 Climate change sensitivity analysis for systems in sample planning areas of water supply, stormwater management, and road operations and maintenance. ..... 74Table 8.2 Evaluation of adaptive capacity in systems associated with sample planning areas of water supply, stormwater management, and road operations and maintenance. .................................................................................................. 81Table 8.3 Vulnerability assessment for systems associated with sample planning areas of water supply, stormwater management, and road operations and maintenance ...... 84Table 9.1 Qualitative risk assessment for systems associated with the sample planning areas of water supply, stormwater management, and road operations and maintenance ................................................................................................... 89Table 10.1 Sample climate change preparedness goals and actions......................................... 101Table A.1 Summary of observed changes in the United States ............................................. 129Table D.2 Institutional sources of information on climate change science, impacts, and adaptation .................................................................................................... 149Table D.3 Sources of information on climate change science ............................................... 155Table D.4 Publications on climate change impacts and adaptation ....................................... 159Table D.5.1 Regional Integrated Sciences and Assessments (RISA) Program Teams ................ 172
x
BoxesBox 2.1 Who is the Intergovernmental Panel on Climate Change (IPCC)? ........................ 17Box 2.2 What Is the Difference between Climate Projections and Climate Predictions? ...... 20Box 3.1 Examples of Early Preparedness Efforts .................................................................. 32Box 4.1 I’m Not an Expert. How Can I Evaluate the Credibility of a Source? ..................... 34Box 5.1 “The Future Ain’t What It Used to Be: Planning for Climate Disruption” – The King County Climate Change Conference ..................................................... 52Box 6.1 Questions to Consider When Establishing a Climate Change Preparedness Team................................................................................................. 56Box 6.2 Tips for Selecting Science Advisors ....................................................................... 58Box 6.3 Case Study: King County’s Climate Change Preparedness Teams .......................... 62Box 8.1 Issues to Consider When Beginning a Vulnerability Assessment ............................ 68Box 8.2 Addressing Climate Change in a Regional Water Supply Planning Process in the Central Puget Sound Region of Washington State ............ 73Box 8.3 King County Questionnaire for Preliminary Assessment of Climate Change Impacts and Adaptation Barriers ................................................. 82Box 8.4 Case study: Assessing Vulnerability to Sea Level Rise in the City of Olympia, Washington ............................................................................... 85Box 9.1 Risk Perception and Risk Tolerance ....................................................................... 88Box 10.1 Illustrations of Climate Change Preparedness Goals .............................................. 96Box 10.2 Adapting to Climate Change: Lessons for London .............................................. 100Box 11.1 Common Implementation Tools for Climate Change Preparedness Actions ........ 109
�
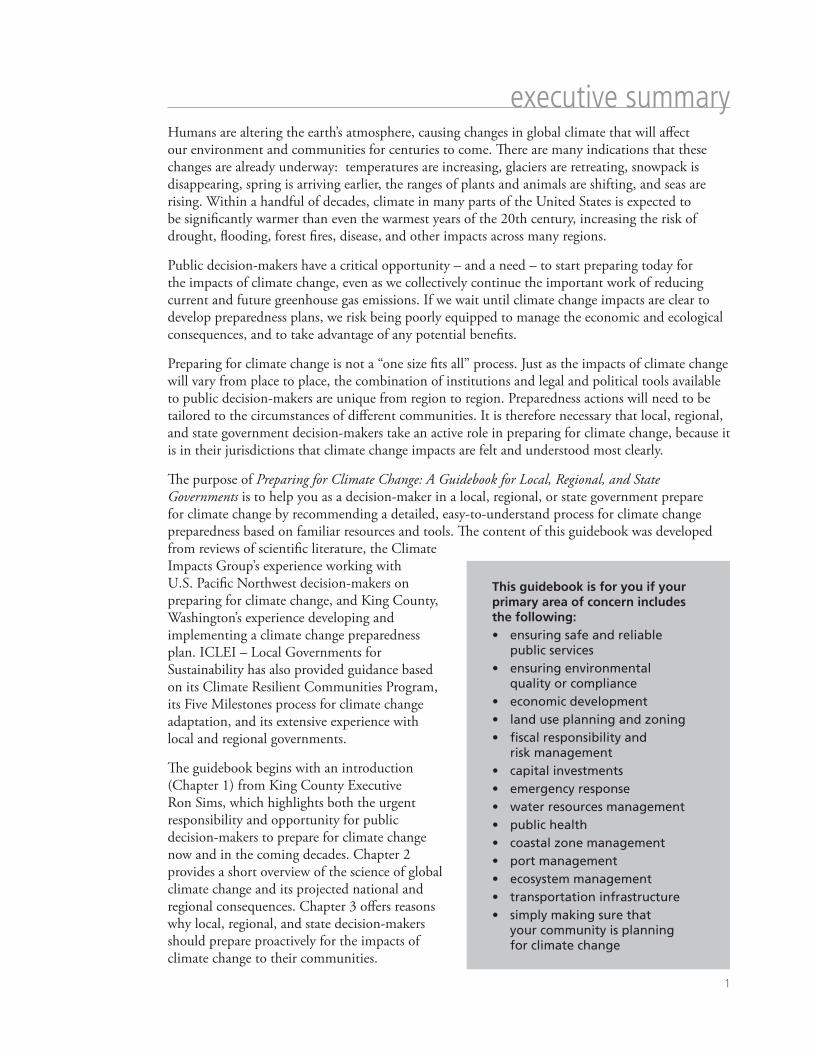
execut�ve summary Humans are altering the earth’s atmosphere, causing changes in global climate that will affect our environment and communities for centuries to come. There are many indications that these changes are already underway: temperatures are increasing, glaciers are retreating, snowpack is disappearing, spring is arriving earlier, the ranges of plants and animals are shifting, and seas are rising. Within a handful of decades, climate in many parts of the United States is expected to be significantly warmer than even the warmest years of the 20th century, increasing the risk of drought, flooding, forest fires, disease, and other impacts across many regions.
Public decision-makers have a critical opportunity – and a need – to start preparing today for the impacts of climate change, even as we collectively continue the important work of reducing current and future greenhouse gas emissions. If we wait until climate change impacts are clear to develop preparedness plans, we risk being poorly equipped to manage the economic and ecological consequences, and to take advantage of any potential benefits.
Preparing for climate change is not a “one size fits all” process. Just as the impacts of climate change will vary from place to place, the combination of institutions and legal and political tools available to public decision-makers are unique from region to region. Preparedness actions will need to be tailored to the circumstances of different communities. It is therefore necessary that local, regional, and state government decision-makers take an active role in preparing for climate change, because it is in their jurisdictions that climate change impacts are felt and understood most clearly.
The purpose of Preparing for Climate Change: A Guidebook for Local, Regional, and State Governments is to help you as a decision-maker in a local, regional, or state government prepare for climate change by recommending a detailed, easy-to-understand process for climate change preparedness based on familiar resources and tools. The content of this guidebook was developed from reviews of scientific literature, the Climate Impacts Group’s experience working with U.S. Pacific Northwest decision-makers on preparing for climate change, and King County, Washington’s experience developing and implementing a climate change preparedness plan. ICLEI – Local Governments for Sustainability has also provided guidance based on its Climate Resilient Communities Program, its Five Milestones process for climate change adaptation, and its extensive experience with local and regional governments.
The guidebook begins with an introduction (Chapter 1) from King County Executive Ron Sims, which highlights both the urgent responsibility and opportunity for public decision-makers to prepare for climate change now and in the coming decades. Chapter 2 provides a short overview of the science of global climate change and its projected national and regional consequences. Chapter 3 offers reasons why local, regional, and state decision-makers should prepare proactively for the impacts of climate change to their communities.
This guidebook is for you if your primary area of concern includes the following:
ensuring safe and reliable public servicesensuring environmental quality or complianceeconomic developmentland use planning and zoningfiscal responsibility and risk managementcapital investmentsemergency responsewater resources managementpublic healthcoastal zone managementport managementecosystem managementtransportation infrastructuresimply making sure that your community is planning for climate change
•
•
•••
•••••••••
PREPARING FOR CLIMATE CHANGE�
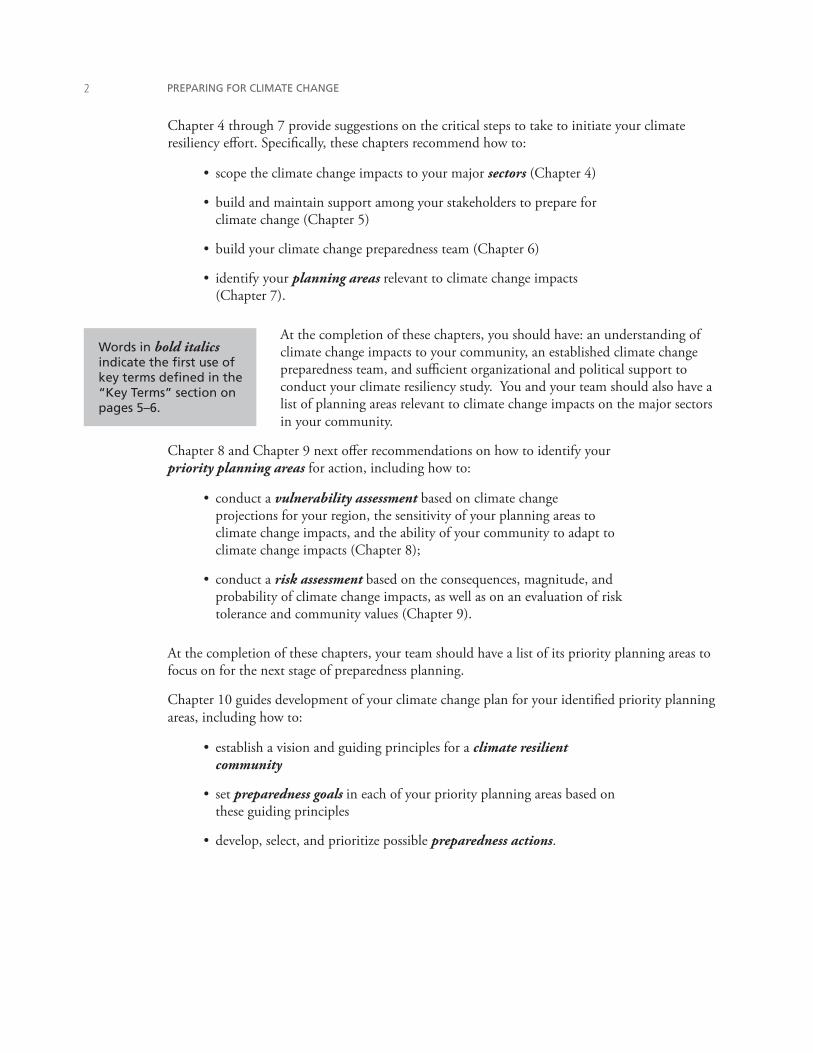
Chapter 4 through 7 provide suggestions on the critical steps to take to initiate your climate resiliency effort. Specifically, these chapters recommend how to:
scope the climate change impacts to your major sectors (Chapter 4)
build and maintain support among your stakeholders to prepare for climate change (Chapter 5)
build your climate change preparedness team (Chapter 6)
identify your planning areas relevant to climate change impacts (Chapter 7).
At the completion of these chapters, you should have: an understanding of climate change impacts to your community, an established climate change preparedness team, and sufficient organizational and political support to conduct your climate resiliency study. You and your team should also have a list of planning areas relevant to climate change impacts on the major sectors in your community.
Chapter 8 and Chapter 9 next offer recommendations on how to identify your priority planning areas for action, including how to:
conduct a vulnerability assessment based on climate change projections for your region, the sensitivity of your planning areas to climate change impacts, and the ability of your community to adapt to climate change impacts (Chapter 8);
conduct a risk assessment based on the consequences, magnitude, and probability of climate change impacts, as well as on an evaluation of risk tolerance and community values (Chapter 9).
At the completion of these chapters, your team should have a list of its priority planning areas to focus on for the next stage of preparedness planning.
Chapter 10 guides development of your climate change plan for your identified priority planning areas, including how to:
establish a vision and guiding principles for a climate resilient community
set preparedness goals in each of your priority planning areas based on these guiding principles
develop, select, and prioritize possible preparedness actions.
•
•
•
•
•
•
•
•
•
Words in bold italics indicate the first use of key terms defined in the “Key Terms” section on pages 5–6.
A GUIDEBOOK FOR LOCAL, REGIONAL, AND STATE GOVERNMENTS �
At the completion of these chapters, your team should be able to publish a cohesive climate change preparedness plan based on the series of preparedness goals and actions developed in your selected priority planning areas. Chapter 11 then guides you on implementing your climate change preparedness plan, including how to:
identify a list of important implementation tools
develop an understanding of how to manage risk and uncertainty in your planning effort.
Chapter 12 guides you on measuring your progress and updating your plans, including how to:
develop measures of resilience, and use these to track the results of your actions over time
review your assumptions and other essential information to ensure that your work remains relevant to your community’s most salient climate change impacts
update your plans regularly.
At the close of the chapter, you should have a list of measures of resilience for your team’s work and an understanding of how and when to update your plan. Chapter 13 provides final thoughts on how to prepare for climate change effectively and establish a lasting positive influence.
Finally, the appendices provide valuable supporting information, including: summaries of observed changes in the United States; a science primer of climate change impacts; summaries from the U.S. National Assessment Synthesis Team’s reports on climate change impacts in regions and native homelands of the United States; and a current list of additional resources on climate change science, impacts, and preparedness.
For governments intending to mark their progress in use of this guidebook, a checklist that captures the major milestones of the process can be found at the front of this guidebook. In general, the steps and milestones of this checklist are consistent with the guidebook’s chapter headings, as well as the Five Milestones process of ICLEI - Local Governments for Sustainability’s Climate Resilient Communities Program.
It is important to note that the guidebook’s preparedness process can be tailored for implementation across communities, within a single community, or even within an individual agency or department in the United States or elsewhere. You may also choose to tailor the process based on your resource availability or other factors; strategies for working with limited resources are offered at various points in the guidebook. Finally, although the guidebook is written for local, regional, and state governments in the United States, the fundamental principles of the guidebook can also be applied in tribal governments, non-governmental organizations, and private sector businesses sensitive to climate variability and change.
•
•
•
•
•

PREPARING FOR CLIMATE CHANGE�
�
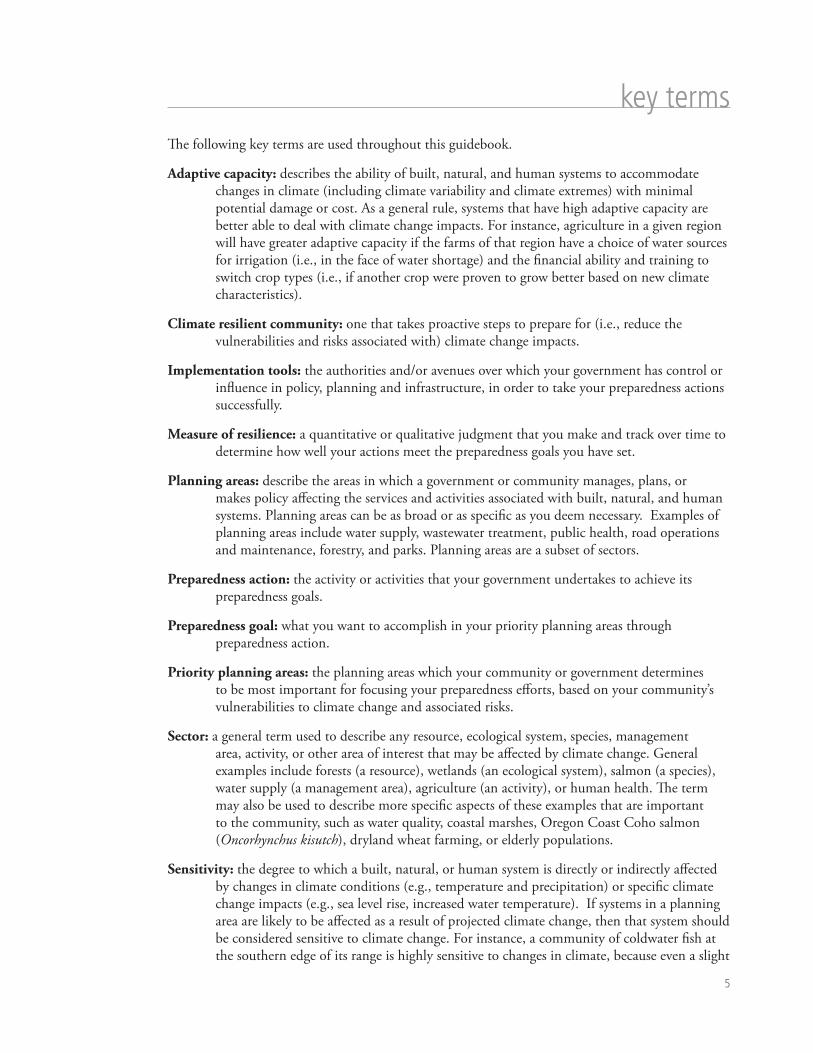
key termsThe following key terms are used throughout this guidebook.
Adaptive capacity: describes the ability of built, natural, and human systems to accommodate changes in climate (including climate variability and climate extremes) with minimal potential damage or cost. As a general rule, systems that have high adaptive capacity are better able to deal with climate change impacts. For instance, agriculture in a given region will have greater adaptive capacity if the farms of that region have a choice of water sources for irrigation (i.e., in the face of water shortage) and the financial ability and training to switch crop types (i.e., if another crop were proven to grow better based on new climate characteristics).
Climate resilient community: one that takes proactive steps to prepare for (i.e., reduce the vulnerabilities and risks associated with) climate change impacts.
Implementation tools: the authorities and/or avenues over which your government has control or influence in policy, planning and infrastructure, in order to take your preparedness actions successfully.
Measure of resilience: a quantitative or qualitative judgment that you make and track over time to determine how well your actions meet the preparedness goals you have set.
Planning areas: describe the areas in which a government or community manages, plans, or makes policy affecting the services and activities associated with built, natural, and human systems. Planning areas can be as broad or as specific as you deem necessary. Examples of planning areas include water supply, wastewater treatment, public health, road operations and maintenance, forestry, and parks. Planning areas are a subset of sectors.
Preparedness action: the activity or activities that your government undertakes to achieve its preparedness goals.
Preparedness goal: what you want to accomplish in your priority planning areas through preparedness action.
Priority planning areas: the planning areas which your community or government determines to be most important for focusing your preparedness efforts, based on your community’s vulnerabilities to climate change and associated risks.
Sector: a general term used to describe any resource, ecological system, species, management area, activity, or other area of interest that may be affected by climate change. General examples include forests (a resource), wetlands (an ecological system), salmon (a species), water supply (a management area), agriculture (an activity), or human health. The term may also be used to describe more specific aspects of these examples that are important to the community, such as water quality, coastal marshes, Oregon Coast Coho salmon (Oncorhynchus kisutch), dryland wheat farming, or elderly populations.
Sensitivity: the degree to which a built, natural, or human system is directly or indirectly affected by changes in climate conditions (e.g., temperature and precipitation) or specific climate change impacts (e.g., sea level rise, increased water temperature). If systems in a planning area are likely to be affected as a result of projected climate change, then that system should be considered sensitive to climate change. For instance, a community of coldwater fish at the southern edge of its range is highly sensitive to changes in climate, because even a slight
PREPARING FOR CLIMATE CHANGE�
warming may make its habitat unsuitable. In turn, regional economies based on fisheries solely targeting those fish would also be highly sensitive to changes in climate.
Systems: refer to the built, natural, and human networks that provide important services or activities within a community or region. Built systems can refer to networks of facilities, buildings, and transportation infrastructure such as roads and bridges. Natural systems can refer to ecological networks of fish, wildlife, and natural resources like water. Human systems can refer to networks of public health clinics, courts, and government.
Vulnerability: the susceptibility of a system to harm from climate change. Vulnerability is a function of a system’s sensitivity to climate and the capacity of that system to adapt to climate changes. In other words, systems that are sensitive to climate and less able to adapt to changes are generally considered to be vulnerable to climate change impacts. For example, coral reefs are vulnerable to damage from climate change, as they are sensitive to changes in climate and have limited capacity to adapt to those changes.
�
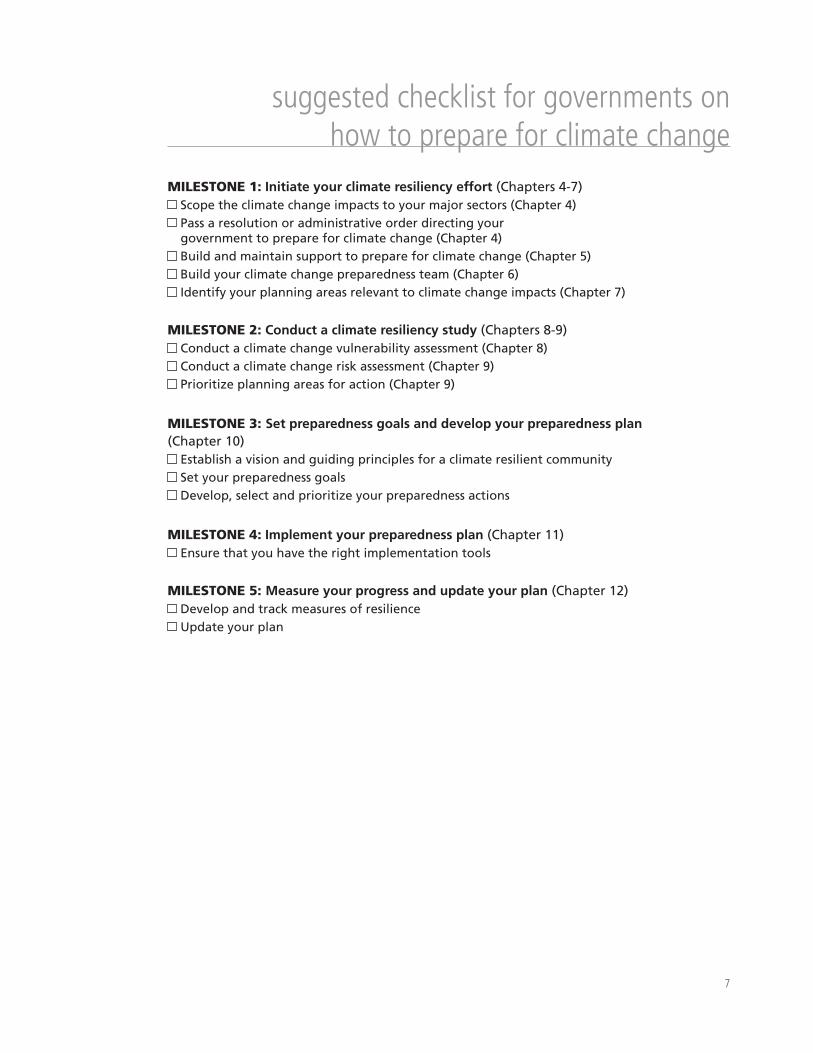
suggested checkl�st for governments on how to prepare for cl�mate change
MILESTONE 1: Initiate your climate resiliency effort (Chapters 4-7)
Scope the climate change impacts to your major sectors (Chapter 4) Pass a resolution or administrative order directing your government to prepare for climate change (Chapter 4)
Build and maintain support to prepare for climate change (Chapter 5) Build your climate change preparedness team (Chapter 6) Identify your planning areas relevant to climate change impacts (Chapter 7)
MILESTONE 2: Conduct a climate resiliency study (Chapters 8-9) Conduct a climate change vulnerability assessment (Chapter 8) Conduct a climate change risk assessment (Chapter 9) Prioritize planning areas for action (Chapter 9)
MILESTONE 3: Set preparedness goals and develop your preparedness plan (Chapter 10)
Establish a vision and guiding principles for a climate resilient community Set your preparedness goals Develop, select and prioritize your preparedness actions
MILESTONE 4: Implement your preparedness plan (Chapter 11) Ensure that you have the right implementation tools
MILESTONE 5: Measure your progress and update your plan (Chapter 12) Develop and track measures of resilience Update your plan

PREPARING FOR CLIMATE CHANGE�
�
chapter � take act�on, take advantage: an �ntroduct�on by
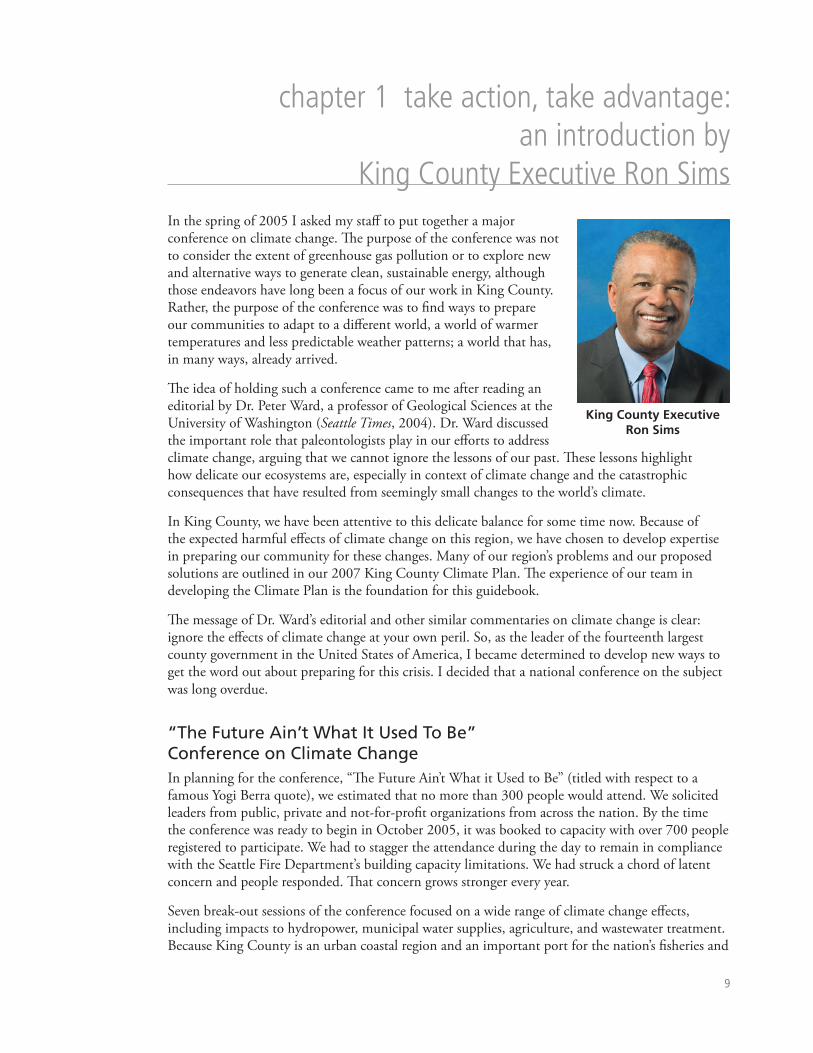
K�ng County Execut�ve Ron S�ms In the spring of 2005 I asked my staff to put together a major conference on climate change. The purpose of the conference was not to consider the extent of greenhouse gas pollution or to explore new and alternative ways to generate clean, sustainable energy, although those endeavors have long been a focus of our work in King County. Rather, the purpose of the conference was to find ways to prepare our communities to adapt to a different world, a world of warmer temperatures and less predictable weather patterns; a world that has, in many ways, already arrived.
The idea of holding such a conference came to me after reading an editorial by Dr. Peter Ward, a professor of Geological Sciences at the University of Washington (Seattle Times, 2004). Dr. Ward discussed the important role that paleontologists play in our efforts to address climate change, arguing that we cannot ignore the lessons of our past. These lessons highlight how delicate our ecosystems are, especially in context of climate change and the catastrophic consequences that have resulted from seemingly small changes to the world’s climate.
In King County, we have been attentive to this delicate balance for some time now. Because of the expected harmful effects of climate change on this region, we have chosen to develop expertise in preparing our community for these changes. Many of our region’s problems and our proposed solutions are outlined in our 2007 King County Climate Plan. The experience of our team in developing the Climate Plan is the foundation for this guidebook.
The message of Dr. Ward’s editorial and other similar commentaries on climate change is clear: ignore the effects of climate change at your own peril. So, as the leader of the fourteenth largest county government in the United States of America, I became determined to develop new ways to get the word out about preparing for this crisis. I decided that a national conference on the subject was long overdue.
“The Future Ain’t What It Used To Be” Conference on Climate ChangeIn planning for the conference, “The Future Ain’t What it Used to Be” (titled with respect to a famous Yogi Berra quote), we estimated that no more than 300 people would attend. We solicited leaders from public, private and not-for-profit organizations from across the nation. By the time the conference was ready to begin in October 2005, it was booked to capacity with over 700 people registered to participate. We had to stagger the attendance during the day to remain in compliance with the Seattle Fire Department’s building capacity limitations. We had struck a chord of latent concern and people responded. That concern grows stronger every year.
Seven break-out sessions of the conference focused on a wide range of climate change effects, including impacts to hydropower, municipal water supplies, agriculture, and wastewater treatment. Because King County is an urban coastal region and an important port for the nation’s fisheries and
King County Executive Ron Sims
PREPARING FOR CLIMATE CHANGE�0
maritime trade, we also convened experts on sea level rise, shoreline impacts, and consequences to fish and shellfish. Participants were hungry to receive both practical real life strategies as well broad based policy ideas, and we started those conversations.
The media was also very engaged. In the same month as the conference, a story broke that explained in some detail how the Pacific Northwest would be a region significantly impacted by the effects of climate change (Seattle Times October 9, 2005). The conference was then covered by Seattle’s major daily papers as well as a national news wire (Seattle Times October 28, 2005; Associated Press October 28, 2005).
Our keynote speaker was former New Jersey Governor and U.S. Environmental Protection Agency Administrator Christine Todd Whitman, who expressed that meaningful federal limits on greenhouse gases were a necessary component of an overall emissions reduction program. She spoke eloquently of the role that local municipalities and states can and must play in the battle against climate change. I could not agree more.
The conference has had ripple effects that we keep seeing even now. At the close of the event we were flooded with requests to make the information discussed at the plenary and break-out sessions available on the King County website. The conference also served as the impetus for the State of Washington to commission a report on the economic impacts of climate change to water supplies, forestry, fisheries, agriculture and other sectors important to Washington’s economy.
Perhaps most importantly, the idea for this guidebook was born from the great enthusiasm for additional knowledge, collaborative strategies, and shared resources that flowed from this conference. Soon after the conference ended, we gathered a climate team made up of county employees to start planning for climate change, and to record our experiences in this guidebook. Then, working with our conference partners from the Climate Impacts Group at the University of Washington, we quickly launched a writing collaboration.
Not surprisingly, ICLEI – Local Governments for Sustainability has joined with us and published the guidebook. No organization is doing more on the international scene than ICLEI in providing technical and policy assistance, peer networking opportunities, and general expertise to local governments on climate change emissions reductions. Now ICLEI has launched its new Climate Resilient Communities Program, which will provide assistance to local governments on preparing for climate change impacts.This guidebook will serve as a valuable resource for communities participating in the Climate Resilient Communities Program. Together with ICLEI and the Climate Impacts Group, King County is committed to making preparedness for climate change a critical part of how local, regional and state governments think about the future.
Mitigate and AdaptBut let me reaffirm that reducing or “mitigating” greenhouse gas pollution is a top priority for King County government. We have to address the cause of the problem so that we do not exacerbate its effects. In essence, mitigation is our number one preparedness strategy. If we do not stop the growth of and eventually reverse greenhouse gas emissions, then our opportunity to adapt will be limited by the rapid pace of climate change.
As a result of the critical importance of mitigation, there was a time, not long ago, when it was not acceptable to talk about adapting to – or preparing for – climate change. The reasoning was that time spent preparing for or adapting to the harmful effects of greenhouse gas pollution would divert resources from the essential need to reduce the emissions of those gases.
A GUIDEBOOK FOR LOCAL, REGIONAL, AND STATE GOVERNMENTS ��
Even as I write these words, there are still many people who are reluctant to talk about specific adaptation or preparedness policies. But as responsible public leaders, we cannot afford the luxury of not preparing. We know now that some impacts are inevitable and we know that these impacts will affect many of the essential services and functions that our governments are expected to provide. We must prepare for the impacts underway while we work to avoid even worse future effects.
What about the perception that mitigation and adaptation activities compete against one another for resources and attention? While it may be true that preparing for climate change will call on resources that are useful for mitigation, it is just as likely that an open discussion about what is needed to prepare for the harmful effects of climate change will inspire action to reduce greenhouse gas pollution. Reality is a powerful motivator. This was, in fact, one of the findings of a 2006 Yale conference on climate change (Abbasi 2006). The reality of failing levees, melting snowpack, and rising coastlines is a powerful motivator. Proposing to make investments to shore up those levees, build reclaimed water systems to offset melting snowcaps, build higher seawalls, and protect shoreline communities will even more effectively bring the perils of climate change into the public eye.
That has been my experience. King County is making multi-million dollar investments to address these scenarios, including construction of a reclaimed water system and reconstruction of critical levees across the region. In each case, those adaptive infrastructure investments have helped – and not detracted from – our efforts to promote greenhouse gas mitigation policies, because they have raised the profile of the climate change problem. Our recent voter approved tax proposal to increase King County’s transit system is proof of this. King County’s transit initiative is a powerful mitigation strategy, given that automobiles in our region are the greatest contributor to greenhouse gas pollution.
Moreover, and perhaps even more importantly, as public leaders and public servants who have assumed the responsibility for the health, safety, and welfare of our citizens, we have a professional and moral obligation to prepare our communities for climate change. The climate is changing. There is much at risk. We must begin to prepare for these changes.
The Challenge of Our Generation and Opportunity of A LifetimeClimate change is one of the greatest threats our society has ever faced. The atmospheric balance that sustains our lives is incredibly fragile, and the damage people are doing to it will have drastic consequences. These consequences cross racial, ethnic, religious, economic, and political boundaries. On a global scale under a “business as usual” scenario, the scientific prognosis is dire. The world and its people will experience:
more poverty
more hunger
more disease
more drought
more flooding
•
•
•
•
•
“In essence, mitigation is our number one
preparedness strategy. If we do not stop the
growth of and eventually reverse greenhouse
gas emissions, then our opportunity to adapt will be limited by the rapid
pace of climate change.”
PREPARING FOR CLIMATE CHANGE��
“No person, people, or nation will be spared.
Only the degree by which we will have to adapt is
in question.”
No person, people, or nation will be spared. Only the degree by which we will have to adapt is in question.
And if ever there was an issue in the public domain that cried out for the involvement of our younger generation in this great country it is climate change. Every time I hear someone say “that new energy policy is just too expensive” or “we don’t have the money to build a more robust levee system right now” I wonder how the next generation of Americans would calculate those costs.
However, climate change is also the greatest opportunity our society and world has ever faced. If we do what it takes to reduce greenhouse gas pollution to safe levels and prepare for the impacts that we see are underway, we will transform the economic foundation of modern civilization and can seize the opportunity to realize better health, social justice, and sustainable economic development throughout the world. We have the choice to act, and we must.
Solutions to this crisis vary from the simple to the complex – from changing light bulbs to comprehensive international “cap and trade” regulations. Likewise, preparedness solutions range from water conservation programs to regional flood control zoning districts. But at the heart of the crisis – driving our need for any of these solutions – is the world’s reliance on fossil fuels for energy.
Our addiction to fossil fuels promotes dependence on foreign oil, which compromises national security. Our addiction to fossil fuels also undermines our efforts to create new markets in clean, sustainable forms of energy.
The co-benefits of reducing dependency on fossil fuels are profound. New advances in renewable energy, architectural design, sustainable building materials, 21st century urban planning that strategically locates where we live, work and play in one geographic, pedestrian friendly community are
just a few elements of this bright new future. Others include the new role agriculture is playing in the production of sustainable energy, and the critical importance of growing and purchasing local food as a strategy for building sustainable communities.
The potential benefits of growth in much-needed living wage jobs are no less significant. We have endless opportunities to create domestic jobs as we build and redesign our homes and buildings to be energy efficient and sustainable, and as we construct our physical infrastructure to be climate resilient. Similarly, the opportunities to develop jobs by stimulating markets in clean energy technologies such as wind, solar, geothermal and biofuels are limited only by our imagination and our collective determination to create real change.
These benefits are immediately relevant on a local level. For example here in Washington, roughly $30 million is spent each day on oil and gas. Most of that money leaves the state, contributing nothing to local economic development. By investing in biofuels made from crops grown in Washington, we can keep more of those energy dollars in the state, help local farmers, and create new jobs. Economic opportunities like those that we will realize in Washington can exist in every region of our country.
At the same time, taking the opportunity to adapt to climate change impacts will also bring benefits, if we act now. We can protect our valuable homes and families from flooding if we act now. In some regions of the world, we can also capture new agricultural opportunities, if we observe changes in crop patterns based on new average temperatures and precipitation patterns.
A GUIDEBOOK FOR LOCAL, REGIONAL, AND STATE GOVERNMENTS ��
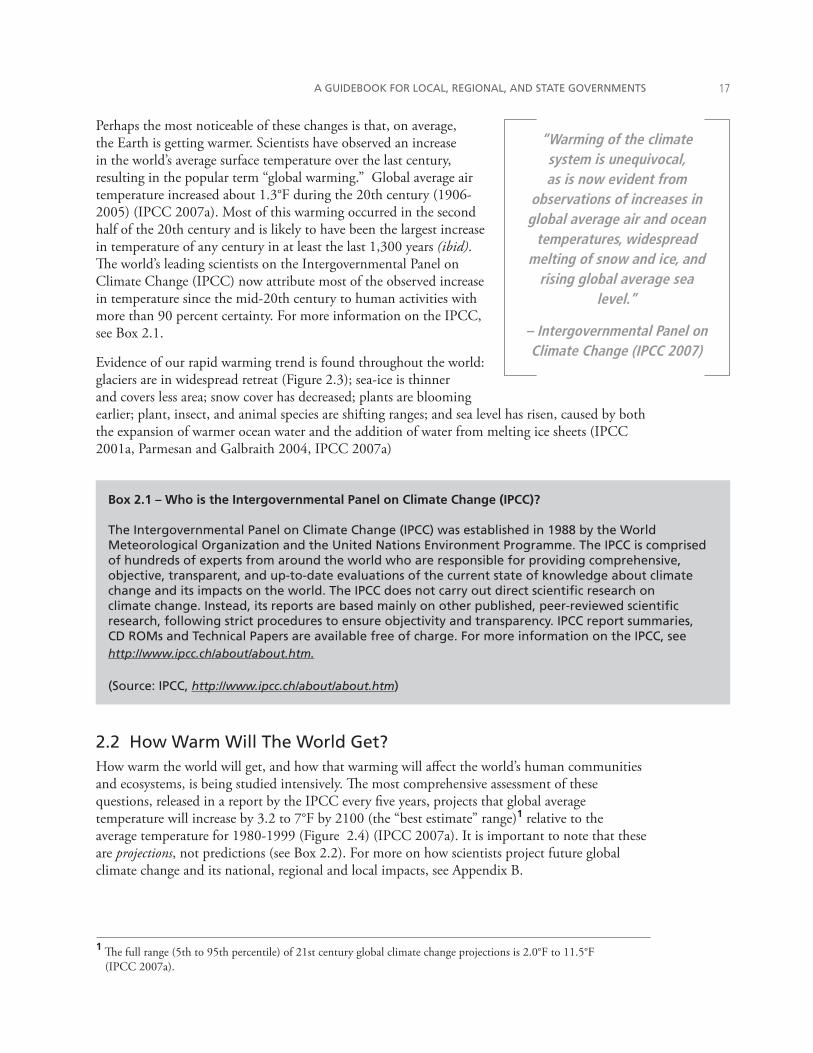
A Call to ActionWhether you view climate change as a crisis, an opportunity, or both, it is a reality. This guidebook is about how to take immediate action, to adapt effectively to that reality. The time to delay, defer, or deny is over. We must act.
I am eager to help build a more optimistic future – one of peace and prosperity. But I am also grounded by the fact that we must prepare our communities right now for the harmful impacts that we know are coming.
As Supreme Court Justice Oliver Wendell Homes once said, “A hundred years after we are gone and forgotten, those who never heard of us will be living with the results of our actions.” Likewise, I will not be here in the Puget Sound region in 50 years, but 2.5 million people will be. The actions my community takes today will affect how climate change impacts those 2.5 million residents.
Foresight and preparedness are good government. They are the essence of what we do as leaders. The steps we take now to anticipate and get ready for climate change will have profound impacts on the world our children and grandchildren inherit.
Whether you are a public official like I am, an advisor to a regional government, or an agency staff member, this guidebook offers you a framework for starting to prepare for climate change. In the pages that follow you will discover a critical tool – in essence, a road map for actions – that your government organization can put in place today to help prepare your community to adapt to a changing climate. The actions you take now will have significant impacts for generations to come.
I hope this guidebook takes the mystery out of planning for climate change. I hope it inspires you.
And I hope your leadership is rewarded with a stronger, safer community that is prepared for the greatest threat and the greatest opportunity we will ever face.
Ron SimsKing County, Washington

PREPARING FOR CLIMATE CHANGE��
��
chapter � a sc�ent�fic overv�ew of cl�mate change and �ts �mpacts
Human activities have changed the Earth’s atmosphere and climate in ways that will continue for centuries to come. This chapter briefly explains how and why these changes are happening.
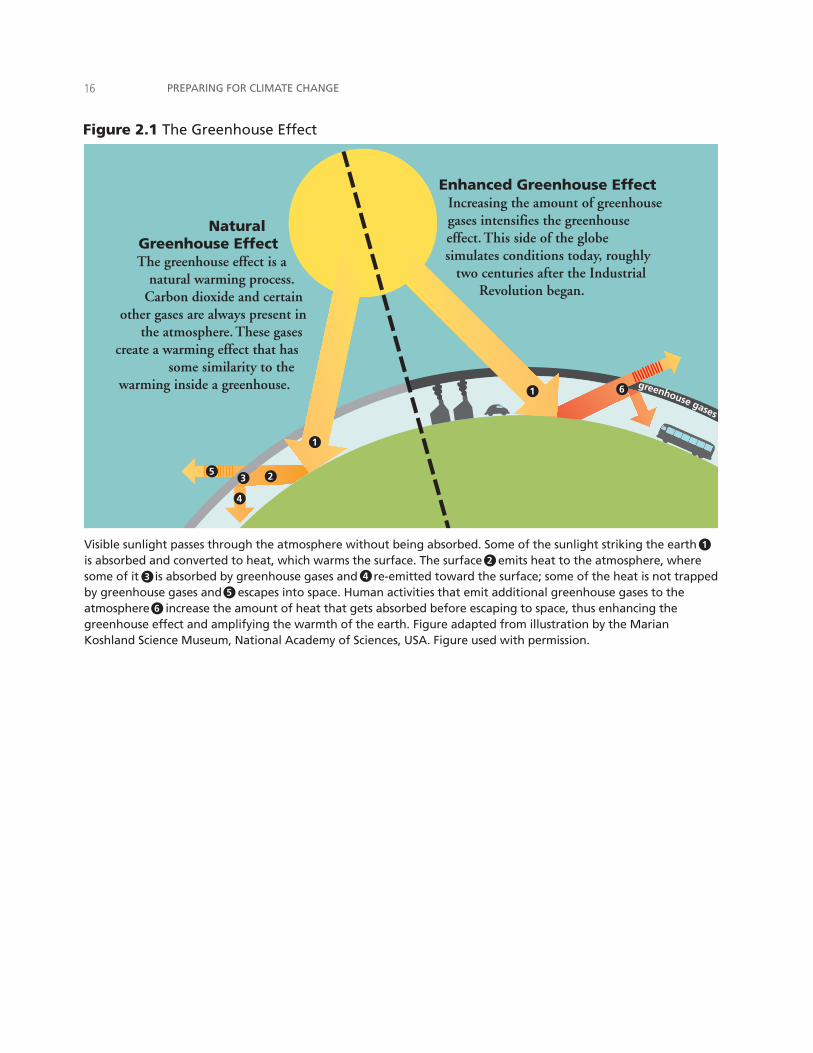
2.1 A Brief Overview of Climate ChangeLife on Earth as we know it today is made possible by relatively warm temperatures. Without gases like water vapor, carbon dioxide (CO2), and methane in the atmosphere, the Earth would be much colder than it is now – averaging 0°F instead of about 59°F – and most of the water on the planet would be frozen. At certain levels, these “greenhouse gases” make the planet livable for humans and many other kinds of plants and animals by trapping some of the heat radiating outward from the Earth (Figure 2.1), much like the walls of a greenhouse trap heated air. This process of limiting heat loss through the atmosphere is called the “greenhouse effect.”
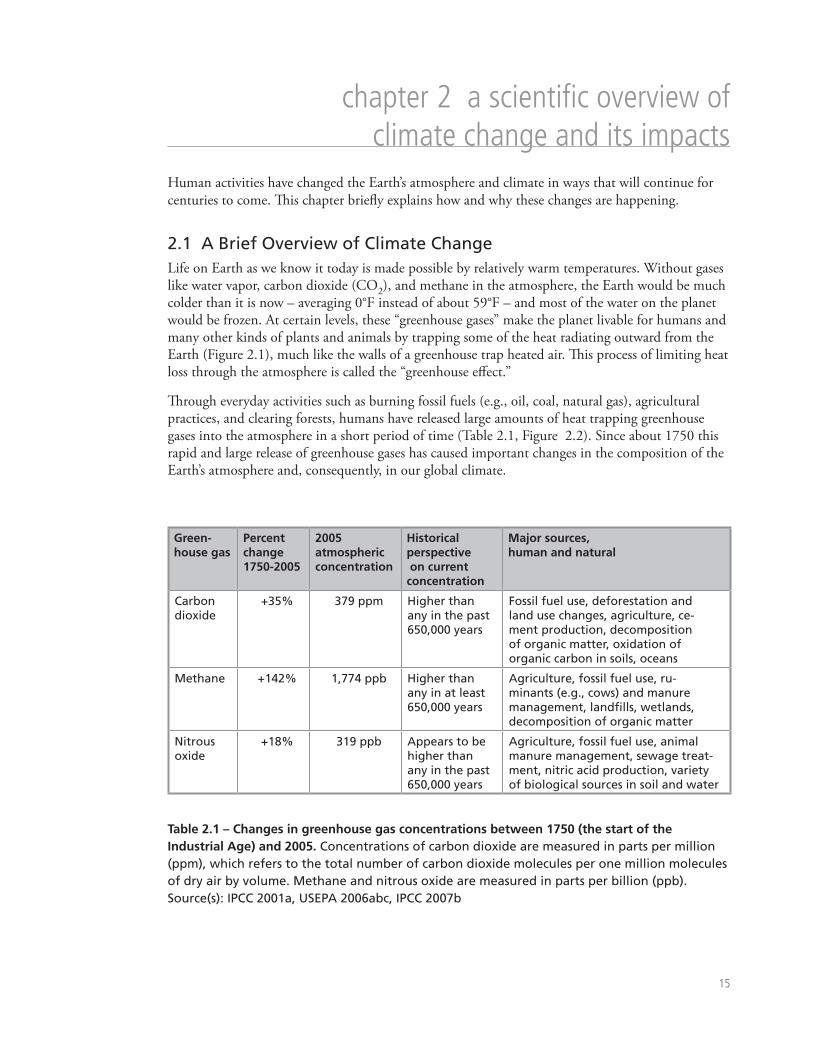
Through everyday activities such as burning fossil fuels (e.g., oil, coal, natural gas), agricultural practices, and clearing forests, humans have released large amounts of heat trapping greenhouse gases into the atmosphere in a short period of time (Table 2.1, Figure 2.2). Since about 1750 this rapid and large release of greenhouse gases has caused important changes in the composition of the Earth’s atmosphere and, consequently, in our global climate.
Table 2.1 – Changes in greenhouse gas concentrations between 1750 (the start of the Industrial Age) and 2005. Concentrations of carbon dioxide are measured in parts per million (ppm), which refers to the total number of carbon dioxide molecules per one million molecules of dry air by volume. Methane and nitrous oxide are measured in parts per billion (ppb). Source(s): IPCC 2001a, USEPA 2006abc, IPCC 2007b
Green-house gas
Percent change 1750-2005
2005 atmospheric concentration
Historical perspective on current concentration
Major sources, human and natural
Carbon dioxide
+35% 379 ppm Higher than any in the past 650,000 years
Fossil fuel use, deforestation and land use changes, agriculture, ce-ment production, decomposition of organic matter, oxidation of organic carbon in soils, oceans
Methane +142% 1,774 ppb Higher than any in at least 650,000 years
Agriculture, fossil fuel use, ru-minants (e.g., cows) and manure management, landfills, wetlands, decomposition of organic matter
Nitrous oxide
+18% 319 ppb Appears to be higher than any in the past 650,000 years
Agriculture, fossil fuel use, animal manure management, sewage treat-ment, nitric acid production, variety of biological sources in soil and water
PREPARING FOR CLIMATE CHANGE��
greenhouse gases
Enhanced Greenhouse EffectIncreasing the amount of greenhouse gases intensifies the greenhouse effect.This side of the globe simulates conditions today, roughly
two centuries after the Industrial Revolution began.
NaturalGreenhouse EffectThe greenhouse effect is a
natural warming process. Carbon dioxide and certain
other gases are always present in the atmosphere. These gases
create a warming effect that has some similarity to the
warming inside a greenhouse.
1
1
23
4
6
5
Figure 2.1 The Greenhouse Effect
Visible sunlight passes through the atmosphere without being absorbed. Some of the sunlight striking the earth is absorbed and converted to heat, which warms the surface. The surface emits heat to the atmosphere, where some of it is absorbed by greenhouse gases and re-emitted toward the surface; some of the heat is not trapped by greenhouse gases and escapes into space. Human activities that emit additional greenhouse gases to the atmosphere increase the amount of heat that gets absorbed before escaping to space, thus enhancing the greenhouse effect and amplifying the warmth of the earth. Figure adapted from illustration by the Marian Koshland Science Museum, National Academy of Sciences, USA. Figure used with permission.
1
2
3 4
5
6
A GUIDEBOOK FOR LOCAL, REGIONAL, AND STATE GOVERNMENTS ��
Perhaps the most noticeable of these changes is that, on average, the Earth is getting warmer. Scientists have observed an increase in the world’s average surface temperature over the last century, resulting in the popular term “global warming.” Global average air temperature increased about 1.3°F during the 20th century (1906-2005) (IPCC 2007a). Most of this warming occurred in the second half of the 20th century and is likely to have been the largest increase in temperature of any century in at least the last 1,300 years (ibid). The world’s leading scientists on the Intergovernmental Panel on Climate Change (IPCC) now attribute most of the observed increase in temperature since the mid-20th century to human activities with more than 90 percent certainty. For more information on the IPCC, see Box 2.1.
Evidence of our rapid warming trend is found throughout the world: glaciers are in widespread retreat (Figure 2.3); sea-ice is thinner and covers less area; snow cover has decreased; plants are blooming earlier; plant, insect, and animal species are shifting ranges; and sea level has risen, caused by both the expansion of warmer ocean water and the addition of water from melting ice sheets (IPCC 2001a, Parmesan and Galbraith 2004, IPCC 2007a)
“Warming of the climate system is unequivocal, as is now evident from
observations of increases in global average air and ocean
temperatures, widespread melting of snow and ice, and
rising global average sea level.”
– Intergovernmental Panel on Climate Change (IPCC 2007)
Box 2.1 – Who is the Intergovernmental Panel on Climate Change (IPCC)?
The Intergovernmental Panel on Climate Change (IPCC) was established in 1988 by the World Meteorological Organization and the United Nations Environment Programme. The IPCC is comprised of hundreds of experts from around the world who are responsible for providing comprehensive, objective, transparent, and up-to-date evaluations of the current state of knowledge about climate change and its impacts on the world. The IPCC does not carry out direct scientific research on climate change. Instead, its reports are based mainly on other published, peer-reviewed scientific research, following strict procedures to ensure objectivity and transparency. IPCC report summaries, CD ROMs and Technical Papers are available free of charge. For more information on the IPCC, see http://www.ipcc.ch/about/about.htm. (Source: IPCC, http://www.ipcc.ch/about/about.htm)
2.2 How Warm Will The World Get?How warm the world will get, and how that warming will affect the world’s human communities and ecosystems, is being studied intensively. The most comprehensive assessment of these questions, released in a report by the IPCC every five years, projects that global average temperature will increase by 3.2 to 7°F by 2100 (the “best estimate” range)1 relative to the average temperature for 1980-1999 (Figure 2.4) (IPCC 2007a). It is important to note that these are projections, not predictions (see Box 2.2). For more on how scientists project future global climate change and its national, regional and local impacts, see Appendix B.
1 The full range (5th to 95th percentile) of 21st century global climate change projections is 2.0°F to 11.5°F (IPCC 2007a).
PREPARING FOR CLIMATE CHANGE��C
arb
on
Dio
xid
e (
pp
m)
Meth
an
e (
pp
b)
Nit
rou
s O
xid
e (
pp
b)
270
300
10000 5000
+18%
+35% +142%
0
Time (before 2005)
10000 5000 0
Time (before 2005)
10000 5000 0
Time (before 2005)
330
500
1000
1500
2000
250
200
350
1800Year1900 2000
1800Year1900 20001800
Year1900 2000
240
270
300
300
350
400
330
500
1000
1500
2000
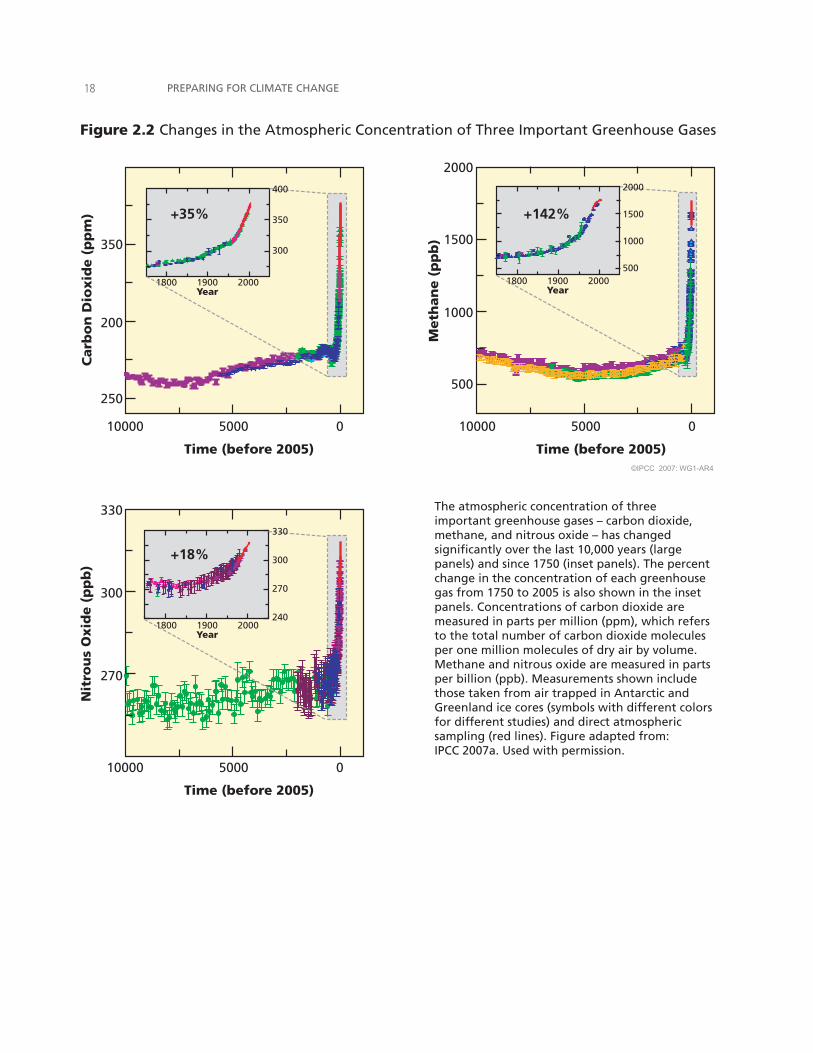
The atmospheric concentration of three important greenhouse gases – carbon dioxide, methane, and nitrous oxide – has changed significantly over the last 10,000 years (large panels) and since 1750 (inset panels). The percent change in the concentration of each greenhouse gas from 1750 to 2005 is also shown in the inset panels. Concentrations of carbon dioxide are measured in parts per million (ppm), which refers to the total number of carbon dioxide molecules per one million molecules of dry air by volume. Methane and nitrous oxide are measured in parts per billion (ppb). Measurements shown include those taken from air trapped in Antarctic and Greenland ice cores (symbols with different colors for different studies) and direct atmospheric sampling (red lines). Figure adapted from: IPCC 2007a. Used with permission.
Figure 2.2 Changes in the Atmospheric Concentration of Three Important Greenhouse Gases
A GUIDEBOOK FOR LOCAL, REGIONAL, AND STATE GOVERNMENTS ��
A. Muir Glacier, 1941 C. Boulder Glacier, 1932
B. Muir Glacier, 2004 D. Boulder Glacier, 2005
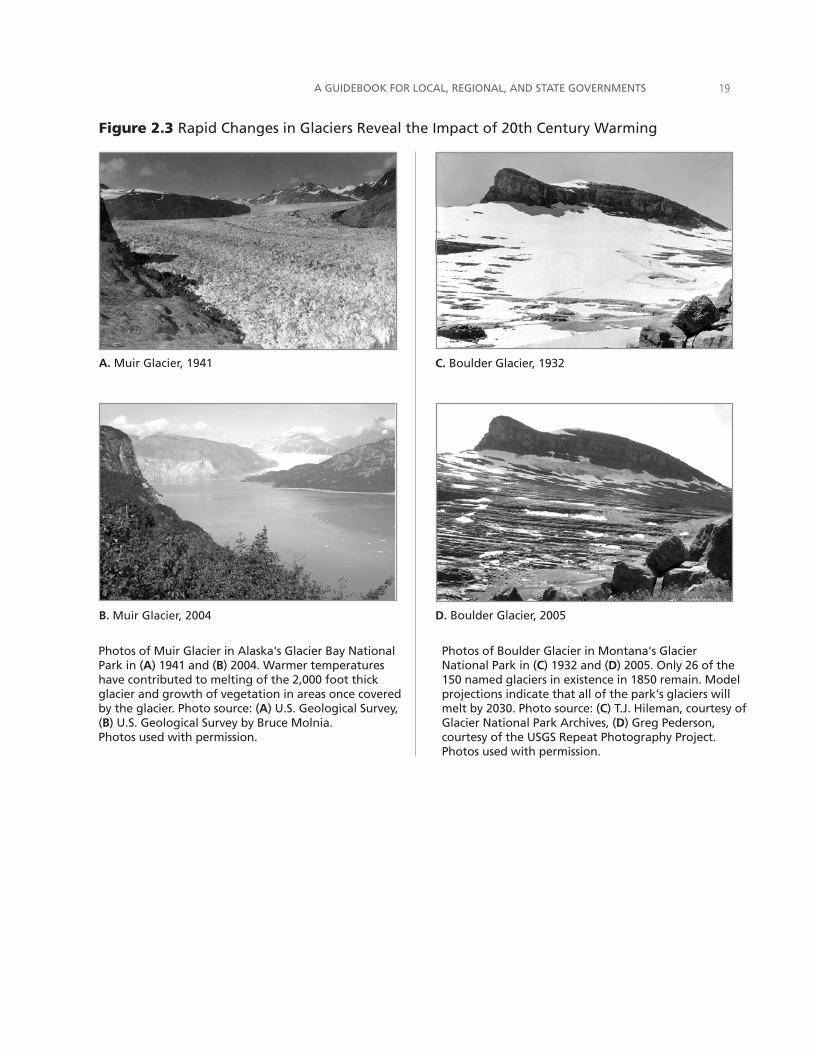
Figure 2.3 Rapid Changes in Glaciers Reveal the Impact of 20th Century Warming
Photos of Muir Glacier in Alaska's Glacier Bay National Park in (A) 1941 and (B) 2004. Warmer temperatures have contributed to melting of the 2,000 foot thick glacier and growth of vegetation in areas once covered by the glacier. Photo source: (A) U.S. Geological Survey, (B) U.S. Geological Survey by Bruce Molnia. Photos used with permission.
Photos of Boulder Glacier in Montana's Glacier National Park in (C) 1932 and (D) 2005. Only 26 of the 150 named glaciers in existence in 1850 remain. Model projections indicate that all of the park's glaciers will melt by 2030. Photo source: (C) T.J. Hileman, courtesy of Glacier National Park Archives, (D) Greg Pederson, courtesy of the USGS Repeat Photography Project. Photos used with permission.
PREPARING FOR CLIMATE CHANGE�0
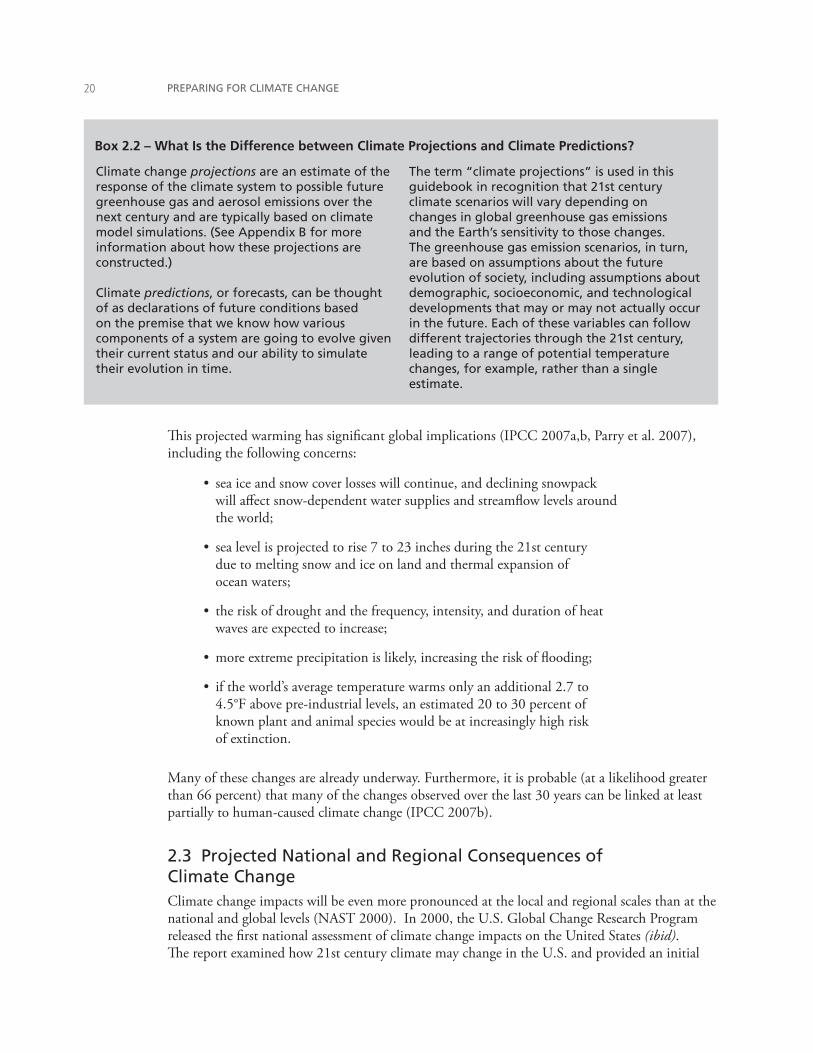
Box 2.2 – What Is the Difference between Climate Projections and Climate Predictions?
Climate change projections are an estimate of the response of the climate system to possible future greenhouse gas and aerosol emissions over the next century and are typically based on climate model simulations. (See Appendix B for more information about how these projections are constructed.)
Climate predictions, or forecasts, can be thought of as declarations of future conditions based on the premise that we know how various components of a system are going to evolve given their current status and our ability to simulate their evolution in time.
The term “climate projections” is used in this guidebook in recognition that 21st century climate scenarios will vary depending on changes in global greenhouse gas emissions and the Earth’s sensitivity to those changes. The greenhouse gas emission scenarios, in turn, are based on assumptions about the future evolution of society, including assumptions about demographic, socioeconomic, and technological developments that may or may not actually occur in the future. Each of these variables can follow different trajectories through the 21st century, leading to a range of potential temperature changes, for example, rather than a single estimate.
This projected warming has significant global implications (IPCC 2007a,b, Parry et al. 2007), including the following concerns:
sea ice and snow cover losses will continue, and declining snowpack will affect snow-dependent water supplies and streamflow levels around the world;
sea level is projected to rise 7 to 23 inches during the 21st century due to melting snow and ice on land and thermal expansion of ocean waters;
the risk of drought and the frequency, intensity, and duration of heat waves are expected to increase;
more extreme precipitation is likely, increasing the risk of flooding;
if the world’s average temperature warms only an additional 2.7 to 4.5°F above pre-industrial levels, an estimated 20 to 30 percent of known plant and animal species would be at increasingly high risk of extinction.
Many of these changes are already underway. Furthermore, it is probable (at a likelihood greater than 66 percent) that many of the changes observed over the last 30 years can be linked at least partially to human-caused climate change (IPCC 2007b).
2.3 Projected National and Regional Consequences of Climate ChangeClimate change impacts will be even more pronounced at the local and regional scales than at the national and global levels (NAST 2000). In 2000, the U.S. Global Change Research Program released the first national assessment of climate change impacts on the United States (ibid). The report examined how 21st century climate may change in the U.S. and provided an initial
•
•
•
•
•
A GUIDEBOOK FOR LOCAL, REGIONAL, AND STATE GOVERNMENTS ��
-2.0
0.0
2.0
4.0
6.0
8.0
10.0
Glo
bal
surf
ace
warm
ing
(ºF
)
Year
Glo
bal
surf
ace
warm
ing
(ºC
)
6.0
5.0
4.0
3.0
2.0
1.0
0.0
-1.0
1900 2000 2100
A2 (high)
A1B (medium)
B1 (low)
Year 2000 Constant Concentrations
20th Century
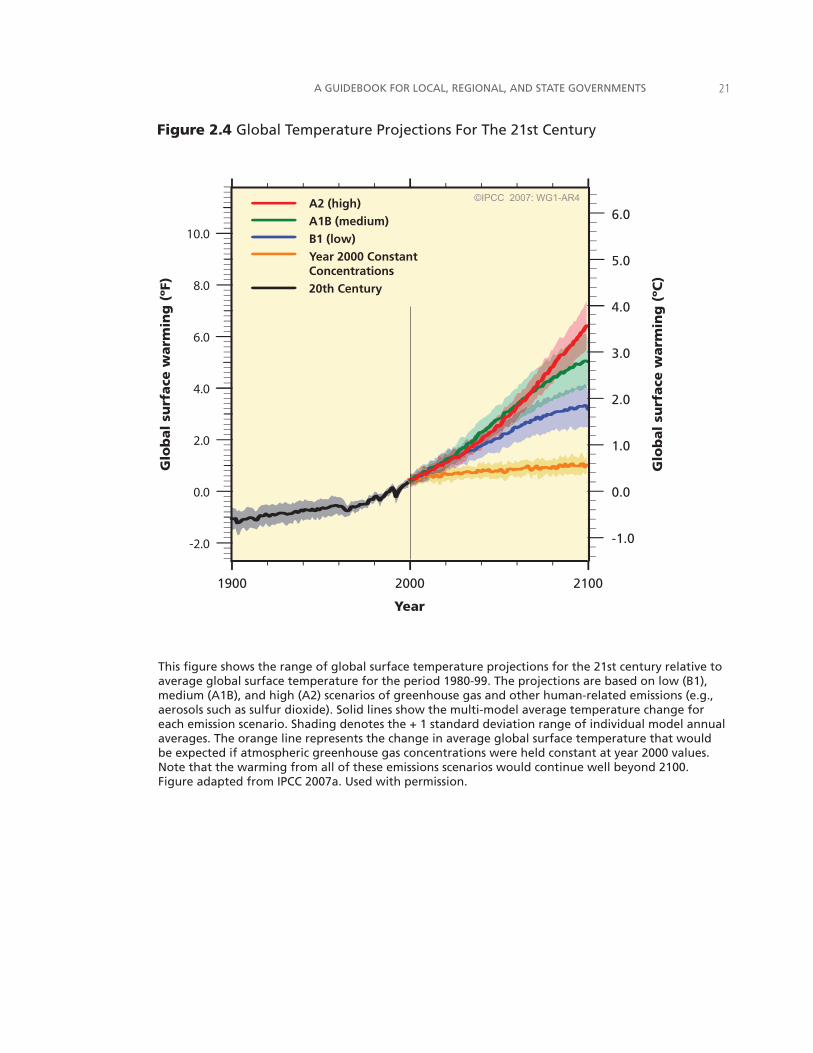
Figure 2.4 Global Temperature Projections For The 21st Century
This figure shows the range of global surface temperature projections for the 21st century relative to average global surface temperature for the period 1980-99. The projections are based on low (B1), medium (A1B), and high (A2) scenarios of greenhouse gas and other human-related emissions (e.g., aerosols such as sulfur dioxide). Solid lines show the multi-model average temperature change for each emission scenario. Shading denotes the + 1 standard deviation range of individual model annual averages. The orange line represents the change in average global surface temperature that would be expected if atmospheric greenhouse gas concentrations were held constant at year 2000 values. Note that the warming from all of these emissions scenarios would continue well beyond 2100.Figure adapted from IPCC 2007a. Used with permission.
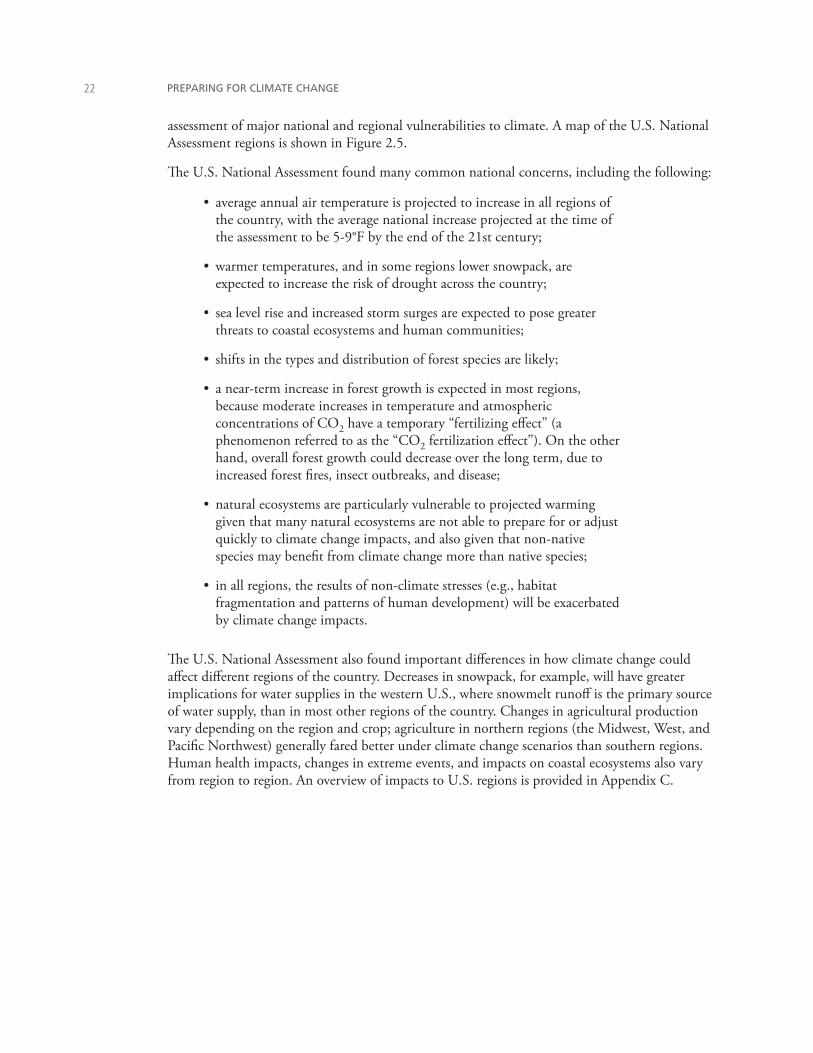
PREPARING FOR CLIMATE CHANGE��
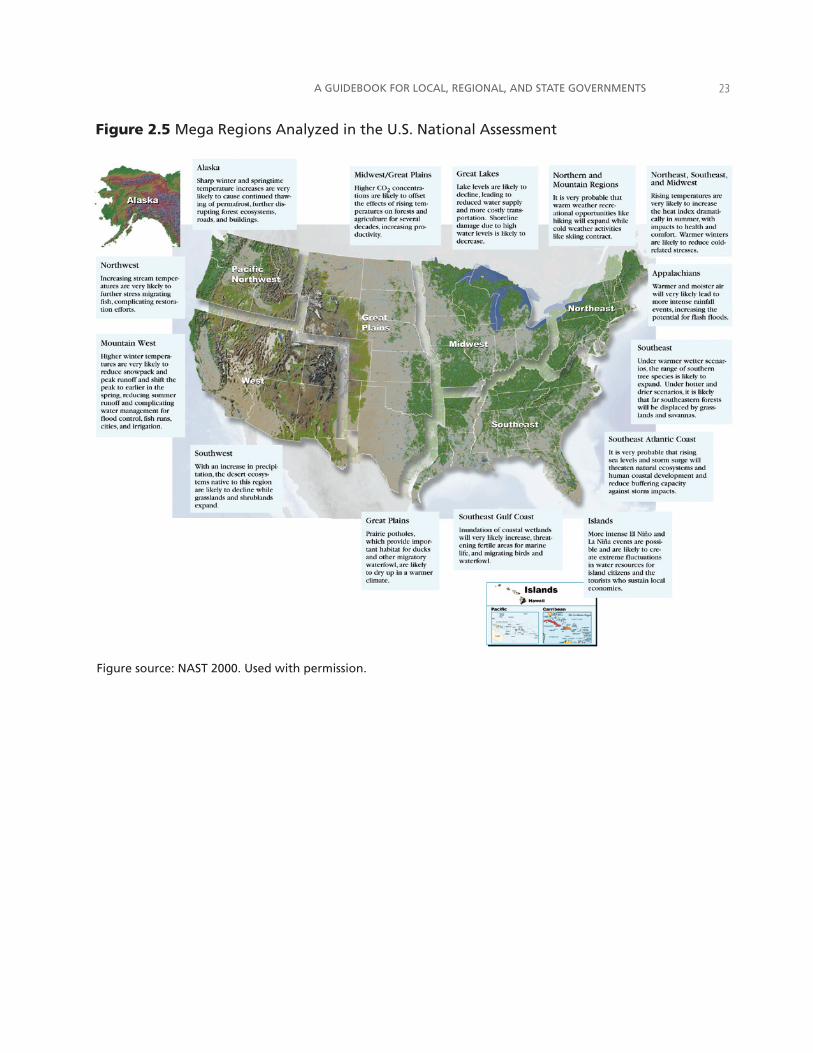
assessment of major national and regional vulnerabilities to climate. A map of the U.S. National Assessment regions is shown in Figure 2.5.
The U.S. National Assessment found many common national concerns, including the following:
average annual air temperature is projected to increase in all regions of the country, with the average national increase projected at the time of the assessment to be 5-9°F by the end of the 21st century;
warmer temperatures, and in some regions lower snowpack, are expected to increase the risk of drought across the country;
sea level rise and increased storm surges are expected to pose greater threats to coastal ecosystems and human communities;
shifts in the types and distribution of forest species are likely;
a near-term increase in forest growth is expected in most regions, because moderate increases in temperature and atmospheric concentrations of CO2 have a temporary “fertilizing effect” (a phenomenon referred to as the “CO2 fertilization effect”). On the other hand, overall forest growth could decrease over the long term, due to increased forest fires, insect outbreaks, and disease;
natural ecosystems are particularly vulnerable to projected warming given that many natural ecosystems are not able to prepare for or adjust quickly to climate change impacts, and also given that non-native species may benefit from climate change more than native species;
in all regions, the results of non-climate stresses (e.g., habitat fragmentation and patterns of human development) will be exacerbated by climate change impacts.
The U.S. National Assessment also found important differences in how climate change could affect different regions of the country. Decreases in snowpack, for example, will have greater implications for water supplies in the western U.S., where snowmelt runoff is the primary source of water supply, than in most other regions of the country. Changes in agricultural production vary depending on the region and crop; agriculture in northern regions (the Midwest, West, and Pacific Northwest) generally fared better under climate change scenarios than southern regions. Human health impacts, changes in extreme events, and impacts on coastal ecosystems also vary from region to region. An overview of impacts to U.S. regions is provided in Appendix C.
•
•
•
•
•
•
•
A GUIDEBOOK FOR LOCAL, REGIONAL, AND STATE GOVERNMENTS ��
Figure 2.5 Mega Regions Analyzed in the U.S. National Assessment
Figure source: NAST 2000. Used with permission.

PREPARING FOR CLIMATE CHANGE��
��
chapter � the case for governments to prepare for cl�mate change
You may be a senior leader of government, a department staff member, or a member of the general public. At whatever level, you have many compelling reasons to begin preparing your government and community for climate change.
3.1 Why Governments Cannot WaitReducing greenhouse gas emissions today will play a critical role in determining how much climate change we experience in the future. However, for reasons provided below, governments cannot wait for global greenhouse gas emissions to be reduced before taking steps to prepare for climate change impacts.
Climate change is already in motion. An increasing amount of physical evidence points to the fact that climate change is already in motion as a result of the greenhouse gases accumulated in the atmosphere to date, particularly since the 1950s (see Appendix A). In fact, many of the changes projected through at least the middle of the 21st century will be driven by present-day greenhouse gas concentrations. For instance, even if greenhouse gas emissions had been stabilized in 2000, we would see an additional 0.9ºF or more of warming globally in the 21st century, due to the concentration of greenhouse gases in the atmosphere in 2000 and the “lag time” of the Earth’s oceans and atmosphere to warm (Hansen et al. 2005, Meehl et al. 2005, Wigley 2005, IPCC 2007a). Therefore, reducing greenhouse gas emissions will limit the severity of long term future impacts, but it will do little to alter the near-term changes already set in motion.
Significant reduction of greenhouse gas emissions is possible, but it is unlikely that greenhouse gas emissions will be stabilized or reversed in the near term. Approximately 75 percent of CO2 emissions to the atmosphere over the past 20 years are due to fossil fuel burning (IPCC 2001a). If the world’s nations move quickly and collectively towards a global clean energy economy, prospects for reducing global human greenhouse gas emissions are good. However, avoiding the worst climate change impacts will require reducing greenhouse gas emissions to the point where atmospheric concentrations stabilize and then decline. Given the dependence of global economic systems on fossil fuels and the time required for new technologies that reduce or replace fossil fuels to integrate into the global marketplace, any significant reduction in CO2 emissions is unlikely to occur soon enough to avoid many of the projected climate impacts.
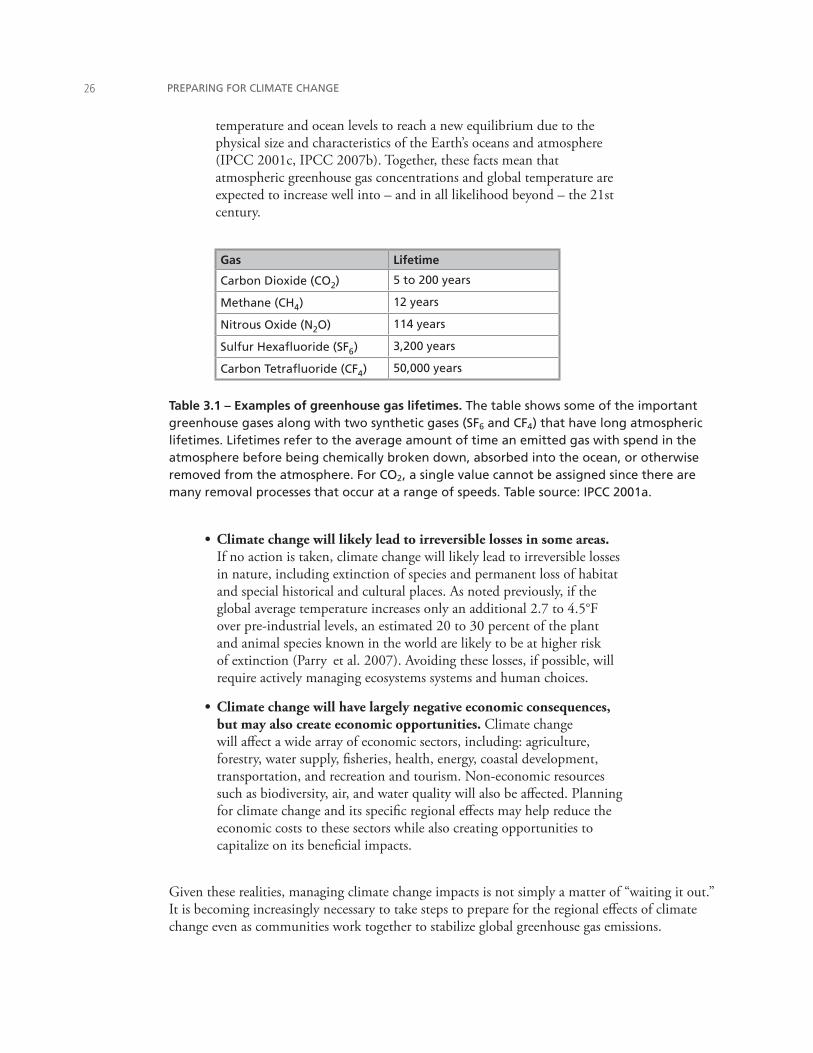
Climate change is expected to continue long after greenhouse gases are stabilized. Greenhouse gases remain in the atmosphere for tens to thousands of years before breaking down (Table 3.1). Until this happens, greenhouse gas molecules will continue to trap energy, causing continued warming. Additionally, even after atmospheric concentrations of greenhouse gases are stabilized, it will take hundreds of years for global
•
•
•
PREPARING FOR CLIMATE CHANGE��
temperature and ocean levels to reach a new equilibrium due to the physical size and characteristics of the Earth’s oceans and atmosphere (IPCC 2001c, IPCC 2007b). Together, these facts mean that atmospheric greenhouse gas concentrations and global temperature are expected to increase well into – and in all likelihood beyond – the 21st century.
Gas Lifetime
Carbon Dioxide (CO2) 5 to 200 years
Methane (CH4) 12 years
Nitrous Oxide (N2O) 114 years
Sulfur Hexafluoride (SF6) 3,200 years
Carbon Tetrafluoride (CF4) 50,000 years
Table 3.1 – Examples of greenhouse gas lifetimes. The table shows some of the important greenhouse gases along with two synthetic gases (SF6 and CF4) that have long atmospheric lifetimes. Lifetimes refer to the average amount of time an emitted gas with spend in the atmosphere before being chemically broken down, absorbed into the ocean, or otherwise removed from the atmosphere. For CO2, a single value cannot be assigned since there are many removal processes that occur at a range of speeds. Table source: IPCC 2001a.
Climate change will likely lead to irreversible losses in some areas. If no action is taken, climate change will likely lead to irreversible losses in nature, including extinction of species and permanent loss of habitat and special historical and cultural places. As noted previously, if the global average temperature increases only an additional 2.7 to 4.5°F over pre-industrial levels, an estimated 20 to 30 percent of the plant and animal species known in the world are likely to be at higher risk of extinction (Parry et al. 2007). Avoiding these losses, if possible, will require actively managing ecosystems systems and human choices.
Climate change will have largely negative economic consequences, but may also create economic opportunities. Climate change will affect a wide array of economic sectors, including: agriculture, forestry, water supply, fisheries, health, energy, coastal development, transportation, and recreation and tourism. Non-economic resources such as biodiversity, air, and water quality will also be affected. Planning for climate change and its specific regional effects may help reduce the economic costs to these sectors while also creating opportunities to capitalize on its beneficial impacts.
Given these realities, managing climate change impacts is not simply a matter of “waiting it out.” It is becoming increasingly necessary to take steps to prepare for the regional effects of climate change even as communities work together to stabilize global greenhouse gas emissions.
•
•
A GUIDEBOOK FOR LOCAL, REGIONAL, AND STATE GOVERNMENTS ��
3.2 Reasons for Local, Regional and State Governments to be ProactiveThere are several fundamental reasons for local, regional and state governments to be proactive in preparing for climate change impacts.
Planning for the future can benefit the present. In assessing what the future climate holds, governments may find that many projected climate change impacts are in fact more extreme versions of what communities are already experiencing today as a result of present day climate variability and extreme climate events. Climate change, for example, will increase the risk of drought, which all communities experience periodically. Implementing a water conservation program in anticipation of this changing drought risk offers immediate benefits for managing current droughts as well as the more frequent and more intense droughts projected in the coming decades.
Preparing for climate change is “good government.” Governments across the United States and the world share a common goal of ensuring the safety, health and welfare of their communities now and into the future. Meeting this goal and maintaining the integrity of essential public services requires that governments anticipate trends and changes that could affect their environment, economy, and community well-being. Because climate change will affect a broad range of community assets and government services, operations and policy areas, preparing for climate change is thus a matter of “good government” and risk management.
Localities, regions and states are on the front lines of climate change impacts, and have a responsibility to respond. Climate change is a global trend, but one which localities, regions and states will experience to different degrees and in different ways. Also, by nature, public programs and policy strategies designed at the federal or international level have a limited level of specificity, whereas local, regional and state governments are in a stronger position to tailor climate change preparedness strategies to their specific circumstances, and to the unique set of climate change impacts that they expect to face. Therefore, while higher levels of government can and must provide funding and support for climate change preparedness strategies on the ground, local, regional and state governments have an equal or even greater responsibility to plan proactively as well.
Proactive planning is more effective and less costly than responding reactively to climate change impacts as they happen. Taking proactive steps to be flexible and to anticipate and address expected impacts can save money and protect the well being of communities. For instance, considering the impacts of climate change on water supply and demand in design criteria for a new reservoir can help ensure that the new reservoir meets future water needs and may be less costly than having to expand the reservoir in the future (if expansion is possible at all by that time).
•
•
•
•
PREPARING FOR CLIMATE CHANGE��
Thinking strategically can reduce future risks. Being proactive and strategic in planning for climate change impacts can create opportunities for modifying present-day policies and practices that can increase vulnerability to climate change. For example, zoning that concentrates development in an area at risk to future sea level rise and coastal flooding can be altered before that area is built out.
Thinking strategically can increase future benefits. Being proactive can create opportunities for capitalizing on some of the benefits of climate change. A longer growing season, for example, could lead to greater agricultural production (provided that adequate water supplies are available). Similarly, warmer winter temperatures could lead to cost savings from reduced winter road maintenance requirements.
Anticipating future changes can add value to today’s investments at low additional cost. Preparing for climate change impacts may provide opportunities to add value to existing capital projects. “Piggybacking” a reclaimed water system onto a planned wastewater treatment system expansion, for example, reduces the marginal cost of adding the reclaimed water system while providing buffering capacity against projected water supply impacts.
Climate change is unlike most other public priorities in that it directly or indirectly affects a broad range of resources and activities in the public and private sector, including water resources, energy, public health, agriculture, forests, transportation, land use planning, stormwater management, and emergency management. Taking practical steps now with the best information available enables you to reduce your future risk and also realize possible near-term benefits.
3.3 Moving Beyond Common “Barriers”You will face obstacles in planning for climate change. You may also encounter resistance from others in your organization or region. Often, however, the barriers (both perceived and real) to planning for climate change can be easily addressed. Some of the more common barriers to planning are addressed here.
The barrier: “I don’t know how climate change will affect my community.” The local impacts of climate change may not be easily understood, especially if information on regional or local climate change impacts is limited.
A response: Climate change will affect communities and community government functions in a variety of ways. More obvious impacts could include an increased risk for extreme events such as drought, storms, flooding, and forest fires; more heat-related stress; the spread of existing or new vector-born disease into a community; and increased erosion and inundation of low-lying areas along coastlines. In many cases, communities are already facing these problems to some degree. Climate change raises the stakes in managing these problems by changing the frequency, intensity, extent, and/or magnitude of these problems.
Climate change impacts may also appear in unexpected ways. For example, some communities may have more difficulty meeting federally mandated summer air quality standards if increased
•
•
•
A GUIDEBOOK FOR LOCAL, REGIONAL, AND STATE GOVERNMENTS ��
temperatures lead to higher concentrations of ground-level ozone (Shriner and Street 1997, IPCC 2001b). Lower summer streamflows could have effects not only on fish and wildlife, but also on industries discharging permitted industrial effluent to the streams. Other less obvious impacts may include increased costs for combating insect outbreaks on urban forests or agricultural crops or difficulty restoring populations of endangered species based on climate change impacts on habitat or the food web.
There are many sources of information on how climate change may affect the United States, its various sub-regions, and specific types of resources such as water supply, coasts, forests, and agriculture (see Chapter 4 and Appendix C). These sources can all be used to some degree to develop a better understanding of how climate change may affect your community even when information specific to your location is not available. Tips for reviewing these sources and organizing the information for planning are provided later in Chapter 4 and Chapter 8. Regional climate and/or resource management experts may also be good resources for finding out how climate change may affect your community.
The barrier: “Climate change action should happen at higher levels of government.” Media attention on policies for reducing greenhouse gas emissions (e.g., the Kyoto Protocol) may contribute to perceptions that climate change is an international-scale problem to be handled through federal policies and international agreements.
A response: While national and international policies have an important role in reducing greenhouse gas emissions, it may be a half-century or more before these policies lead to any substantive reduction in atmospheric concentrations of greenhouse gases and global average temperature. More importantly, the impacts of climate change will be felt most acutely at the local scale. Managing these impacts will require developing locally-based strategies.
The barrier: “I’ll deal with climate change when I see that it is happening.” Acute climate change may not be evident in some sectors for several decades. This time lag may contribute to the perception that climate change is an issue to address when you see that “climate change is obviously occurring” or at some other point down the road.
A response: There is considerable evidence that climate change is already underway (see Chapter 2 and Appendix A). Deferring planning until climate change is “here” could cause costly delays and increase vulnerability to climate impacts given the time required to implement some preparedness strategies. For example, expanding a water supply system to accommodate the combined impacts of population growth and climate change may take 10 to 30 years before the additional capacity is online. This delay could leave a region vulnerable to drought, higher water rates, and broader economic costs.
In some cases, waiting for more obvious signs of climate change may foreclose on lower cost preparedness options, leaving you with only expensive ways out. For example, a low cost strategy for managing the risk of more frequent or intense floods might be to leave a floodplain undeveloped. Hypothetically, if you wait to plan until you have perfect information about increased flood risk and allow development to continue in the floodplain, you may need to take a more costly approach later, such as installing dikes or other major infrastructure to protect property in the most vulnerable areas of the floodplain.
Climate change mitigation refers to activities undertaken to reduce greenhouse gas emissions.
PREPARING FOR CLIMATE CHANGE�0
The barrier: “My community wants to focus only on reducing greenhouse gases.” Actual resource limitations – especially for projects considered to be in the category of “environmental policy” – could force you to choose between actions that reduce greenhouse gas emissions and your proposed preparedness efforts. On another note, you may also face a perception that if you focus on preparing for climate change, you are giving up the fight to reduce greenhouse gas emissions.
A response: Limiting the future damage of climate change to the world and your community requires both reducing greenhouse gas emissions and preparing for climate change impacts. If your community is already focused on greenhouse gas emissions reduction, seize the moment to start a community conversation about climate change impacts and the potential for climate change to exacerbate existing problems.
The barrier: “I’ll deal with climate change when you can tell me exactly what I need to plan for.” Some fields (e.g., engineering and urban planning) traditionally demand precise information in order to make changes to physical structures, large-scale capital investments, or land use zoning.
A response: Climate change will require that you learn how to plan more effectively with evolving, imperfect information. Waiting for certainty can increase your vulnerability to climate change and potentially lead to high financial and social costs. You can incorporate existing information on climate change impacts into plans and designs and designs, if you write those documents to accommodate a reasonable range of projected extremes, and to be updated more frequently over time as your information improves. Where to obtain specific regional information about climate change impacts and how to deal with uncertainty are described in Chapter 4 and Chapter 11.
The barrier: “I’ll wait until I see other communities planning for climate change.” The perception that no other “peer” communities (i.e., of your size and in your geographic area) are planning for climate change could make you, your public officials, or stakeholders in your community reluctant to invest in preparing for climate change.
A response: Many governments within the United States and elsewhere have begun to ask what climate change may mean for their communities. These efforts are being driven in part by public concern about climate change, increasing evidence that climate change is occurring, and increasing capabilities to provide information on climate impacts at the regional scale. A sample list of urban regions planning for climate change (in addition to King County, Washington) is provided in Box 3.2. It will also be useful for you to identify other “peer” communities who have invested in preparing for climate change, through networks such as ICLEI – Local Governments for Sustainability, the Center for Clean Air Policy’s Urban Leaders Initiative, or the USEPA.
The barrier: “I don’t have time or money to deal with climate change right now.” Governments must continually juggle multiple issues of immediate importance, often making it difficult to take on “new” issues such as climate change preparedness. Financial, technical, institutional, and/or human resource constraints can also limit an organization’s ability to address climate change impacts.
A GUIDEBOOK FOR LOCAL, REGIONAL, AND STATE GOVERNMENTS ��
A response: In many cases, climate change will exacerbate existing high priority management concerns rather than creating completely new challenges. Therefore, you may find that efforts to address existing management concerns affected by climate change may simultaneously reduce vulnerability to projected climate impacts, particularly if the projected impacts are included in the scope of today’s decision making. You may also realize that the strategies used to manage both present-day concerns and projected climate impacts are similar (for a sample list of preparedness strategies, see Table 10.1). If this is true, it should be possible for you to accomplish some degree of planning for climate change by absorbing the work into your existing workplan – and using current financial, technical, institutional, or human resources. As your planning progresses, you can review your need for additional resources later, in the context of developing an overall long-term strategy.
The barrier: “I don’t have the resources or political support to act.” Although the case for climate change action has gained public attention and political momentum in the last two years, support for climate change preparedness is not a given. You will need support from senior level management, whether an agency director, city or county manager, city or county council, or federal or state legislator, in order to create an institutional and political environment in which planning for climate change can occur. A lack of support from senior level management is a very real barrier to starting your effort – making it difficult for you to find the staff and financial resources to pursue preparedness strategies.
A response: You can make some progress in preparing for climate change with limited resources and/or political will. In some cases, you may identify the reasons why there is a lack of support, and you may be able to develop more support incrementally.
The barrier: “Our operations are based on historical statistics, not future modeling.” Many government services such as water supply management, wastewater treatment, stormwater operations, and flood zone management are guided by historical record. Using projections of future change can be hard to “sell” to plant or system managers, not to mention ratepayers and regulators.
A response: It is critical to recognize that the past is no longer a reliable guide to the future. When relevant and possible, move away from relying exclusively on historical climate conditions as the basis for decision making. This does not mean you should exclude the past altogether, however; much can be gained from looking at the impacts of past extreme events on communities, infrastructure, and natural systems. The key now is to avoid anchoring your decisions completely in historical records. Your government regularly makes decisions based on expectations and assumptions about the future, so this way of thinking should not be entirely new.
These common mindsets are just a few of the barriers that can hold you back from preparing for climate change impacts, and the responses here are meant to help you to overcome those barriers. As the next chapter outlines, perhaps no factors are more important than strong top-level leadership and a cohesive planning team to encourage you and your internal and external stakeholders to invest in climate change preparedness.
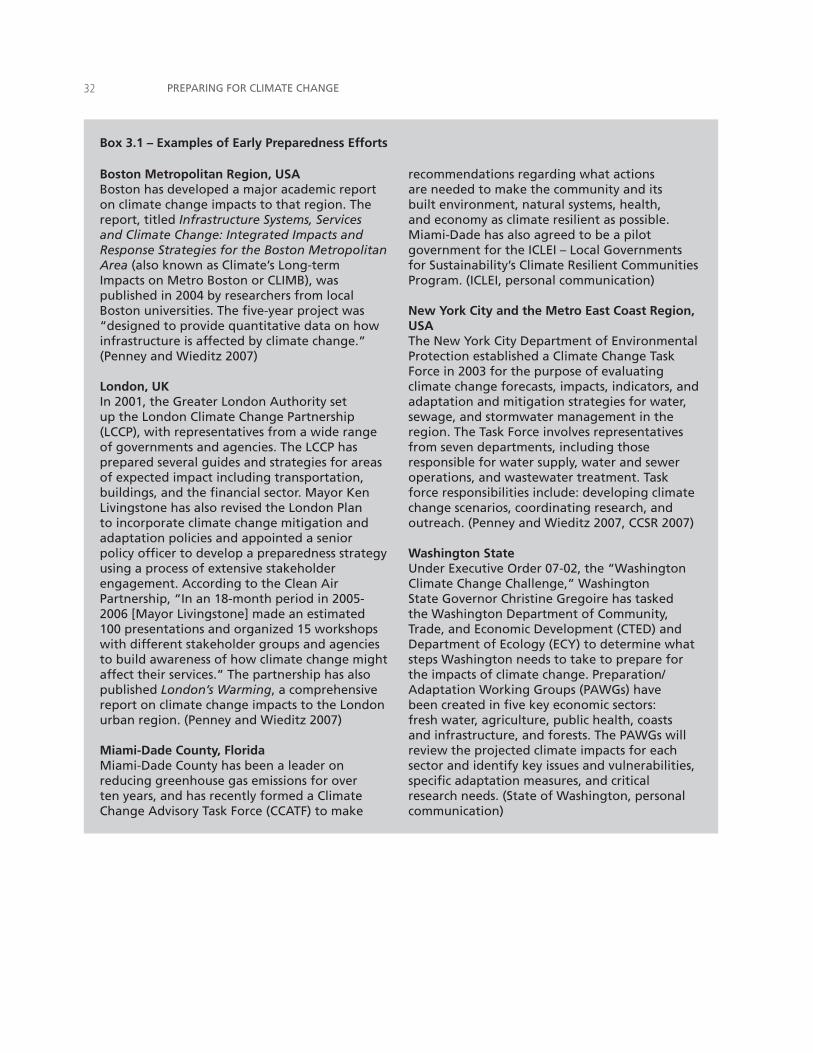
PREPARING FOR CLIMATE CHANGE��
Box 3.1 – Examples of Early Preparedness Efforts
Boston Metropolitan Region, USA Boston has developed a major academic report on climate change impacts to that region. The report, titled Infrastructure Systems, Services and Climate Change: Integrated Impacts and Response Strategies for the Boston Metropolitan Area (also known as Climate’s Long-term Impacts on Metro Boston or CLIMB), was published in 2004 by researchers from local Boston universities. The five-year project was “designed to provide quantitative data on how infrastructure is affected by climate change.” (Penney and Wieditz 2007)
London, UKIn 2001, the Greater London Authority set up the London Climate Change Partnership (LCCP), with representatives from a wide range of governments and agencies. The LCCP has prepared several guides and strategies for areas of expected impact including transportation, buildings, and the financial sector. Mayor Ken Livingstone has also revised the London Plan to incorporate climate change mitigation and adaptation policies and appointed a senior policy officer to develop a preparedness strategy using a process of extensive stakeholder engagement. According to the Clean Air Partnership, “In an 18-month period in 2005-2006 [Mayor Livingstone] made an estimated 100 presentations and organized 15 workshops with different stakeholder groups and agencies to build awareness of how climate change might affect their services.” The partnership has also published London’s Warming, a comprehensive report on climate change impacts to the London urban region. (Penney and Wieditz 2007)
Miami-Dade County, FloridaMiami-Dade County has been a leader on reducing greenhouse gas emissions for over ten years, and has recently formed a Climate Change Advisory Task Force (CCATF) to make
recommendations regarding what actions are needed to make the community and its built environment, natural systems, health, and economy as climate resilient as possible. Miami-Dade has also agreed to be a pilot government for the ICLEI – Local Governments for Sustainability’s Climate Resilient Communities Program. (ICLEI, personal communication)
New York City and the Metro East Coast Region, USAThe New York City Department of Environmental Protection established a Climate Change Task Force in 2003 for the purpose of evaluating climate change forecasts, impacts, indicators, and adaptation and mitigation strategies for water, sewage, and stormwater management in the region. The Task Force involves representatives from seven departments, including those responsible for water supply, water and sewer operations, and wastewater treatment. Task force responsibilities include: developing climate change scenarios, coordinating research, and outreach. (Penney and Wieditz 2007, CCSR 2007)
Washington StateUnder Executive Order 07-02, the “Washington Climate Change Challenge,” Washington State Governor Christine Gregoire has tasked the Washington Department of Community, Trade, and Economic Development (CTED) and Department of Ecology (ECY) to determine what steps Washington needs to take to prepare for the impacts of climate change. Preparation/Adaptation Working Groups (PAWGs) have been created in five key economic sectors: fresh water, agriculture, public health, coasts and infrastructure, and forests. The PAWGs will review the projected climate impacts for each sector and identify key issues and vulnerabilities, specific adaptation measures, and critical research needs. (State of Washington, personal communication)
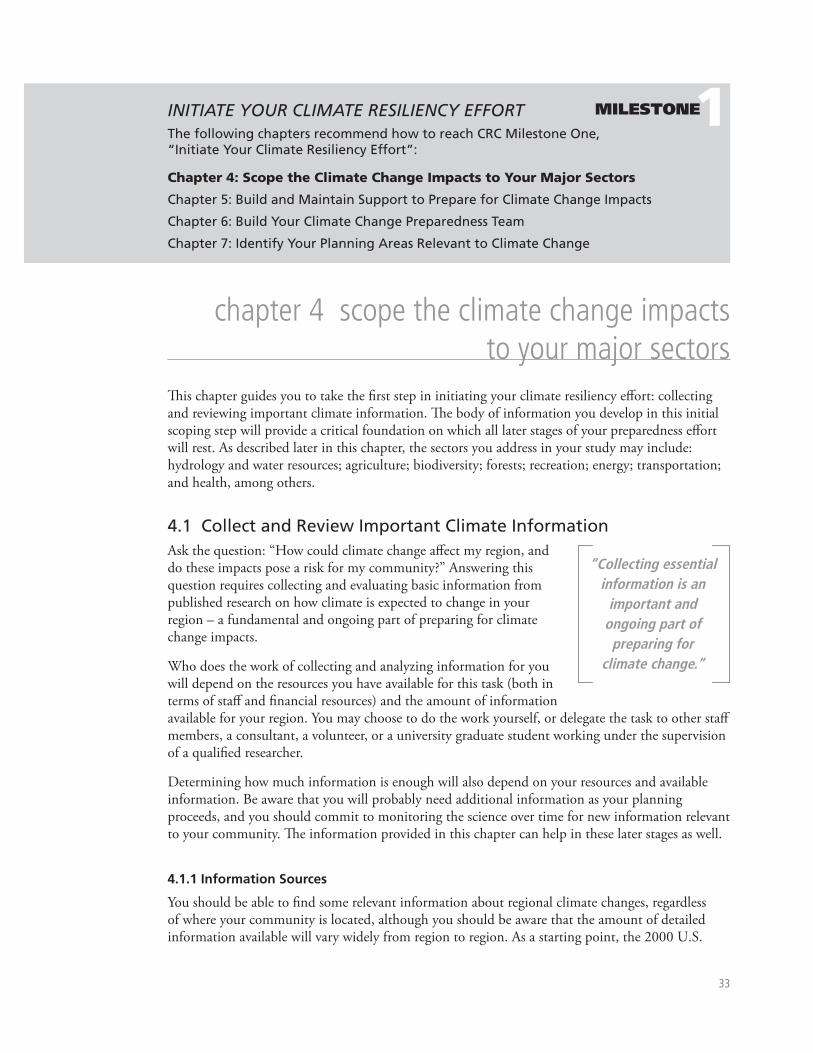
33
chapter 4 scope the climate change impacts to your major sectors
This chapter guides you to take the first step in initiating your climate resiliency effort: collecting and reviewing important climate information. The body of information you develop in this initial scoping step will provide a critical foundation on which all later stages of your preparedness effort will rest. As described later in this chapter, the sectors you address in your study may include: hydrology and water resources; agriculture; biodiversity; forests; recreation; energy; transportation; and health, among others.
4.1 Collect and Review Important Climate Information Ask the question: “How could climate change affect my region, and do these impacts pose a risk for my community?” Answering this question requires collecting and evaluating basic information from published research on how climate is expected to change in your region – a fundamental and ongoing part of preparing for climate change impacts.
Who does the work of collecting and analyzing information for you will depend on the resources you have available for this task (both in terms of staff and financial resources) and the amount of information available for your region. You may choose to do the work yourself, or delegate the task to other staff members, a consultant, a volunteer, or a university graduate student working under the supervision of a qualified researcher.
Determining how much information is enough will also depend on your resources and available information. Be aware that you will probably need additional information as your planning proceeds, and you should commit to monitoring the science over time for new information relevant to your community. The information provided in this chapter can help in these later stages as well.
4.1.1 Information Sources
You should be able to find some relevant information about regional climate changes, regardless of where your community is located, although you should be aware that the amount of detailed information available will vary widely from region to region. As a starting point, the 2000 U.S.
INITIATE YOUR CLIMATE RESILIENCY EFFORTThe following chapters recommend how to reach CRC Milestone One, “Initiate Your Climate Resiliency Effort”:
Chapter 4: Scope the Climate Change Impacts to Your Major Sectors
Chapter 5: Build and Maintain Support to Prepare for Climate Change Impacts
Chapter 6: Build Your Climate Change Preparedness Team
Chapter 7: Identify Your Planning Areas Relevant to Climate Change
“Collecting essential information is an
important and ongoing part of preparing for
climate change.”
1MILESTONE
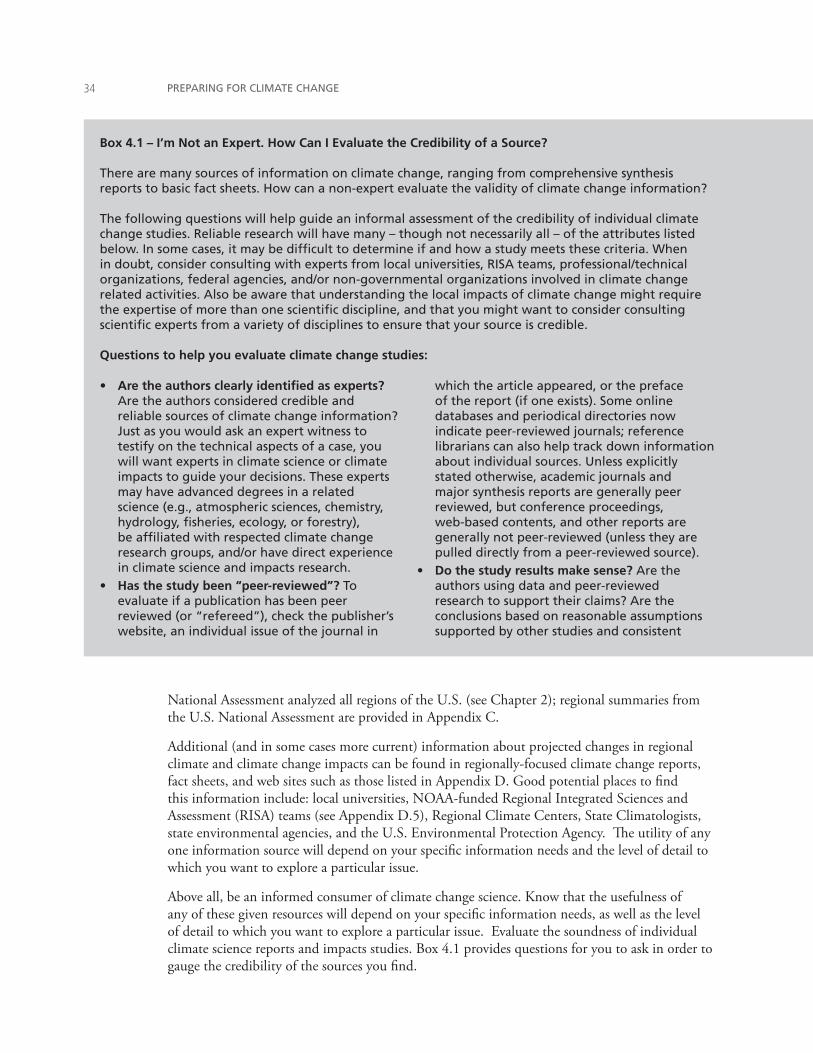
PREPARING FOR CLIMATE CHANGE��
National Assessment analyzed all regions of the U.S. (see Chapter 2); regional summaries from the U.S. National Assessment are provided in Appendix C.
Additional (and in some cases more current) information about projected changes in regional climate and climate change impacts can be found in regionally-focused climate change reports, fact sheets, and web sites such as those listed in Appendix D. Good potential places to find this information include: local universities, NOAA-funded Regional Integrated Sciences and Assessment (RISA) teams (see Appendix D.5), Regional Climate Centers, State Climatologists, state environmental agencies, and the U.S. Environmental Protection Agency. The utility of any one information source will depend on your specific information needs and the level of detail to which you want to explore a particular issue.
Above all, be an informed consumer of climate change science. Know that the usefulness of any of these given resources will depend on your specific information needs, as well as the level of detail to which you want to explore a particular issue. Evaluate the soundness of individual climate science reports and impacts studies. Box 4.1 provides questions for you to ask in order to gauge the credibility of the sources you find.
Box 4.1 – I’m Not an Expert. How Can I Evaluate the Credibility of a Source?
There are many sources of information on climate change, ranging from comprehensive synthesis reports to basic fact sheets. How can a non-expert evaluate the validity of climate change information?
The following questions will help guide an informal assessment of the credibility of individual climate change studies. Reliable research will have many – though not necessarily all – of the attributes listed below. In some cases, it may be difficult to determine if and how a study meets these criteria. When in doubt, consider consulting with experts from local universities, RISA teams, professional/technical organizations, federal agencies, and/or non-governmental organizations involved in climate change related activities. Also be aware that understanding the local impacts of climate change might require the expertise of more than one scientific discipline, and that you might want to consider consulting scientific experts from a variety of disciplines to ensure that your source is credible.
Questions to help you evaluate climate change studies:
Are the authors clearly identified as experts? Are the authors considered credible and reliable sources of climate change information? Just as you would ask an expert witness to testify on the technical aspects of a case, you will want experts in climate science or climate impacts to guide your decisions. These experts may have advanced degrees in a related science (e.g., atmospheric sciences, chemistry, hydrology, fisheries, ecology, or forestry), be affiliated with respected climate change research groups, and/or have direct experience in climate science and impacts research.Has the study been “peer-reviewed”? To evaluate if a publication has been peer reviewed (or “refereed”), check the publisher’s website, an individual issue of the journal in
•
•
which the article appeared, or the preface of the report (if one exists). Some online databases and periodical directories now indicate peer-reviewed journals; reference librarians can also help track down information about individual sources. Unless explicitly stated otherwise, academic journals and major synthesis reports are generally peer reviewed, but conference proceedings, web-based contents, and other reports are generally not peer-reviewed (unless they are pulled directly from a peer-reviewed source). Do the study results make sense? Are the authors using data and peer-reviewed research to support their claims? Are the conclusions based on reasonable assumptions supported by other studies and consistent
•
A GUIDEBOOK FOR LOCAL, REGIONAL, AND STATE GOVERNMENTS ��
4.1.2 How is Climate Expected to Change in Your Region?
You need to know something about the specific ways your region’s climate may change in the future, in order to assess the potential impacts of climate change on your region. This section provides insights on the types of information you will want to collect and how to organize the information for use in the preparedness planning process.
Begin by collecting information on a few key climate variables, such as temperature and precipitation. Other important variables may include, but are not limited to, sea level, extreme weather (e.g., hurricanes and storms), and wind. As you collect your information, aim to respond to the question, “How is temperature (or precipitation, or sea level) projected to change during the 21st century?” with one of the following answers: “It is projected to increase/decrease/stay the same,” or “The projected change is not yet known.” Use specific numbers when available and always identify the specific future time horizon (e.g., 2020s, 2040s, 2080s).
Try to collect information about how climate changes will vary with season. Depending on availability, you might also be able to collect additional information about how the projected
with the general theory associated with those assumptions? Are there obvious inconsistencies in the train of logic being applied or are the conclusions logically derived from the assumptions and supported by the data presented? Make sure that the claims are well documented, that they make sense to you, and that any information gaps or inconsistencies are adequately explained.Are the results placed in the context of existing understanding? Scientific research builds on the existing foundation of knowledge published in the peer-reviewed literature. Do the authors discuss the assumptions, data, analysis, and/or conclusions of their study in the context of the prevailing body of scientific knowledge? Do they support their conclusions with like examples from the published literature or point out differences and explain why they exist? Are the assumptions, analytical techniques, and conclusions well referenced with citations to relevant, credible literature, and other pertinent existing information?Is there supporting evidence for the author’s conclusions? If multiple studies or individual researchers arrived at the same conclusion independently, the conclusion is more likely to have increased credibility.Does the study address uncertainty? Projecting climate change involves uncertainties in both
•
•
•
how the natural world operates and how we alter it. Therefore, it is appropriate to report and discuss uncertainty. For example, projections of changes in climate or in regional impacts should be expressed as ranges of possibility (ideally with some estimate of the certainty associated with different numbers in the range) rather than as a single number.What are the potential biases? Who benefits from the study’s conclusion? Who funded the study? Are the interests and values of the authors apparent? What are your personal biases – do you want to believe or ignore this author’s conclusion? Awareness of potential biases helps you evaluate the validity of claims and your own decision making about the validity of scientific results. How old is the study? The science of climate change is rapidly evolving. As a specific example, the timing and amount of future warming is revised with every international assessment of climate change released by the IPCC. As a result, the timeliness of materials is often an important component of projected change and impacts. For older studies, the general findings may still be relevant even as the specific details change. What generation of climate change scenarios does this study rely on?
Based in part on Sagan 1997
•
•
PREPARING FOR CLIMATE CHANGE��
changes will vary with season, or how other parameters (e.g., number of frost days, frequency of extreme rain events, etc.), or other conditions of concern (e.g., windstorms, heat waves) are projected to change. Another useful question to ask is, “Are the projected changes bigger or smaller than the variations between cold/warm or wet/dry years this region has experienced in the past?” This information will help you put the size of the projected changes into perspective.
Collect information about the range of climate change that your community could experience. When possible, avoid using only one projection of future climate (e.g., 12 inches of sea level rise). Remember that future changes in climate are really about a range of future possibilities (“projections”), not a single best-guess possibility (a “prediction”) (Box 2.2). A common approach to planning for climate change is to develop three scenarios – “worst-case, “best-case,” and “mid-range” – to limit the range of possible future outcomes. For now, collect what information you can about projected future change to make sure that your analysis adequately accounts for the amount of change your region could experience.
Understand and log the certainty of your information. Record the degree of confidence associated with the different aspects of the scenarios, regardless of the amount of detail available. In some cases, such as in the IPCC reports, this information will be clearly provided along with the climate change scenarios. In other cases, you may need to consult with climate science experts or use your best judgment based on the following general rules of thumb:
temperature projections are much more certain than precipitation projections; and
climate change projections less than five years old and/or based on multiple models are likely to be more robust and better reflect current understanding of climate change science.
You can also assess the certainty associated with climate projections by examining how much the available climate models agree about the direction of the projected change (more or less, up or down). In the U.S. Pacific Northwest, for example, ten climate models examined by the Climate Impacts Group universally agree that the region will warm during the 21st century, even though the specific amount of warming varies between models. There is less consensus in the models on whether precipitation will increase or decrease on an annual basis (although indications are that there will be a slight increase in annual precipitation with most of this increase coming during the winter months). Recognizing this uncertainty, King County chose to focus the vulnerability assessment informing its 2007 Climate Plan most heavily on impacts resulting from warmer temperatures, and less on those dependent on a specific change in the amount of winter precipitation.
Understand and track why projections of a change may vary from one study to another. You may find that the specific amount of projected change varies from study to study, often depending on the specific global climate model(s) and emission scenario(s) used in the study, or the method used to translate projected global change to the local level (see Appendix B). It is important to track this information to understand the reason for these differences. By keeping track of such information, you will be more able to resolve apparent contradictions as they occur, and you will be ready to update your scenario information as projections are revised. You may be able to work with the local scientific community to determine which scenario(s) best reflect current understanding.
•
•
A GUIDEBOOK FOR LOCAL, REGIONAL, AND STATE GOVERNMENTS ��
Track other critical information about the studies and reports you collect. As you note how climate is projected to change in your region, be sure to record:
the source of the information (including publication and year);
the climate model(s) used to construct the climate projection (e.g., the National Center for Atmospheric Research’s Community Climate System Model [CCSM]);
the greenhouse gas emission scenario(s) used to guide the climate projection;
both the timeframe for the future projection (e.g., the 2040s) and the timeframe for comparison (e.g., the 1970-1999 average historical climate);
the geographical area over which the projection was made (e.g., the United States; the Pacific Northwest, which includes Washington, Oregon, Idaho; or the State of Washington).
As you review sources for information about projected changes in regional climate, you may come across reports on impacts to specific areas of interest, such as water supply, forests, and human health. These areas are referred to in this guidebook as sectors. Hold onto this information; you will want it for the next step.
Consider assembling the information you have collected in a table, such as that shown in Table 4.1 for the U.S. Pacific Northwest. When possible, work with knowledgeable climate change experts to review these scenarios for obvious errors, reasonable (or unreasonable) results, and appropriate confidence estimates.
Checkpoint: Upon finishing this section, you should have a summary of how your region’s climate is projected to change as a result of climate change. You should also have general understanding of how to identify what information is relevant to your community, so that you are able to communicate why and in what specific areas preparing for climate change will be important.
•
•
•
•
•
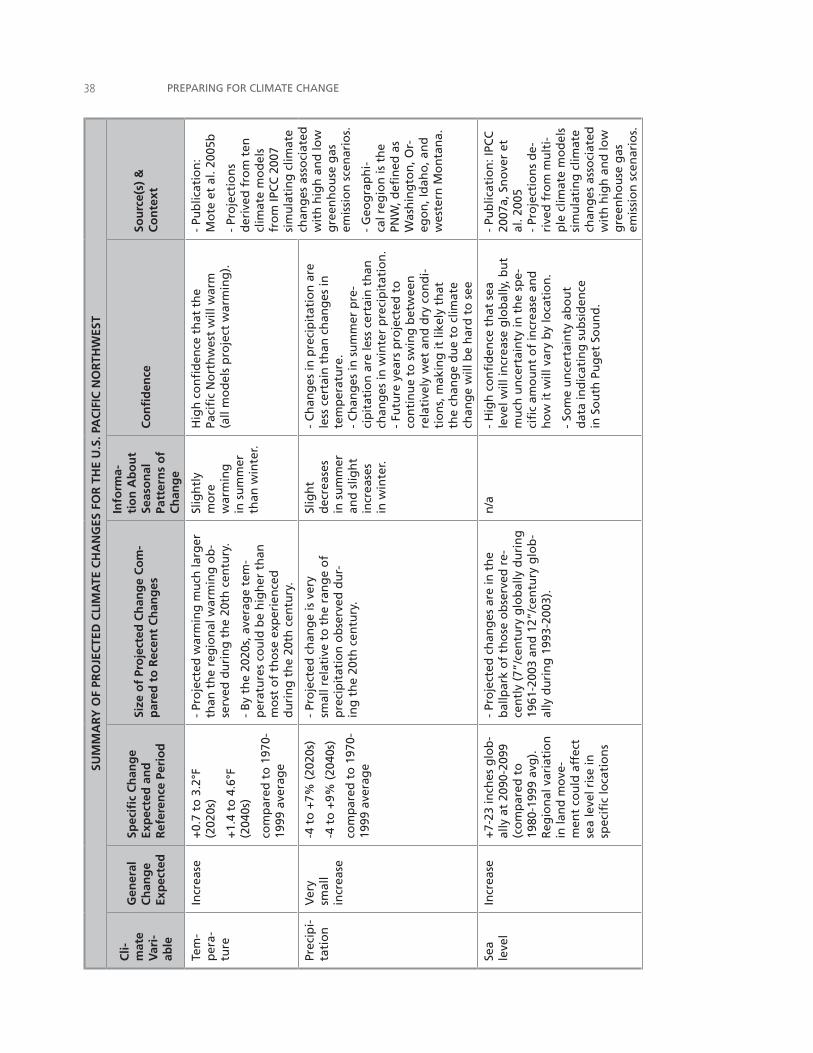
PREPARING FOR CLIMATE CHANGE��SU
MM
ARY
OF
PRO
JEC
TED
CLI
MA
TE C
HA
NG
ES F
OR
TH
E U
.S. P
AC
IFIC
NO
RTH
WES
T
Cli-
mat
e V
ari-
able
Gen
eral
C
han
ge
Exp
ecte
d
Spec
ific
Ch
ang
e Ex
pec
ted
an
d
Ref
eren
ce P
erio
d
Size
of
Pro
ject
ed C
han
ge
Co
m-
par
ed t
o R
ecen
t C
han
ges
Info
rma-
tio
n A
bo
ut
Seas
on
al
Patt
ern
s o
f C
han
ge
Co
nfi
den
ceSo
urc
e(s)
&
Co
nte
xt
Tem
-p
era-
ture
Incr
ease
+0.
7 to
3.2
°F
(202
0s)
+1.
4 to
4.6
°F
(204
0s)
com
par
ed t
o 1
970-
1999
ave
rag
e
- Pr
oje
cted
war
min
g m
uch
larg
er
than
th
e re
gio
nal
war
min
g o
b-
serv
ed d
uri
ng
th
e 20
th c
entu
ry.
- B
y th
e 20
20s,
ave
rag
e te
m-
per
atu
res
cou
ld b
e h
igh
er t
han
m
ost
of
tho
se e
xper
ien
ced
d
uri
ng
th
e 20
th c
entu
ry.
Slig
htl
y m
ore
w
arm
ing
in
su
mm
er
than
win
ter.
Hig
h c
on
fid
ence
th
at t
he
Paci
fic
No
rth
wes
t w
ill w
arm
(a
ll m
od
els
pro
ject
war
min
g).
- Pu
blic
atio
n:
Mo
te e
t al
. 200
5b
- Pr
oje
ctio
ns
der
ived
fro
m t
en
clim
ate
mo
del
s fr
om
IPC
C 2
007
sim
ula
tin
g c
limat
e ch
ang
es a
sso
ciat
ed
wit
h h
igh
an
d lo
w
gre
enh
ou
se g
as
emis
sio
n s
cen
ario
s.
- G
eog
rap
hi-
cal r
egio
n is
th
e PN
W, d
efin
ed a
s W
ash
ing
ton
, Or-
ego
n, I
dah
o, a
nd
w
este
rn M
on
tan
a.
Prec
ipi-
tati
on
Ver
y sm
all
incr
ease
-4 t
o +
7% (
2020
s)
-4 t
o +
9% (
2040
s)
com
par
ed t
o 1
970-
1999
ave
rag
e
- Pr
oje
cted
ch
ang
e is
ver
y sm
all r
elat
ive
to t
he
ran
ge
of
pre
cip
itat
ion
ob
serv
ed d
ur-
ing
th
e 20
th c
entu
ry.
Slig
ht
dec
reas
es
in s
um
mer
an
d s
ligh
t in
crea
ses
in w
inte
r.
- C
han
ges
in p
reci
pit
atio
n a
re
less
cer
tain
th
an c
han
ges
in
tem
per
atu
re.
- C
han
ges
in s
um
mer
pre
-ci
pit
atio
n a
re le
ss c
erta
in t
han
ch
ang
es in
win
ter
pre
cip
itat
ion
. -
Futu
re y
ears
pro
ject
ed t
o
con
tin
ue
to s
win
g b
etw
een
re
lati
vely
wet
an
d d
ry c
on
di-
tio
ns,
mak
ing
it li
kely
th
at
the
chan
ge
du
e to
clim
ate
chan
ge
will
be
har
d t
o s
ee
Sea
leve
lIn
crea
se+
7-23
inch
es g
lob
-al
ly a
t 20
90-2
099
(co
mp
ared
to
19
80-1
999
avg
).
Reg
ion
al v
aria
tio
n
in la
nd
mo
ve-
men
t co
uld
aff
ect
sea
leve
l ris
e in
sp
ecifi
c lo
cati
on
s
- Pr
oje
cted
ch
ang
es a
re in
th
e b
allp
ark
of
tho
se o
bse
rved
re-
cen
tly
(7”/
cen
tury
glo
bal
ly d
uri
ng
19
61-2
003
and
12”
/cen
tury
glo
b-
ally
du
rin
g 1
993-
2003
).
n/a
- H
igh
co
nfi
den
ce t
hat
sea
le
vel w
ill in
crea
se g
lob
ally
, bu
t m
uch
un
cert
ain
ty in
th
e sp
e-ci
fic
amo
un
t o
f in
crea
se a
nd
h
ow
it w
ill v
ary
by
loca
tio
n.
- So
me
un
cert
ain
ty a
bo
ut
dat
a in
dic
atin
g s
ub
sid
ence
in
So
uth
Pu
get
So
un
d.
- Pu
blic
atio
n: I
PCC
20
07a,
Sn
ove
r et
al
. 200
5 -
Pro
ject
ion
s d
e-ri
ved
fro
m m
ult
i-p
le c
limat
e m
od
els
sim
ula
tin
g c
limat
e ch
ang
es a
sso
ciat
ed
wit
h h
igh
an
d lo
w
gre
enh
ou
se g
as
emis
sio
n s
cen
ario
s.
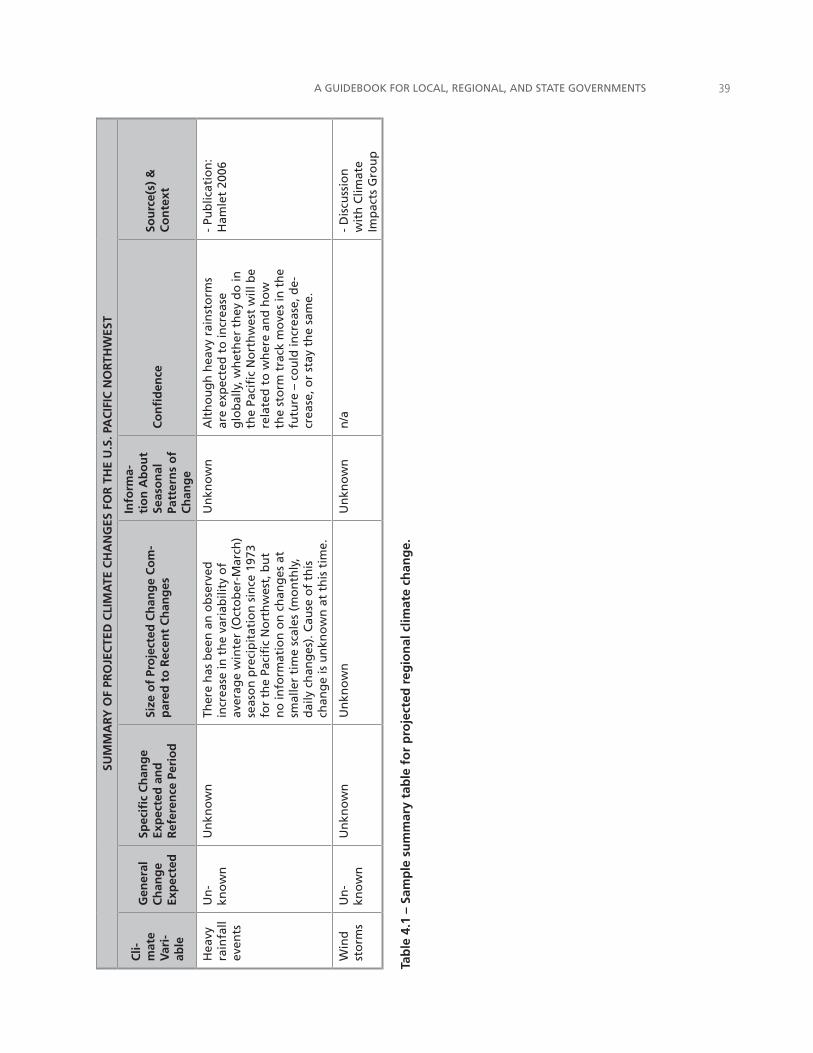
A GUIDEBOOK FOR LOCAL, REGIONAL, AND STATE GOVERNMENTS ��
SUM
MA
RY O
F PR
OJE
CTE
D C
LIM
ATE
CH
AN
GES
FO
R T
HE
U.S
. PA
CIF
IC N
OR
THW
EST
Cli-
mat
e V
ari-
able
Gen
eral
C
han
ge
Exp
ecte
d
Spec
ific
Ch
ang
e Ex
pec
ted
an
d
Ref
eren
ce P
erio
d
Size
of
Pro
ject
ed C
han
ge
Co
m-
par
ed t
o R
ecen
t C
han
ges
Info
rma-
tio
n A
bo
ut
Seas
on
al
Patt
ern
s o
f C
han
ge
Co
nfi
den
ceSo
urc
e(s)
&
Co
nte
xt
Hea
vy
rain
fall
even
ts
Un
-kn
ow
nU
nkn
ow
nTh
ere
has
bee
n a
n o
bse
rved
in
crea
se in
th
e va
riab
ility
of
aver
age
win
ter
(Oct
ob
er-M
arch
) se
aso
n p
reci
pit
atio
n s
ince
197
3 fo
r th
e Pa
cifi
c N
ort
hw
est,
bu
t n
o in
form
atio
n o
n c
han
ges
at
smal
ler
tim
e sc
ales
(m
on
thly
, d
aily
ch
ang
es).
Cau
se o
f th
is
chan
ge
is u
nkn
ow
n a
t th
is t
ime.
Un
kno
wn
Alt
ho
ug
h h
eavy
rai
nst
orm
s ar
e ex
pec
ted
to
incr
ease
g
lob
ally
, wh
eth
er t
hey
do
in
the
Paci
fic
No
rth
wes
t w
ill b
e re
late
d t
o w
her
e an
d h
ow
th
e st
orm
tra
ck m
ove
s in
th
e fu
ture
– c
ou
ld in
crea
se, d
e-cr
ease
, or
stay
th
e sa
me.
- Pu
blic
atio
n:
Ham
let
2006
Win
d
sto
rms
Un
-kn
ow
nU
nkn
ow
nU
nkn
ow
nU
nkn
ow
nn
/a-
Dis
cuss
ion
w
ith
Clim
ate
Imp
acts
Gro
up
Tab
le 4
.1 –
Sam
ple
su
mm
ary
tab
le f
or
pro
ject
ed r
egio
nal
clim
ate
chan
ge.
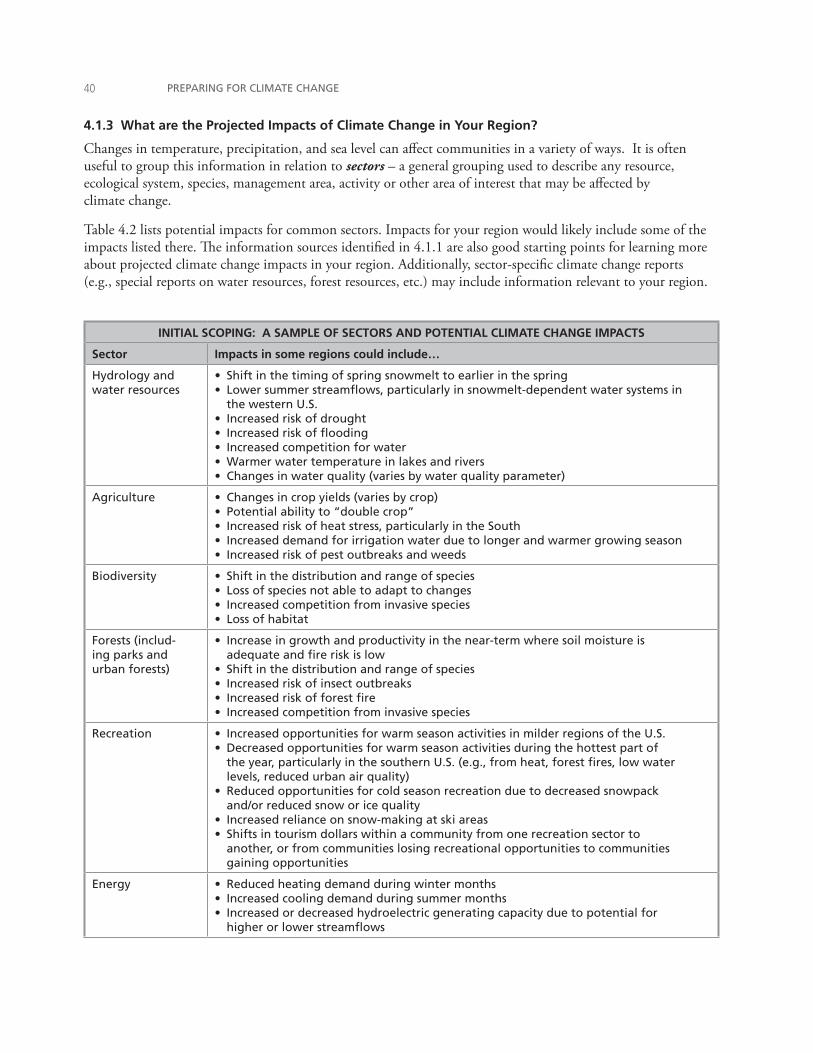
PREPARING FOR CLIMATE CHANGE�0
4.1.3 What are the Projected Impacts of Climate Change in Your Region?
Changes in temperature, precipitation, and sea level can affect communities in a variety of ways. It is often useful to group this information in relation to sectors – a general grouping used to describe any resource, ecological system, species, management area, activity or other area of interest that may be affected by climate change.
Table 4.2 lists potential impacts for common sectors. Impacts for your region would likely include some of the impacts listed there. The information sources identified in 4.1.1 are also good starting points for learning more about projected climate change impacts in your region. Additionally, sector-specific climate change reports (e.g., special reports on water resources, forest resources, etc.) may include information relevant to your region.
INITIAL SCOPING: A SAMPLE OF SECTORS AND POTENTIAL CLIMATE CHANGE IMPACTS
Sector Impacts in some regions could include…
Hydrology and water resources
Shift in the timing of spring snowmelt to earlier in the springLower summer streamflows, particularly in snowmelt-dependent water systems in the western U.S.Increased risk of drought Increased risk of floodingIncreased competition for water Warmer water temperature in lakes and riversChanges in water quality (varies by water quality parameter)
••
•••••
Agriculture Changes in crop yields (varies by crop) Potential ability to “double crop”Increased risk of heat stress, particularly in the South Increased demand for irrigation water due to longer and warmer growing season Increased risk of pest outbreaks and weeds
•••••
Biodiversity Shift in the distribution and range of speciesLoss of species not able to adapt to changesIncreased competition from invasive speciesLoss of habitat
••••
Forests (includ-ing parks and urban forests)
Increase in growth and productivity in the near-term where soil moisture is adequate and fire risk is lowShift in the distribution and range of speciesIncreased risk of insect outbreaksIncreased risk of forest fireIncreased competition from invasive species
•
••••
Recreation Increased opportunities for warm season activities in milder regions of the U.S.Decreased opportunities for warm season activities during the hottest part of the year, particularly in the southern U.S. (e.g., from heat, forest fires, low water levels, reduced urban air quality) Reduced opportunities for cold season recreation due to decreased snowpack and/or reduced snow or ice qualityIncreased reliance on snow-making at ski areasShifts in tourism dollars within a community from one recreation sector to another, or from communities losing recreational opportunities to communities gaining opportunities
••
•
••
Energy Reduced heating demand during winter months Increased cooling demand during summer monthsIncreased or decreased hydroelectric generating capacity due to potential for higher or lower streamflows
•••
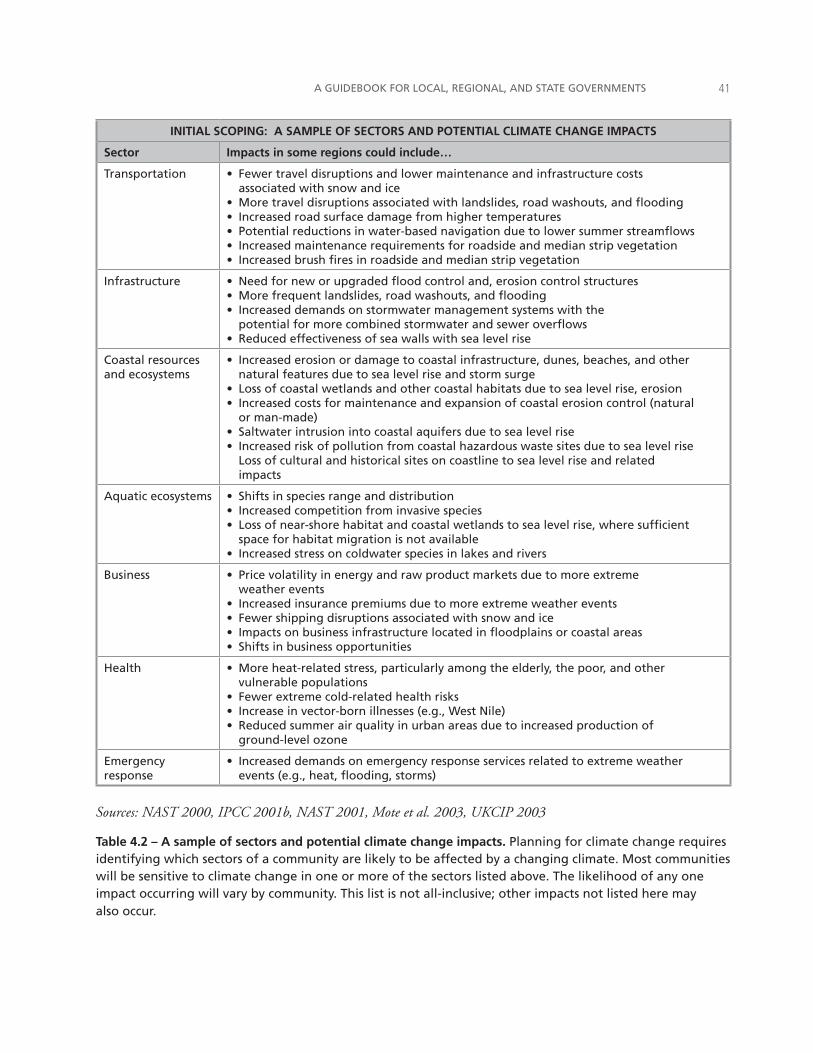
A GUIDEBOOK FOR LOCAL, REGIONAL, AND STATE GOVERNMENTS ��
INITIAL SCOPING: A SAMPLE OF SECTORS AND POTENTIAL CLIMATE CHANGE IMPACTS
Sector Impacts in some regions could include…
Transportation Fewer travel disruptions and lower maintenance and infrastructure costs associated with snow and iceMore travel disruptions associated with landslides, road washouts, and floodingIncreased road surface damage from higher temperaturesPotential reductions in water-based navigation due to lower summer streamflowsIncreased maintenance requirements for roadside and median strip vegetation Increased brush fires in roadside and median strip vegetation
•
•••••
Infrastructure Need for new or upgraded flood control and, erosion control structuresMore frequent landslides, road washouts, and floodingIncreased demands on stormwater management systems with the potential for more combined stormwater and sewer overflows Reduced effectiveness of sea walls with sea level rise
•••
•
Coastal resources and ecosystems
Increased erosion or damage to coastal infrastructure, dunes, beaches, and other natural features due to sea level rise and storm surge Loss of coastal wetlands and other coastal habitats due to sea level rise, erosionIncreased costs for maintenance and expansion of coastal erosion control (natural or man-made) Saltwater intrusion into coastal aquifers due to sea level riseIncreased risk of pollution from coastal hazardous waste sites due to sea level rise Loss of cultural and historical sites on coastline to sea level rise and related impacts
•
••
••
Aquatic ecosystems Shifts in species range and distributionIncreased competition from invasive species Loss of near-shore habitat and coastal wetlands to sea level rise, where sufficient space for habitat migration is not availableIncreased stress on coldwater species in lakes and rivers
•••
•
Business Price volatility in energy and raw product markets due to more extreme weather eventsIncreased insurance premiums due to more extreme weather eventsFewer shipping disruptions associated with snow and iceImpacts on business infrastructure located in floodplains or coastal areasShifts in business opportunities
•
••••
Health More heat-related stress, particularly among the elderly, the poor, and other vulnerable populationsFewer extreme cold-related health risks Increase in vector-born illnesses (e.g., West Nile)Reduced summer air quality in urban areas due to increased production of ground-level ozone
•
•••
Emergency response
Increased demands on emergency response services related to extreme weather events (e.g., heat, flooding, storms)
•
Sources: NAST 2000, IPCC 2001b, NAST 2001, Mote et al. 2003, UKCIP 2003
Table 4.2 – A sample of sectors and potential climate change impacts. Planning for climate change requires identifying which sectors of a community are likely to be affected by a changing climate. Most communities will be sensitive to climate change in one or more of the sectors listed above. The likelihood of any one impact occurring will vary by community. This list is not all-inclusive; other impacts not listed here may also occur.
PREPARING FOR CLIMATE CHANGE��
Depending on your information needs, resources, and the amount of climate change information available for your region, a preliminary list of impacts like Table 4.2 (but tailored to your region) may be sufficient for launching for your preparedness planning effort. As you develop your list, identify the various departments and/or programs that may be affected by these projected impacts. This information will help you determine which departments need to be involved in developing your preparedness plan.
In some cases a more detailed assessment may be needed to gather necessary support from your internal and external stakeholders. In all cases, more detailed information will be needed for your vulnerability assessment and developing your preparedness plan. For each source you examine, evaluate and record:
the sector(s) and/or types of species (where relevant) covered by the study
the changes (impacts) projected by the study
the time period in which those changes are expected (e.g., the 2020s, 2040s, 2100) and the reference period for comparison (e.g., 1950-2000 average conditions)
how the size of the projected changes compare to recent conditions
the models and greenhouse gas emissions scenarios used
the amount of confidence in the projections (to the extent that this can be assessed)
the geographic area covered by the study
the departments and/or programs within your community government that will be affected by the projected impacts
any other details that may be important for comparing and assessing the study results.
As with your research on changes in regional climate, record when projected impacts differ from study to study, and track the reasons that may have led those different conclusions. Remember that climate change impacts are estimated based on specific climate change scenarios; you will likely find a range of impact scenarios when there are a variety of climate change projections. Impact scenarios can also vary because of different methodologies and uncertainty associated with translating climate changes into sectoral changes, e.g., changes in water supply or fire risk.
Whether or not you need to consider a full range of impact scenarios depends partially on whether the climate change scenarios used to create them are up-to-date. For example, you might read a report that projects increased tree growth in your region’s forests during the summer. Examining the context of that projection, you may realize that the report is based on a scenario of significant increases in summertime precipitation. Your research on projected regional climate change, however, may have clearly indicated that summertime precipitation is now projected to decrease slightly. Given that the projected impact was based on outdated climate change scenarios, you might choose to eliminate it from consideration. Alternately, you might recall that
•
•
•
•
•
•
•
•
•
A GUIDEBOOK FOR LOCAL, REGIONAL, AND STATE GOVERNMENTS ��
simulation of future changes in summertime precipitation is considered to be extremely uncertain and decide to include the scenario of increased tree growth as a potential, but low-probability, future change caused by climate change.
Be sure to record this and other contextual information identified in Section 4.1.2. This information can help you evaluate the relevance or accuracy of the projected impact given the current understanding of how climate in your region is expected to change.
Checkpoint: Upon finishing this section, you should have a summary of how climate change is likely to impact your region’s natural and built resources, and which departments are likely to be affected by these projected impacts
4.1.4 How to Work with Little Information
More is currently known about how climate change will affect some parts of the country and some resources than is known about others. Depending on where your community is located, you may have trouble finding impacts information that seems sufficiently detailed for planning, or you may have trouble finding impacts information at all.
One option for dealing with little information about projected climate change impacts is to look at how sensitive your community is to past and present-day climate (e.g., drought) and weather events (e.g., floods). A good place to begin is with the various department heads and staff in your community government. What does their experience tell them about sensitivity to 20th century climate and weather events? What analyses have been done within their respective departments on climate and weather impacts? Consider developing and distributing a questionnaire to gather the relevant information. King County, Washington, for example, added questions about sensitivity to climate variability into a larger survey on potential climate change vulnerabilities in the County (see Box 8.3). Other options include collecting information through staff meetings, special workshops, or lunch-time brown bag discussions. Interviews with long-time residents, examining government records, and reviewing media archives are also effective ways of gathering more information on the impacts of notable past climate and weather events.
In addition to examining past and present climate impacts, you can extrapolate information about local impacts from broader-scale studies or studies from other regions to develop a picture of how climate change might affect your region or specific sectors within your region (e.g., forests or water supply). This exercise can provide valuable qualitative information, but it is important to note that local impacts may vary from study results given the specific characteristics of the local system. If possible, consult with an expert familiar with the underlying causes of climate sensitivity to evaluate whether that information holds true from one region to another, and to find out any necessary caveats. The Appendix provides additional sources of information on climate change impacts and adaptation.
If you are not able to consult experts, we recommend that you do not rely on this information for developing detailed preparedness actions, except those that could be considered “no-regrets” (Chapter 11).
PREPARING FOR CLIMATE CHANGE��
4.2 What Will Your Level of Commitment Be? Once you have collected and reviewed a body of basic information about climate change impacts to your region, it is time to decide whether the information warrants moving forward with preparedness planning. Using the impacts listed in Table 4.2 or your own list of potential impacts for the region, ask the questions: Will climate change have an impact on my community and my government’s responsibilities? Do these impacts appear significant enough to begin preparing for climate change?
“Yes, we will prepare for climate change.” If the answer to these questions is “yes,” it is time to begin preparing for climate change. If you are a public official, consider proposing a resolution that directs your government to form a team and take steps to prepare for climate change, including writing a preparedness plan with regular updates. This kind of legislation, like King County’s Executive Orders on Global Warming Preparedness of March 2006 or the King County Council Ordinance on Global Warming of October 2006, can provide a useful foundation to which your government, your future preparedness team (Chapter 6) and your successors will be able to refer at a later date.
Your level of commitment to planning will differ from that of other governments. Several factors may influence the scale of your community’s planning efforts, including:
The degree of interest and support for preparedness planning among your community’s elected officials, your senior management, and your public. Perceptions of how climate change may or may not affect the community will strongly influence this initial interest. Over time, you may find that the results of your vulnerability assessment will influence these perceptions, and persuade your stakeholders to commit more resources to a preparedness effort. Look for suggestions about building and maintaining support for preparedness in Chapter 5.
Logistical factors such as community size, resource availability, and types of authorities. The size of your community will obviously determine the type and amount of technical, fiscal and staff resources available for preparedness planning. Lack of access to technical experts outside your government could also limit your efforts. Additionally, the range of authorities that your government has could influence how ambitious you want to be in developing your process and plan.
In some cases, your initial scoping exercise may show that climate change is a concern for your community, but that there is little your community can do on its own to plan for these impacts. For example, you may be part of a small community with limited public services. Or,
climate change may have greater relevance to other levels of government (such as your county government) that provide many basic services to your community. In these cases, you may still want to move forward in the planning process with the objective of building support for planning within the other government organizations that do have a role in managing climate change impacts on your community. Your case may be strengthened by working with other similarly situated small communities in your region.
•
•
Consider proposing a resolution that directs your government to form a team and take steps to prepare for climate change, including writing a preparedness plan with regular updates.
A GUIDEBOOK FOR LOCAL, REGIONAL, AND STATE GOVERNMENTS ��
If the answer is unclear, you may want to look for additional information and/or consult with local experts again (when available) to review your initial assessment. Box 6.2 provides information on identifying and selecting science advisors. Alternatively, the initial scoping exercise may show there are currently few impacts to the community that warrant preparedness actions. If so, stay tuned to developments in climate change science and your impacts assessment. New information may change your initial assessment.
The planning process provided in this guidebook can and should be scaled to the level that is appropriate for your community. At one end of the spectrum, you may need to work on this process in incremental steps, focusing initially on a simple literature review, reducing vulnerability to today’s climate and weather events in one or two key sectors, and basic public education. At the other end of the spectrum, you may decide to launch an officially-recognized, multi-sector climate change preparedness program using a formally established preparedness team, a full-time preparedness coordinator, and new research (where appropriate) to examine climate change impacts and preparedness needs across multiple government departments.
Checkpoint: Upon finishing this section, you should have passed a resolution that directs your government to form a team and take steps to prepare for climate change, including writing a preparedness plan with regular updates.

PREPARING FOR CLIMATE CHANGE��
��
chapter � bu�ld and ma�nta�n support to prepare for cl�mate change
Once you have scoped out the impacts of climate change to your community’s sectors, you are ready to develop the support needed from your community and executive-level leaders to conduct a climate resiliency study. Outreach will play a major role in building and maintaining support to launch your planning effort. At later stages of planning, your work will also benefit from the investment in outreach by creating a common understanding among your various partners and stakeholders of how your region’s climate may change in the coming decades. These partners and stakeholders may include public officials, local government staff, key businesses, non-governmental organizations, and the general public. To help build and maintain support for preparedness planning, this chapter provides guidance on how to:
identify a climate change “champion”
identify your target audience for your outreach activities
develop a preparedness message
spread the preparedness message.
As in other stages of the process, you should scale your activities related to building and maintaining support to fit your local, regional or state circumstances. Most importantly, you should also recognize that preparing for climate change requires an ongoing commitment to internal (i.e., within your government) and external (i.e., with the community-at-large) outreach at levels appropriate for your community.
5.1 Identify or Cultivate a “Champion” for PreparednessAcross local, regional and state governments already planning for climate change, at least one element is common: all have a leader or leaders at the high level of government who are committed to learning about climate change impacts and to making the hard decisions that will prepare that region most effectively for those impacts (Penney and Wieditz 2007). These hard decisions can be vulnerable to criticism when they challenge the status quo. Therefore, the champion who leads this change must be respected and trusted by the public and other leaders, conversant about climate change impacts, and willing to take risks by developing policy recommendations that will be different in some areas from the old ways of doing business.
•
•
•
•
INITIATE YOUR CLIMATE RESILIENCY EFFORTThe following chapters recommend how to reach CRC Milestone One, “Initiate Your Climate Resiliency Effort”:
Chapter 4: Scope the Climate Change Impacts to Your Major Sectors
Chapter 5: Build and Maintain Support to Prepare for Climate Change Impacts
Chapter 6: Build Your Climate Change Preparedness Team
Chapter 7: Identify Your Planning Areas Relevant to Climate Change
1MILESTONE
PREPARING FOR CLIMATE CHANGE��
In the best case scenario, you may already have a champion who can build support for preparedness planning. If you are a public official or an advisor to a public official, you may be that champion.
In other cases, clear leadership on this issue may be lacking, and you may have to cultivate a climate preparedness champion. You may also want to engage champions outside of your government to validate your internal efforts. You may be able to find a leader who is already committed to other environmental issues and who is willing to expand his or her focus to include climate change preparedness. Other potential champions include, but are not limited to, former elected officials or department heads (e.g., a former utilities director), key business leaders, long-range planners, and/or other respected members of the community-at-large. Depending on the values of your region, an “economic champion” on climate change could be even more powerful than an “environmental champion.”
Checkpoint: Upon finishing this section, you should have identified a climate change “champion,” and should be involving that person in your preparedness effort (if he/she is not already leading it).
5.2 Identify and Understand Your Audience for OutreachBefore beginning any outreach activities, identify your target audiences (e.g., other elected officials, senior management, other staff, general public) and understand their basic interests. For simplicity, you can consider your target audiences to be in four groups: the public sector; the private sector; non-profit organizations; and media. The general public is represented across all of these categories. You may also want to identify individuals who especially influence conventional opinion within each of these groups.
During the early stages of your outreach work you will likely need to focus on generating support internally through outreach to other elected officials, department heads, and/or staff members. As planning progresses, increase external outreach to community members and partners, and continue internal outreach to maintain support and interest within your organization for preparedness planning.
Know that different members of your audience will have different opinions and information needs, and that they may trust different sources of information. Be ready to listen and be flexible enough to tailor your message while keeping the core message consistent.
Outreach should be ongoing, especially as both internal and external audiences should later be tapped for input during the development of your climate change preparedness plan (Chapter 10) and/or support for specific preparedness actions. Various types of internal and external outreach activities are provided in 5.4.
Checkpoint: Upon finishing this section, you should have a list of your target audiences for your climate change outreach activities. Who is your internal audience? Who is your external audience?
A GUIDEBOOK FOR LOCAL, REGIONAL, AND STATE GOVERNMENTS ��
5.3 Develop a Preparedness MessageEstablishing a clear message on the importance of and need for climate change preparedness is vital to the success of your planning effort. The following are suggestions for developing a message to raise and maintain awareness and motivation for preparedness planning. Many of these message points also address the common barriers to preparing for climate change discussed in Chapter 3.
Describe changes that have already been observed. There are many indications that the Earth’s climate and various physical and ecological systems are changing in response to 20th century warming. Some of these may be changes that local residents have observed firsthand. Including this information can underscore that climate change is occurring and, in many respects, having a measurable impact on Earth’s systems. Refer to Appendix A and more recent scientific studies to describe changes in climate, hydrology, and/or ecosystems that have already been observed in your region or similar areas. It is important to note that some of these changes may reflect changes in natural variability as well as long-term changes in average temperature. Be careful not to attribute observed changes to human-caused climate change entirely, unless there is scientific evidence to back up the claim.
Describe changes that are expected. Using the information you collected in your initial scan (Chapter 4) and any additional information collected later in the planning process, provide information on how temperature, precipitation, snowpack, and other aspects of climate and the environment are expected to change in your region as a result of climate change.
Describe how climate change may impact the community. Using the information you collected in Chapter 4, explain the potential regional and local consequences of climate change. Impacts may include sea level rise, changes in water supply, and increased risk of drought, forest fires, extreme events, flooding, and/or disease. Be careful not to overstate what you know about impacts to your region or you risk losing credibility with key audiences.
Convey the need for action but balance the challenges with optimism. It is important to communicate why planning for climate change is needed; see Chapter 3 for more on this point. Be careful, however, that the message does not leave your audience with a sense of hopelessness. Discussions on climate change can quickly turn negative given the scale of the problem, the breadth of projected impacts, and the changes needed to deal meaningfully with these impacts. In engaging the public on the need for preparedness, communicate openly and practically with action-oriented language. Be careful to strike a balance between the realities of climate change, the need for action, and the proactive steps that can be taken to address the problem at all levels.
•
•
•
•
PREPARING FOR CLIMATE CHANGE�0
Identify other communities similar to yours that are planning for climate change. In some cases, it may be helpful for people to see that other communities similar to yours are taking steps to address climate change impacts. ICLEI – Local Governments for Sustainability, its Climate Resilient Communities Program, USEPA, and the Center for Clean Air Policy’s Urban Leaders Initiative are all good resources for identifying other communities working on climate change activities. Other such online clearinghouse sites may also be available (see Appendix D for more sources). With time, it will be possible to focus on those strategies that have worked for other community governments like yours. Identifying your peers and exchanging experiences can be empowering and helpful.
Develop a course of action. Outline what you intend to achieve and the steps your local government intends to take to prepare for the projected changes. Update your message with details on your community’s course of action as the planning process progresses and your plan is implemented.
Acknowledge that questions remain. Do not be reluctant to admit that questions remain. Clearly communicating what you do know – while being honest about what questions still need to be answered – will be critical to gaining and maintaining credibility, interest, understanding, and support for your preparedness work. Be sure to emphasize, however, that enough information is available for (and warrants) moving forward with planning. Also note that your community will continue to follow developments in climate change science for new information that can help close key information gaps.
You will want to modify the content of your message according to your audience, the outreach tool you are using, and the status of your planning effort. Rather than trying to create all materials from scratch, consider drawing on existing sources of information, with permission and proper crediting of the source. A wide variety of materials that describe the causes and consequences of climate change – from fact sheets to posters and PowerPoint slides – may be available online and could be adapted for local outreach purposes. See Appendix 8.4.1 for suggested starting places.
Above all, keep your message simple. Work with local experts throughout your planning process, to distill information into a form that is both technically accurate and understandable. Also consider partnering with others, including other governments, university researchers and/or graduate students, and/or appropriate non-governmental organizations to do this public outreach.
Checkpoint: Upon finishing this section, you should have the main points and supporting information of your outreach message assembled. What are the key points you want all audiences to hear? Remember that the details supporting the central message points will evolve over time and will vary with the outreach tool and audience.
•
•
•
A GUIDEBOOK FOR LOCAL, REGIONAL, AND STATE GOVERNMENTS ��
5.4 Spread the MessageTo maximize the reach of a communications effort, use a variety of outreach tools and use them repeatedly. Be aware of which materials work for internal audiences (e.g. departments or city council, if you work in public office) and which are best for external audiences (e.g., general public and other partners or stakeholders). Following are a few suggestions.
For internal audiences:
Brown-bag seminars. Brown bag seminars are typically lunchtime presentations where participants bring their own lunches and attendance is voluntary. Seminars can be structured around a theme, such as climate change impacts on water supplies. The substance of a conversation can build sequentially from one brown bag to the next (i.e., starting with the climate change fundamentals then moving into impacts and preparedness). Speakers may include: scientists or other experts; federal, state, or other local governmental agency staff who manage programs affected by climate change; elected officials or staff from community governments already preparing for climate change; and internal staff.
Department meetings. Department meetings can be scheduled as needed to cover specific topics. Presentations from outside parties (e.g., climate or resource management experts) can be scheduled as part of the meeting. The meetings typically provide a good opportunity for discussion and coordination with other departments. Remember, however, that preparing for climate change will not necessarily fit neatly into the mission of a single department. It will probably be necessary to call an interdepartmental meeting that includes other agencies affected by the impacts you identify.
Scientific briefings to councils and executive staff. Scientific briefings provide an opportunity for senior-level decision makers to ask questions of science experts directly. These briefings can be scheduled as part of a regular council meeting, during executive sessions, or as a separate meeting.
For both internal and external audiences:
Newsletters, fact sheets, utility inserts, and brochures. Newsletters and other similar print material can incorporate information on climate change impacts and planning. Written materials can be distributed via the mail or at public meetings, libraries, or government offices.
Websites. Websites are a particularly effective outreach tool, given how easily the Internet can be accessed across communities, income levels and professions (both within the government and by the general public). Information posted on the Internet can also be easily updated. A website can be designed to cater to a wide variety of audiences, using links to information of varying detail.
•
•
•
•
•
PREPARING FOR CLIMATE CHANGE��
For external audiences:
Public meetings. Public meetings on climate change and its regional impacts can be scheduled as a means of reaching the general public. Meetings may be scheduled around particular events, such as launching a new program, decisions about major infrastructure investments that may be affected by climate change, or specific climate-related events such as drought. See Box 5.1 for an example.
Press releases/public statements. Press releases and public statements, including legislative resolutions, can be distributed to draw the public’s attention to specific activities that a community government is pursuing to manage the process of climate change preparedness.
•
•
Box 5.1 – “The Future Ain’t What It Used to Be: Planning for Climate Disruption” –
The King County, Washington, Climate Change Conference
On October 25, 2005, King County, Washington, convened a major conference to discuss projected climate change impacts for Washington State, potential adaptation strategies, and broader goals for moving forward on planning for climate change. The conference, titled “The Future Ain’t What It Used to Be: Planning for Climate Disruption”, featured speakers from across disciplines and levels of government, including researchers, public officials, tribal representatives, private sector leaders, and citizens from across the region. The audience was equally diverse. Details on how the conference was organized are provided here.
Work in partnership. King County co-hosted the conference with 17 partners and 23 contributing organizations. Organizations represented a variety of different sectors, fields, and expertise, including insurance and financial services, environmental engineering, construction, architecture, and non-profit climate change advocacy organizations. Municipal government partners included the City and Port of Seattle. King County gained financial sponsorship, in-kind services and support from these entities and individuals by providing them with time at the speakers’ podium, advertising space and opportunities to participate in shaping the discussion sessions. The conference also significantly strengthened the county’s existing relationship with the Climate Impacts Group at the University of Washington.
Develop a common picture of climate change and its regional consequences. Organizers worked with the Climate Impacts Group to prepare 1) a scientific white paper about the effects of climate change, and 2) a series of primers containing compelling discussion questions about how to begin planning. These materials were distributed to participants at the conference and used to guide discussions during the conference working sessions. Organizers also structured the “bookend” plenary sessions 1) to provide an overview of climate change science, given by scientists, to establish a common understanding of the way regional climate has already changed and is projected to change, and 2) to elicit perspectives from elected officials to establish political direction and support for adaptation. More than a year after the conference, the background materials continue to be critical for developing a shared regional picture of climate change impacts to the Puget Sound region, and inspiring and guiding action across the region and within King County government.
A GUIDEBOOK FOR LOCAL, REGIONAL, AND STATE GOVERNMENTS ��
Bring both scientific “expert” and stakeholder voices to the discussion. Conference organizers consciously brought together scientific experts, public officials, and stakeholders to begin to wrestle with the range of compelling questions about how to move forward. Speakers included former New Jersey Governor and former administrator of the U.S. Environmental Protection Agency Christine Todd Whitman, the mayor of Washington State’s capitol (Olympia), and the business director of the Port of Seattle. From this diversity of people and disciplinary backgrounds emerged many compelling scientific, environmental, political, economic, and social questions. These discussions have been transcribed and can be found on the King County website.
Consider how climate change will affect different sectors. Breakout sessions of the conference were focused on impacts to specific sectors (e.g., agriculture, coastal areas, fish and shellfish, forestry, hydropower, water supply) with materials identifying probable “winners” and “losers” of climate change impacts. Sessions offered experts in those areas and concerned stakeholders an opportunity to come together to brainstorm solutions, raise questions and flesh out some initial opportunities or constraints for action. The papers and related discussion spotlighted memorable illustrations of how certain sectors, such as the Pacific Northwest ski industry, will be more vulnerable to climate change impacts. In the
case of the ski industry, the winter preceding the conference had seen a record low snowfall, which had forced nine of 11 ski resorts to close in mid-January (ordinarily the height of the ski season). This lack of snow had forced some resorts cut staffing by 80 percent.
Planning for and holding the conference had many important benefits. First, the conference helped King County get organized on climate change adaptation. The conference prompted the county and region to assess climate change effects on our natural and built environments more systematically. The conference also began to involve a broad range of county staff, including capital improvement project managers, division directors and supervisors, and engineers and science staff, in thinking about the tradeoffs and decisions related to the new topic of climate change adaptation. Finally, the conference greatly enhanced the interactions and long term working relationships of County staff with their business, nonprofit, and academic counterparts for their specific sectors. All of these benefits fed into the knowledge, ideas, enthusiasm, and collaborative spirit that helped to launch the county’s climate change action team and preparedness team in 2006, and later to develop the county’s first comprehensive climate change action plan in February 2007. The conference also contributed to the State’s subsequent funding of a statewide study of the economic impacts of climate change.
Media training events. Media training events for reporters and editors can be used to increase media awareness of climate change, local impacts, and governmental action. Speakers may include climate scientists, other experts, and/or members of the community government. This can be an opportunity to showcase what you are doing about climate change, and for the media to talk directly with regional experts and local officials without the pressure of a deadline.
Events aimed at businesses and nongovernmental organizations. Special events could include a large-scale leadership summit on climate change or, if resource constraints are an issue, one-on-one relationship building or smaller events such as workshops and seminars geared to the business community and nongovernmental organizations. These events can be used to solicit targeted feedback on preparedness options as well as for general outreach.
•
•
PREPARING FOR CLIMATE CHANGE��
It is critical to view outreach as an ongoing activity rather than a one-time event. In general, timing is not a concern; outreach activities can be implemented at any point. Much can be gained, however, when outreach is tied to external events. For example, increased public or political concern about a drought or severe forest fires can create a more receptive audience for climate change preparedness messages if these events are likely to increase as a result of climate change. Be careful in these instances not to attribute a specific event to climate change. The cause-and-effect linkage of any single event to climate change is not scientifically possible at this time. Also, as your outreach continues, continue engaging and utilizing experts within your community government, in non-governmental organizations, at universities, and in professional associations to help to educate and engage.
Checkpoint: Upon finishing this section, you should have a general idea of the different tools you can use for internal and external public education efforts and how you might want to employ these tools to build and maintain support for preparedness planning.
��
chapter � bu�ld your cl�mate change preparedness team
To conduct your climate resiliency study, you will need to coordinate activities across departments, jurisdictions and levels of government. This coordination may be achieved through a climate change preparedness team (the focus of this section) and/or by designating a climate change “point person” within your government. This chapter will help you create your climate change preparedness team by answering a series of common questions related to:
when, why, and how to form a preparedness team
characteristics to look for in team leader(s) and members
typical work efforts and products
launching your preparedness effort.
A brief description of the creation, staffing, and responsibilities of King County’s climate change preparedness teams is also included in Box 6.3 at the end of the Chapter.
6.1 Why Form a TeamFor many governments, as in King County, climate change (and planning for its impacts) will affect many services, operations and infrastructure, including: water supply, flood control, wastewater treatment, public health, environmental protection, planning and zoning, parks and recreation, economic development, and emergency preparedness.
To the extent that you can, cast your net wide in recruiting your team. One or two people may not be sufficient to accomplish this workplan. How well your government and community respond to the consequences of climate change may not only depend on the preparedness of an individual department, but also on numerous, cumulative actions across departments, divisions, and programs. Forming a climate change preparedness team with a cross-section of representatives from relevant departments or programs is therefore useful for overseeing, coordinating, and advocating for preparedness efforts.
However, you may find that a full-scale cross-departmental preparedness team is not feasible in your circumstances. For example, your resources may be limited. Please note that you may still be able to develop your preparedness plan within your current framework by finding expertise outside
•
•
•
•
INITIATE YOUR CLIMATE RESILIENCY EFFORTThe following chapters recommend how to reach CRC Milestone One, “Initiate Your Climate Resiliency Effort”:
Chapter 4: Scope the Climate Change Impacts to Your Major Sectors
Chapter 5: Build and Maintain Support to Prepare for Climate Change Impacts
Chapter 6: Build Your Climate Change Preparedness Team
Chapter 7: Identify Your Planning Areas Relevant to Climate Change
1MILESTONE
PREPARING FOR CLIMATE CHANGE��
Box 6.1 – Questions to Consider When Establishing a Climate Change Preparedness Team
What are the major impacts and priority planning areas that your preparedness team will address? Are the departments responsible for managing these impacts and priority planning areas represented on the team? What is the specific charge of your preparedness team? (The range of the team’s roles might include research about impacts, public education and policy development, and implementation of an adaptation plan. These roles will likely evolve over time based on conversation between members and the team leader.)Is your preparedness team being established as a permanent working group?How much time does the team have to accomplish this charge? What deliverables are expected and to whom? (Typical products include an agreed-upon summary of the impacts of climate change in the region, a description of how these impacts could affect different departments or programs, and a preparedness
•
•
•
•
•
plan, based on how each department or program intends to prepare for impacts.)What resources are available for the team to accomplish its work? (This evaluation should include financial resources, staff support, and/or access to technical consultants in the public and private sectors.)What authorities does the team have to accomplish its task? (The team should be able to: draft proposed legislation from the county executive or mayor; review and revise operational plans, managerial priorities, and capital investments.)Will team decisions be made by consensus, through voting, or by decision of the team leader in conjunction with department heads? Who will lead the team? To whom is the team accountable?How will the team manage input from the public and other jurisdictions/governmental entities potentially affected by adaptation strategies?
•
•
•
•••
6.2 How to Select Members for Your TeamThe number and background of team members will vary. The team makeup that is appropriate for your community will depend on the specific impacts likely to occur in your region; the governmental operations, infrastructure, and policies that will be affected; and how your community government intends to interact with other local governments, stakeholders, and the public to prepare for climate change. This understanding can and will evolve over time, and team members can be added over time as needed.
At a minimum, include one or more representatives from each department or division which is likely to be affected by climate change. Table 6.1 provides a quick reference list of departments and divisions that may need to be included in your preparedness team. Your team leader can work with department heads to have appropriate staff assigned to the preparedness team. Team members should have technical familiarity with the work areas being reviewed for adaptation planning. Technical briefings at the team meetings can help team members get familiar with climate change impacts and preparing for climate change.
of your organization, as described in 6.5. You can assess your need for an expanded preparedness team as more information becomes available. Questions to consider when establishing a team are listed in Box 6.1.
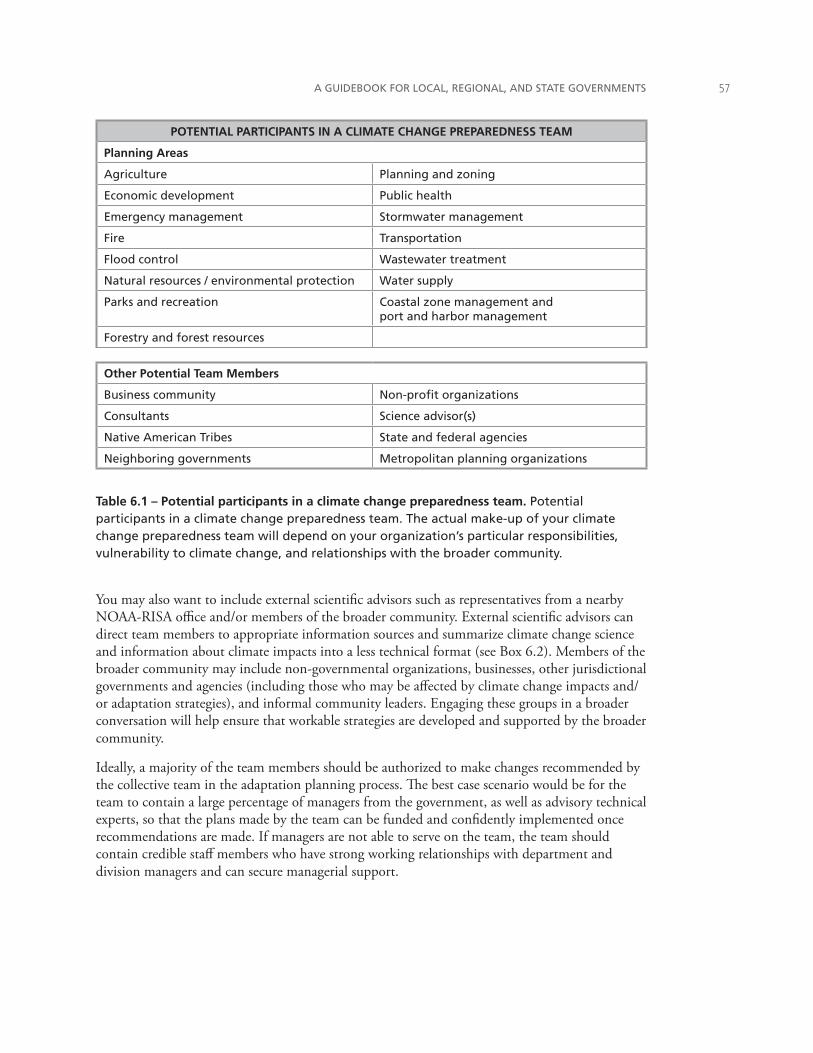
A GUIDEBOOK FOR LOCAL, REGIONAL, AND STATE GOVERNMENTS ��
POTENTIAL PARTICIPANTS IN A CLIMATE CHANGE PREPAREDNESS TEAM
Planning Areas
Agriculture Planning and zoning
Economic development Public health
Emergency management Stormwater management
Fire Transportation
Flood control Wastewater treatment
Natural resources / environmental protection Water supply
Parks and recreation Coastal zone management and port and harbor management
Forestry and forest resources
Other Potential Team Members
Business community Non-profit organizations
Consultants Science advisor(s)
Native American Tribes State and federal agencies
Neighboring governments Metropolitan planning organizations
Table 6.1 – Potential participants in a climate change preparedness team. Potential participants in a climate change preparedness team. The actual make-up of your climate change preparedness team will depend on your organization’s particular responsibilities, vulnerability to climate change, and relationships with the broader community.
You may also want to include external scientific advisors such as representatives from a nearby NOAA-RISA office and/or members of the broader community. External scientific advisors can direct team members to appropriate information sources and summarize climate change science and information about climate impacts into a less technical format (see Box 6.2). Members of the broader community may include non-governmental organizations, businesses, other jurisdictional governments and agencies (including those who may be affected by climate change impacts and/or adaptation strategies), and informal community leaders. Engaging these groups in a broader conversation will help ensure that workable strategies are developed and supported by the broader community.
Ideally, a majority of the team members should be authorized to make changes recommended by the collective team in the adaptation planning process. The best case scenario would be for the team to contain a large percentage of managers from the government, as well as advisory technical experts, so that the plans made by the team can be funded and confidently implemented once recommendations are made. If managers are not able to serve on the team, the team should contain credible staff members who have strong working relationships with department and division managers and can secure managerial support.
PREPARING FOR CLIMATE CHANGE��
External Advisory Boards
Preparedness planning and the specific strategies that come out of your planning process will need to reflect a sense of region-wide partnership and collaboration, and involvement from the general public will also be important. Depending on the scale of your planning effort, however, you may want to consider establishing an external advisory board instead of undertaking a major public process. Other reasons to expand the ownership of climate change preparedness to an external advisory board include the following:
Climate change crosses jurisdictions, sectors, and disciplines. Climate change preparedness is not the exclusive task of government. On the contrary, government needs to urge businesses, non-governmental organizations, and residents to undertake their own preparedness activities, in concert with regional planning. It may also eventually be necessary to ask these groups to support changes in zoning, building codes, utility rates, or best management practices in the course of implementing a preparedness plan.
Preparedness strategies may benefit from fresh perspectives. Building an outside team can bring fresh perspectives on how to adapt public
•
•
Science advisors can help your climate change preparedness team understand the science of climate change, projected regional impacts, and the confidence with which projections of future change are made. They can “translate” scientific information into terms understandable by an educated layperson and help identify additional sources of information. In selecting a scientist to serve as a climate change science advisor, it is important to consider both their professional credentials and their communication skills.
To evaluate professional credentials, consider whether the individual has earned an advanced degree(s) in a pertinent scientific discipline from a recognized university, the number of years of relevant experience, ability to produce peer-reviewed publications, and/or familiarity with both the global and regional consequences of climate change.
To evaluate communications skills and appropriateness for involvement in a governmental planning process, make sure the person under consideration is:
Interested in and willing to provide guidance on the use of scientific information in
•
the planning process, including guidance on dealing with scientific uncertainty; A clear communicator. Consider inviting the advisor to give a talk to your team on an aspect of climate change or regional impact science (e.g., “Observed and projected global climate change,” “Causes and consequences of climate change,” or “Local impacts of climate change”). Note how well s/he communicates scientific information and how willing and able s/he is to answer questions and engage in discussion in an understandable and approachable manner.Understanding of, or at least willing to learn about, the timescales and constraints of governmental planning processes.
Good starting points for identifying potential scientific advisors are local universities, professional and/or technical societies, NOAA-RISA teams (see Appendix D.5), and non-governmental organizations involved in climate change related activities. It is important to recognize that time and funding constraints can limit a researcher’s interest and ability to serve as a science advisor. This may be particularly true in areas where the demand for potential advisors exceeds supply.
•
•
Box 6.2 – Tips for Selecting Science Advisors
A GUIDEBOOK FOR LOCAL, REGIONAL, AND STATE GOVERNMENTS ��
operations and services, from those not involved in those operations on a daily basis. A diversity of opinion and background can benefit the greater good, such that low income and vulnerable populations are represented as well as manufacturers, developers, engineers and scientists. If government feels “stuck” on a particular problem or solution, an external advisory board can provide outside perspectives on the issue.
Bold preparedness strategies may need political support. Some governments may benefit from building an external advisory board of community leaders in the public and private sector to gain expert input, political capital, or other resources that the government might not have on its own. If board members are influential community leaders or well-connected professionals, they could prove to be very useful in spreading the word about the climate change preparedness effort, among the public and their broader networks of colleagues.
6.3 How to Select a Team LeaderAssign someone, or some combination of individuals, the responsibility of assembling the team and leading its efforts. This individual will also probably be different from your public “champion” who develops support for the cause but does not manage the efforts directly (see Section 5.1). Given that team members will come from various departments, the ideal team leader will be centrally located, have a good grasp of the organization’s overall responsibilities and objectives, and be able to communicate well with colleagues from other departments or divisions.
Your preparedness team leader should have authority and technical familiarity to work with staff members across the broad scope of government agencies. S/he should have authority to require deliverables from the departments represented on the team, as well as a strong working relationship with the government’s leadership, whom s/he will advise on the climate planning recommendations and progress over time. Without appropriate authority, the team leader may not be able to count on the willingness of departments to contribute.
It will be necessary for your team leader to have a general sense of which departments or divisions have authority over areas that are vulnerable to climate change. The leader should be able to identify the government functions likely to be affected by climate change based on the initial scoping of projected regional effects of climate change (Chapter 4). The team leader can then work with the relevant department heads to have appropriate staff assigned to the preparedness team. For this purpose, the team leader should have a strong relationship with department heads.
Basic understanding of climate change and climate change impacts is desirable but this knowledge can be improved through literature reviews, meetings with local experts, seminars, and other modes of public education. More critical are the leader’s managerial skills, including their ability to facilitate large meetings on complex topics and keep the team focused. Preparing for climate change requires input from a number of diverse disciplinary experts and departmental representatives, and new ways of working together across public organizations. Your team leader will therefore need to be able to facilitate group interaction and develop a sense of commitment from team members to feel collectively vested in the same outcome. For this important but somewhat intangible aspect of team management, you will want to select a team leader who is respected personally without a personal or institutional agenda that could conflict with
•
PREPARING FOR CLIMATE CHANGE�0
productive teamwork. An ability to communicate clearly with the public and community leaders will also be essential.
6.4 What the Team Will DoYour community’s preparedness team can serve multiple purposes but its primary responsibility is to guide how the government entity adapts to climate change. Ideally, the team will (over time) review all programs and services provided by the government organization, identify those potentially affected by climate change, and propose strategies for adaptation. Large governments might consider instituting teams on two levels: a senior-level team that coordinates preparedness activities for the government as a whole, and technical-level teams that coordinate activities within individual departments. For smaller governments, a single interdepartmental team may be all that is needed.
Your team should engage in a five basic stages of work – effectively the five major process steps of this guidebook (or the Climate Resilient Communities program Five Milestones):
conduct a climate resiliency study;
identify priority planning areas for action, based on assessments of your vulnerability and risk in selected planning areas;
set goals and develop your plan;
implement your plan;
measure your progress and update your plan.
Typical products include a consensus-based description of the regional impacts of climate change, how these impacts will affect the objectives, outcomes, and operations of different departments or programs, and how each department or program intends to prepare for these impacts.
Once the team is formed, the team as a whole should be briefed on what is currently known about climate change and major projected regional impacts. It is important for participants to know what the science can and cannot tell us at this point in time and how confident the scientific community is about various projected impacts. This step is valuable for establishing a common baseline of understanding among team members since it is unlikely that all team members will begin with the same degree of understanding or knowledge. The team will also need to address any remaining procedural issues noted in Box 5.1 and discuss how they would like to move forward in the planning process (using the remainder of this guidebook as a reference point for those discussions).
Establishing your team (or point person) and getting the necessary authorities and resources for the team will likely require action from your executive level leadership, which may be a mayor, city or county council, governor, or state legislature. This stage is therefore another good opportunity to launch your preparedness planning effort officially, with a resolution, press release, or another public event that would highlight the proactive steps your community is taking to address climate change impacts.
Be prepared for your team and its workplan to change. As you move through the vulnerability assessment detailed in Chapter 8, stop periodically to reflect on whether the team membership
•
•
•
•
•
A GUIDEBOOK FOR LOCAL, REGIONAL, AND STATE GOVERNMENTS ��
appropriately reflects the impacts of climate change that matter to your region. It may be that climate change will affect more sectors or resource areas in your community than initially realized, meaning that additional team members from other departments or divisions or from different external organizations may be needed. Conversely, some members may not be needed if fewer or different vulnerabilities in certain sectors are found. Periodically evaluating the match between team members, identified regional consequences of climate change, and potential response strategies will ensure the right personnel are in place for preparedness planning.
6.5 How to Make Progress with Limited Resources: Assign a Point Person When limited resources mean that forming a team is unrealistic, consider assigning a “climate change point person” to coordinate preparedness efforts and seek outside help. Your point person may be an existing staff member who takes on the additional responsibility of coordinating preparedness activities, or a new hire dedicated specifically to this task. Regardless, it will be important for that point person to have the following authorities, skills, and/or position in the government:
authority to request meetings with government staff and to require informational updates and climate planning products from across work areas;
technical familiarity with the roles, responsibilities, policies and practices across most or all areas of government, or an ability to learn quickly about those work areas;
working relationship with the government’s top leadership, for purposes of advising the leader(s) on plan and organizational recommendations;
ability to research, write, and communicate about regional climate change impacts and community vulnerabilities in a policy context;
personal initiative to champion a climate change planning process;
resourcefulness in finding and using outside resources to produce a government adaptation plan.
Without these characteristics, especially appropriate authority, the success of a point person to lead an adaptation planning process may be limited. Note that the description of this point person mirrors that of the climate change preparedness team leader, and we strongly suggest that the role is important enough to be delegated to a high-level staff member of the government.
Checkpoint: Upon finishing this section, you should have formed an interdepartmental climate change preparedness team representing the disciplines and departments appropriate for the climate change impacts you preliminarily scoped for your region. This team should have strong leadership and top-level support.
•
•
•
•
•
•
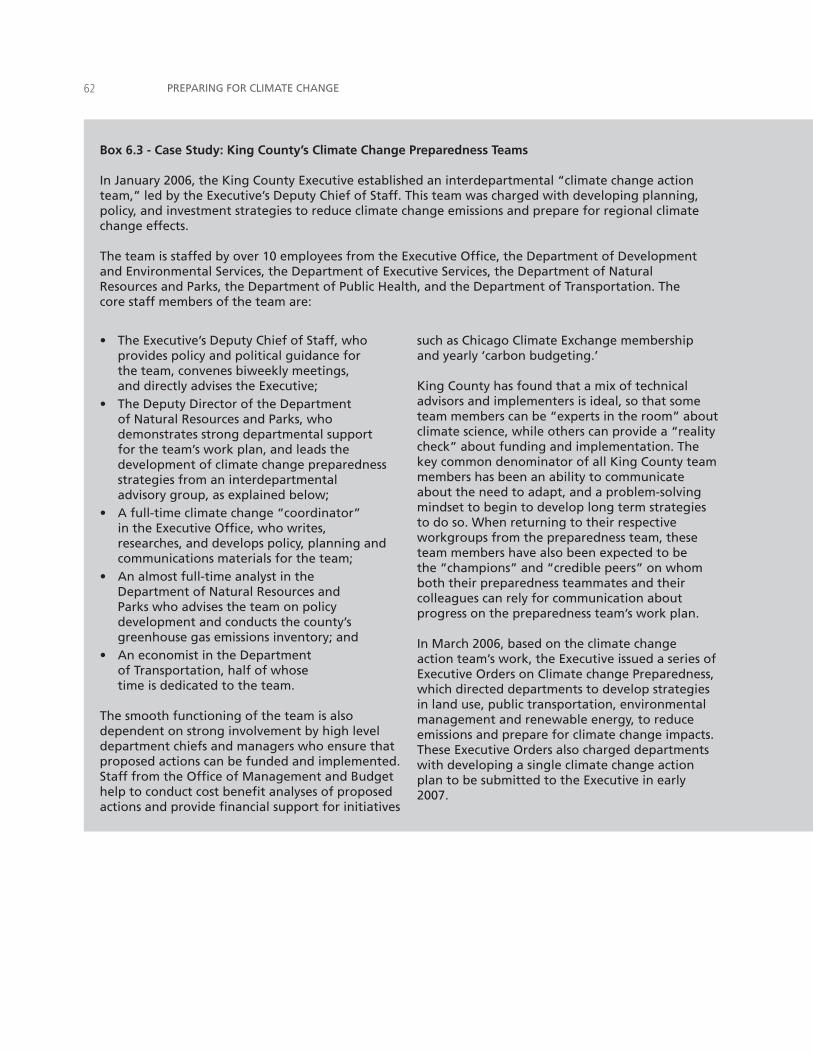
PREPARING FOR CLIMATE CHANGE��
Box 6.3 - Case Study: King County’s Climate Change Preparedness Teams
In January 2006, the King County Executive established an interdepartmental “climate change action team,” led by the Executive’s Deputy Chief of Staff. This team was charged with developing planning, policy, and investment strategies to reduce climate change emissions and prepare for regional climate change effects.
The team is staffed by over 10 employees from the Executive Office, the Department of Development and Environmental Services, the Department of Executive Services, the Department of Natural Resources and Parks, the Department of Public Health, and the Department of Transportation. The core staff members of the team are:
The Executive’s Deputy Chief of Staff, who provides policy and political guidance for the team, convenes biweekly meetings, and directly advises the Executive; The Deputy Director of the Department of Natural Resources and Parks, who demonstrates strong departmental support for the team’s work plan, and leads the development of climate change preparedness strategies from an interdepartmental advisory group, as explained below; A full-time climate change “coordinator” in the Executive Office, who writes, researches, and develops policy, planning and communications materials for the team;An almost full-time analyst in the Department of Natural Resources and Parks who advises the team on policy development and conducts the county’s greenhouse gas emissions inventory; andAn economist in the Department of Transportation, half of whose time is dedicated to the team.
The smooth functioning of the team is also dependent on strong involvement by high level department chiefs and managers who ensure that proposed actions can be funded and implemented. Staff from the Office of Management and Budget help to conduct cost benefit analyses of proposed actions and provide financial support for initiatives
•
•
•
•
•
such as Chicago Climate Exchange membership and yearly ‘carbon budgeting.’
King County has found that a mix of technical advisors and implementers is ideal, so that some team members can be “experts in the room” about climate science, while others can provide a “reality check” about funding and implementation. The key common denominator of all King County team members has been an ability to communicate about the need to adapt, and a problem-solving mindset to begin to develop long term strategies to do so. When returning to their respective workgroups from the preparedness team, these team members have also been expected to be the “champions” and “credible peers” on whom both their preparedness teammates and their colleagues can rely for communication about progress on the preparedness team’s work plan.
In March 2006, based on the climate change action team’s work, the Executive issued a series of Executive Orders on Climate change Preparedness, which directed departments to develop strategies in land use, public transportation, environmental management and renewable energy, to reduce emissions and prepare for climate change impacts. These Executive Orders also charged departments with developing a single climate change action plan to be submitted to the Executive in early 2007.
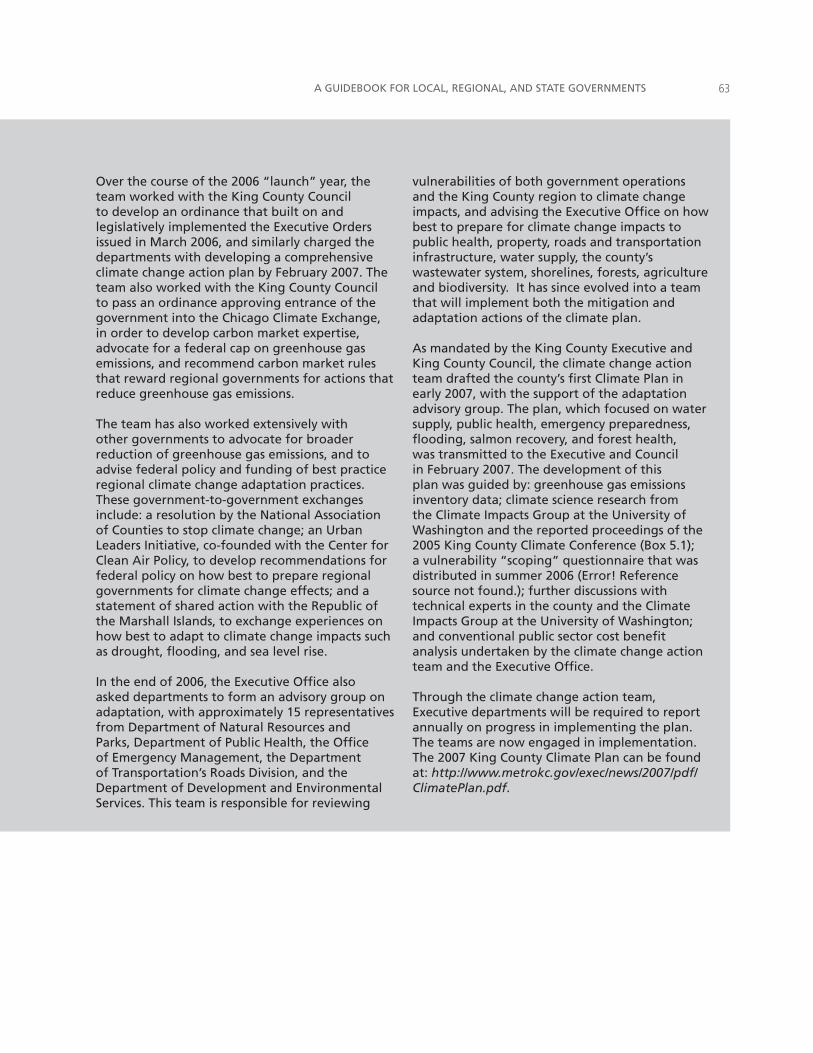
A GUIDEBOOK FOR LOCAL, REGIONAL, AND STATE GOVERNMENTS ��
Over the course of the 2006 “launch” year, the team worked with the King County Council to develop an ordinance that built on and legislatively implemented the Executive Orders issued in March 2006, and similarly charged the departments with developing a comprehensive climate change action plan by February 2007. The team also worked with the King County Council to pass an ordinance approving entrance of the government into the Chicago Climate Exchange, in order to develop carbon market expertise, advocate for a federal cap on greenhouse gas emissions, and recommend carbon market rules that reward regional governments for actions that reduce greenhouse gas emissions.
The team has also worked extensively with other governments to advocate for broader reduction of greenhouse gas emissions, and to advise federal policy and funding of best practice regional climate change adaptation practices. These government-to-government exchanges include: a resolution by the National Association of Counties to stop climate change; an Urban Leaders Initiative, co-founded with the Center for Clean Air Policy, to develop recommendations for federal policy on how best to prepare regional governments for climate change effects; and a statement of shared action with the Republic of the Marshall Islands, to exchange experiences on how best to adapt to climate change impacts such as drought, flooding, and sea level rise.
In the end of 2006, the Executive Office also asked departments to form an advisory group on adaptation, with approximately 15 representatives from Department of Natural Resources and Parks, Department of Public Health, the Office of Emergency Management, the Department of Transportation’s Roads Division, and the Department of Development and Environmental Services. This team is responsible for reviewing
vulnerabilities of both government operations and the King County region to climate change impacts, and advising the Executive Office on how best to prepare for climate change impacts to public health, property, roads and transportation infrastructure, water supply, the county’s wastewater system, shorelines, forests, agriculture and biodiversity. It has since evolved into a team that will implement both the mitigation and adaptation actions of the climate plan.
As mandated by the King County Executive and King County Council, the climate change action team drafted the county’s first Climate Plan in early 2007, with the support of the adaptation advisory group. The plan, which focused on water supply, public health, emergency preparedness, flooding, salmon recovery, and forest health, was transmitted to the Executive and Council in February 2007. The development of this plan was guided by: greenhouse gas emissions inventory data; climate science research from the Climate Impacts Group at the University of Washington and the reported proceedings of the 2005 King County Climate Conference (Box 5.1); a vulnerability “scoping” questionnaire that was distributed in summer 2006 (Error! Reference source not found.); further discussions with technical experts in the county and the Climate Impacts Group at the University of Washington; and conventional public sector cost benefit analysis undertaken by the climate change action team and the Executive Office.
Through the climate change action team, Executive departments will be required to report annually on progress in implementing the plan. The teams are now engaged in implementation. The 2007 King County Climate Plan can be found at: http://www.metrokc.gov/exec/news/2007/pdf/ClimatePlan.pdf.

PREPARING FOR CLIMATE CHANGE��
��
chapter � �dent�fy your plann�ng areas relevant to cl�mate change
This chapter helps you to develop an inventory of your planning areas – defined as the areas in which a government or community manages, plans, or makes policy affecting the services and activities associated with built, natural and human systems. Your inventory of planning areas, and ultimately your prioritization of these planning areas (Chapters 8 and 9), will serve as a focus for your preparedness efforts and will allow you to apply the climate change information you accumulate strategically.
Planning areas could be as broad or as specific as you deem necessary. Examples of planning areas include water supply, wastewater treatment, public health, road and bridge operations and maintenance, forestry, and parks. We suggest that you group these planning areas by sector (using the list in Table 4.1 or some variation).
After listing your planning areas, identify current and expected stresses to systems in these planning areas. In articulating the stresses to your built, natural or human systems, be sure to consider the effects of both known climate conditions and non-climate stresses such as population growth, economic development and other major trends. Organize your results in a form like Table 7.1.
INITIATE YOUR CLIMATE RESILIENCY EFFORTThe following chapters recommend how to reach CRC Milestone One, “Initiate Your Climate Resiliency Effort”:
Chapter 4: Scope the Climate Change Impacts to Your Major Sectors
Chapter 5: Build and Maintain Support to Prepare for Climate Change Impacts
Chapter 6: Build Your Climate Change Preparedness Team
Chapter 7: Identify Your Planning Areas Relevant to Climate Change
1MILESTONE
PLANNING AREAS are the areas in which a government or community manages, plans, or makes policy affecting the services and activities associated with built, natural and human systems.
SYSTEMS refer to the built, natural and human networks that provide important services or activities within a community or region.
You should also consider listing the planning areas for which your government is not directly responsible but have relevance to the overall well-being of your community (e.g., public health services from a county or state agency, interstate transportation infrastructure, timber production, outdoor recreation).
Add these planning areas to your table. You might also consider adding information about the entity responsible for management of each planning area (although this information is not reflected in Table 7.1). You will need to work with these entities to coordinate efforts on climate change preparedness.
It is particularly important to review non-climate related stresses to your planning areas at this stage in the process. As you are no doubt aware, governments have limited resources. Although
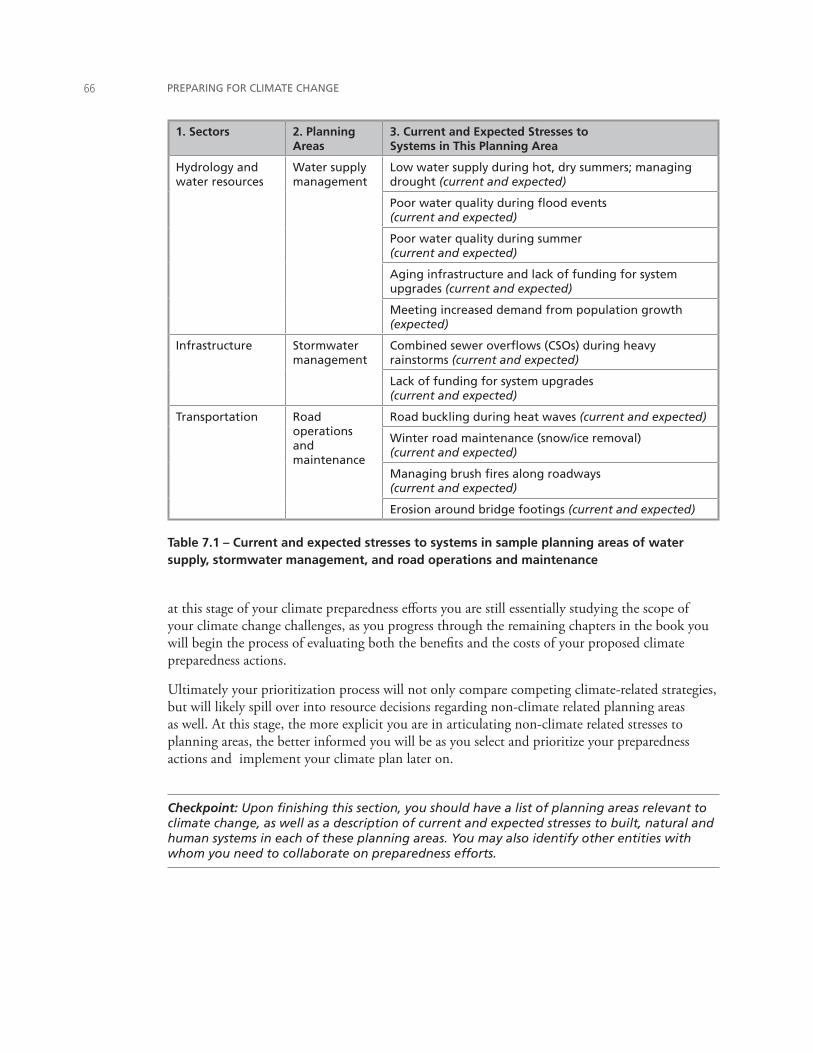
PREPARING FOR CLIMATE CHANGE��
1. Sectors 2. Planning Areas
3. Current and Expected Stresses to Systems in This Planning Area
Hydrology and water resources
Water supply management
Low water supply during hot, dry summers; managing drought (current and expected)
Poor water quality during flood events (current and expected)
Poor water quality during summer (current and expected)
Aging infrastructure and lack of funding for system upgrades (current and expected)
Meeting increased demand from population growth (expected)
Infrastructure Stormwater management
Combined sewer overflows (CSOs) during heavy rainstorms (current and expected)
Lack of funding for system upgrades (current and expected)
Transportation Road operations and maintenance
Road buckling during heat waves (current and expected)
Winter road maintenance (snow/ice removal) (current and expected)
Managing brush fires along roadways (current and expected)
Erosion around bridge footings (current and expected)
Table 7.1 – Current and expected stresses to systems in sample planning areas of water supply, stormwater management, and road operations and maintenance
at this stage of your climate preparedness efforts you are still essentially studying the scope of your climate change challenges, as you progress through the remaining chapters in the book you will begin the process of evaluating both the benefits and the costs of your proposed climate preparedness actions.
Ultimately your prioritization process will not only compare competing climate-related strategies, but will likely spill over into resource decisions regarding non-climate related planning areas as well. At this stage, the more explicit you are in articulating non-climate related stresses to planning areas, the better informed you will be as you select and prioritize your preparedness actions and implement your climate plan later on.
Checkpoint: Upon finishing this section, you should have a list of planning areas relevant to climate change, as well as a description of current and expected stresses to built, natural and human systems in each of these planning areas. You may also identify other entities with whom you need to collaborate on preparedness efforts.
��
chapter � conduct a cl�mate change vulnerab�l�ty assessment
Chapter 8 will take you through the three-step process necessary to complete a vulnerability assessment for your planning areas:
a sensitivity analysis for the systems associated with the planning areas you identified in Chapter 7
an evaluation of the adaptive capacity of the systems associated with each of these planning areas
an assessment of how vulnerable the systems in your planning areas are to the effects of climate change.
A vulnerability assessment can be one of the more research-intensive phases of the planning process. As noted in Section 4.2, the scope and scale of your vulnerability assessment is up to you; aim for a level of detail that meets your resource and information needs. Suggestions for working with limited information and resources are offered in this chapter. See Box 8.1 on the next page for a general list of questions to consider when beginning a vulnerability assessment.
8.1 Review and Supplement Important Climate InformationIt is important to have as much accurate information as possible about regional climate change and climate change impacts. Depending on the amount of information already collected and analyzed (see Section 4.1), you may want to supplement your existing base of information.
Follow the guidelines suggested in Section 4.1 for collecting and analyzing reports, web sites, fact sheets, and other information sources. You may choose to do the additional research yourself, or you may choose to delegate the task to other preparedness team members, staff members, a consultant, a volunteer, or a university graduate student working under the supervision of a qualified researcher. This work can happen simultaneously with the inventory process described in Chapter 4 and may need to be repeated at various points in the planning process depending on specific information needs.
•
•
•
CONDUCT A CLIMATE RESILIENCY STUDYThe following chapters recommend how to reach CRC Milestone Two, “Conduct a Climate Resiliency Study.”
Chapter 8: Conduct a Climate Change Vulnerability Assessment
Chapter 9: Conduct a Climate Change Risk Assessment
2MILESTONE
PREPARING FOR CLIMATE CHANGE��
Box 8.1 – Issues to Consider When Beginning a Vulnerability Assessment Your vulnerability assessment can be conducted in-house, through the climate change preparedness team, or with the assistance of consulting agencies or university-based researchers. Before beginning your assessment, consider the following questions:
General Process and Scope: How much time is available for the assessment?On which planning areas do you want to focus the assessment? Who will perform the assessment? Do you have the technical capacity to perform it in-house? If outsourcing the assessment, what is the procedure that must be followed for hiring a contractor?What questions do you want the assessment to answer?Which specific decisions do you want the assessment to support?
•
•
•
•
•
•
Budget and Political Support: What is your budget for the assessment? Who will manage the assessment process and budget? Do you have political support for the assessment?
Technical: Will any model(s) be developed for the assessment? Will the local government be able to operate the model for future scenario analysis? What type of scenarios does the community want to model? (Best case? Worst case? Middle-of-the-road?)
••
•
•
•
8.2 Conduct Your Climate Sensitivity Analysis In order to determine whether a system in a given planning area is sensitive to climate change, ask the question: “Will the systems associated with this planning area be significantly affected by projected changes in climate?” If the system is likely to be affected as a result of projected climate change, it should be considered sensitive to climate change.
This section will walk you through a sample climate change sensitivity analysis for water supply, stormwater management, and road operations and maintenance, as illustrated in Table 8.1 at the end of this section.
Return to your list of planning areas created in Chapter 7 and your brief descriptions of the current and expected stresses on the systems associated with these planning areas (Table 7.1). Have your team use the information collected to this point to answer the following questions for the planning areas identified in Table 7.1. Your answers to these questions will complete your sensitivity analysis table:
What are the known climate conditions affecting the stresses on your systems in this planning area? Be as specific as possible (e.g., list seasonal differences).
How do these climate conditions affect the systems you have identified?
What is the projected change in the climate conditions you have identified (and by what time period)?
•
•
•
SENSITIVITY is the degree to which a built, natural or human system is directly or indirectly affected by changes in climate conditions (e.g., temperature and precipitation) or specific climate change impacts (e.g., sea level rise, increased water temperature). If a system is likely to be affected as a result of projected climate change, it should be considered sensitive to climate change.
A GUIDEBOOK FOR LOCAL, REGIONAL, AND STATE GOVERNMENTS ��
What is the projected climate change impact to the systems associated with this planning area (absent preparedness action)?
To what degree is the system sensitive to changes in climate? You can assess this qualitatively (high, medium, low) by answering the questions provided in 8.2.1.
What are the projected changes in stresses on a system as a result of the projected climate change impacts? Are they likely to get worse, stay the same, or improve as a result of climate change impacts? Or, do new system stresses emerge altogether (e.g., the appearance of an infectious disease in a region, or the decline of a species)?
As noted above, anywhere you have identified a system stress that will be significantly affected by a projected change in climate, you have identified a planning area that is sensitive to climate change.
8.2.1 Questions to Help You Analyze Degree of Sensitivity
You can determine the degree of sensitivity of a system by considering the following questions.
How exposed is the system to the impacts of climate change? Exposure refers to the extent to which a system comes into contact with climate conditions or specific climate impacts. The greater the exposure, the higher the sensitivity to climate change. For example, coastal communities located along low-lying shorelines are more exposed and therefore more sensitive to sea level rise, increased storm surges, and flooding than coastal communities located on bluffs. Similarly, dryland farming is exposed to variability in precipitation amount and timing in a way that irrigation-based farming is not.
Is the system subject to existing stress? Stressed systems are more likely to be sensitive to impacts of climate change. For instance, the sensitivity of the U.S. Pacific Northwest salmon population to climate change is likely to be much higher now than it would have been in the past due to the stresses of today’s world: changes in natural streamflow patterns from the construction and operation of dams and reservoirs; the destruction of salmon habitat as a result of forest harvest practices (e.g., road building and clear cutting); the impacts of urbanization on river habitat; and increased frequency of flooding in unmanaged coastal rivers.
Will climate change cause the demand for a resource to exceed its supply? Climate change will influence both the supply and demand for certain resources, such as water and electricity. If supply and demand for a resource are close enough that changes in climate can push them out of balance, that resource (and its associated system) can be considered to be sensitive to climate change. You may have already identified some situations like this if demand exceeds supply during specific known climate conditions (e.g., water supply shortages
•
•
•
•
•
•
PREPARING FOR CLIMATE CHANGE�0
during times of unusually low precipitation). It is also important to ask whether climate change might push some planning areas that have not yet experienced this type of problem into a situation where they will in the future.
Does the system have limiting factors that may be affected by climate change? In many cases, there are specific factors that will limit a system’s ability to adapt (or be adapted) to climate change. If these limiting factors can be identified, climate sensitivity and climate impacts can be better estimated. For example, tree growth is limited by summer water availability in many western U.S. low elevation dry forests. Tree growth would consequently be expected to decrease in these forests given that climate change is expected to decrease summer soil moisture. A decrease in summer soil moisture may also increase the risk of wildfires and insect outbreaks in western U.S. forests. As another example, some water supply systems are limited in their ability to provide summer drinking water by the amount of natural flow resulting from snowmelt in rivers during the summer. The reliability of the drinking water supply might decrease in locations where climate change is expected to decrease winter snowpack, and therefore decrease summer streamflows dependent on snowmelt.
For plant and animal species, is a species of concern in your system currently located near the edge or lowest elevation portion of its range? Species located near the edge or at the lowest elevation portion of their range are likely to be most sensitive to warming. For example, tree species living in the Northern Hemisphere will be more sensitive to warming when located at the southern end of their range than when located in the middle or northern portion of the range (for a given elevation) since the southernmost species is already facing temperature and/or summer moisture limits.
What is the “impact threshold” associated with the system? All systems have an associated impact threshold, after which sensitivity to climate conditions increase. These thresholds may be created by design standards, operational capacity, or physical and biological factors, as described in the following paragraphs. This knowledge can be used with information about projected regional climate change to assess sensitivity and to evaluate the likelihood of significant impacts.
In some cases, impact thresholds are related to infrastructure design. For example, sea walls or coastal defenses are typically built to handle surges in sea level that would occur during a certain size of storm hitting the coast at high tide, with some amount of additional buffer potentially factored in. Given this information, you can ask how much future sea level rise the coastal defense could accommodate before it would be overtopped during this type of storm. If the amount that the sea had to rise to reach this threshold were sufficiently large, the risk of overtopping would be very small over the lifetime of the infrastructure. Conversely, if the amount were small, the risk of overtopping will be large.
•
•
•
A GUIDEBOOK FOR LOCAL, REGIONAL, AND STATE GOVERNMENTS ��
In other cases, natural systems have identified temperature thresholds. As climate change occurs, the frequency with which those temperature thresholds are exceeded will increase in many places. Many coldwater fish species, for example, have temperature “envelopes” that bound the ranges of comfort and tolerance. Pacific salmon rely on cool, ample summer streamflows for juvenile rearing and adult migration back to their spawning grounds. If average summer air temperature exceeds 68ºF (20ºC) for an extended period of time, salmon species using the rivers during these warm periods will be at greater risk of thermal stress from the warmer water temperatures, which can kill salmon by reducing dissolved oxygen, increasing metabolic rates, and increasing their vulnerability to pests and pathogens. In some areas of the U.S. Pacific Northwest, the warming projected over the first half of the 21st century is sufficient to turn large areas of the interior Columbia River basin into unpleasant or unsuitable habitat for some species of Pacific salmon (Figure 8.1).
8.2.2 Working with Limited Resources: Combining Resources
Many communities may be interested in a more quantitative sensitivity assessment of projected climate change impacts to their systems, but lack the financial resources to fund the needed research. One strategy for maximizing limited means is to pool resources with neighboring governments. This approach not only provides the benefit of cost-sharing, but also allows for developing and applying consistent information on projected climate change impacts in multi-governmental regional planning processes. Such an approach is being taken in Washington State’s east central Puget Sound region (Box 8.2).
Checkpoint: Upon finishing this section, you have completed your sensitivity analysis – the first of a three-step process in conducting your climate change vulnerability assessment.
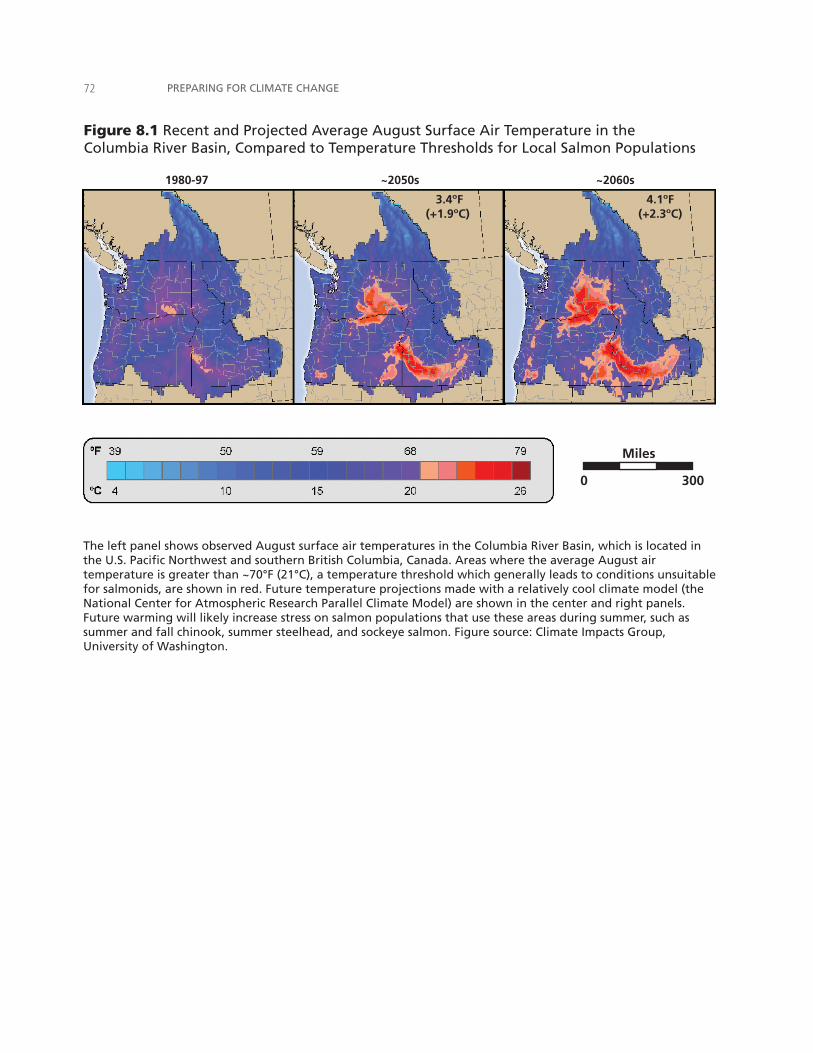
PREPARING FOR CLIMATE CHANGE��
1980-97 ~2050s
3.4ºF(+1.9ºC)
4.1ºF(+2.3ºC)
~2060s
Miles
0 300
Figure 8.1 Recent and Projected Average August Surface Air Temperature in the Columbia River Basin, Compared to Temperature Thresholds for Local Salmon Populations
The left panel shows observed August surface air temperatures in the Columbia River Basin, which is located in the U.S. Pacific Northwest and southern British Columbia, Canada. Areas where the average August air temperature is greater than ~70°F (21°C), a temperature threshold which generally leads to conditions unsuitable for salmonids, are shown in red. Future temperature projections made with a relatively cool climate model (the National Center for Atmospheric Research Parallel Climate Model) are shown in the center and right panels. Future warming will likely increase stress on salmon populations that use these areas during summer, such as summer and fall chinook, summer steelhead, and sockeye salmon. Figure source: Climate Impacts Group, University of Washington.
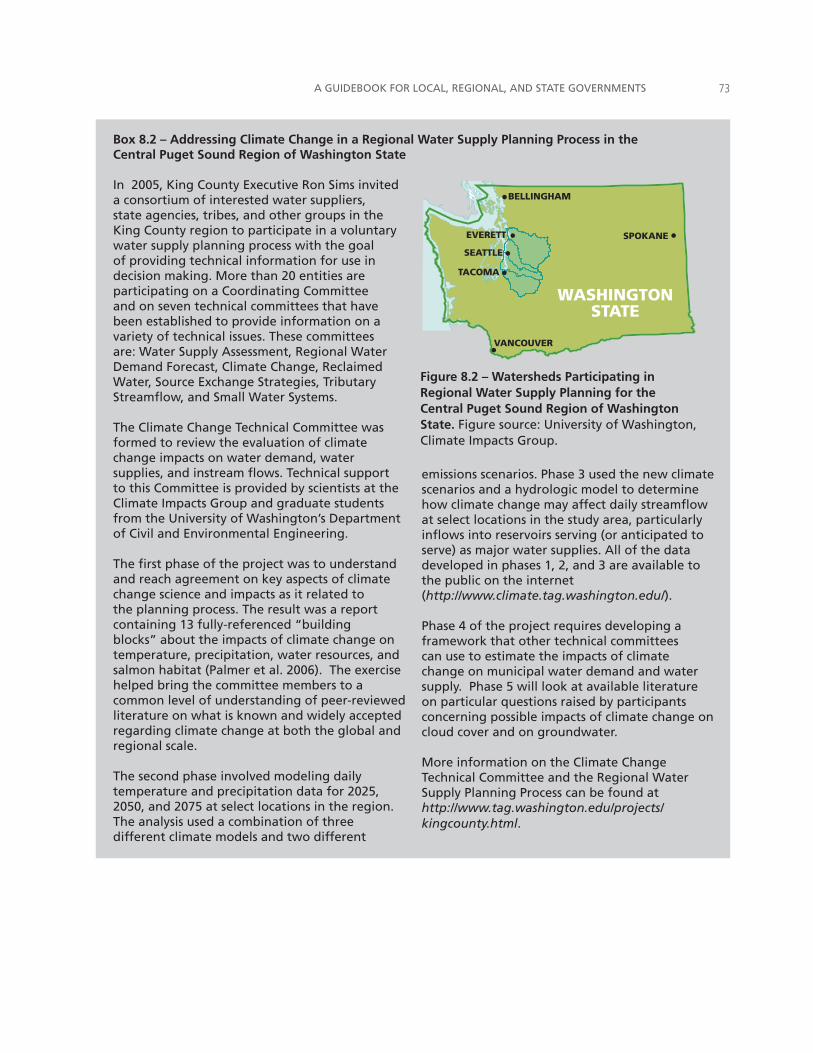
A GUIDEBOOK FOR LOCAL, REGIONAL, AND STATE GOVERNMENTS ��
Box 8.2 – Addressing Climate Change in a Regional Water Supply Planning Process in the Central Puget Sound Region of Washington State
In 2005, King County Executive Ron Sims invited a consortium of interested water suppliers, state agencies, tribes, and other groups in the King County region to participate in a voluntary water supply planning process with the goal of providing technical information for use in decision making. More than 20 entities are participating on a Coordinating Committee and on seven technical committees that have been established to provide information on a variety of technical issues. These committees are: Water Supply Assessment, Regional Water Demand Forecast, Climate Change, Reclaimed Water, Source Exchange Strategies, Tributary Streamflow, and Small Water Systems.
The Climate Change Technical Committee was formed to review the evaluation of climate change impacts on water demand, water supplies, and instream flows. Technical support to this Committee is provided by scientists at the Climate Impacts Group and graduate students from the University of Washington’s Department of Civil and Environmental Engineering.
The first phase of the project was to understand and reach agreement on key aspects of climate change science and impacts as it related to the planning process. The result was a report containing 13 fully-referenced “building blocks” about the impacts of climate change on temperature, precipitation, water resources, and salmon habitat (Palmer et al. 2006). The exercise helped bring the committee members to a common level of understanding of peer-reviewed literature on what is known and widely accepted regarding climate change at both the global and regional scale.
The second phase involved modeling daily temperature and precipitation data for 2025, 2050, and 2075 at select locations in the region. The analysis used a combination of three different climate models and two different
emissions scenarios. Phase 3 used the new climate scenarios and a hydrologic model to determine how climate change may affect daily streamflow at select locations in the study area, particularly inflows into reservoirs serving (or anticipated to serve) as major water supplies. All of the data developed in phases 1, 2, and 3 are available to the public on the internet (http://www.climate.tag.washington.edu/).
Phase 4 of the project requires developing a framework that other technical committees can use to estimate the impacts of climate change on municipal water demand and water supply. Phase 5 will look at available literature on particular questions raised by participants concerning possible impacts of climate change on cloud cover and on groundwater.
More information on the Climate Change Technical Committee and the Regional Water Supply Planning Process can be found at http://www.tag.washington.edu/projects/kingcounty.html.
WASHINGTONSTATE
SEATTLE
SPOKANE
TACOMA
VANCOUVER
BELLINGHAM
EVERETT
Figure 8.2 – Watersheds Participating in Regional Water Supply Planning for the Central Puget Sound Region of Washington State. Figure source: University of Washington, Climate Impacts Group.
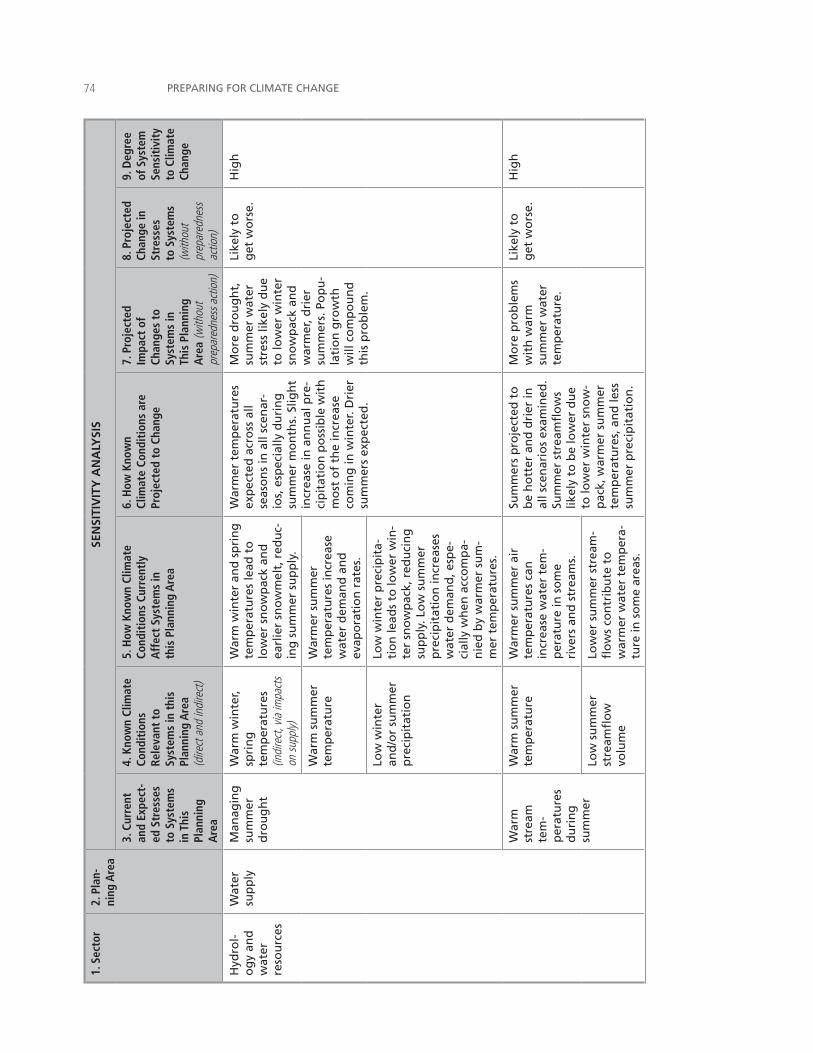
PREPARING FOR CLIMATE CHANGE��1.
Sec
tor
2. P
lan-
ning
Are
aSE
NSI
TIV
ITY
AN
ALY
SIS
3. C
urre
nt
and
Expe
ct-
ed S
tres
ses
to S
yste
ms
in T
his
Pl
anni
ng
Are
a
4. K
now
n Cl
imat
e Co
ndit
ions
Re
leva
nt t
o Sy
stem
s in
thi
s Pl
anni
ng A
rea
(d�re
ct a
nd �n
d�re
ct)
5. H
ow K
now
n Cl
imat
e Co
ndit
ions
Cur
rent
ly
Aff
ect
Syst
ems
in
this
Pla
nnin
g A
rea
6. H
ow K
now
n
Clim
ate
Cond
itio
ns a
re
Proj
ecte
d to
Cha
nge
7. P
roje
cted
Im
pact
of
Chan
ges
to
Syst
ems
in
This
Pla
nnin
g A
rea
(w�th
out
prep
ared
ness
act
�on)
8. P
roje
cted
Ch
ange
in
Stre
sses
to
Sys
tem
s (w
�thou
t pr
epar
edne
ss
act�o
n)
9. D
egre
e of
Sys
tem
Se
nsit
ivit
y to
Clim
ate
Chan
ge
Hyd
rol-
og
y an
d
wat
er
reso
urc
es
Wat
er
sup
ply
Man
agin
g
sum
mer
d
rou
gh
t
War
m w
inte
r, sp
rin
g
tem
per
atu
res
(�nd�
rect
, v�a
�mpa
cts
on su
pply)
War
m w
inte
r an
d s
pri
ng
te
mp
erat
ure
s le
ad t
o
low
er s
no
wp
ack
and
ea
rlie
r sn
ow
mel
t, r
edu
c-in
g s
um
mer
su
pp
ly.
War
mer
tem
per
atu
res
exp
ecte
d a
cro
ss a
ll se
aso
ns
in a
ll sc
enar
-io
s, e
spec
ially
du
rin
g
sum
mer
mo
nth
s. S
ligh
t in
crea
se in
an
nu
al p
re-
cip
itat
ion
po
ssib
le w
ith
m
ost
of
the
incr
ease
co
min
g in
win
ter.
Dri
er
sum
mer
s ex
pec
ted
.
Mo
re d
rou
gh
t,
sum
mer
wat
er
stre
ss li
kely
du
e to
low
er w
inte
r sn
ow
pac
k an
d
war
mer
, dri
er
sum
mer
s. P
op
u-
lati
on
gro
wth
w
ill c
om
po
un
d
this
pro
ble
m.
Like
ly t
o
get
wo
rse.
H
igh
War
m s
um
mer
te
mp
erat
ure
War
mer
su
mm
er
tem
per
atu
res
incr
ease
w
ater
dem
and
an
d
evap
ora
tio
n r
ates
.
Low
win
ter
and
/or
sum
mer
p
reci
pit
atio
n
Low
win
ter
pre
cip
ita-
tio
n le
ads
to lo
wer
win
-te
r sn
ow
pac
k, r
edu
cin
g
sup
ply
. Lo
w s
um
mer
p
reci
pit
atio
n in
crea
ses
wat
er d
eman
d, e
spe-
cial
ly w
hen
acc
om
pa-
nie
d b
y w
arm
er s
um
-m
er t
emp
erat
ure
s.
War
m
stre
am
tem
-p
erat
ure
s d
uri
ng
su
mm
er
War
m s
um
mer
te
mp
erat
ure
War
mer
su
mm
er a
ir
tem
per
atu
res
can
in
crea
se w
ater
tem
-p
erat
ure
in s
om
e ri
vers
an
d s
trea
ms.
Sum
mer
s p
roje
cted
to
b
e h
ott
er a
nd
dri
er in
al
l sce
nar
ios
exam
ined
. Su
mm
er s
trea
mfl
ow
s lik
ely
to b
e lo
wer
du
e to
low
er w
inte
r sn
ow
-p
ack,
war
mer
su
mm
er
tem
per
atu
res,
an
d le
ss
sum
mer
pre
cip
itat
ion
.
Mo
re p
rob
lem
s w
ith
war
m
sum
mer
wat
er
tem
per
atu
re.
Like
ly t
o
get
wo
rse.
Hig
h
Low
su
mm
er
stre
amfl
ow
vo
lum
e
Low
er s
um
mer
str
eam
-fl
ow
s co
ntr
ibu
te t
o
war
mer
wat
er t
emp
era-
ture
in s
om
e ar
eas.
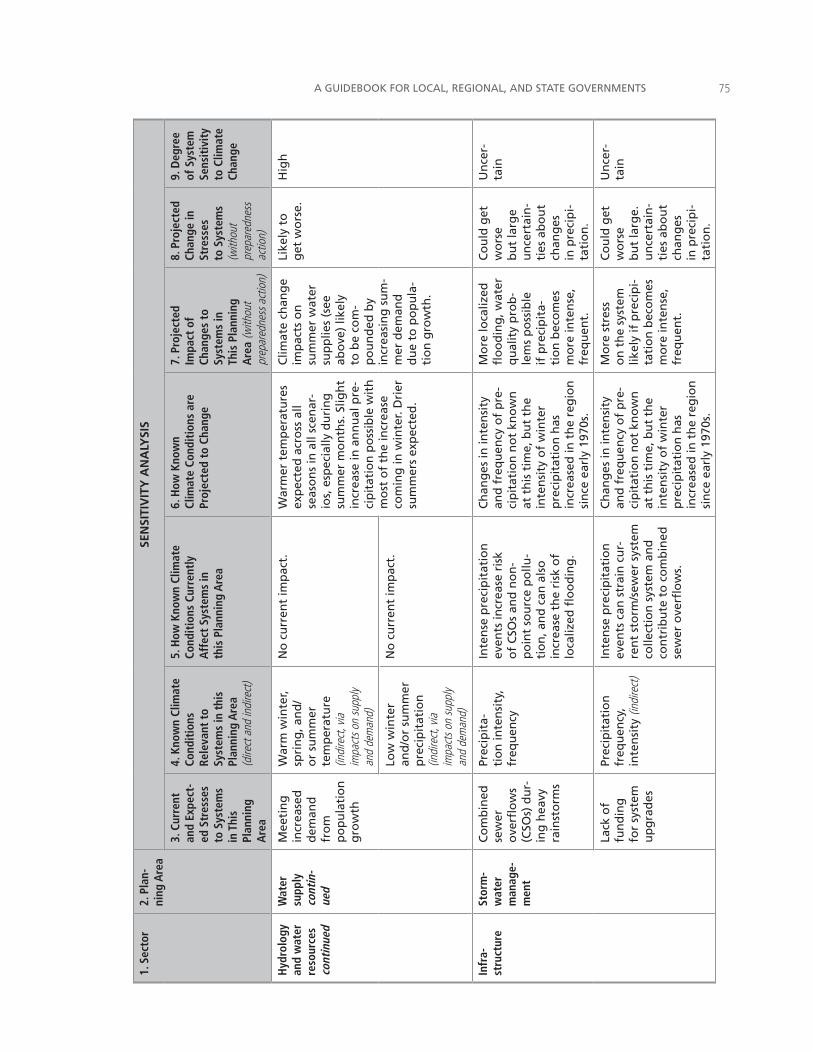
A GUIDEBOOK FOR LOCAL, REGIONAL, AND STATE GOVERNMENTS ��
1. S
ecto
r2.
Pla
n-ni
ng A
rea
SEN
SITI
VIT
Y A
NA
LYSI
S
3. C
urre
nt
and
Expe
ct-
ed S
tres
ses
to S
yste
ms
in T
his
Pl
anni
ng
Are
a
4. K
now
n Cl
imat
e Co
ndit
ions
Re
leva
nt t
o Sy
stem
s in
thi
s Pl
anni
ng A
rea
(d�re
ct a
nd �n
d�re
ct)
5. H
ow K
now
n Cl
imat
e Co
ndit
ions
Cur
rent
ly
Aff
ect
Syst
ems
in
this
Pla
nnin
g A
rea
6. H
ow K
now
n
Clim
ate
Cond
itio
ns a
re
Proj
ecte
d to
Cha
nge
7. P
roje
cted
Im
pact
of
Chan
ges
to
Syst
ems
in
This
Pla
nnin
g A
rea
(w�th
out
prep
ared
ness
act
�on)
8. P
roje
cted
Ch
ange
in
Stre
sses
to
Sys
tem
s (w
�thou
t pr
epar
edne
ss
act�o
n)
9. D
egre
e of
Sys
tem
Se
nsit
ivit
y to
Clim
ate
Chan
ge
Hyd
rolo
gy
and
wat
er
reso
urce
s co
ntin
ued
Wat
er
supp
ly
cont
in-
ued
Mee
tin
g
incr
ease
d
dem
and
fr
om
p
op
ula
tio
n
gro
wth
War
m w
inte
r, sp
rin
g, a
nd
/o
r su
mm
er
tem
per
atu
re
(�nd�
rect
, v�a
�m
pact
s on
supp
ly an
d de
man
d)
No
cu
rren
t im
pac
t.W
arm
er t
emp
erat
ure
s ex
pec
ted
acr
oss
all
seas
on
s in
all
scen
ar-
ios,
esp
ecia
lly d
uri
ng
su
mm
er m
on
ths.
Slig
ht
incr
ease
in a
nn
ual
pre
-ci
pit
atio
n p
oss
ible
wit
h
mo
st o
f th
e in
crea
se
com
ing
in w
inte
r. D
rier
su
mm
ers
exp
ecte
d.
Clim
ate
chan
ge
imp
acts
on
su
mm
er w
ater
su
pp
lies
(see
ab
ove
) lik
ely
to b
e co
m-
po
un
ded
by
incr
easi
ng
su
m-
mer
dem
and
d
ue
to p
op
ula
-ti
on
gro
wth
.
Like
ly t
o
get
wo
rse.
Hig
h
Low
win
ter
and
/or
sum
mer
p
reci
pit
atio
n
(�nd�
rect
, v�a
�m
pact
s on
supp
ly an
d de
man
d)
No
cu
rren
t im
pac
t.
Infr
a-st
ruct
ure
Stor
m-
wat
er
man
age-
men
t
Co
mb
ined
se
wer
o
verfl
ow
s (C
SOs)
du
r-in
g h
eavy
ra
inst
orm
s
Prec
ipit
a-ti
on
inte
nsi
ty,
freq
uen
cy
Inte
nse
pre
cip
itat
ion
ev
ents
incr
ease
ris
k o
f C
SOs
and
no
n-
po
int
sou
rce
po
llu-
tio
n, a
nd
can
als
o
incr
ease
th
e ri
sk o
f lo
caliz
ed fl
oo
din
g.
Ch
ang
es in
inte
nsi
ty
and
fre
qu
ency
of
pre
-ci
pit
atio
n n
ot
kno
wn
at
th
is t
ime,
bu
t th
e in
ten
sity
of
win
ter
pre
cip
itat
ion
has
in
crea
sed
in t
he
reg
ion
si
nce
ear
ly 1
970s
.
Mo
re lo
caliz
ed
flo
od
ing
, wat
er
qu
alit
y p
rob
-le
ms
po
ssib
le
if p
reci
pit
a-ti
on
bec
om
es
mo
re in
ten
se,
freq
uen
t.
Co
uld
get
w
ors
e b
ut
larg
e u
nce
rtai
n-
ties
ab
ou
t ch
ang
es
in p
reci
pi-
tati
on
.
Un
cer-
tain
Lack
of
fun
din
g
for
syst
em
up
gra
des
Prec
ipit
atio
n
freq
uen
cy,
inte
nsi
ty (�
nd�re
ct)
Inte
nse
pre
cip
itat
ion
ev
ents
can
str
ain
cu
r-re
nt
sto
rm/s
ewer
sys
tem
co
llect
ion
sys
tem
an
d
con
trib
ute
to
co
mb
ined
se
wer
ove
rflo
ws.
Ch
ang
es in
inte
nsi
ty
and
fre
qu
ency
of
pre
-ci
pit
atio
n n
ot
kno
wn
at
th
is t
ime,
bu
t th
e in
ten
sity
of
win
ter
pre
cip
itat
ion
has
in
crea
sed
in t
he
reg
ion
si
nce
ear
ly 1
970s
.
Mo
re s
tres
s o
n t
he
syst
em
likel
y if
pre
cip
i-ta
tio
n b
eco
mes
m
ore
inte
nse
, fr
equ
ent.
Co
uld
get
w
ors
e b
ut
larg
e.
un
cert
ain
-ti
es a
bo
ut
chan
ges
in
pre
cip
i-ta
tio
n.
Un
cer-
tain
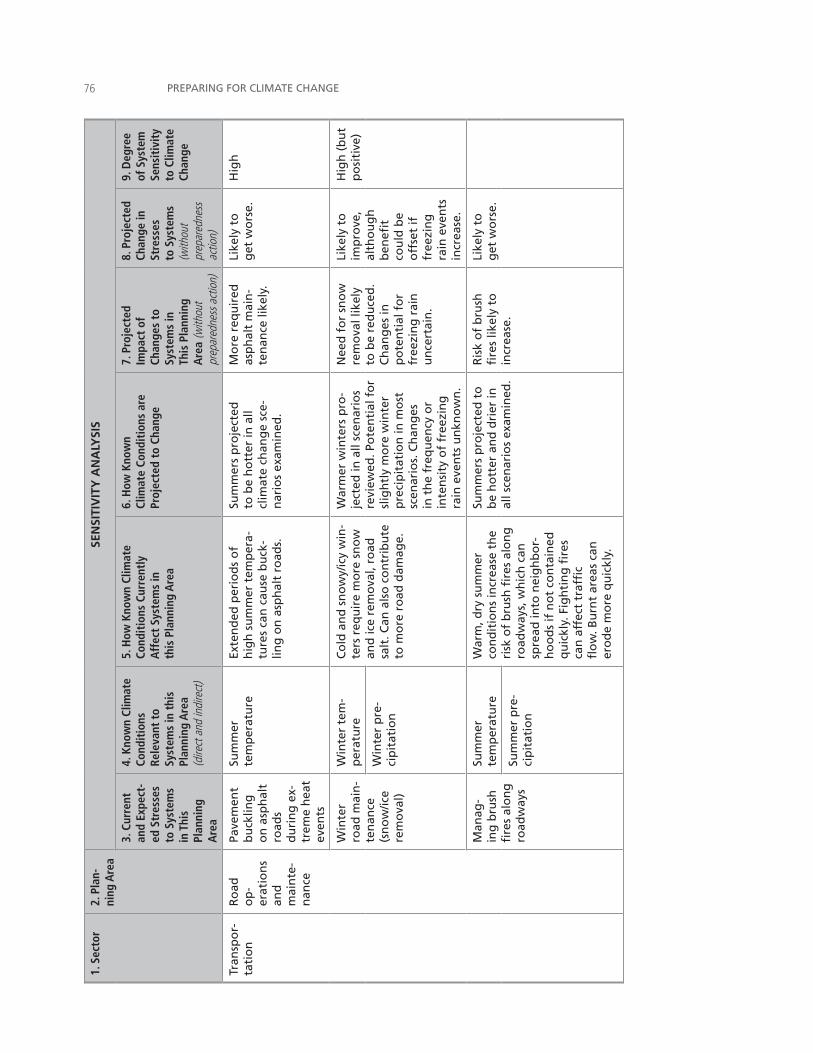
PREPARING FOR CLIMATE CHANGE��1.
Sec
tor
2. P
lan-
ning
Are
aSE
NSI
TIV
ITY
AN
ALY
SIS
3. C
urre
nt
and
Expe
ct-
ed S
tres
ses
to S
yste
ms
in T
his
Pl
anni
ng
Are
a
4. K
now
n Cl
imat
e Co
ndit
ions
Re
leva
nt t
o Sy
stem
s in
thi
s Pl
anni
ng A
rea
(d�re
ct a
nd �n
d�re
ct)
5. H
ow K
now
n Cl
imat
e Co
ndit
ions
Cur
rent
ly
Aff
ect
Syst
ems
in
this
Pla
nnin
g A
rea
6. H
ow K
now
n
Clim
ate
Cond
itio
ns a
re
Proj
ecte
d to
Cha
nge
7. P
roje
cted
Im
pact
of
Chan
ges
to
Syst
ems
in
This
Pla
nnin
g A
rea
(w�th
out
prep
ared
ness
act
�on)
8. P
roje
cted
Ch
ange
in
Stre
sses
to
Sys
tem
s (w
�thou
t pr
epar
edne
ss
act�o
n)
9. D
egre
e of
Sys
tem
Se
nsit
ivit
y to
Clim
ate
Chan
ge
Tran
spo
r-ta
tio
nR
oad
o
p-
erat
ion
s an
d
mai
nte
-n
ance
Pave
men
t b
uck
ling
o
n a
sph
alt
road
s d
uri
ng
ex-
trem
e h
eat
even
ts
Sum
mer
te
mp
erat
ure
Exte
nd
ed p
erio
ds
of
hig
h s
um
mer
tem
per
a-tu
res
can
cau
se b
uck
-lin
g o
n a
sph
alt
road
s.
Sum
mer
s p
roje
cted
to
be
ho
tter
in a
ll cl
imat
e ch
ang
e sc
e-n
ario
s ex
amin
ed.
Mo
re r
equ
ired
as
ph
alt
mai
n-
ten
ance
like
ly.
Like
ly t
o
get
wo
rse.
Hig
h
Win
ter
road
mai
n-
ten
ance
(s
no
w/ic
e re
mo
val)
Win
ter
tem
-p
erat
ure
Co
ld a
nd
sn
ow
y/ic
y w
in-
ters
req
uir
e m
ore
sn
ow
an
d ic
e re
mo
val,
road
sa
lt. C
an a
lso
co
ntr
ibu
te
to m
ore
ro
ad d
amag
e.
War
mer
win
ters
pro
-je
cted
in a
ll sc
enar
ios
revi
ewed
. Po
ten
tial
fo
r sl
igh
tly
mo
re w
inte
r p
reci
pit
atio
n in
mo
st
scen
ario
s. C
han
ges
in
th
e fr
equ
ency
or
inte
nsi
ty o
f fr
eezi
ng
ra
in e
ven
ts u
nkn
ow
n.
Nee
d f
or
sno
w
rem
ova
l lik
ely
to b
e re
du
ced
. C
han
ges
in
po
ten
tial
fo
r fr
eezi
ng
rai
n
un
cert
ain
.
Like
ly t
o
imp
rove
, al
tho
ug
h
ben
efit
cou
ld b
e o
ffse
t if
fr
eezi
ng
ra
in e
ven
ts
incr
ease
.
Hig
h (
bu
t p
osi
tive
)
Win
ter
pre
-ci
pit
atio
n
Man
ag-
ing
bru
sh
fire
s al
on
g
road
way
s
Sum
mer
te
mp
erat
ure
War
m, d
ry s
um
mer
co
nd
itio
ns
incr
ease
th
e ri
sk o
f b
rush
fire
s al
on
g
road
way
s, w
hic
h c
an
spre
ad in
to n
eig
hb
or-
ho
od
s if
no
t co
nta
ined
q
uic
kly.
Fig
hti
ng
fire
s ca
n a
ffec
t tr
affi
c fl
ow
. Bu
rnt
area
s ca
n
ero
de
mo
re q
uic
kly.
Sum
mer
s p
roje
cted
to
b
e h
ott
er a
nd
dri
er in
al
l sce
nar
ios
exam
ined
.
Ris
k o
f b
rush
fi
res
likel
y to
in
crea
se.
Like
ly t
o
get
wo
rse.
Sum
mer
pre
-ci
pit
atio
n
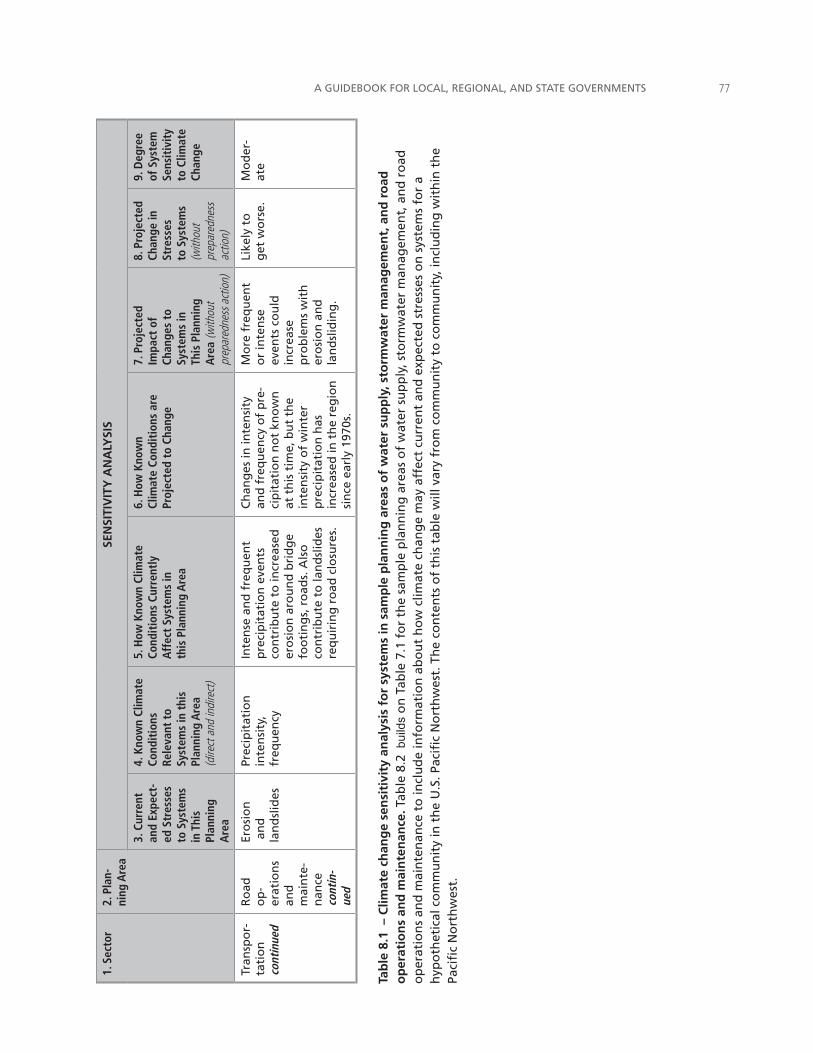
A GUIDEBOOK FOR LOCAL, REGIONAL, AND STATE GOVERNMENTS ��
1. S
ecto
r2.
Pla
n-ni
ng A
rea
SEN
SITI
VIT
Y A
NA
LYSI
S
3. C
urre
nt
and
Expe
ct-
ed S
tres
ses
to S
yste
ms
in T
his
Pl
anni
ng
Are
a
4. K
now
n Cl
imat
e Co
ndit
ions
Re
leva
nt t
o Sy
stem
s in
thi
s Pl
anni
ng A
rea
(d�re
ct a
nd �n
d�re
ct)
5. H
ow K
now
n Cl
imat
e Co
ndit
ions
Cur
rent
ly
Aff
ect
Syst
ems
in
this
Pla
nnin
g A
rea
6. H
ow K
now
n
Clim
ate
Cond
itio
ns a
re
Proj
ecte
d to
Cha
nge
7. P
roje
cted
Im
pact
of
Chan
ges
to
Syst
ems
in
This
Pla
nnin
g A
rea
(w�th
out
prep
ared
ness
act
�on)
8. P
roje
cted
Ch
ange
in
Stre
sses
to
Sys
tem
s (w
�thou
t pr
epar
edne
ss
act�o
n)
9. D
egre
e of
Sys
tem
Se
nsit
ivit
y to
Clim
ate
Chan
ge
Tran
spo
r-ta
tio
n
cont
inue
d
Ro
ad
op
-er
atio
ns
and
m
ain
te-
nan
ce
cont
in-
ued
Ero
sio
n
an
d
lan
dsl
ides
Prec
ipit
atio
n
inte
nsi
ty,
freq
uen
cy
Inte
nse
an
d f
req
uen
t p
reci
pit
atio
n e
ven
ts
con
trib
ute
to
incr
ease
d
ero
sio
n a
rou
nd
bri
dg
e fo
oti
ng
s, r
oad
s. A
lso
co
ntr
ibu
te t
o la
nd
slid
es
req
uir
ing
ro
ad c
losu
res.
Ch
ang
es in
inte
nsi
ty
and
fre
qu
ency
of
pre
-ci
pit
atio
n n
ot
kno
wn
at
th
is t
ime,
bu
t th
e in
ten
sity
of
win
ter
pre
cip
itat
ion
has
in
crea
sed
in t
he
reg
ion
si
nce
ear
ly 1
970s
.
Mo
re f
req
uen
t o
r in
ten
se
even
ts c
ou
ld
incr
ease
p
rob
lem
s w
ith
er
osi
on
an
d
lan
dsl
idin
g.
Like
ly t
o
get
wo
rse.
Mo
der
-at
e
Tab
le 8
.1 –
Clim
ate
chan
ge
sen
siti
vity
an
alys
is f
or
syst
ems
in s
amp
le p
lan
nin
g a
reas
of
wat
er s
up
ply
, sto
rmw
ater
man
agem
ent,
an
d r
oad
o
per
atio
ns
and
mai
nte
nan
ce. T
able
8.2
bui
lds
on
Tab
le 7
.1 f
or
the
sam
ple
pla
nn
ing
are
as o
f w
ater
su
pp
ly, s
torm
wat
er m
anag
emen
t, a
nd
ro
ad
op
erat
ion
s an
d m
ain
ten
ance
to
incl
ud
e in
form
atio
n a
bo
ut
ho
w c
limat
e ch
ang
e m
ay a
ffec
t cu
rren
t an
d e
xpec
ted
str
esse
s o
n s
yste
ms
for
a h
ypo
thet
ical
co
mm
un
ity
in t
he
U.S
. Pac
ific
No
rth
wes
t. T
he
con
ten
ts o
f th
is t
able
will
var
y fr
om
co
mm
un
ity
to c
om
mu
nit
y, in
clu
din
g w
ith
in t
he
Paci
fic
No
rth
wes
t.
PREPARING FOR CLIMATE CHANGE��
8.3 Evaluate the Adaptive Capacity Associated with Systems in Your Planning AreasAdaptive capacity describes the ability of built, natural and human systems associated with a given planning area to accommodate changes in climate with minimum disruption or minimum additional cost.
Evaluating adaptive capacity is the second step in the vulnerability assessment of a planning area. As a general rule, systems that have high adaptive capacity are better able to deal with climate change impacts.
To develop your own adaptive capacity table, consider the projected climate change impacts that will affect systems in your established planning areas. In creating this table, you
should be guided by the question: “To what extent are the systems associated with this planning area able to accommodate changes in climate at minimum disruption or cost?”
In conducting your adaptive capacity analysis, keep these considerations in mind:
Are the systems associated with this planning area already able to accommodate changes in climate? Examples of systems that are flexible to change include: animal or plant communities that are able to move easily or modify their behavior in response to external changes; and infrastructure that is designed to accommodate a range of future climate conditions, such as a water supply system that has been expanded with reclaimed water.
Conversely, are there barriers to a system’s ability to accommodate changes in climate? Many factors can limit a system’s ability to accommodate changes in climate. Examples include cases in which:
A legal or regulatory system requires that plans, policies, regulations, and design standards be based on historic climate conditions, or sets other limits that constrain responses to climate change impacts. For example, the U.S. Federal Emergency Management Agency (FEMA) is required to use historic streamflow data to determine the probability of a 100-year flood event when setting 100-year flood zone boundaries in flood plains. The implicit assumption in this type of planning is that historic streamflow provides a good benchmark for future flood risk, when in reality climate change is likely to increase the flood risk in the future.
The number of competing uses for a system is high. Flexibility in how a system is managed can often be limited by the needs of other competing uses for the system. The U.S. Pacific Northwest’s Columbia River system, for example, is managed simultaneously for flood control, hydropower, irrigation supply, protection of endangered species, water quality, navigation, and recreation uses. Changing operations or regulations to compensate for the impacts of climate change to one use, hydropower production, may be limited by the needs of other uses, such as maintaining flows for protection of Snake River spring and summer run Chinook salmon.
•
•
•
•
ADAPTIVE CAPACITY describes the ability of built, natural and human systems associated with a given planning area to accommodate changes in climate with minimum disruption or minimum additional cost.
A GUIDEBOOK FOR LOCAL, REGIONAL, AND STATE GOVERNMENTS ��
The number of organizations involved in managing a system is high. Flexibility in how a system is managed for climate change can be reduced when there are many organizations involved in the overall management of a system. As noted in the previous example, the Columbia River System is managed for a variety of uses. The responsibility for managing these uses rests with eight federal agencies, multiple state agencies in seven states, 13 Indian tribes, numerous public utility districts, and hundreds of other governmental subdivisions in the U.S. and Canada (NRC 2004). Increasing flexibility in the system is likely to be more challenging than if the management responsibilities rest within one or two organizations.
The system has biological, geographic or physical barriers that limit its flexibility. One example of a biological constraint on adapting to climate change is the temperature threshold of salmon described in Section 8.2.1. Examples of geographic constraints include: the reality that an alpine meadow can only move so far up a mountain before it literally runs out of space to move; and the limitation that bluffs or a seawall place on inland migration of coastal wetlands in response to sea level rise.
Are the systems associated with this planning area already stressed in ways that will limit their ability to accommodate changes in climate? Stresses unrelated to climate include development patterns, population growth, pollution levels, invasive species, disease, infrastructure decay, economic downturns, and damage from previous natural disasters.
An example of a natural system with a preexisting stress might be an ecosystem in which an invasive noxious weed out-competes an important local crop for natural resources, leaving the crop less able to accommodate changes in climate.
An example of a human system with a preexisting stress might be a community that has recently experienced economic downtown, and does not have the resources to purchase sufficient air conditioning for buildings.
An example of a built system with a preexisting stress might be a network of levees and flood control facilities that are already decaying and/or lack funding for repair, and would therefore not be able to accommodate more frequent 100-year floods.
Is the rate of projected climate change likely to be faster than the adaptability of the systems in this planning area? Rates of change can have an important influence on adaptability. Natural systems have responded to past climate changes by migrating along with their preferred climate. By moving northward and upward in elevation, natural systems in the Northern Hemisphere could theoretically
•
•
•
•
•
•
•
PREPARING FOR CLIMATE CHANGE�0
continue to inhabit their preferred climate habitat despite climate change. For many regions of the country (and for the world as a whole), however, climate is expected to change faster this century than it has in recent history. Systems that take long periods of time to adjust (e.g., decades) may not be able to adapt quickly enough to avoid potentially significant impacts to ecosystems and communities.
Are there efforts already underway to address impacts of climate change related to systems in this planning area? Your community may already be involved in activities aimed at reducing stresses on systems likely to be affected by climate change. Those efforts may increase the system’s adaptability to climate change provided the current activities are appropriate given projected climate change impacts. Criteria for selecting and prioritizing preparedness activities in Section10.4 may be helpful for evaluating the effectiveness of ongoing planning activities for addressing climate change impacts.
Sectoral experts on your climate change preparedness team will be valuable sources for the information you need on existing policies, practices, infrastructure, and authorities in this stage of the assessment. You might also consider asking stakeholders and other colleagues how existing policies, practices, infrastructure, and authorities might provide both opportunities and barriers to preparing for climate change. This can be done face-to-face at public meetings, staff meetings, special workshops, lunch-time brown bag discussions, or via a questionnaire such as the one developed by King County, Washington, which integrated questions about existing regulatory barriers into a larger survey used to gather information on vulnerabilities in the County (see Box 8.3).
Add your evaluation of adaptive capacity for each planning area to a simplified version of the table you have been developing, as shown in Table 8.2 on the next page. Include observations that led you to your conclusion, so that you can refer to them later.
Again, at this stage your evaluation should remain qualitative. However, your understanding of the additional relative cost to a given system of accommodating projected climate change impacts will eventually help you to make prioritization decisions, as described later in this book.
•
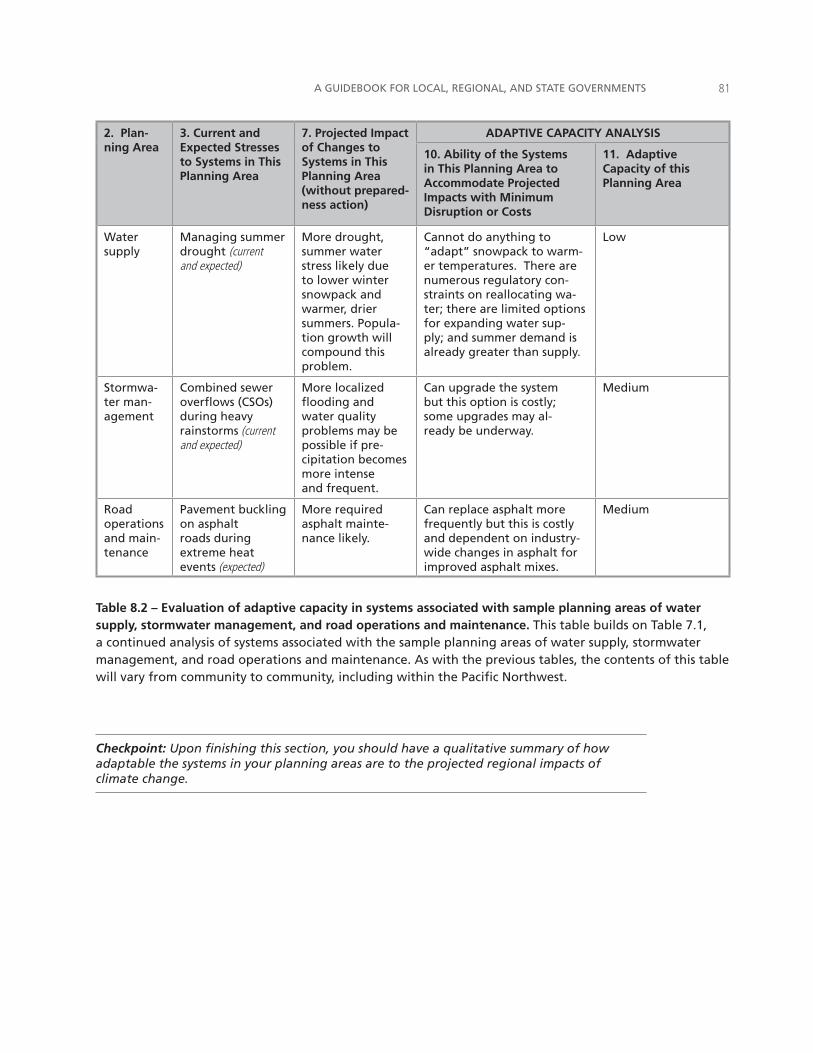
A GUIDEBOOK FOR LOCAL, REGIONAL, AND STATE GOVERNMENTS ��
2. Plan-ning Area
3. Current and Expected Stresses to Systems in This Planning Area
7. Projected Impact of Changes to Systems in This Planning Area (without prepared-ness action)
ADAPTIVE CAPACITY ANALYSIS
10. Ability of the Systems in This Planning Area to Accommodate Projected Impacts with Minimum Disruption or Costs
11. Adaptive Capacity of this Planning Area
Water supply
Managing summer drought (current and expected)
More drought, summer water stress likely due to lower winter snowpack and warmer, drier summers. Popula-tion growth will compound this problem.
Cannot do anything to “adapt” snowpack to warm-er temperatures. There are numerous regulatory con-straints on reallocating wa-ter; there are limited options for expanding water sup-ply; and summer demand is already greater than supply.
Low
Stormwa-ter man-agement
Combined sewer overflows (CSOs) during heavy rainstorms (current and expected)
More localized flooding and water quality problems may be possible if pre-cipitation becomes more intense and frequent.
Can upgrade the system but this option is costly; some upgrades may al-ready be underway.
Medium
Road operations and main-tenance
Pavement buckling on asphalt roads during extreme heat events (expected)
More required asphalt mainte-nance likely.
Can replace asphalt more frequently but this is costly and dependent on industry-wide changes in asphalt for improved asphalt mixes.
Medium
Table 8.2 – Evaluation of adaptive capacity in systems associated with sample planning areas of water supply, stormwater management, and road operations and maintenance. This table builds on Table 7.1, a continued analysis of systems associated with the sample planning areas of water supply, stormwater management, and road operations and maintenance. As with the previous tables, the contents of this table will vary from community to community, including within the Pacific Northwest.
Checkpoint: Upon finishing this section, you should have a qualitative summary of how adaptable the systems in your planning areas are to the projected regional impacts of climate change.
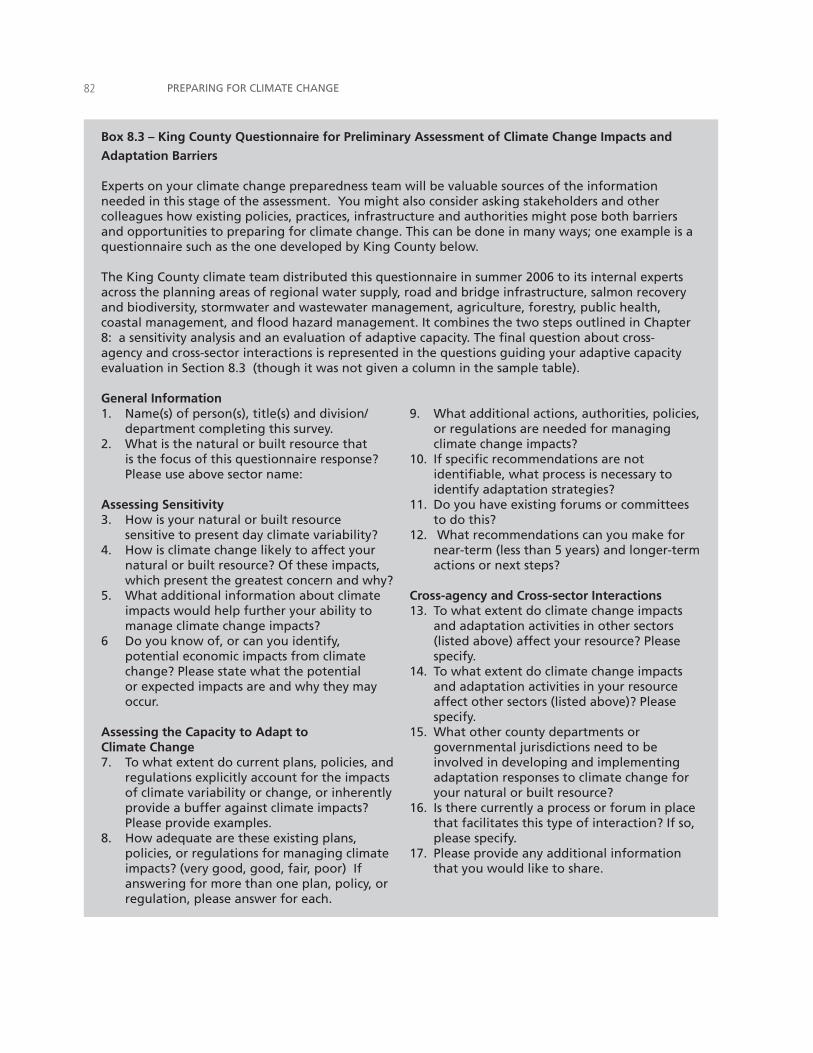
PREPARING FOR CLIMATE CHANGE��
Box 8.3 – King County Questionnaire for Preliminary Assessment of Climate Change Impacts and
Adaptation Barriers
Experts on your climate change preparedness team will be valuable sources of the information needed in this stage of the assessment. You might also consider asking stakeholders and other colleagues how existing policies, practices, infrastructure and authorities might pose both barriers and opportunities to preparing for climate change. This can be done in many ways; one example is a questionnaire such as the one developed by King County below.
The King County climate team distributed this questionnaire in summer 2006 to its internal experts across the planning areas of regional water supply, road and bridge infrastructure, salmon recovery and biodiversity, stormwater and wastewater management, agriculture, forestry, public health, coastal management, and flood hazard management. It combines the two steps outlined in Chapter 8: a sensitivity analysis and an evaluation of adaptive capacity. The final question about cross-agency and cross-sector interactions is represented in the questions guiding your adaptive capacity evaluation in Section 8.3 (though it was not given a column in the sample table).
General Information1. Name(s) of person(s), title(s) and division/
department completing this survey. 2. What is the natural or built resource that
is the focus of this questionnaire response? Please use above sector name:
Assessing Sensitivity3. How is your natural or built resource
sensitive to present day climate variability? 4. How is climate change likely to affect your
natural or built resource? Of these impacts, which present the greatest concern and why?
5. What additional information about climate impacts would help further your ability to manage climate change impacts?
6 Do you know of, or can you identify, potential economic impacts from climate change? Please state what the potential or expected impacts are and why they may occur.
Assessing the Capacity to Adapt to Climate Change7. To what extent do current plans, policies, and
regulations explicitly account for the impacts of climate variability or change, or inherently provide a buffer against climate impacts? Please provide examples.
8. How adequate are these existing plans, policies, or regulations for managing climate impacts? (very good, good, fair, poor) If answering for more than one plan, policy, or regulation, please answer for each.
9. What additional actions, authorities, policies, or regulations are needed for managing climate change impacts?
10. If specific recommendations are not identifiable, what process is necessary to identify adaptation strategies?
11. Do you have existing forums or committees to do this?
12. What recommendations can you make for near-term (less than 5 years) and longer-term actions or next steps?
Cross-agency and Cross-sector Interactions13. To what extent do climate change impacts
and adaptation activities in other sectors (listed above) affect your resource? Please specify.
14. To what extent do climate change impacts and adaptation activities in your resource affect other sectors (listed above)? Please specify.
15. What other county departments or governmental jurisdictions need to be involved in developing and implementing adaptation responses to climate change for your natural or built resource?
16. Is there currently a process or forum in place that facilitates this type of interaction? If so, please specify.
17. Please provide any additional information that you would like to share.
A GUIDEBOOK FOR LOCAL, REGIONAL, AND STATE GOVERNMENTS ��
8.4 Completing the Assessment: How Vulnerable Are You to Climate Change?The final step in the vulnerability assessment process is to combine your findings about sensitivity and adaptability to determine how and where your community is vulnerable to climate change. For each planning area listed in the preceding tables, consider sensitivity and adaptability of its associated systems to climate change. Planning areas with systems that are sensitive to climate and less able to adapt to changes are generally considered to be vulnerable to climate change impacts.
The vulnerability assessment can be a qualitative (high, medium, low) and/or quantitative exercise depending on the type of information available and the amount of resources available for a more quantitative investigation. Table 8.3 provides an illustration of qualitative assessment only. Box 8.4 provides an example of how the City of Olympia, Washington, conducted a study to investigate how and where the City is vulnerable to sea level rise.
VULNERABILITY refers to the susceptibility of a system to harm from climate change impacts. Vulnerability is a function of a system’s sensitivity to climate and the capacity of that system to adapt to climate changes. In other words, systems that are sensitive to climate and less able to adapt to changes are generally considered to be vulnerable to climate change impacts.
Do not consider your vulnerability assessment to be static. Existing vulnerabilities that you identify in this assessment will change, and new vulnerabilities will emerge as a result of:
climate change impacts on the frequency, intensity, duration, and/or extent of specific climate events;
the emergence of new threats, such as the introduction of a new invasive species or disease into the community;
new information on how climate change may affect specific systems in planning areas within your community;
implementation of preparedness actions (as detailed in Chapter 11);
changes in the community’s size, economy, preferences, or other factors that can influence a community’s vulnerability to climate change.
As described in Chapter 12, you should review your vulnerability assessment as you update your preparedness plan over time.
•
•
•
•
•
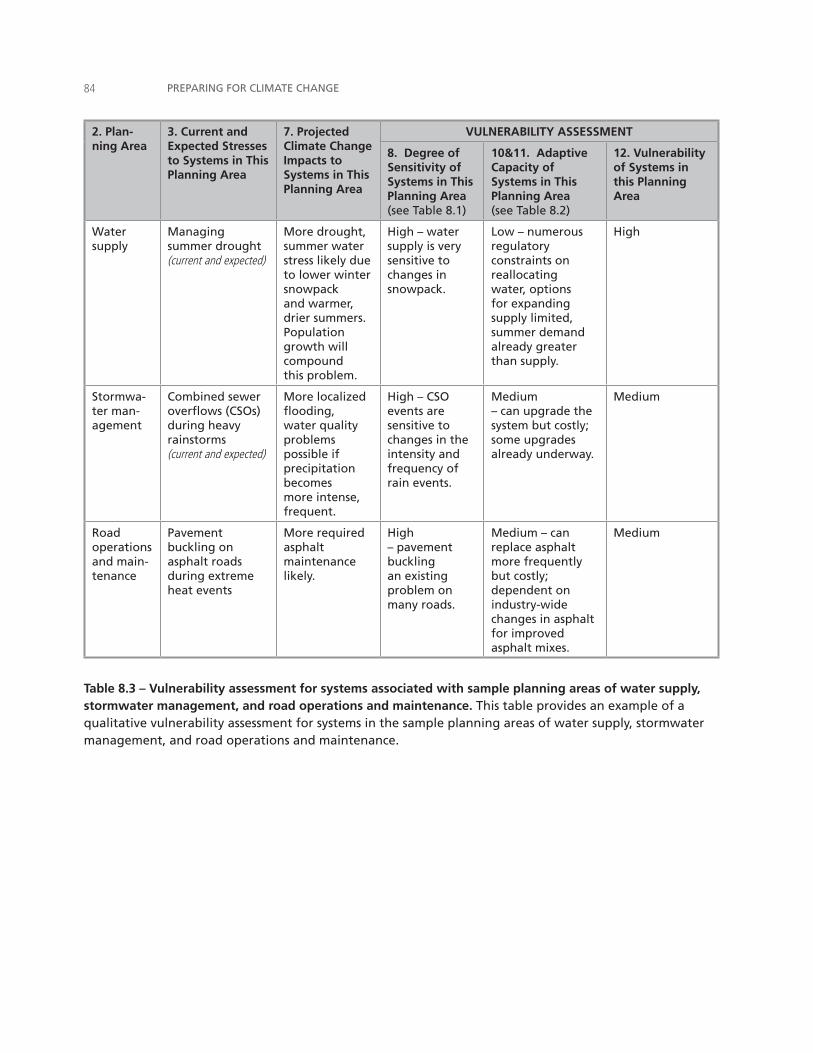
PREPARING FOR CLIMATE CHANGE��
2. Plan-ning Area
3. Current and Expected Stresses to Systems in This Planning Area
7. Projected Climate Change Impacts to Systems in This Planning Area
VULNERABILITY ASSESSMENT
8. Degree of Sensitivity of Systems in This Planning Area (see Table 8.1)
10&11. Adaptive Capacity of Systems in This Planning Area (see Table 8.2)
12. Vulnerability of Systems in this Planning Area
Water supply
Managing summer drought (current and expected)
More drought, summer water stress likely due to lower winter snowpack and warmer, drier summers. Population growth will compound this problem.
High – water supply is very sensitive to changes in snowpack.
Low – numerous regulatory constraints on reallocating water, options for expanding supply limited, summer demand already greater than supply.
High
Stormwa-ter man-agement
Combined sewer overflows (CSOs) during heavy rainstorms (current and expected)
More localized flooding, water quality problems possible if precipitation becomes more intense, frequent.
High – CSO events are sensitive to changes in the intensity and frequency of rain events.
Medium – can upgrade the system but costly; some upgrades already underway.
Medium
Road operations and main-tenance
Pavement buckling on asphalt roads during extreme heat events
More required asphalt maintenance likely.
High – pavement buckling an existing problem on many roads.
Medium – can replace asphalt more frequently but costly; dependent on industry-wide changes in asphalt for improved asphalt mixes.
Medium
Table 8.3 – Vulnerability assessment for systems associated with sample planning areas of water supply, stormwater management, and road operations and maintenance. This table provides an example of a qualitative vulnerability assessment for systems in the sample planning areas of water supply, stormwater management, and road operations and maintenance.
A GUIDEBOOK FOR LOCAL, REGIONAL, AND STATE GOVERNMENTS ��
Box 8.4 – Case study: Assessing Vulnerability to Sea Level Rise in the City of Olympia, Washington
The City of Olympia, Washington, has been concerned about climate change for over 17 years. Early in 1990, a representative of the local citizen Greenhouse Action Group approached the Olympia’s City Council to ask what the City was doing to address the issue of climate change. In response, the City Council decided in May 1990 to make action on climate change one of its target issues for the next year. An interdepartmental Global Warming Task Force was launched and prepared a background report on the implications of climate change for Olympia, relying on a major report by Vancouver, BC and technical guidance from the Washington State Department of Ecology. The report also identified areas where the City had authority to act, steps the City had already taken, and possible future actions. Following publication of this background report, Council passed a resolution committing the City to a long-term strategy to reduce greenhouse gas emissions, increase tree cover and prepare for climate change.
Sea level rise is one of the primary issues Olympia must address. Sea level, already rising in Olympia about one foot per century due to post-ice age warming of the oceans and land subsidence, will be accelerated by climate change. Much of Olympia’s downtown lies one to three feet above the current highest high tides, which occur once or twice a year (Figure 8.3). The report determined the downtown area, Port of Olympia, and the City’s primary drinking water source would be particularly vulnerable to flooding and Budd Inlet’s habitat and water quality would be at risk as well.
If no protection measures are taken, even one foot of sea level rise will result in ponding on some streets and flooding of low-lying structures. A two-foot rise will impact an even greater area. Pipes designed to convey stormwater away from downtown will be unable to discharge fast enough to prevent flooding during storms. At higher levels, flows will reverse and the sea will flow out of street drains and into the streets. A three-foot rise will overtop many places along the shoreline and flood a greater area. The wastewater system is combined with stormwater in much of Olympia’s downtown. Higher sea levels will flow into the wastewater pipes through combined drains and infiltrate through pipe joints, challenging capacity at the regional wastewater treatment plant. Partly because the City’s major supply source at McAllister Springs is subject to saltwater intrusion, the City
is planning a new wellfield upgradient from the springs. Changes in precipitation may further impact the City groundwater drinking water supply.
Over the years, the City’s climate change initiative was broadened into a commitment to sustainability. Since the early 1990s, the City has focused on climate change mitigation and other sustainability efforts, implementing policies to reduce greenhouse gas emissions and sustain natural resources. Internally, the City has reduced municipal vehicle emission, increased biodiesel usage, and moved towards utilizing 100% green power for all utility electricity needs. The City’s water conservation and reclaimed water programs have mitigated the impact of increasing water demand; land use and transportation policies have promoted denser, less auto-dependent development; stormwater management, forest preservation and street tree planting have helped reduce the effects of urbanization; and the new waste management plan aims to move the City toward Zero Waste.
In response to growing concerns about impacts to Olympia’s downtown, in late 2006 City staff began revisiting climate change and sea level rise issues. A work plan initiated by Public Works staff includes preparing a status report on climate change in Olympia with recommended next steps for further emission reductions and risk assessments, as well as a shift towards implementation of adaptation strategies. The City is engaging the community through public forums and other educational activities. The City is also forming partnerships among its Thurston County neighbors, drawing on resources from Ecology, the University of Washington’s Climate Impacts Group and others, and currently serves on the statewide Coastal/Infrastructure Preparation/Adaptation Working Group to recommend strategies to meet Governor Gregoire’s Washington Climate Change Challenge.
A copy of the City of Olympia’s 1993 sea level rise assessment report, A Preliminary Assessment of Sea Level Rise in Olympia, Washington: Technical and Policy Implications, is available at http://www.
ci.olympia.wa.us/cityutilities/stormwater/streams/.
Case study text courtesy of Rich Hoey (Director of Water Resources), Danielle Harrington, and Vince McGowan of the City of Olympia, and Dorothy Craig, consultant to the City of Olympia.
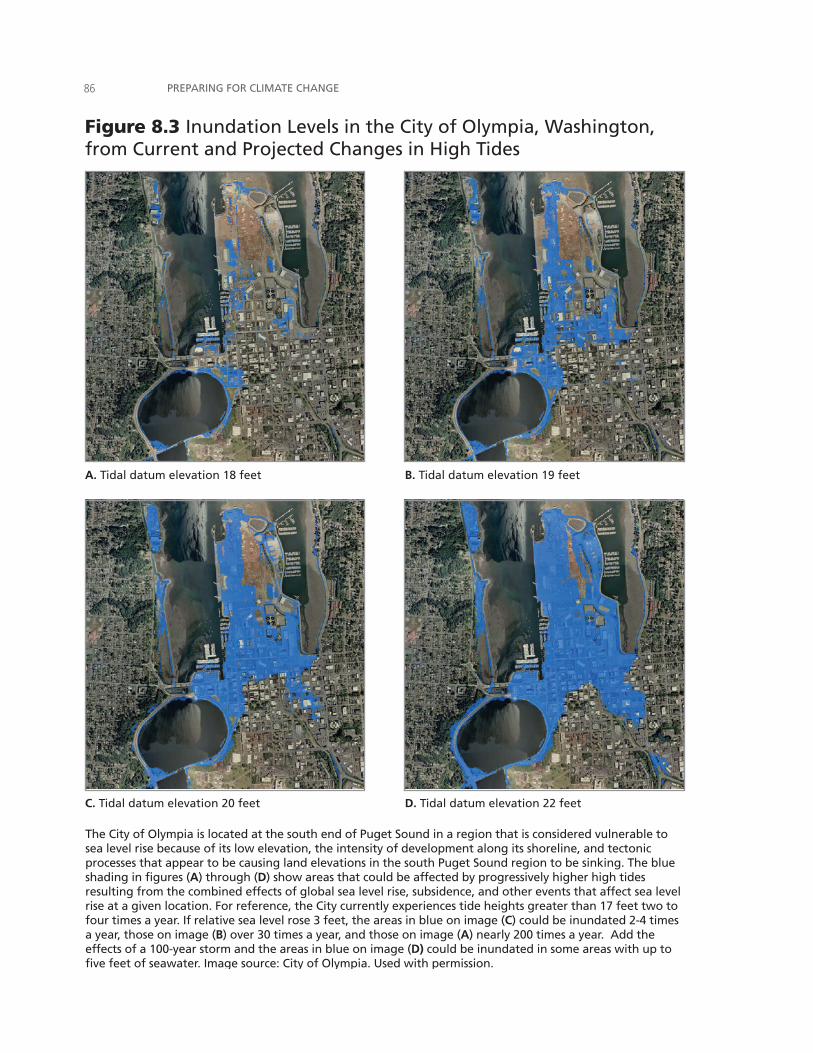
PREPARING FOR CLIMATE CHANGE��
A. Tidal datum elevation 18 feet B. Tidal datum elevation 19 feet
C. Tidal datum elevation 20 feet D. Tidal datum elevation 22 feet
The City of Olympia is located at the south end of Puget Sound in a region that is considered vulnerable to sea level rise because of its low elevation, the intensity of development along its shoreline, and tectonic processes that appear to be causing land elevations in the south Puget Sound region to be sinking. The blue shading in figures (A) through (D) show areas that could be affected by progressively higher high tides resulting from the combined effects of global sea level rise, subsidence, and other events that affect sea level rise at a given location. For reference, the City currently experiences tide heights greater than 17 feet two to four times a year. If relative sea level rose 3 feet, the areas in blue on image (C) could be inundated 2-4 times a year, those on image (B) over 30 times a year, and those on image (A) nearly 200 times a year. Add the effects of a 100-year storm and the areas in blue on image (D) could be inundated in some areas with up to five feet of seawater. Image source: City of Olympia. Used with permission.
Figure 8.3 Inundation Levels in the City of Olympia, Washington, from Current and Projected Changes in High Tides
��
chapter � conduct a cl�mate change r�sk assessment
Based on your knowledge about the vulnerabilities of systems in your planning areas, you are now ready to conduct a climate change risk assessment of those systems – the second step necessary to identify your priority planning areas (defined in Section 9.2).
9.1 Assess Your Climate Change RisksAs in other fields that require risk management, the process of priority setting for your climate change preparedness efforts will be based on your estimation of climate risk to systems in your planning areas. Risk is defined and described here as:
Risk = Consequence x Probability
Consequence of an impact. What are the known or estimated consequences (economic, ecological, social, cultural and legal) of a particular climate change impact? For example, consider how costly failure of a flood wall can be or how coastal ecosystems and development will be affected by different projections of sea level rise. This estimation may be qualitative (high, medium, low) and/or quantitative (e.g., $18 million for the failure of a flood wall). Your assessment of consequence should also factor in the estimated scale of the impact, such as the size of the population or land area affected by a projected climate change impact. Consider also the cumulative costs associated with a higher frequency of minor events.
Probability or likelihood of an impact. How likely is it that a projected impact will occur? Some climate change impacts, such as increasing average temperatures and sea level rise, are virtually certain. The degree to which these changes affect existing problems or lead to new problems was evaluated in your vulnerability assessment. Probability can be assessed qualitatively (high, med, low), particularly in cases where resources are limited, information is limited, or the consequences of the impacts are small. In cases where a quantitative estimate of probability is warranted, consider using more technical analytical techniques.
Use the information collected for your vulnerability assessment (Chapter 8) to estimate the consequence, probability, and resulting risk of specific climate change impacts to systems in your planning areas. Have each member of the preparedness team perform their own risk assessment for
•
•
CONDUCT A CLIMATE RESILIENCY STUDYThe following chapters recommend how to reach CRC Milestone Two, “Conduct a Climate Resiliency Study.”
Chapter 8: Conduct a Climate Change Vulnerability Assessment
Chapter 9: Conduct a Climate Change Risk Assessment
2MILESTONE
PREPARING FOR CLIMATE CHANGE��
systems in their respective planning areas. Team members may also want to survey staff within their home departments and/or technical experts (e.g., scientists, engineers, resource managers) to develop a more robust view of risk for systems in their planning areas.
Other considerations that can affect basic estimations of risk are your planning time frame, the geographic scale of the risk assessment, and attitudes towards risk. Planning for the impacts of sea level rise provides a good example of how each of these additional criteria factor into evaluating risk. The risk that low-lying coastal areas will be permanently inundated by higher sea levels is greater in 40 years than in 20 years (absent any adaptation) given that sea level is projected to be higher in 40 years than in 20 years. The risk of coastal erosion and flooding due to sea level rise in one estuary may be significantly different than the next depending on variations in coastal morphology, plate tectonics (e.g. uplift and subsidence), development patterns, and how much assets along the coast line are valued. Finally, attitudes towards risk can affect how individuals within your community and the planning process view and accept certain levels of risk, as described in Box 9.1. The degree to which any of these factors significantly alters the conclusions of the risk assessment should be considered.
Box 9.1 – Risk Perception and Risk Tolerance
One approach for sorting your risk assessment is identified in Table 9.1. It is good practice to describe why a high, medium, or low rating was assigned to a given system. You can also convert each qualitative statement into a numeric score (high=5, medium-high=4, medium=3, medium-low=2, and low=1) to develop risk scores for each impact. This can be particularly useful for evaluating results from larger group surveys.
For cases where the consequence or probability of an impact is unknown, consider other factors that may help determine the appropriate level of risk:
How important is the potential impact in context of other issues your government is currently managing?
If the probability of the impact is unknown but you assume it increases, how problematic would that increase be for systems in your planning areas?
•
•
How risk is viewed (risk perception) and accepted (risk tolerance) will play a significant role in your risk evaluation. Risk perception and tolerance can vary widely between individuals, over time, and/or with different thresholds. For example, one community may rank the potential for more extreme heat events higher than a neighboring community because of different perceptions of the risk associated with extreme heat events in each community. In another case, communities may have a high tolerance for a small increase in the risk of a 100 year flood event (from 1% annually to 5% annually, for example) but
that tolerance may change if the risk of the event changes from a 1% to a 20% annual probability. Which risks will your community be willing to accept? Which are unacceptable? Your government leadership and/or community may be prepared to take large risks in some areas and none at all in others, especially if that planning area is already under threat. Community meetings and interviews with government leaders may provide insight into what risks are and are not acceptable, and at what thresholds these distinctions are made.
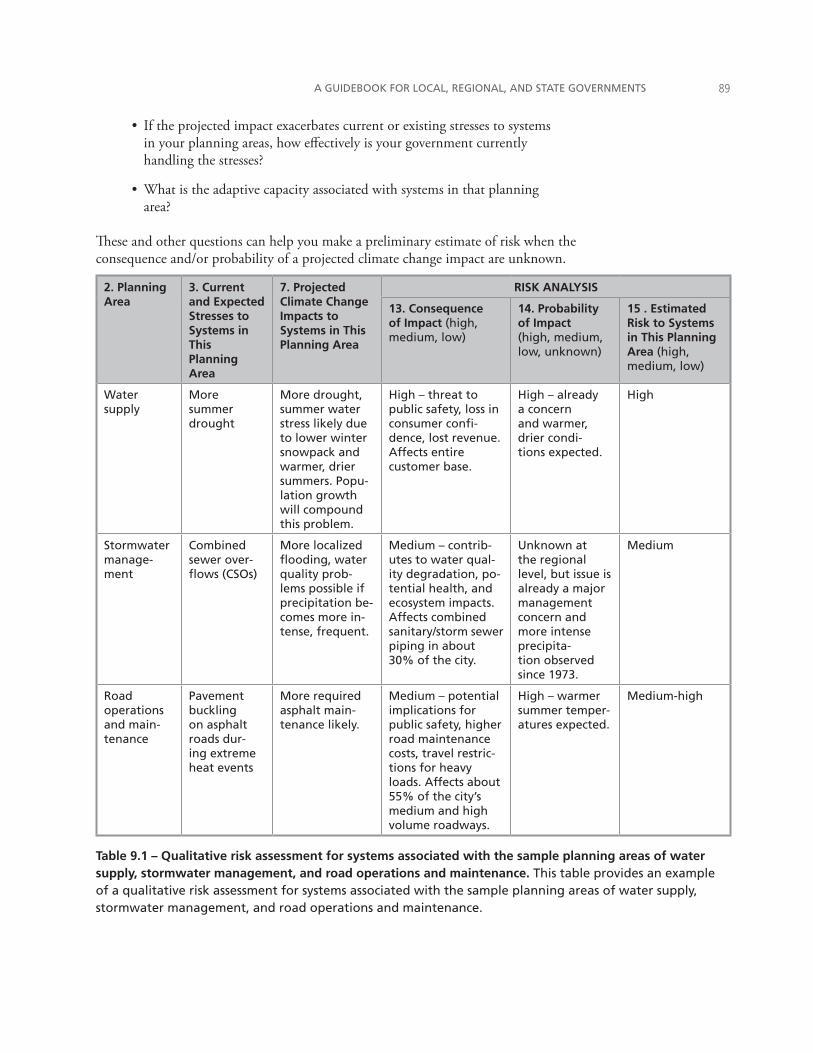
A GUIDEBOOK FOR LOCAL, REGIONAL, AND STATE GOVERNMENTS ��
If the projected impact exacerbates current or existing stresses to systems in your planning areas, how effectively is your government currently handling the stresses?
What is the adaptive capacity associated with systems in that planning area?
These and other questions can help you make a preliminary estimate of risk when the consequence and/or probability of a projected climate change impact are unknown.
•
•
2. Planning Area
3. Current and Expected Stresses to Systems in This Planning Area
7. Projected Climate Change Impacts to Systems in This Planning Area
RISK ANALYSIS
13. Consequence of Impact (high, medium, low)
14. Probability of Impact (high, medium, low, unknown)
15 . Estimated Risk to Systems in This Planning Area (high, medium, low)
Water supply
More summer drought
More drought, summer water stress likely due to lower winter snowpack and warmer, drier summers. Popu-lation growth will compound this problem.
High – threat to public safety, loss in consumer confi-dence, lost revenue. Affects entire customer base.
High – already a concern and warmer, drier condi-tions expected.
High
Stormwater manage-ment
Combined sewer over-flows (CSOs)
More localized flooding, water quality prob-lems possible if precipitation be-comes more in-tense, frequent.
Medium – contrib-utes to water qual-ity degradation, po-tential health, and ecosystem impacts. Affects combined sanitary/storm sewer piping in about 30% of the city.
Unknown at the regional level, but issue is already a major management concern and more intense precipita-tion observed since 1973.
Medium
Road operations and main-tenance
Pavement buckling on asphalt roads dur-ing extreme heat events
More required asphalt main-tenance likely.
Medium – potential implications for public safety, higher road maintenance costs, travel restric-tions for heavy loads. Affects about 55% of the city’s medium and high volume roadways.
High – warmer summer temper-atures expected.
Medium-high
Table 9.1 – Qualitative risk assessment for systems associated with the sample planning areas of water supply, stormwater management, and road operations and maintenance. This table provides an example of a qualitative risk assessment for systems associated with the sample planning areas of water supply, stormwater management, and road operations and maintenance.
PREPARING FOR CLIMATE CHANGE�0
9.2 Establish Your List of Priority Planning AreasAfter conducting your vulnerability and risk assessments for systems in your planning areas, you are now ready to identify your priority planning areas – or planning areas of particular importance to your community or government which are vulnerable to climate change impacts. From this point forward, your climate change preparedness efforts should focus on priority planning areas.
As public decision-makers, you may already be generating ideas for how to reduce the climate change vulnerabilities and risks you have identified, and you may even be embedding cost-benefit evaluations in your thinking. However, at this stage of problem definition, we encourage you to refrain from formally proposing or prioritizing your possible actions yet, and simply focus on ranking the problems you face – in the form of a list of priority planning areas. In Chapter 10,
we will provide more specific guidance on how to evaluate costs and benefits of individual preparedness actions in light of the other priorities of your government.
To identify your priority planning areas, group the results of your vulnerability assessment (Table 8.4) and your risk assessment into one of the following general categories of systems: high risk/high vulnerability, high risk/low vulnerability, low risk/high vulnerability, and low risk/low vulnerability. As illustrated in the vulnerability-risk matrix in Figure 9.1 you will want to make planning areas that have high-risk and high-vulnerability systems a priority.
How to prioritize planning areas that are not high-risk and high-vulnerability is up to your team. This decision will likely depend on a mix of criteria not explicitly captured in the vulnerability and risk assessment process, including considerations such as values, economic drivers, and other factors unique to a given community. Examples include:
Existing community government priorities. For example, your administration may already be committed to reducing the risk of forest fires in adjoining forest lands. This effort may make preparedness planning in forest resources a higher priority over other planning areas.
Unique planning or funding opportunities. Examples of unique opportunities include: one-time-only state grants for addressing coastal zoning planning, and plans to make significant upgrades to the community’s stormwater collection system. These windows of opportunity may influence the decision to prioritize a planning area that would not otherwise have been chosen.
As illustrations, some of King County’s climate change priority planning areas are: public health and emergency preparedness, water supply and streamflow management, coastal hazards management, and flood hazard management.
•
•
PRIORITY PLANNING AREAS are the planning areas which your community or government determine to be most important given your community’s vulnerabilities to climate change and the associated risks.
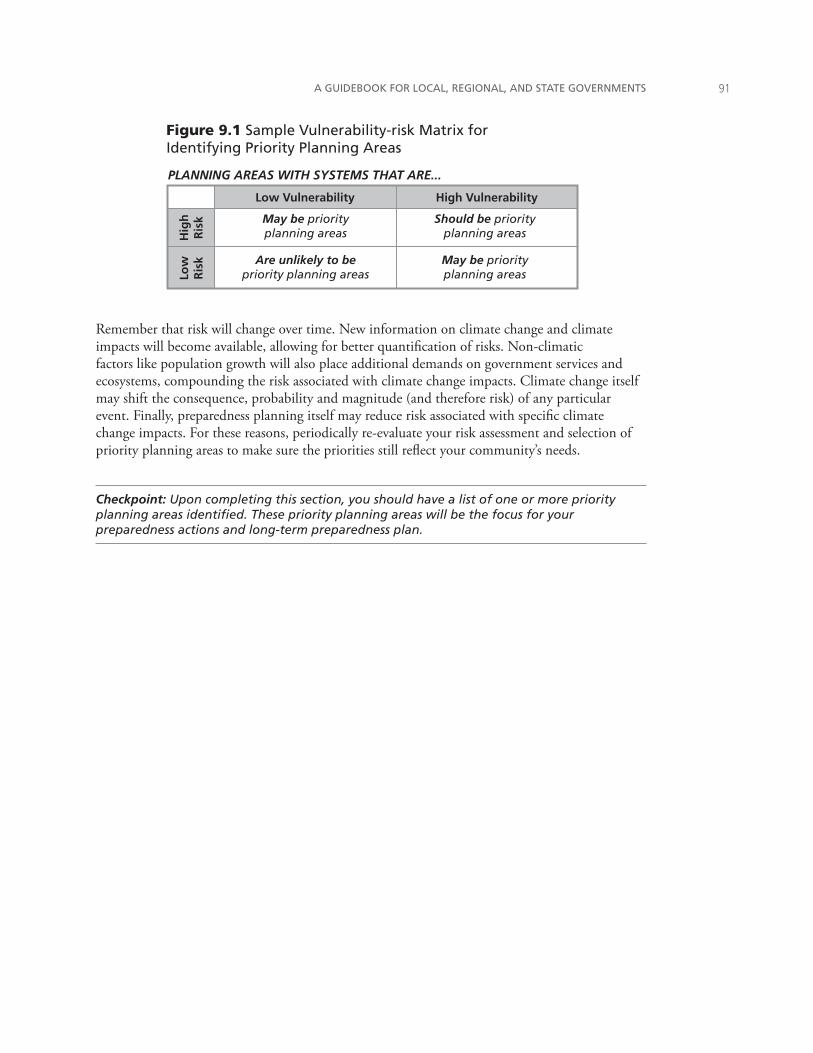
A GUIDEBOOK FOR LOCAL, REGIONAL, AND STATE GOVERNMENTS ��
Remember that risk will change over time. New information on climate change and climate impacts will become available, allowing for better quantification of risks. Non-climatic factors like population growth will also place additional demands on government services and ecosystems, compounding the risk associated with climate change impacts. Climate change itself may shift the consequence, probability and magnitude (and therefore risk) of any particular event. Finally, preparedness planning itself may reduce risk associated with specific climate change impacts. For these reasons, periodically re-evaluate your risk assessment and selection of priority planning areas to make sure the priorities still reflect your community’s needs.
Checkpoint: Upon completing this section, you should have a list of one or more priority planning areas identified. These priority planning areas will be the focus for your preparedness actions and long-term preparedness plan.
PLANNING AREAS WITH SYSTEMS THAT ARE...
High VulnerabilityH
igh
Ris
kLo
wR
isk
Low Vulnerability
Should be priority planning areas
May be priority planning areas
May be priority planning areas
Are unlikely to bepriority planning areas
Figure 9.1 Sample Vulnerability-risk Matrix for Identifying Priority Planning Areas

PREPARING FOR CLIMATE CHANGE��
��
SET PREPAREDNESS GOALS AND DEVELOP YOUR PREPAREDNESS PLAN
Chapter 10: Recommends how to reach CRC Milestone Three
3MILESTONE
chapter �0 set preparedness goals and develop your preparedness plan
Now that you have identified your priority planning areas, you are almost ready to set your preparedness goals and develop your preparedness actions to address the system stresses that climate change will impose in these areas. This chapter will guide you to take the following steps related to this goal- and action-setting stage:
establish a vision for a climate resilient community, as well as related guiding principles for resilience, which you will use to inform your process of setting preparedness goals in your priority planning areas;
develop, select and prioritize preparedness actions and write a preparedness plan to meet the goals you have set.
10.1 Establish a Vision and Guiding Principles for a Climate Resilient CommunityAs you consider how to deal with the system stresses that climate change bring in your priority planning areas, keep this vision in mind: preparing for climate change is not about making your community “climate proof,” but rather making it “climate resilient.”
A climate resilient community is one that takes proactive steps to prepare for (i.e., reduce the vulnerabilities and risks associated with) projected climate change impacts. To achieve this vision, we recommend the following five guiding principles for resilience:
Guiding Principle #1: Increase public awareness of climate change and its projected impacts on your community. Outreach and education about climate change, how it affects your community, and what can be done to prepare for climate change can have multiple benefits. First, public education can foster public support for preparedness planning at the government level and influence changes in behaviors to decrease vulnerability and risk to climate change (e.g., water use efficiency at the household level). Secondly, public awareness about climate change impacts and preparedness planning may encourage your community to reduce individual and collective greenhouse gas emissions to prevent the worst impacts of climate change in the future. Different avenues for outreach are suggested in Chapter 5.
•
•
•
A ‘CLIMATE RESILIENT COMMUNITY’ is one that takes proactive steps to prepare for (i.e., reduce the vulnerabilities and risks associated with) projected climate change impacts.
PREPARING FOR CLIMATE CHANGE��
Guiding Principle #2: Increase your technical capacity to prepare for climate change impacts. Building climate resilience requires developing a more complete understanding of how climate change affects your community at all levels of government, from public officials to managers and front-line employees. Employ your public outreach tactics inwardly (“inreach”) to create more opportunities for learning about climate change, its impacts, and how preparing for climate change might affect individual job responsibilities. You can also improve technical capacity by creating staff positions for managing preparedness actions, expanding modeling capabilities to examine various “what if ” scenarios, or permanently establishing the preparedness planning team to monitor preparedness actions across various government departments.
Guiding Principle #3: “Mainstream” information about climate change vulnerabilities, risks, and preparedness into planning, policy, and investment decisions. As noted throughout the guidebook, climate change will affect many aspects of local, regional, and state government. In order to remain resilient to these impacts, look to “mainstream” climate change assumptions and preparedness actions into planning, policy-making, and investment decisions. This means developing more systematic ways of addressing climate change in government activities, making decisions more robust to a range of climate change scenarios, and increasing flexibility in how government services and programs are managed.
Guiding Principle #4: Increase the adaptive capacity of built, natural, and human systems in your community. Built, natural, and human systems provide many essential functions that benefit a community, including mobility (e.g., via roads and bridges), erosion and flood control (e.g., via wetlands or forests) or habitat for a wide range of plant and animal species (e.g., via estuaries and grasslands), and public health services (e.g., via hospitals and medical clinics). Maintaining the adaptive capacity of built, natural, and human systems and the services they provide will benefit your community, its economy, and quality of life.
Guiding Principle #5: Strengthen community partnerships that reduce vulnerability and risk to climate change impacts. Many climate change impacts will originate outside the jurisdictional boundaries of your community (e.g., the spread of new vector-borne disease into your region), or require the cooperation of other local and regional governments, federal and state agencies, tribes, non-profit organizations, and the private sector to address effectively. Working in partnership with these organizations will not only help your preparedness efforts, but will also help you to identify new roles that others can play to improve your community’s resilience.
•
•
•
•
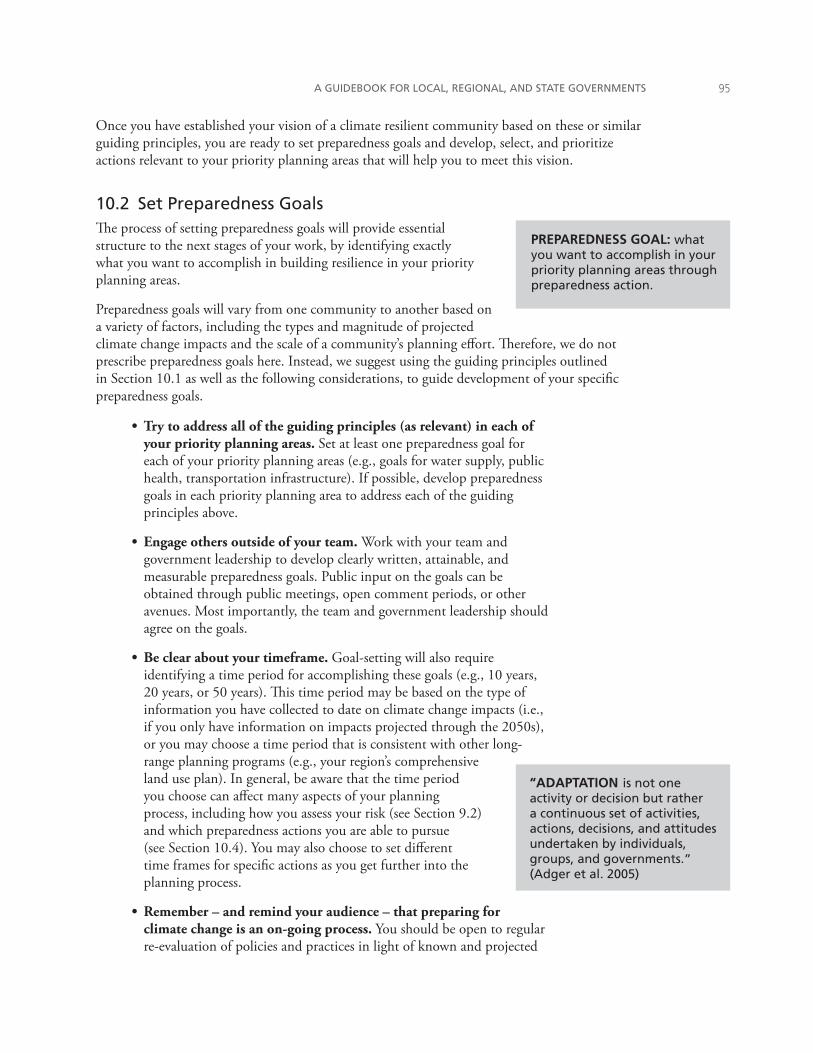
A GUIDEBOOK FOR LOCAL, REGIONAL, AND STATE GOVERNMENTS ��
Once you have established your vision of a climate resilient community based on these or similar guiding principles, you are ready to set preparedness goals and develop, select, and prioritize actions relevant to your priority planning areas that will help you to meet this vision.
10.2 Set Preparedness GoalsThe process of setting preparedness goals will provide essential structure to the next stages of your work, by identifying exactly what you want to accomplish in building resilience in your priority planning areas.
Preparedness goals will vary from one community to another based on a variety of factors, including the types and magnitude of projected climate change impacts and the scale of a community’s planning effort. Therefore, we do not prescribe preparedness goals here. Instead, we suggest using the guiding principles outlined in Section 10.1 as well as the following considerations, to guide development of your specific preparedness goals.
Try to address all of the guiding principles (as relevant) in each of your priority planning areas. Set at least one preparedness goal for each of your priority planning areas (e.g., goals for water supply, public health, transportation infrastructure). If possible, develop preparedness goals in each priority planning area to address each of the guiding principles above.
Engage others outside of your team. Work with your team and government leadership to develop clearly written, attainable, and measurable preparedness goals. Public input on the goals can be obtained through public meetings, open comment periods, or other avenues. Most importantly, the team and government leadership should agree on the goals.
Be clear about your timeframe. Goal-setting will also require identifying a time period for accomplishing these goals (e.g., 10 years, 20 years, or 50 years). This time period may be based on the type of information you have collected to date on climate change impacts (i.e., if you only have information on impacts projected through the 2050s), or you may choose a time period that is consistent with other long-range planning programs (e.g., your region’s comprehensive land use plan). In general, be aware that the time period you choose can affect many aspects of your planning process, including how you assess your risk (see Section 9.2) and which preparedness actions you are able to pursue (see Section 10.4). You may also choose to set different time frames for specific actions as you get further into the planning process.
Remember – and remind your audience – that preparing for climate change is an on-going process. You should be open to regular re-evaluation of policies and practices in light of known and projected
•
•
•
•
PREPAREDNESS GOAL: what you want to accomplish in your priority planning areas through preparedness action.
“ADAPTATION is not one activity or decision but rather a continuous set of activities, actions, decisions, and attitudes undertaken by individuals, groups, and governments.” (Adger et al. 2005)
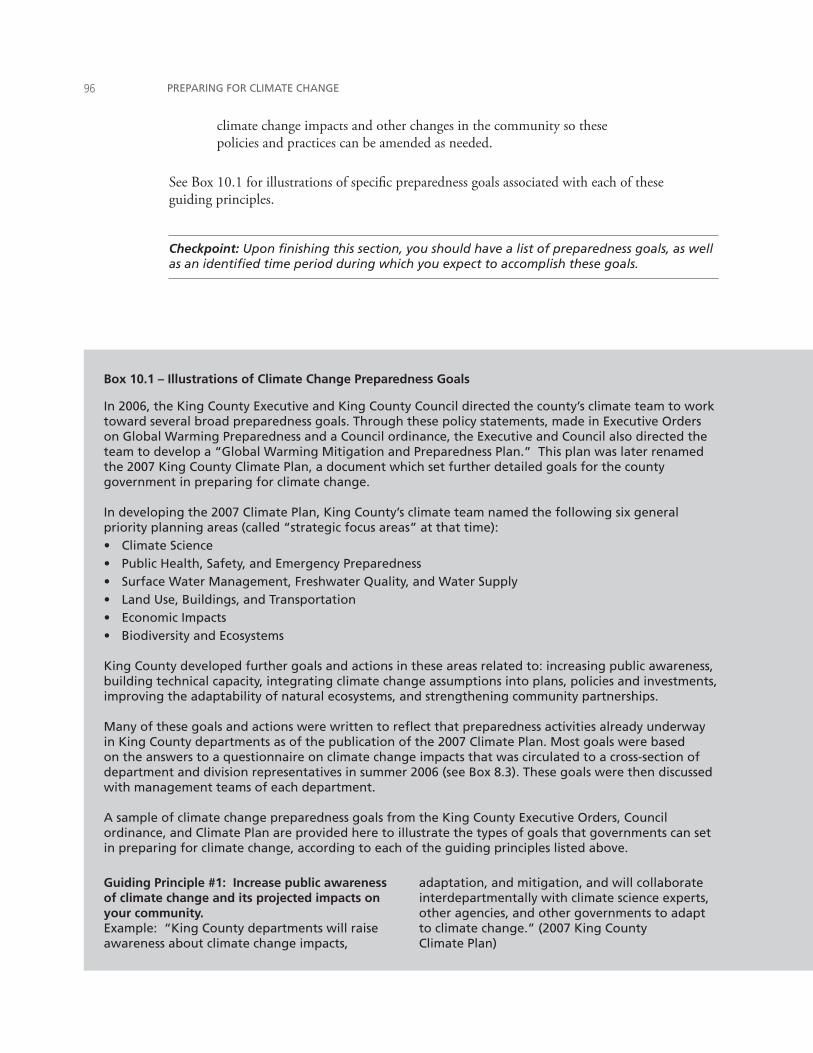
PREPARING FOR CLIMATE CHANGE��
Box 10.1 – Illustrations of Climate Change Preparedness Goals
In 2006, the King County Executive and King County Council directed the county’s climate team to work toward several broad preparedness goals. Through these policy statements, made in Executive Orders on Global Warming Preparedness and a Council ordinance, the Executive and Council also directed the team to develop a “Global Warming Mitigation and Preparedness Plan.” This plan was later renamed the 2007 King County Climate Plan, a document which set further detailed goals for the county government in preparing for climate change.
In developing the 2007 Climate Plan, King County’s climate team named the following six general priority planning areas (called “strategic focus areas” at that time):
Climate SciencePublic Health, Safety, and Emergency PreparednessSurface Water Management, Freshwater Quality, and Water SupplyLand Use, Buildings, and Transportation Economic ImpactsBiodiversity and Ecosystems
King County developed further goals and actions in these areas related to: increasing public awareness, building technical capacity, integrating climate change assumptions into plans, policies and investments, improving the adaptability of natural ecosystems, and strengthening community partnerships.
Many of these goals and actions were written to reflect that preparedness activities already underway in King County departments as of the publication of the 2007 Climate Plan. Most goals were based on the answers to a questionnaire on climate change impacts that was circulated to a cross-section of department and division representatives in summer 2006 (see Box 8.3). These goals were then discussed with management teams of each department.
A sample of climate change preparedness goals from the King County Executive Orders, Council ordinance, and Climate Plan are provided here to illustrate the types of goals that governments can set in preparing for climate change, according to each of the guiding principles listed above.
••••••
Guiding Principle #1: Increase public awareness of climate change and its projected impacts on your community.Example: “King County departments will raise awareness about climate change impacts,
adaptation, and mitigation, and will collaborate interdepartmentally with climate science experts, other agencies, and other governments to adapt to climate change.” (2007 King County Climate Plan)
climate change impacts and other changes in the community so these policies and practices can be amended as needed.
See Box 10.1 for illustrations of specific preparedness goals associated with each of these guiding principles.
Checkpoint: Upon finishing this section, you should have a list of preparedness goals, as well as an identified time period during which you expect to accomplish these goals.
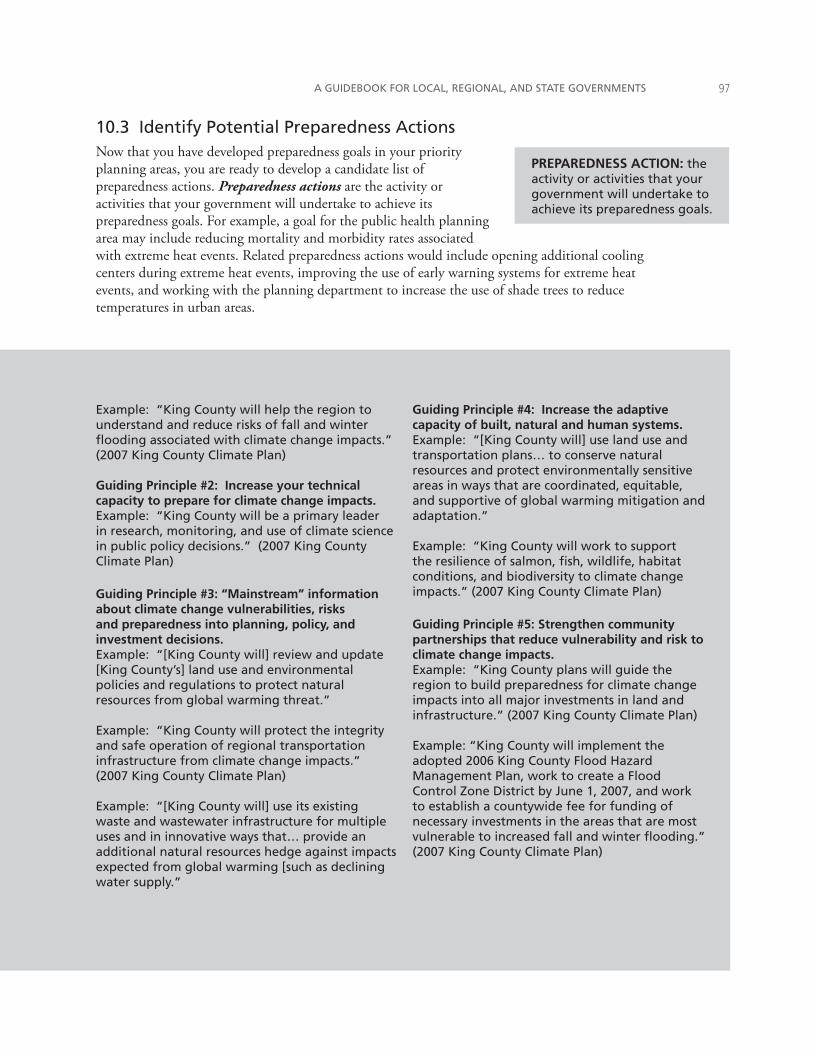
A GUIDEBOOK FOR LOCAL, REGIONAL, AND STATE GOVERNMENTS ��
Example: “King County will help the region to understand and reduce risks of fall and winter flooding associated with climate change impacts.” (2007 King County Climate Plan)
Guiding Principle #2: Increase your technical capacity to prepare for climate change impacts. Example: “King County will be a primary leader in research, monitoring, and use of climate science in public policy decisions.” (2007 King County Climate Plan)
Guiding Principle #3: “Mainstream” information about climate change vulnerabilities, risks and preparedness into planning, policy, and investment decisions. Example: “[King County will] review and update [King County’s] land use and environmental policies and regulations to protect natural resources from global warming threat.”
Example: “King County will protect the integrity and safe operation of regional transportation infrastructure from climate change impacts.” (2007 King County Climate Plan)
Example: “[King County will] use its existing waste and wastewater infrastructure for multiple uses and in innovative ways that… provide an additional natural resources hedge against impacts expected from global warming [such as declining water supply.”
Guiding Principle #4: Increase the adaptive capacity of built, natural and human systems.Example: “[King County will] use land use and transportation plans… to conserve natural resources and protect environmentally sensitive areas in ways that are coordinated, equitable, and supportive of global warming mitigation and adaptation.”
Example: “King County will work to support the resilience of salmon, fish, wildlife, habitat conditions, and biodiversity to climate change impacts.” (2007 King County Climate Plan)
Guiding Principle #5: Strengthen community partnerships that reduce vulnerability and risk to climate change impacts.Example: “King County plans will guide the region to build preparedness for climate change impacts into all major investments in land and infrastructure.” (2007 King County Climate Plan)
Example: “King County will implement the adopted 2006 King County Flood Hazard Management Plan, work to create a Flood Control Zone District by June 1, 2007, and work to establish a countywide fee for funding of necessary investments in the areas that are most vulnerable to increased fall and winter flooding.” (2007 King County Climate Plan)
10.3 Identify Potential Preparedness ActionsNow that you have developed preparedness goals in your priority planning areas, you are ready to develop a candidate list of preparedness actions. Preparedness actions are the activity or activities that your government will undertake to achieve its preparedness goals. For example, a goal for the public health planning area may include reducing mortality and morbidity rates associated with extreme heat events. Related preparedness actions would include opening additional cooling centers during extreme heat events, improving the use of early warning systems for extreme heat events, and working with the planning department to increase the use of shade trees to reduce temperatures in urban areas.
PREPAREDNESS ACTION: the activity or activities that your government will undertake to achieve its preparedness goals.
PREPARING FOR CLIMATE CHANGE��
Think broadly when developing your list of candidate actions. This is your chance to brainstorm. There is no “one size fits all” prescription for determining which preparedness actions are best; you will need to evaluate the appropriateness of different actions for your community based on a number of factors, including your priority planning area vulnerabilities and the types of resources available to your community. At a general level, your actions will involve any combination of the following:
Modifying policies, practices, and procedures. Existing regulations, policies, operating practices, development plans, and other modes of governing may need to be modified to increase resiliency. In particular, look for the following policy “red flags” – regulations, policies, practices and procedures that:
- do not allow regular re-evaluation and adjustment in accordance with changing conditions;
- require planning based strictly on the past, or pin certain decisions to certain periods or seasonal patterns;
- reinforce trends that increase vulnerability or reduce adaptive capacity (e.g., development along flood plains).
Specific modifications may include improving drought plans, retreating from or abandon vulnerable areas, changing building and zoning codes, adjusting utility prices, or developing contingency plans for low probability but high consequence events (UKCIP 2007). As you look at existing regulations, policies, etc., also consider whether the procedures and guidelines used to formulate new regulations need to be updated so that future regulations are more climate resilient.
Diversifying options. You may increase your adaptive capacity and in turn reduce your vulnerability to climate change by providing a “buffer” against climate change impacts. Examples include developing new groundwater sources or wastewater reclamation capacity to diversify your water supply, or diversifying your community’s economic base to move away from relying on sources of revenue that may be negatively affected by climate change (e.g., winter recreation).
Building new or upgrading existing infrastructure. You may need to develop new infrastructure or upgrade existing infrastructure to accommodate climate change impacts. Illustrations of this include expanding stormwater collection systems, expanding wastewater treatment capacity, increasing bridge heights, or strengthening flood control levees.
Improving community awareness and preparedness. Outreach and education will be needed to generate support for specific preparedness actions. Outreach and education can also be used to effect voluntary change at the individual household level, such as water conservation.
•
•
•
•
A GUIDEBOOK FOR LOCAL, REGIONAL, AND STATE GOVERNMENTS ��
Partnership building with other communities and agencies. Communities do not govern in isolation, and climate change impacts do not follow jurisdictional boundaries. Preparing for climate change will require building new collaborations or strengthening existing partnerships (e.g., with other local governments, tribes, federal and state agencies, non-profit organizations, and the private sector) to address the impacts that occur both within and outside of your community’s jurisdiction.
A list of general climate change preparedness goals and actions for U.S. Pacific Northwest communities is provided in Table 10.1. This list builds on the sample tables used in previous chapters to illustrate how to identify priority planning areas by conducting vulnerability and risk assessments; it features the potential goals and actions in these identified priority planning areas, as well as goals and actions for a number of other additional planning areas.
Note that the preparedness actions listed in the table are traditional government activities, many of which may already be underway in your community. Preparedness can also involve more non-traditional government activities such as research, monitoring and data collection. The aim at this point is to cast a wide net, identifying as many potential preparedness actions as possible. Once your list is assembled, you will evaluate and narrow the list of your options for implementation.
Appendix D.4 identifies a variety of sources on preparing for climate change, many of which provide information on preparedness actions. Other jurisdictions and governmental entities facing similar climate change challenges may also be good sources of information on preparedness actions. This was the approach taken by London, England in their report, Adapting to Climate Change: Lessons for London (see Box 10.2).
In some cases, a lack of detailed information can make it difficult to identify the most appropriate preparedness actions. For example, the fact that it is impossible to project exactly what climate change means for a certain species of shellfish or a certain pollinator means that it will be very difficult, if not impossible, to engineer resource management to specifically match anticipated climate conditions. In these cases, it may be more effective to maintain an ecosystem’s overall resilience to climate change impacts rather than trying to focus on a specific segment of the ecosystem. This approach may provide other near-term benefits as well, potentially creating a “no regrets” or “win-win” result (see Section 10.4). Delaying action may also be an appropriate option if the additional time can be used to gather more information through research or monitoring (UKCIP 2007), although even in these cases there might be “no-regrets” actions that can be implemented.
•
POLICY “RED FLAGS” As you consid-er how you will prepare for climate change, watch for regulations, poli-cies, practices, and procedures that:
Do not allow regular re-evaluation and adjustment in accordance with changing conditions,Require planning based strictly on the past, or pin certain decisions/triggers to certain periods or seasonal patterns, andReinforce trends that increase vulnerability or reduce adaptability (e.g., development along flood plains).
•
•
•
PREPARING FOR CLIMATE CHANGE�00
Box 10.2 – Adapting to Climate Change: Lessons for London
In order to develop a list of potential preparedness actions for the major impacts of climate change projected for London, city planners and others commissioned a report reviewing “how other major international cities are managing climate risks.” The report, Adapting to Climate Change: Lessons for London, describes innovative approaches used by other cities to protect their citizens and economies from extreme weather risks such as those expected to become more likely for London under climate change (London Climate Change Partnership 2006). The review examined eighteen cities’ management of the climate-related risks of
flooding, high temperatures, and limited water resources, the relevance of each city’s approach to the specific climate change risks projected for London, and the applicability of each city’s approach within London’s planning and policy framework. The report will be used by the London Climate Change Partnership, a group of public and private sector organizations across London who have responsibilities that will be affected by the impacts of climate change, to inform the formation of climate adaptation planning policies for London. The report can be downloaded from www.london.gov.uk/climatechangepartnership/.
Checkpoint: Upon finishing this section, you should have a list of potential preparedness actions for your priority planning areas.
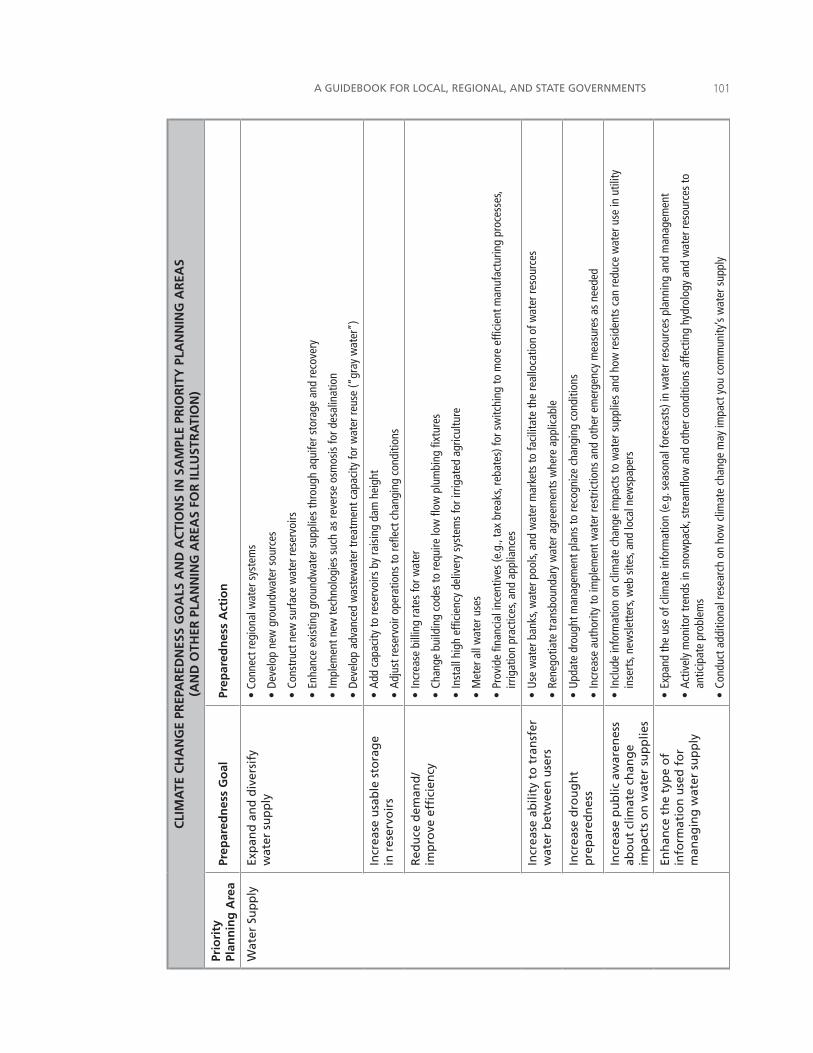
A GUIDEBOOK FOR LOCAL, REGIONAL, AND STATE GOVERNMENTS �0�
CLI
MA
TE C
HA
NG
E PR
EPA
RED
NES
S G
OA
LS A
ND
AC
TIO
NS
IN S
AM
PLE
PRIO
RIT
Y P
LAN
NIN
G A
REA
S
(AN
D O
THER
PLA
NN
ING
AR
EAS
FOR
ILLU
STR
ATI
ON
)
Prio
rity
Pl
ann
ing
Are
aPr
epar
edn
ess
Go
alPr
epar
edn
ess
Act
ion
Wat
er S
up
ply
Exp
and
an
d d
iver
sify
w
ater
su
pp
ly•
Conn
ect r
egio
nal w
ater
sys
tem
s
• De
velo
p ne
w g
roun
dwat
er s
ourc
es
• Co
nstr
uct n
ew s
urfa
ce w
ater
rese
rvoi
rs
• En
hanc
e ex
istin
g gr
ound
wat
er s
uppl
ies
thro
ugh
aqui
fer s
tora
ge a
nd re
cove
ry
• Im
plem
ent n
ew te
chno
logi
es s
uch
as re
vers
e os
mos
is fo
r des
alin
atio
n
• De
velo
p ad
vanc
ed w
aste
wat
er tr
eatm
ent c
apac
ity fo
r wat
er re
use
(“gr
ay w
ater
”)
Incr
ease
usa
ble
sto
rag
e in
res
ervo
irs
• Ad
d ca
paci
ty to
rese
rvoi
rs b
y ra
isin
g da
m h
eigh
t
• Ad
just
rese
rvoi
r ope
ratio
ns to
refle
ct c
hang
ing
cond
ition
s
Red
uce
dem
and
/im
pro
ve e
ffici
ency
• In
crea
se b
illin
g ra
tes
for w
ater
• Ch
ange
bui
ldin
g co
des
to re
quire
low
flow
plu
mbi
ng fi
xtur
es
• In
stal
l hig
h ef
ficie
ncy
deliv
ery
syst
ems
for i
rrig
ated
agr
icul
ture
• M
eter
all
wat
er u
ses
• Pr
ovid
e fin
anci
al in
cent
ives
(e.g
., ta
x br
eaks
, reb
ates
) for
sw
itchi
ng to
mor
e ef
ficie
nt m
anuf
actu
ring
proc
esse
s, irr
igat
ion
prac
tices
, and
app
lianc
es
Incr
ease
ab
ility
to
tra
nsf
er
wat
er b
etw
een
use
rs•
Use
wat
er b
anks
, wat
er p
ools,
and
wat
er m
arke
ts to
faci
litat
e th
e re
allo
catio
n of
wat
er re
sour
ces
• Re
nego
tiate
tran
sbou
ndar
y w
ater
agr
eem
ents
whe
re a
pplic
able
Incr
ease
dro
ug
ht
pre
par
edn
ess
• U
pdat
e dr
ough
t man
agem
ent p
lans
to re
cogn
ize
chan
ging
con
ditio
ns
• In
crea
se a
utho
rity
to im
plem
ent w
ater
rest
rictio
ns a
nd o
ther
em
erge
ncy
mea
sure
s as
nee
ded
Incr
ease
pu
blic
aw
aren
ess
abo
ut
clim
ate
chan
ge
imp
acts
on
wat
er s
up
plie
s
• In
clud
e in
form
atio
n on
clim
ate
chan
ge im
pact
s to
wat
er s
uppl
ies
and
how
resi
dent
s ca
n re
duce
wat
er u
se in
util
ity
inse
rts,
new
slet
ters
, web
site
s, an
d lo
cal n
ewsp
aper
s
Enh
ance
th
e ty
pe
of
info
rmat
ion
use
d f
or
man
agin
g w
ater
su
pp
ly
• Ex
pand
the
use
of c
limat
e in
form
atio
n (e
.g. s
easo
nal f
orec
asts
) in
wat
er re
sour
ces
plan
ning
and
man
agem
ent
• Ac
tivel
y m
onito
r tre
nds
in s
now
pack
, str
eam
flow
and
oth
er c
ondi
tions
affe
ctin
g hy
drol
ogy
and
wat
er re
sour
ces
to
antic
ipat
e pr
oble
ms
• Co
nduc
t add
ition
al re
sear
ch o
n ho
w c
limat
e ch
ange
may
impa
ct y
ou c
omm
unity
’s w
ater
sup
ply
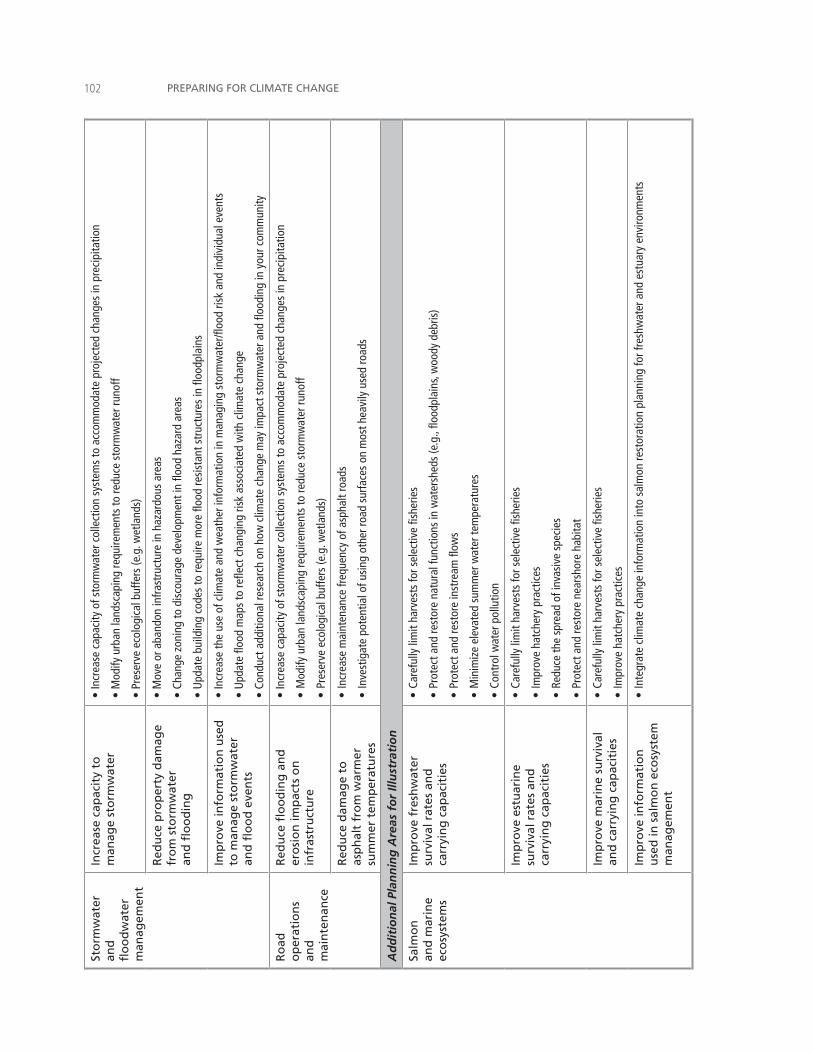
PREPARING FOR CLIMATE CHANGE�0�St
orm
wat
er
and
fl
oo
dw
ater
m
anag
emen
t
Incr
ease
cap
acit
y to
m
anag
e st
orm
wat
er•
Incr
ease
cap
acity
of s
torm
wat
er c
olle
ctio
n sy
stem
s to
acc
omm
odat
e pr
ojec
ted
chan
ges
in p
reci
pita
tion
• M
odify
urb
an la
ndsc
apin
g re
quire
men
ts to
redu
ce s
torm
wat
er ru
noff
• Pr
eser
ve e
colo
gica
l buf
fers
(e.g
. wet
land
s)
Red
uce
pro
per
ty d
amag
e fr
om
sto
rmw
ater
an
d fl
oo
din
g
• M
ove
or a
band
on in
frast
ruct
ure
in h
azar
dous
are
as
• Ch
ange
zon
ing
to d
isco
urag
e de
velo
pmen
t in
flood
haz
ard
area
s
• U
pdat
e bu
ildin
g co
des
to re
quire
mor
e flo
od re
sist
ant s
truc
ture
s in
floo
dpla
ins
Imp
rove
info
rmat
ion
use
d
to m
anag
e st
orm
wat
er
and
flo
od
eve
nts
• In
crea
se th
e us
e of
clim
ate
and
wea
ther
info
rmat
ion
in m
anag
ing
stor
mw
ater
/floo
d ris
k an
d in
divi
dual
eve
nts
• U
pdat
e flo
od m
aps
to re
flect
cha
ngin
g ris
k as
soci
ated
with
clim
ate
chan
ge
• Co
nduc
t add
ition
al re
sear
ch o
n ho
w c
limat
e ch
ange
may
impa
ct s
torm
wat
er a
nd fl
oodi
ng in
you
r com
mun
ity
Ro
ad
op
erat
ion
s an
d
mai
nte
nan
ce
Red
uce
flo
od
ing
an
d
ero
sio
n im
pac
ts o
n
infr
astr
uct
ure
• In
crea
se c
apac
ity o
f sto
rmw
ater
col
lect
ion
syst
ems
to a
ccom
mod
ate
proj
ecte
d ch
ange
s in
pre
cipi
tatio
n
• M
odify
urb
an la
ndsc
apin
g re
quire
men
ts to
redu
ce s
torm
wat
er ru
noff
• Pr
eser
ve e
colo
gica
l buf
fers
(e.g
. wet
land
s)
Red
uce
dam
age
to
asp
hal
t fr
om
war
mer
su
mm
er t
emp
erat
ure
s
• In
crea
se m
aint
enan
ce fr
eque
ncy
of a
spha
lt ro
ads
• In
vest
igat
e po
tent
ial o
f usi
ng o
ther
road
sur
face
s on
mos
t hea
vily
use
d ro
ads
Ad
dit
ion
al P
lan
nin
g A
reas
fo
r Ill
ust
rati
on
Salm
on
an
d m
arin
e ec
osy
stem
s
Imp
rove
fre
shw
ater
su
rviv
al r
ates
an
d
carr
yin
g c
apac
itie
s
• Ca
refu
lly li
mit
harv
ests
for s
elec
tive
fishe
ries
• Pr
otec
t and
rest
ore
natu
ral f
unct
ions
in w
ater
shed
s (e
.g.,
flood
plai
ns, w
oody
deb
ris)
• Pr
otec
t and
rest
ore
inst
ream
flow
s
• M
inim
ize
elev
ated
sum
mer
wat
er te
mpe
ratu
res
• Co
ntro
l wat
er p
ollu
tion
Imp
rove
est
uar
ine
surv
ival
rat
es a
nd
ca
rryi
ng
cap
acit
ies
• Ca
refu
lly li
mit
harv
ests
for s
elec
tive
fishe
ries
• Im
prov
e ha
tche
ry p
ract
ices
• Re
duce
the
spre
ad o
f inv
asiv
e sp
ecie
s
• Pr
otec
t and
rest
ore
near
shor
e ha
bita
t
Imp
rove
mar
ine
surv
ival
an
d c
arry
ing
cap
acit
ies
• Ca
refu
lly li
mit
harv
ests
for s
elec
tive
fishe
ries
• Im
prov
e ha
tche
ry p
ract
ices
Imp
rove
info
rmat
ion
u
sed
in s
alm
on
eco
syst
em
man
agem
ent
• In
tegr
ate
clim
ate
chan
ge in
form
atio
n in
to s
alm
on re
stor
atio
n pl
anni
ng fo
r fre
shw
ater
and
est
uary
env
ironm
ents
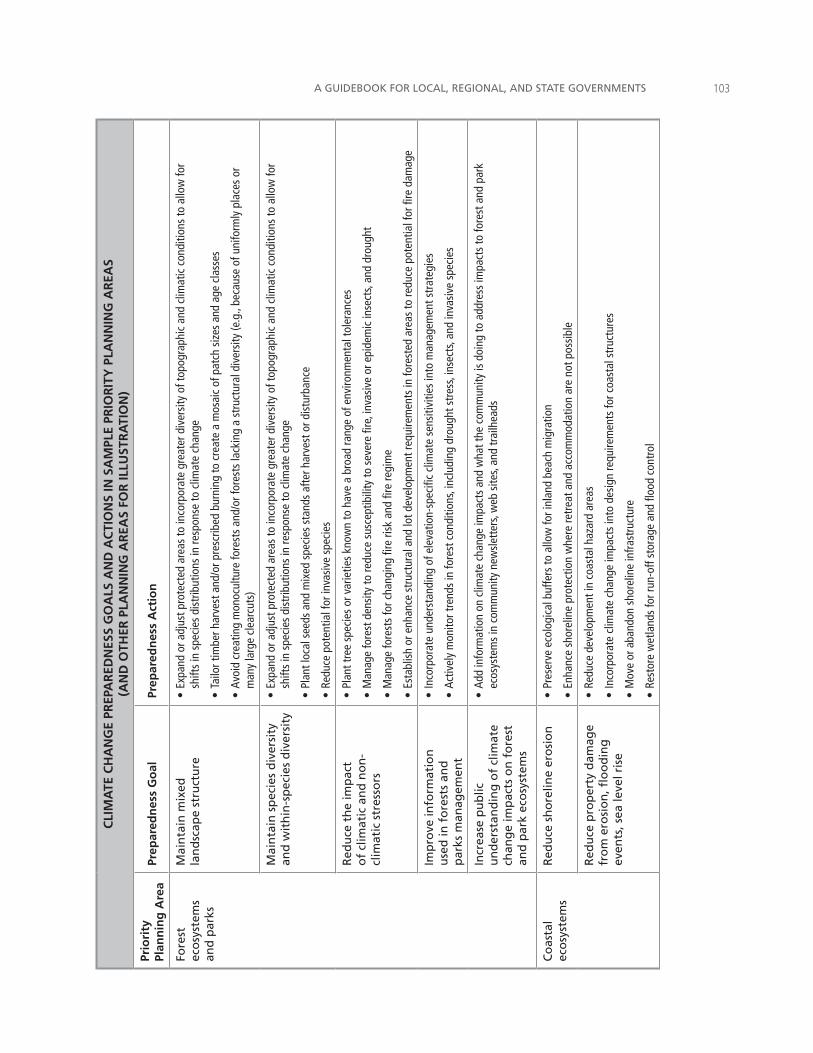
A GUIDEBOOK FOR LOCAL, REGIONAL, AND STATE GOVERNMENTS �0�
CLI
MA
TE C
HA
NG
E PR
EPA
RED
NES
S G
OA
LS A
ND
AC
TIO
NS
IN S
AM
PLE
PRIO
RIT
Y P
LAN
NIN
G A
REA
S
(AN
D O
THER
PLA
NN
ING
AR
EAS
FOR
ILLU
STR
ATI
ON
)
Prio
rity
Pl
ann
ing
Are
aPr
epar
edn
ess
Go
alPr
epar
edn
ess
Act
ion
Fore
st
eco
syst
ems
and
par
ks
Mai
nta
in m
ixed
la
nd
scap
e st
ruct
ure
• Ex
pand
or a
djus
t pro
tect
ed a
reas
to in
corp
orat
e gr
eate
r div
ersi
ty o
f top
ogra
phic
and
clim
atic
con
ditio
ns to
allo
w fo
r sh
ifts
in s
peci
es d
istr
ibut
ions
in re
spon
se to
clim
ate
chan
ge
• Ta
ilor t
imbe
r har
vest
and
/or p
resc
ribed
bur
ning
to c
reat
e a
mos
aic
of p
atch
siz
es a
nd a
ge c
lass
es
• Av
oid
crea
ting
mon
ocul
ture
fore
sts
and/
or fo
rest
s la
ckin
g a
stru
ctur
al d
iver
sity
(e.g
., be
caus
e of
uni
form
ly p
lace
s or
m
any
larg
e cl
earc
uts)
Mai
nta
in s
pec
ies
div
ersi
ty
and
wit
hin
-sp
ecie
s d
iver
sity
• Ex
pand
or a
djus
t pro
tect
ed a
reas
to in
corp
orat
e gr
eate
r div
ersi
ty o
f top
ogra
phic
and
clim
atic
con
ditio
ns to
allo
w fo
r sh
ifts
in s
peci
es d
istr
ibut
ions
in re
spon
se to
clim
ate
chan
ge
• Pl
ant l
ocal
see
ds a
nd m
ixed
spe
cies
sta
nds
afte
r har
vest
or d
istu
rban
ce
• Re
duce
pot
entia
l for
inva
sive
spe
cies
Red
uce
th
e im
pac
t o
f cl
imat
ic a
nd
no
n-
clim
atic
str
esso
rs
• Pl
ant t
ree
spec
ies
or v
arie
ties
know
n to
hav
e a
broa
d ra
nge
of e
nviro
nmen
tal t
oler
ance
s
• M
anag
e fo
rest
den
sity
to re
duce
sus
cept
ibili
ty to
sev
ere
fire,
inva
sive
or e
pide
mic
inse
cts,
and
drou
ght
• M
anag
e fo
rest
s fo
r cha
ngin
g fir
e ris
k an
d fir
e re
gim
e
• Es
tabl
ish
or e
nhan
ce s
truc
tura
l and
lot d
evel
opm
ent r
equi
rem
ents
in fo
rest
ed a
reas
to re
duce
pot
entia
l for
fire
dam
age
Imp
rove
info
rmat
ion
u
sed
in f
ore
sts
and
p
arks
man
agem
ent
• In
corp
orat
e un
ders
tand
ing
of e
leva
tion-
spec
ific
clim
ate
sens
itivi
ties
into
man
agem
ent s
trat
egie
s
• Ac
tivel
y m
onito
r tre
nds
in fo
rest
con
ditio
ns, i
nclu
ding
dro
ught
str
ess,
inse
cts,
and
inva
sive
spe
cies
Incr
ease
pu
blic
u
nd
erst
and
ing
of
clim
ate
chan
ge
imp
acts
on
fo
rest
an
d p
ark
eco
syst
ems
• Ad
d in
form
atio
n on
clim
ate
chan
ge im
pact
s an
d w
hat t
he c
omm
unity
is d
oing
to a
ddre
ss im
pact
s to
fore
st a
nd p
ark
ecos
yste
ms
in c
omm
unity
new
slet
ters
, web
site
s, an
d tr
ailh
eads
Co
asta
l ec
osy
stem
sR
edu
ce s
ho
relin
e er
osi
on
• Pr
eser
ve e
colo
gica
l buf
fers
to a
llow
for i
nlan
d be
ach
mig
ratio
n
• En
hanc
e sh
orel
ine
prot
ectio
n w
here
retr
eat a
nd a
ccom
mod
atio
n ar
e no
t pos
sibl
e
Red
uce
pro
per
ty d
amag
e fr
om
ero
sio
n, fl
oo
din
g
even
ts, s
ea le
vel r
ise
• Re
duce
dev
elop
men
t in
coas
tal h
azar
d ar
eas
• In
corp
orat
e cl
imat
e ch
ange
impa
cts
into
des
ign
requ
irem
ents
for c
oast
al s
truc
ture
s
• M
ove
or a
band
on s
hore
line
infra
stru
ctur
e
• Re
stor
e w
etla
nds
for r
un-o
ff st
orag
e an
d flo
od c
ontr
ol
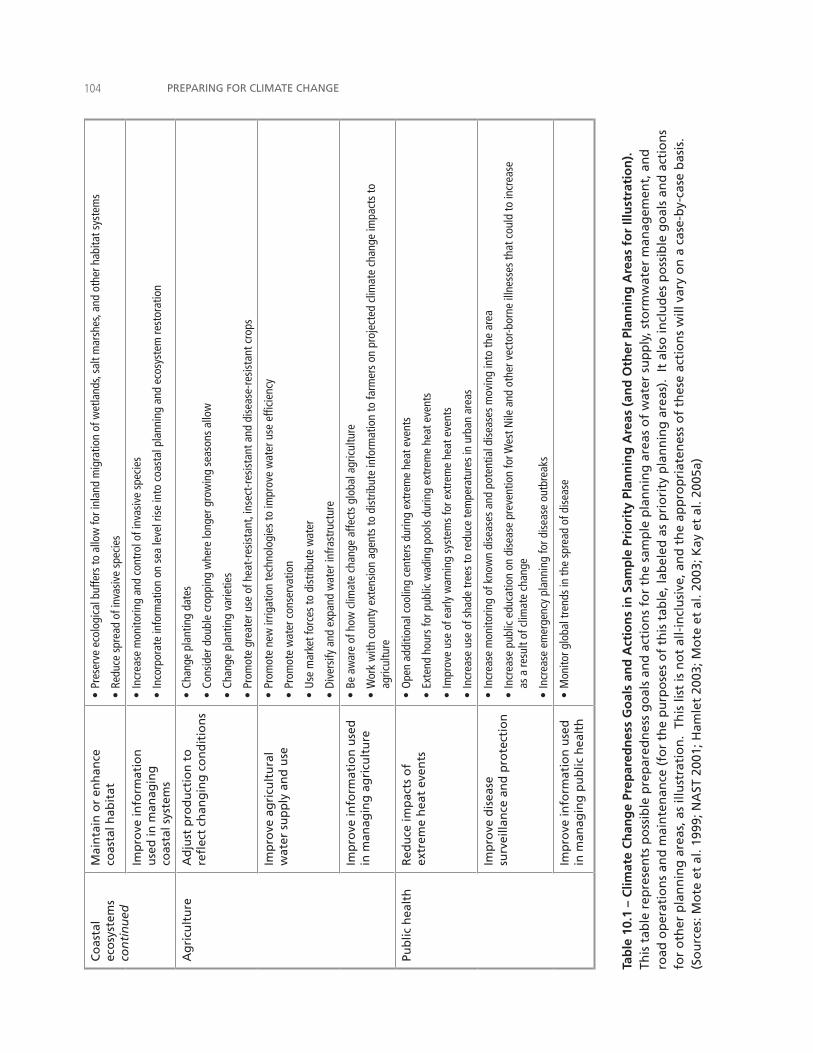
PREPARING FOR CLIMATE CHANGE�0�C
oas
tal
eco
syst
ems
con
tin
ued
Mai
nta
in o
r en
han
ce
coas
tal h
abit
at•
Pres
erve
eco
logi
cal b
uffe
rs to
allo
w fo
r inl
and
mig
ratio
n of
wet
land
s, sa
lt m
arsh
es, a
nd o
ther
hab
itat s
yste
ms
• Re
duce
spr
ead
of in
vasi
ve s
peci
es
Imp
rove
info
rmat
ion
u
sed
in m
anag
ing
co
asta
l sys
tem
s
• In
crea
se m
onito
ring
and
cont
rol o
f inv
asiv
e sp
ecie
s
• In
corp
orat
e in
form
atio
n on
sea
leve
l ris
e in
to c
oast
al p
lann
ing
and
ecos
yste
m re
stor
atio
n
Ag
ricu
ltu
reA
dju
st p
rod
uct
ion
to
re
flec
t ch
ang
ing
co
nd
itio
ns
• Ch
ange
pla
ntin
g da
tes
• Co
nsid
er d
oubl
e cr
oppi
ng w
here
long
er g
row
ing
seas
ons
allo
w
• Ch
ange
pla
ntin
g va
rietie
s
• Pr
omot
e gr
eate
r use
of h
eat-
resi
stan
t, in
sect
-res
ista
nt a
nd d
isea
se-r
esis
tant
cro
ps
Imp
rove
ag
ricu
ltu
ral
wat
er s
up
ply
an
d u
se
• Pr
omot
e ne
w ir
rigat
ion
tech
nolo
gies
to im
prov
e w
ater
use
effi
cien
cy
• Pr
omot
e w
ater
con
serv
atio
n
• U
se m
arke
t for
ces
to d
istr
ibut
e w
ater
• Di
vers
ify a
nd e
xpan
d w
ater
infra
stru
ctur
e
Imp
rove
info
rmat
ion
use
d
in m
anag
ing
ag
ricu
ltu
re
• Be
aw
are
of h
ow c
limat
e ch
ange
affe
cts
glob
al a
gric
ultu
re
• W
ork
with
cou
nty
exte
nsio
n ag
ents
to d
istr
ibut
e in
form
atio
n to
farm
ers
on p
roje
cted
clim
ate
chan
ge im
pact
s to
ag
ricul
ture
Pub
lic h
ealt
hR
edu
ce im
pac
ts o
f ex
trem
e h
eat
even
ts•
Ope
n ad
ditio
nal c
oolin
g ce
nter
s du
ring
extr
eme
heat
eve
nts
• Ex
tend
hou
rs fo
r pub
lic w
adin
g po
ols
durin
g ex
trem
e he
at e
vent
s
• Im
prov
e us
e of
ear
ly w
arni
ng s
yste
ms
for e
xtre
me
heat
eve
nts
• In
crea
se u
se o
f sha
de tr
ees
to re
duce
tem
pera
ture
s in
urb
an a
reas
Imp
rove
dis
ease
su
rvei
llan
ce a
nd
pro
tect
ion
• In
crea
se m
onito
ring
of k
now
n di
seas
es a
nd p
oten
tial d
isea
ses
mov
ing
into
the
area
• In
crea
se p
ublic
edu
catio
n on
dis
ease
pre
vent
ion
for W
est N
ile a
nd o
ther
vec
tor-b
orne
illn
esse
s th
at c
ould
to in
crea
se
as a
resu
lt of
clim
ate
chan
ge
• In
crea
se e
mer
genc
y pl
anni
ng fo
r dis
ease
out
brea
ks
Imp
rove
info
rmat
ion
use
d
in m
anag
ing
pu
blic
hea
lth
• M
onito
r glo
bal t
rend
s in
the
spre
ad o
f dis
ease
Tab
le 1
0.1
– C
limat
e C
han
ge
Prep
ared
nes
s G
oal
s an
d A
ctio
ns
in S
amp
le P
rio
rity
Pla
nn
ing
Are
as (
and
Oth
er P
lan
nin
g A
reas
fo
r Ill
ust
rati
on
).
This
tab
le r
epre
sen
ts p
oss
ible
pre
par
edn
ess
go
als
and
act
ion
s fo
r th
e sa
mp
le p
lan
nin
g a
reas
of
wat
er s
up
ply
, sto
rmw
ater
man
agem
ent,
an
d
road
op
erat
ion
s an
d m
ain
ten
ance
(fo
r th
e p
urp
ose
s o
f th
is t
able
, lab
eled
as
pri
ori
ty p
lan
nin
g a
reas
). I
t al
so in
clu
des
po
ssib
le g
oal
s an
d a
ctio
ns
for
oth
er p
lan
nin
g a
reas
, as
illu
stra
tio
n.
This
list
is n
ot
all-
incl
usi
ve, a
nd
th
e ap
pro
pri
aten
ess
of
thes
e ac
tio
ns
will
var
y o
n a
cas
e-b
y-ca
se b
asis
. (S
ou
rces
: Mo
te e
t al
. 199
9; N
AST
200
1; H
amle
t 20
03; M
ote
et
al. 2
003;
Kay
et
al. 2
005a
)
A GUIDEBOOK FOR LOCAL, REGIONAL, AND STATE GOVERNMENTS �0�
10.4 Select and Prioritize Preparedness Actions As Table 10.1 indicates, there are a number of possible preparedness actions to take for managing climate change impacts. Given a constant reality of competition for financial and human resources, how do you know which actions to choose for your preparedness plan, and in what sequence to implement them?
The general criteria described here can help guide your selection and prioritization of the specific preparedness actions you will use (adapted from Willows and Connell 2003, Adger et al. 2005, Smith 1997). Note that actions will not – and do not need to – meet all of the listed criteria. The more criteria that are met, however, the more likely the action will help reduce your vulnerability to climate change.
As you evaluate the initial list of actions for selection, sort your choices into groups as follows:
Tier 1 actions are those that can and will be implemented in this planning process;
Tier 2 actions are those that could be implemented now or in the future but require additional information, resources, or authorities before implementing. Note that you may want to begin exploring these additional information, resource, and authority needs as part of your current planning effort;
Tier 3 actions are those that are not suitable candidates at this time.
Document why certain preparedness actions were or were not selected for the current planning effort. Reasons for ranking Tier 2 and 3 actions may change over time, making some of the Tier 2 and 3 actions more relevant in the next update of the preparedness plan.
Key Criteria
Will the actions meet your preparedness goals? A key consideration when selecting and prioritizing actions for preparedness planning is whether the action will meet the overall preparedness goals chosen for your planning effort, and in turn your guiding principles for a climate resilient community.
Do the benefits of the action exceed the costs? In general, the benefits gained from an action should exceed the costs of implementing the action. This includes economic as well as non-economic costs and benefits, which can be difficult to quantify. The benefit-cost calculation will be affected by many criteria, including your planning time horizon, the lifespan of the decision, and the frequency of specific climate change impacts (e.g., how often a particular flood threshold may be crossed). Consider using your benefit-cost analysis to help identify the “no regrets,” “low regrets,” or “win-win” scenarios as described in Section 11.2, especially in cases where there is greater uncertainty. Note also that the benefit-cost criteria will also influence specific choices associated with certain actions (e.g., the cost of enlarging your stormwater collection system by 5% versus 15%).
•
•
•
•
•
PREPARING FOR CLIMATE CHANGE�0�
Is the action robust under a range of climate change scenarios? Actions should meet their intended purpose under a range of plausible future climate change scenarios. This is particularly true for decisions with a long life span or long-term implications, such as those related to infrastructure and land use changes, since these types of decisions will be affected by a greater range of climate change impacts than projects lasting only a few years. For example, a setback requirement for coastal development based on an estimate of 12 inches of sea level rise is less robust than a requirement that can accommodate a broader range of sea level rise (e.g., 6 inches to 3 feet).
Actions must also be robust to changes in the frequency or severity of specific climate impacts. Some mechanisms used to reduce climate and weather stresses in planning areas in the past could be less suitable for the long-term change that climate change represents because of a change in the frequency, intensity, duration, or extent of some climate impacts. Temporary pumps, for example, may be appropriate for managing flooding that occurs two or three times a year but would not be appropriate if the frequency increased to 100 times a year. Similarly, beach nourishment is a common response to erosion events that may not be economically feasible over the long term in some locations given the potential for climate change to increase erosion in coastal areas. This is not to say that these short-term preparedness actions do not have a role in preparedness planning. It does mean, however, that additional actions for addressing the “big picture” issue may be needed to reduce the need for short-term, crisis-oriented solutions.
Is the action flexible and does it increase flexibility in how a planning area is managed or functions? Policies, practices, and procedures need to be flexible so they can be adjusted in response to changing conditions (both climate and non-climate). Can the action be easily adjusted as conditions change? Does the action make it easier to modify or reverse decisions once implemented if new information warrants a change?
Can the action be implemented, and in what time frame? Ease of implementation will depend on your time frame and the availability of relevant legal and administrative authorities, staff resources, technical resources, and fiscal resources. Can a preparedness action be implemented within the existing operational framework of your community, or are additional authorities and/or resources required? In the later case, who must grant these additional authorities and resources?
Typically, actions that can be implemented under the current operational framework will be preferred in the near term compared to actions requiring significant resources or state or federal action. This may include preparedness actions such as disease monitoring or water conservation that may already be part of your community’s current operations but will need to be expanded because of climate change. In
•
•
•
A GUIDEBOOK FOR LOCAL, REGIONAL, AND STATE GOVERNMENTS �0�
these cases, you may choose to implement the “low hanging fruit” first while deferring action on other, more ambitious actions.
Note, however, that choosing preparedness actions is not always about choosing the actions that are easy to implement right away. In some cases, the very fact that an action requires more time or resources to complete will require implementing the action in the near-term. A good example is developing the capacity to treat and distribute “gray” (or reused) water. Because it will take time to secure the additional authorities and resources needed to develop this capacity, you may choose to begin working on this action sooner rather than later.
Additional Factors
Are there unique “windows of opportunity” for implementing a particular action? In some cases, the timing of key decisions being made in other planning arenas can influence the selection and implementation order of preparedness actions. For example, your community may already be planning a major upgrade of its water main system, creating a timely opportunity to install reclaimed water lines along with the new water mains. In another example, a rare opportunity to purchase development rights in an area vulnerable to sea level rise may lead to choosing this action in the near term for protecting coastal areas over other actions. Other timely windows of opportunity may include periodic license renewals (e.g., Federal Energy Regulatory Commission dam relicensing procedures) and state legislative sessions.
Is the action equitable? Actions should be equitable, meaning that they should not make impacts worse in other areas or limit the adaptive capacity of other communities, vulnerable populations, or future generations. Projected losses in hydropower generating capacity due to declining snowpack should not be replaced with power produced by coal-burning power plants, which would increase greenhouse gas emissions and accelerate climate change.
Will the action decrease the risk of losing unique environmental or cultural resources? Some preparedness actions may be preferred because of their potential role in protecting unique environmental or cultural resources. For example, these may include important ecosystems, Native American reservation land and burial sites, or historic districts.
Will the action address a risk for which there is greater scientific confidence? The confidence the scientific community assigns to specific climate change projections will vary by climate change variable (e.g., temperature, precipitation, wind direction and speed) and by region. In the U.S. Pacific Northwest, there is greater confidence in the range of projected temperature changes than for changes in precipitation. All things being equal, actions addressing temperature-driven climate change impacts (e.g., changes in streamflow volume and timing in U.S.
•
•
•
•
PREPARING FOR CLIMATE CHANGE�0�
Pacific Northwest rivers) may be ranked higher than actions addressing precipitation-driven impacts given the uncertainties associated with changes in precipitation amount, intensity, and frequency.
Now that you have prioritized your preparedness actions to meet the goals set for your priority planning areas, you are ready to write your preparedness plan. An illustration of how this can come together is King County’s 2007 Climate Plan, which is available online.
Checkpoint: Upon completing this section, you should have a final list of preparedness actions and a plan that will be implemented in your current round of preparedness planning.
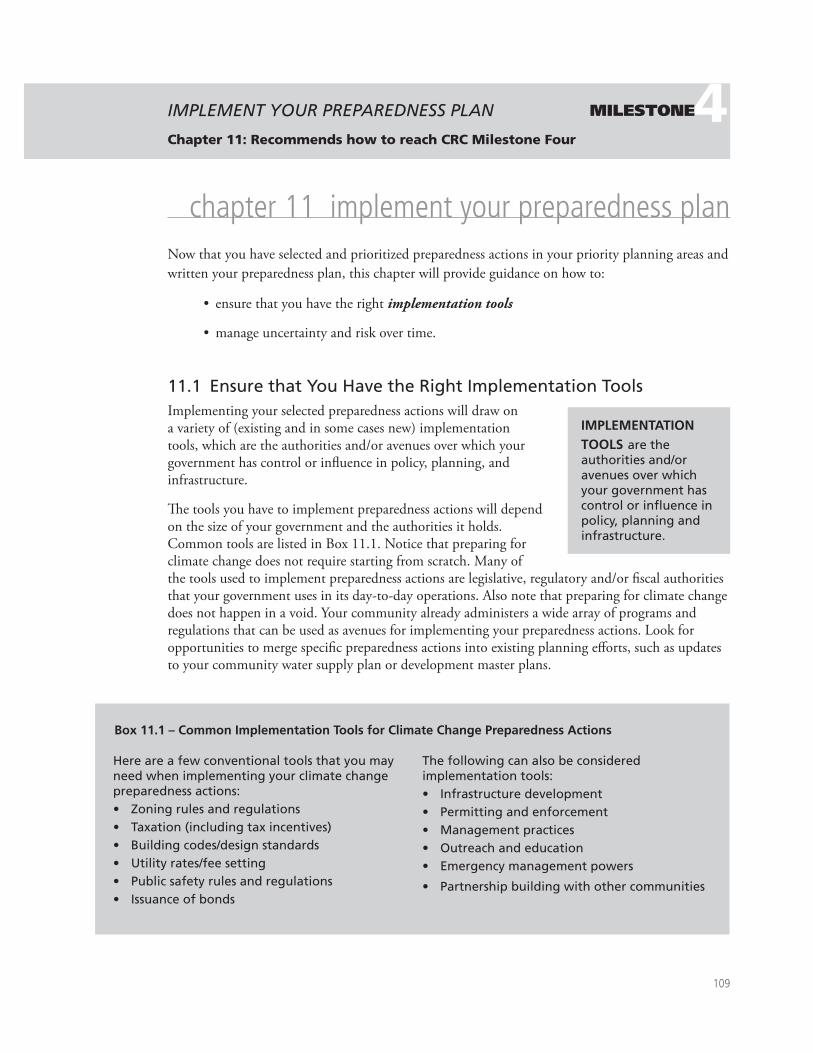
�0�
IMPLEMENT YOUR PREPAREDNESS PLAN
Chapter 11: Recommends how to reach CRC Milestone Four
4MILESTONE
chapter �� �mplement your preparedness planNow that you have selected and prioritized preparedness actions in your priority planning areas and written your preparedness plan, this chapter will provide guidance on how to:
ensure that you have the right implementation tools
manage uncertainty and risk over time.
11.1 Ensure that You Have the Right Implementation ToolsImplementing your selected preparedness actions will draw on a variety of (existing and in some cases new) implementation tools, which are the authorities and/or avenues over which your government has control or influence in policy, planning, and infrastructure.
The tools you have to implement preparedness actions will depend on the size of your government and the authorities it holds. Common tools are listed in Box 11.1. Notice that preparing for climate change does not require starting from scratch. Many of the tools used to implement preparedness actions are legislative, regulatory and/or fiscal authorities that your government uses in its day-to-day operations. Also note that preparing for climate change does not happen in a void. Your community already administers a wide array of programs and regulations that can be used as avenues for implementing your preparedness actions. Look for opportunities to merge specific preparedness actions into existing planning efforts, such as updates to your community water supply plan or development master plans.
•
•
IMPLEMENTATION TOOLS are the authorities and/or avenues over which your government has control or influence in policy, planning and infrastructure.
Box 11.1 – Common Implementation Tools for Climate Change Preparedness Actions
Here are a few conventional tools that you may need when implementing your climate change preparedness actions:
Zoning rules and regulations Taxation (including tax incentives)Building codes/design standardsUtility rates/fee settingPublic safety rules and regulationsIssuance of bonds
••••••
The following can also be considered implementation tools:
Infrastructure developmentPermitting and enforcement Management practicesOutreach and educationEmergency management powers
Partnership building with other communities
•••••
•
PREPARING FOR CLIMATE CHANGE��0
As you begin to look at how you might use specific tools to implement your preparedness actions, consider how the tools are currently being used and whether the tools can be used “as is” or with slight modification for climate change preparedness. For example, you may find that local permitting procedures do not include flexibility needed to adjust to changing conditions. One option for addressing this problem is modifying general permitting procedures to include re-opener clauses that require a permit to be re-examined under certain circumstances. You may have identified this need already in your strategy selection process, or it may become evident as you start getting into the “nuts and bolts” of implementation. In either case, continue working on ways to increase flexibility whenever you run into the institutional barriers that can limit the success of your preparedness planning effort.
Like other aspect of preparedness planning, implementing the preparedness plan is not a one-time event. Many actions will need to be implemented in phases; some may take years or decades to implement. You will need to reevaluate all of your actions and your plan periodically to gauge their effectiveness as the community changes and new information on climate change impacts emerges.
Finally, securing continued support over time will be a critical element of implementation. Continue building and maintaining support for your community’s planning efforts through education and outreach activities (many of which may now be folded into specific preparedness actions).
11.2 Manage Uncertainty and RiskPreparing for climate change is a challenge in part because of the uncertainties that exist around local impacts. Ideally, you would choose preparedness actions knowing exactly how, when, and where climate change will affect your community. As you know from having to manage other challenges facing your community (e.g., population growth, rising health insurance costs, natural disasters), this level of certainty is not possible. Consequently, when it comes to planning for climate change, you must do as you always do – make decisions in the face of uncertainty.
Risk is another component of climate change preparedness planning that must be managed. All decisions from the personal to the community level involve some informal assessment of risk. When should a homeowner, for example, purchase earthquake insurance for a home? When should a community concerned about bioterrorism purchase smallpox vaccines? The outcome of these decisions will be shaped by personal experience, thresholds for tolerating risk, and new information about risks and probabilities, all of which can change over time and space.
So how can governments manage uncertainty and risk, given that they will always be factors in preparing for climate change? One approach is to implement “no regrets,” “low regrets,” or “win-win” actions2. A “no regrets” action provides benefits in current and future climate conditions even if no climate change occurs. A water conservation program, for example, provides benefits today by potentially reducing the need for water restrictions during drought and delaying the need to develop new water supplies as population grows, potentially saving the utility and its rate payers millions of dollars in expansion costs. These benefits will accrue regardless of how climate changes in the 21st century but would be even greater with climate change given the potential for climate change to increase the frequency and intensity of drought in many regions of the country.
2 See Willows and Connell 2003, Luers and Moser, de Loë et al. 2001
A GUIDEBOOK FOR LOCAL, REGIONAL, AND STATE GOVERNMENTS ���
“Low regrets” preparedness actions provide important benefits at relatively little additional cost or risk. For example, a utility planning stormwater system upgrades may expand the capacity of its stormwater collection system by 10 percent, for example, in anticipation of more extreme precipitation events if the benefits of the added capacity exceed the marginal cost increase. Similarly, a community concerned about the impacts of sea level rise may increase setback requirements for coastal development by an additional 200 feet as part of a Master Plan development provided the benefits of the additional setback exceed the marginal cost.
“Win-win” actions reduce the impacts of climate change while providing other environmental, social, or economic benefits. For example, preserving riparian wetlands not only provides critical habitat for climate-sensitive species but also provides water quality and flood protection benefits now and under plausible climate change scenarios.
Another approach is quantitative modeling. Modeling integrates different climate change scenarios with our current understanding of how systems respond to changes in temperature and precipitation or other climate-related variables to put boundaries on a range of future conditions. Modeling can also help identify which uncertainties are significant and how specific preparedness actions may help manage those uncertainties.
Recent advances in downscaling techniques have improved the overall accuracy of smaller-scale climate change impacts assessments used to guide local policies and infrastructure choices. The City of Seattle, for example, sponsored research examining the impacts of climate change on the city’s water supply (Wiley 2004). The study found that snowpack in the watersheds contributing to Seattle’s water supply could decline by as much as 50 percent by 2040, reducing the system’s current gross yield by 14 percent. The study also found that while uncertainty was present at each level of the analysis, the uncertainties were no greater than those found in traditional water supply studies that rely on evaluation of historic records and were not “necessarily significant enough to mask the underlying trends or scale of impacts” (ibid, p. 149).
While modeling can be an effective tool for quantifying future impacts, modeling is not required for climate change preparedness nor will it eliminate all of the uncertainties in planning for climate change. Modeling should be viewed as one tool of many that your government can utilize for preparedness.

PREPARING FOR CLIMATE CHANGE���
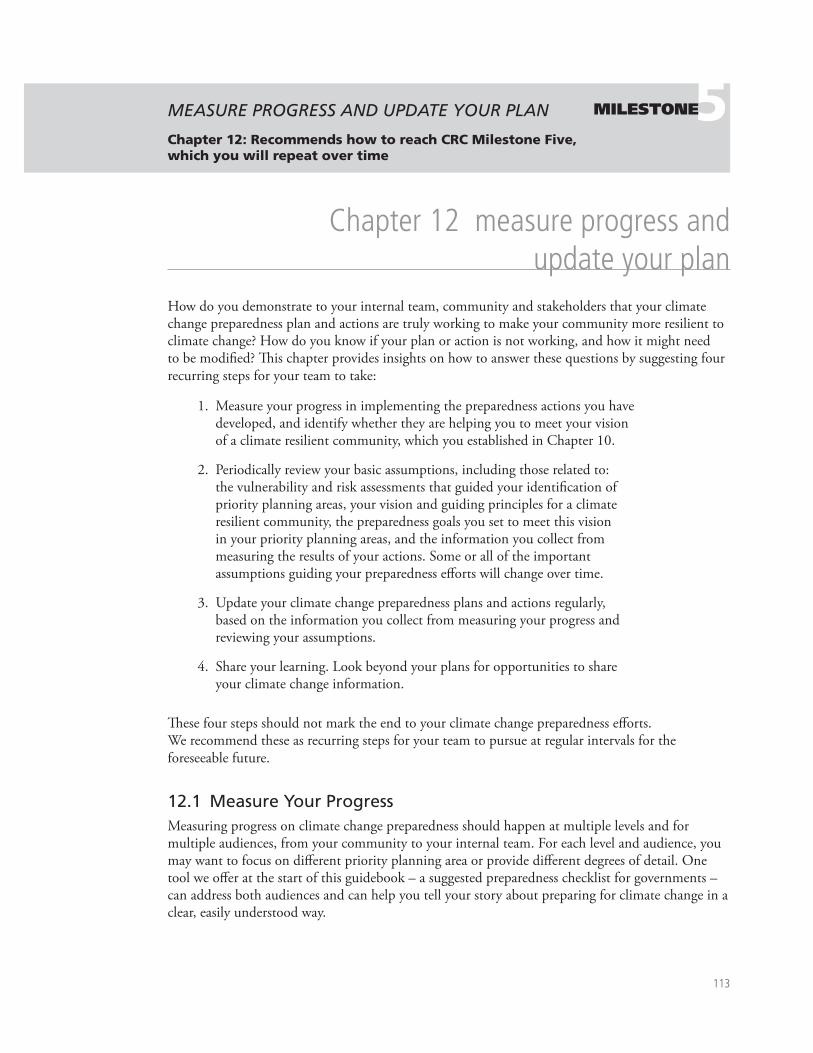
���
MEASURE PROGRESS AND UPDATE YOUR PLAN
Chapter 12: Recommends how to reach CRC Milestone Five, which you will repeat over time
5MILESTONE
Chapter �� measure progress and update your plan
How do you demonstrate to your internal team, community and stakeholders that your climate change preparedness plan and actions are truly working to make your community more resilient to climate change? How do you know if your plan or action is not working, and how it might need to be modified? This chapter provides insights on how to answer these questions by suggesting four recurring steps for your team to take:
Measure your progress in implementing the preparedness actions you have developed, and identify whether they are helping you to meet your vision of a climate resilient community, which you established in Chapter 10.
Periodically review your basic assumptions, including those related to: the vulnerability and risk assessments that guided your identification of priority planning areas, your vision and guiding principles for a climate resilient community, the preparedness goals you set to meet this vision in your priority planning areas, and the information you collect from measuring the results of your actions. Some or all of the important assumptions guiding your preparedness efforts will change over time.
Update your climate change preparedness plans and actions regularly, based on the information you collect from measuring your progress and reviewing your assumptions.
Share your learning. Look beyond your plans for opportunities to share your climate change information.
These four steps should not mark the end to your climate change preparedness efforts. We recommend these as recurring steps for your team to pursue at regular intervals for the foreseeable future.
12.1 Measure Your ProgressMeasuring progress on climate change preparedness should happen at multiple levels and for multiple audiences, from your community to your internal team. For each level and audience, you may want to focus on different priority planning area or provide different degrees of detail. One tool we offer at the start of this guidebook – a suggested preparedness checklist for governments – can address both audiences and can help you tell your story about preparing for climate change in a clear, easily understood way.
1.
2.
3.
4.
PREPARING FOR CLIMATE CHANGE���
The checklist presented at the beginning of the guidebook outlines a number of steps, based on the material of this guidebook, which can help you to mark your progress in preparing for climate change. The Five Milestones of the ICLEI – Local Governments for Sustainability Climate Resilient Communities Program are also reflected in this checklist. Whether for your community and other stakeholders, for your internal team, or for recognition in the Climate Resilient Communities Program, completing the checklist will provide you with useful information about progress in your preparedness workplan.
Developing Measures of Resilience
Remember that a climate resilient community as defined in Chapter 10 is one that takes proactive preparedness actions which effectively reduce the vulnerabilities and risks associated with climate change impacts. Suggested guiding principles for achieving this vision of a climate resilient community were provided in Chapter 10; they informed your development of preparedness goals
You may already have access to information that indicates how well you are meeting your goals and in turn your vision of climate resilience, based on relevant data being collected now by your government. However, you may also want to develop new measures of resilience to incorporate into your performance measurement system, your budget process, or another community indicator report.
To develop measures of resilience, first consider the guiding principles you used to set your preparedness goals. Reframe these guiding principles in the form of questions to ask yourself whether your preparedness actions are meeting the vision that they set. As an illustration, here are five sample guiding questions based on the guiding principles previously proposed:
1. Has awareness about climate change and its projected impacts on your priority planning areas increased? Is there support among your government, your community and your stakeholders to prepare for climate change impacts? (Guiding Principle #1: Increase public awareness of climate change and its projected impacts on your community.)
Potential ways to measure public awareness about climate change impacts:
community surveys tracking participation in public meetings on climate change impacts;
surveys tracking “hits” to community-sponsored climate change webpages;
surveys tracking requests for climate change-related publications (e.g., fact sheets, brochures, reports);
surveys evaluating trends in the number and types of questions or comments received by government agencies about climate change in your priority planning areas;
•
•
•
•
A MEASURE OF RESILIENCE is a quantitative or qualitative judgment that you develop and track over time to determine how well a preparedness action meets the preparedness goals you have set in a given priority planning area.
A GUIDEBOOK FOR LOCAL, REGIONAL, AND STATE GOVERNMENTS ���
surveys of the number of media stories about climate change impacts in your region;
qualitatively, whether public officials understand 1) how climate change impacts relate to major decisions in your priority planning areas and 2) how those decisions could reduce or increase climate change vulnerabilities or risks.
2. Have you increased technical capacity in your government and community to prepare for climate change impacts in your priority planning areas? Is this technical capacity being used effectively to evaluate vulnerability and risk in your priority planning areas? (Guiding Principle #2: Increase your technical capacity to prepare for climate change impacts.)
Potential ways to measure technical capacity to prepare for climate change impacts in your priority planning areas:
number of technical experts you have on staff who can advise you on the latest research about climate change impacts in your priority planning areas, and/or the existence of an ongoing relationship with outside climate science advisors;
the existence and regular use of ongoing forums for sharing the latest information on climate change in your priority planning areas with internal and external stakeholders, including government employees, the business community, and the general public.
3. Is climate information being considered in decisions in your priority planning areas? Is there a formal mechanism in place that “mainstreams” or otherwise facilitates climate change preparedness in your priority planning areas? (Guiding Principle #3: “Mainstream” information about climate change vulnerabilities, risks, and preparedness into planning, policy, and investment.)
Potential ways to measure the “mainstreaming” of climate change information and preparedness in your priority planning areas (adapted from Ligeti et al. 2007):
the number of plans or other governing documents in your priority planning areas in which climate change is addressed qualitatively or quantitatively;
existence and thoroughness of guidelines on how to integrate new or updated information on climate change vulnerability, risk and preparedness into decision making;
existence and number of dedicated staff to help facilitate preparedness actions across departments and external stakeholders (or the amount
•
•
•
•
•
•
•
PREPARING FOR CLIMATE CHANGE���
of additional staff time used for implementation of climate change preparedness actions);
existence and amount of funds for vulnerability and risk assessments, preparedness actions, and measurement of resilience;
existence of forums which have been established for information sharing about vulnerabilities, risks and preparedness; information about who attends these forums, what information is shared and used, and how information is shared and used.
4. Are your actions increasing or maintaining the adaptive capacity of built, natural, and human systems in your priority planning areas? (Guiding Principle #4: Increase the adaptive capacity of built, natural, and human systems in your community.)
Potential ways to measure the adaptive capacity of built, natural, and human systems in your priority planning areas:
survey or accepted media coverage of how well your community handles an extreme heat event, a drought, or 100-year rain event before and after certain preparedness actions have been implemented (with the understanding that each event is unique, such that a direct comparison is not always possible);
amount of money you have saved (or not) based on an implemented preparedness action, such as an improved flood hazard management plan, improved regional levee system, or other infrastructure investments made to improve adaptive capacity;
indication of the health of regional fish and wildlife, based on observations by leading ecologists and/or monitoring.
5. Are community partnerships in place to enable the most robust decision-making possible for climate change preparedness in priority planning areas? Have you engaged community stakeholders in development and implementation of your preparedness actions in your priority planning areas? (Guiding Principle #5: Strengthen community partnerships that reduce vulnerability and risk to climate change impacts.)
Potential ways to measure community partnership and stakeholder engagement in decreasing vulnerability and risk in your priority planning areas:
the existence and regular use of ongoing forums for sharing the latest information on climate change with internal and external stakeholders, including government employees, the business community, and the general public (also noted above as a measure of technical capacity);
•
•
•
•
•
•
A GUIDEBOOK FOR LOCAL, REGIONAL, AND STATE GOVERNMENTS ���
the existence of “consensus” reports on vulnerabilities and risks in your priority planning areas, developed collaboratively by a full range of stakeholders;
the existence of a community task force or citizens’ advisory panel on climate change preparedness in your priority planning areas, representing a range of different community perspectives and other specific interests.
Ideally, your government will be able to develop a measure or measures that respond to each of these questions. If your government has been working on climate change preparedness for a few years, or if your government already collects information in priority planning areas related to some of these considerations, you may already be able to measure your resilience and track your improvements over time. On the other hand, if you face resource constraints that prevent you from developing measures now, you can also use these guiding questions informally, simply by answering “yes” or “no.”
How often you measure your progress in climate change preparedness will depend on: the nature of the vulnerabilities and risks that you are addressing in your priority planning areas; the planning horizon, investment rules and/or other factors related to a given capital project or system in your priority planning area; and your government’s budget cycle. Please refer to accepted public sector resources for details on how to develop a robust performance measurement system for a public policy environment.
12.2 Review Your AssumptionsRemember that climate change preparedness is an ongoing process. As natural, social, economic and political conditions change, your original assumptions may also need to change. In conjunction with your measurement, you can use the following questions to review the basic assumptions guiding your work:
Have new peer-reviewed scientific findings improved or changed your understanding of your community’s vulnerabilities? Science is based on almost-constant inquiry, discovery, and findings. You will probably receive new (and sometimes seemingly conflicting) scientific reports. Work with your science advisors to determine whether new findings are truly relevant to your work – and whether they should influence you to change your course. New reports should be held to the same high standards of your initial scoping stage and vulnerability assessment (Chapters 4 and 8). Reports that conflict with your initial scoping results or vulnerability assessment should not necessarily lead you to change your course, unless you have strong scientific advice or evidence to do so.
Have your priority planning areas changed? A change in public officials or development of new stakeholder relationships can quickly change your priorities and related funding for climate change preparedness. You may also receive new information, based on new scientific findings, that leads you to change the focus of your preparedness effort. For instance, you may have initially identified
•
•
•
•
PREPARING FOR CLIMATE CHANGE���
preparedness goals for several priority planning areas only to find that another planning area that you had not addressed at all (e.g., coastal erosion control, flood hazard management, or extreme heat response planning) has become an even more urgent concern to address. In this case, you will want to reprioritize your planning areas and set new preparedness goals at the next appropriate window of opportunity.
Are your vision and guiding principles still relevant to the results your team wants to achieve? Ideally, your team will have established a vision and guiding principles that are flexible to different conditions, so that you do not have to change them drastically over time. However, with new information and some experience in implementing your preparedness actions, you may want to broaden or narrow the language of your vision and guiding principles to make them most relevant to your current efforts.
Have you collected significant new information about the success (or failure) of your preparedness action in building climate change resilience? After tracking and measuring your progress over a significant amount of time, you may find that the preparedness action you have implemented is not actually improving the resilience of sea walls, ecosystems, or vulnerable communities in your region and may even be making a problem such as coastal erosion, species decline, or heat stress worse. Alternatively, you may find that your action is so successful and critical that you need funding to do more of the same. The information collected in your measurement step, if used to review the course you have charted, can thus become critically useful for updates to your priority statements, public reports, budget requests, and investment decisions.
While this list does not include all of the questions you may want to ask as you proceed in your climate change preparedness efforts, it can begin to help you ensure that your assumptions, your work, and your measures of resilience remain appropriate to current natural, economic, social and political conditions in your region.
12.3 Update Your PlansOnce you have collected new information useful for reviewing and modifying your basic assumptions, you are ready to update your climate change preparedness actions and plan. At this point, you should also remain aware of the opportunities that plan updates offer to share your information and influence climate change preparedness planning beyond your team. Consider the following when you update your preparedness actions and plans:
Incorporate the most urgent and/or specific information in budget proposals and other short-term decisions. Sometimes, new information about the risks of climate change to your region will demand more urgent and detailed action than a broadly written plan updated on a four- or five-year cycle can provide. For example, as King County has found with flooding, you may recognize that a
•
•
•
A GUIDEBOOK FOR LOCAL, REGIONAL, AND STATE GOVERNMENTS ���
natural hazard in your region is becoming more frequent and more intense, with immediate damage and costs in terms of public health, safety and property. This kind of new information will demand quicker decisions, on a shorter time scale and with more detail than most comprehensive plans can offer. In these cases, annual or even quarterly budget negotiations or other short-term decision arenas may therefore become your most appropriate windows of opportunity to raise specific climate change issues that you are facing. (King County has responded to its recent flooding events and new information about expected future flooding by proposing an improved flood hazard management plan, as well as a new countywide flood control zoning district, with taxing authority to cover the costs of regional levee improvements.)
Incorporate new climate change information into your regular planning updates. Comprehensive land use plans, shoreline management plans, and other planning documents tend to be updated once every four or five years. If the climate change impact that you intend to address does not pose an obviously urgent concern to your community, and can be effectively addressed in broad language, these planning update years can be useful windows of opportunity to address climate change. King County has employed this approach in both the 2004 Comprehensive Plan update (incorporating climate change emissions reduction goals) and the upcoming 2008 Comprehensive Plan update (now on track to include goals related to climate change preparedness).
12.4 Share Your Learning As you improve upon your preparedness actions, share the results of your plan. Transparency and accountability in your climate change preparedness effort can help the public and your team see that your actions achieve desired results. In some cases, such a proposed tax package that requires broad public support, it could be incredibly useful for your team and government to share detailed findings about your progress with your broader community.
Sharing your results publicly will also help improve your community partnerships. Outside partner institutions can benefit from information about how well your actions are working, especially if you are measuring the results of collective work in a priority planning area such as efforts to protect an endangered species, ecosystem, or shared water or forest resource. Additionally, when you can tell the story of your successes and lessons learned (backed up by sound quantitative and qualitative data) with city, state, regional, and federal governments, you are providing evidence that your actions deserve funding and political support from other levels of government.
Above all, learn through open and honest inquiry. If you do not have a culture of open inquiry, you may find it difficult to ask direct, tough questions about the success of your preparedness actions. However, it will become increasingly important to know what is actually unfolding, and how well you are responding. Have your actions delivered the benefits you expected? How can they be changed based on what you have learned? Have your priority planning areas changed? Do you need to assess climate change impacts on new planning areas or add new members to your preparedness team?
•

PREPARING FOR CLIMATE CHANGE��0
You must teach yourself and your team about what it will take to make your communities more resilient to climate change. You are the expert(s) about what public policies, organizational approaches and infrastructure investments work for your communities. You must make educated decisions now about what your next five, ten, fifteen and more years will bring, and set up a process of learning for the future that will help you and your successors to modify your preparedness actions and plans as you begin to see their effectiveness.
���
chapter �� tak�ng the long v�ew: final thoughts on prepar�ng for cl�mate change
What are the basic actions that you can take as a public decision-maker today to ensure a positive lasting influence on your government and community, so that future generations do not bear the worst effects of climate change? In summary, here are a few final thoughts on how to prepare for climate change effectively:
In order to prepare your community for climate change impacts, focus on reducing your vulnerabilities and risks.
In order to reduce your vulnerabilities, you must either reduce the sensitivity of systems in your priority planning areas, or build your adaptive capacity (e.g., by constructing a new or improved sea wall). In order to reduce your risk, you can seek either to lower the probability of an impact occurring or to reduce its consequences, by avoiding high-risk choices (e.g., preventing new development in a floodplain).
Have foresight – establish institutions to deal with climate change impacts on an ongoing basis.
Even if you build a team of talented individuals who can motivate and guide others across your government and community to take action on climate change, you will still need to leave strong systems in place that last well beyond your term. Ask your team, your government and your community to have foresight. Incorporate climate change considerations into long-range planning documents, “mainstream” climate change preparedness into infrastructure investments and basic budget decisions, and try to establish a culture of climate change preparedness.
Remain flexible and expect surprises.
As a public decision-maker, you probably already know how to plan under conditions of uncertainty very skillfully. In the future, climate change preparedness will demand that you make even more decisions with incomplete and evolving information. Continue to seek the best new information about climate change in your region; you may find answers to some questions that you have about climate change impacts to your community, but you may also find that some major scientific uncertainties remain. Try to build your preparedness process to be flexible to a range of climate change scenarios. Expect surprises.
It is my job as an elected leader to put in place the infrastructure so
people in the future don’t feel the impacts of climate change. Things will change, but we must do the work so people are not living in an age of crisis, that they have a
good quality of life. We do things now to adapt to help preserve the
quality of life without people really knowing it. It is my job to prepare.
– King County Executive Ron Sims

PREPARING FOR CLIMATE CHANGE���
Take action.
We are all forced to prepare for climate change effects now because we have not reduced our contribution to the problem of climate change – global greenhouse gas emissions. Work with other governments to reduce your greenhouse gas emissions now, so that the chain of climate change cause and effect will be broken. At the same time, prepare for the climate change impacts you know are already underway. Seize the moment – to slow climate change and protect quality of life for future generations.
123
chapter 14 sources
Abbasi, D.R. 2006. Americans and climate change: Closing the gap between science and action. In A Synthesis of Insights and Recommendations from the 2005 Yale F&ES Conference on Climate Change. New Haven, Connecticut: Yale University Press.
(ACIA) Arctic Climate Impact Assessment. 2004. Impacts of a Warming Arctic: Arctic Climate Impact Assessment, Overview Report. Cambridge University Press. Available for download at http://www.amap.no/acia/
Adger, W.N., N.W. Arnell, E.L. Tompkins. 2005. Successful adaptation to climate change across scales. Global Environmental Change 15: 77-86.
Alexander, L. V., et al.. 2006. Global observed changes in daily climate extremes of temperature and precipitation. Journal of Geophysical Research 111, D05109, doi:10.1029/2005JD006290.
Andersen, P. 2005. Former EPA chief urges action on global warming. Associated Press 28 October 2005.
Andreadis, K.M. and D.L. Lettenmaier. 2006. Geophysical Research Letters 33, L10403, doi:10.1029/2006GL025711, 2006.
Arendt, A.A., K.A. Echelmeyer, W.D. Harrison, C.S. Lingle, and V.B. Valentine. 2002. Rapid wastage of Alaska glaciers and their contribution to rising sea level. Science 297: 382-386.
Burkett, V.R., Zilkoski, D.B., and Hart, D.A.. 2003. Sea-level rise and subsidence: implications for flooding in New Orleans, Louisiana, in Prince, K.R., and Galloway, D.L., eds., U.S. Geological Survey Subsidence Interest Group Conference, Proceeding of the Technical Meeting, Galveston, Texas, November 27-29, 2001, p. 63-70. Available for download at http://www.nwrc.usgs.gov/hurricane/Sea-Level-Rise.pdf
Carter, L.M. 2003a. U.S. National Assessment of the Potential Consequences of Climate Variability and Change – Educational Resources Regional Paper: The Northeast. U.S. Climate Change Research Program, Washington, D.C. Available only in HTML format at http://www.usgcrp.gov/usgcrp/nacc/education/northeast/default.htm
Carter, L.M. 2003b. U.S. National Assessment of the Potential Consequences of Climate Variability and Change – Educational Resources Regional Paper: The Southeast. U.S. Climate Change Research Program, Washington, D.C. Available only in HTML format at http://www.usgcrp.gov/usgcrp/nacc/education/southeast/default.htm
Carter, L.M. 2003c. U.S. National Assessment of the Potential Consequences of Climate Variability and Change – Educational Resources Regional Paper: Great Plains. U.S. Climate Change Research Program, Washington, D.C. Available only in HTML format at http://www.usgcrp.gov/usgcrp/nacc/education/greatplains/default.htm
Cayan, D., S.A. Kammerdiener, M.D. Dettinger, J.M. Caprio, and D.H. Peterson. 2001. Changes in the onset of Spring in the western United States. Bulletin of the American Meteorological Society 82(3): 399-415.
(CCSR) Center for Climate Systems Research, Climate Impacts Group. 2007. New York City Department of Environmental Protection Climate Change Task Force. Web page available at http://www.ccsr.columbia.edu/cig/taskforce/ (accessed 7.27.07)
PREPARING FOR CLIMATE CHANGE124
Center for Democracy and Technology. 2007. Open CRS: Congressional Research Reports for the People, Frequency Asked Questions. Web page available at http://www.opencrs.com/faq.php (accessed 5.6.07).
de Loë, R.C., R.D. Kreutzwiser, and L. Moraru. 2001. Adaptation options for the near term: climate change and the Canadian water sector. Global Environmental Change 11(3): 231-245.
DeGaetano, A.T. and R.J. Allen. 2002. Trends in twentieth-century temperature extremes across the United States. Journal of Climate 15: 3188-3205.
Doughton, S. 2005. The truth about global warming. Seattle Times 9 October 2005.
Easterling, D.R., G.A. Meehl, C. Parmesan, S.A. Changnon, T.R. Karl, and L.O. Mearns. 2000. Climate extremes: Observations, modeling, and impacts. Science 289:2068-2074.
Feng, S. and Q. Hu. 2004. Changes in agro-meteorological indicators in the contiguous United States: 1951-2000. Theoretical and Applied Climatology 78:247-264.
Hall, M.H.P. and D.B. Fagre. 2003. Modeled climate-induced glacier change in Glacier National Park, 1850–2100. BioScience 53(2): 131-140.
Hamlet, A. F. 2003. The role of transboundary agreements in the Columbia River Basin: An integrated assessment in the context of historic development, climate, and evolving water policy. pp. 263-289. In H. Diaz and B. Morehouse (eds), Climate, Water, and Transboundary Challenges in the Americas. Dordrecht/Boston/London: Kluwer Press.
Hamlet, A.F. 2006. Hydrologic implications of 20th century warming and climate variability in the western U.S. Ph.D. dissertation, University of Washington, Seattle.
Hansen, J., L. Nazarenko, R. Ruedy, Mki. Sato, J. Willis, A. Del Genio, D. Koch, A. Lacis, K. Lo, S. Menon, T. Novakov, Ju. Perlwitz, G. Russell, G.A. Schmidt, and N. Tausnev. 2005. Earth’s energy imbalance: Confirmation and implications. Science 308(5727): 1431-1435, doi:10.1126/science.1110252.
(IPCC) Intergovernmental Panel on Climate Change. 2001a. Climate Change 2001: The Scientific Basis, Contribution of Working Group I to the Third Assessment Report of the Intergovernmental Panel on Climate Change (IPCC),[ J. T. Houghton, Y. Ding, D.J. Griggs, M. Noguer, P. J. van der Linden and D. Xiaosu (Eds.)], Cambridge University Press, Cambridge, England. Available for download at http://www.grida.no/climate/ipcc_tar/.
(IPCC) Intergovernmental Panel on Climate Change. 2001b. Climate Change 2001: Impacts, Adaptation, and Vulnerability, Contribution of Working Group II to the Third Assessment Report of the Intergovernmental Panel on Climate Change (IPCC), [J. J. McCarthy, O.F. Canziani, N.A. Leary, D.J. Dokken, and Kasey S. White (Eds.)], Cambridge University Press, Cambridge. Available for download at http://www.grida.no/climate/ipcc_tar/.
(IPCC) Intergovernmental Panel on Climate Change. 2004. “The Preparation of the IPCC Reports”, Geneva, Switzerland. Fact sheet prepared December 2004. Available for download at http://www.ipcc.ch/about/faq/IPCC%20Procedures.pdf (accessed 5/6/07)
A GUIDEBOOK FOR LOCAL, REGIONAL, AND STATE GOVERNMENTS 125
(IPCC) Intergovernmental Panel on Climate Change. 2007a. Climate Change 2007: The Physical Basis: Summary for Policy Makers, Contribution of Working Group 1 to the Fourth Assessment Report of the Intergovernmental Panel on Climate Change. Cambridge University Press, Cambridge, United Kingdom, and New York, NY. Available for download at http://www.ipcc.ch/WG1_SPM_17Apr07.pdf.
(IPCC) Intergovernmental Panel on Climate Change. 2007b. Climate Change 2007: The Physical Basis, Contribution of Working Group 1 to the Fourth Assessment Report of the Intergovernmental Panel on Climate Change. Cambridge University Press, Cambridge, United Kingdom, and New York, NY. Available for download at: http://ipcc-wg1.ucar.edu/wg1/wg1-report.html
Jones, G.V., M.A. White, O.R. Cooper, and K. Storchmann. 2005. Climate change and global wine quality. Climatic Change 73: 319-343.
Kay, J.E., J.H. Casola, A.K. Snover, and Climate Impacts Group. 2005a. “King County Sector Breakout Fact Sheets”. Fact sheets prepared for King County (Washington)’s October 27, 2005 climate change conference “The Future Ain’t What It Used to Be: Preparing for Climate Disruption”. Climate Impacts Group, Center for Science in the Earth System, Joint Institute for the Study of the Atmosphere and Ocean, University of Washington, Seattle. Available for download at: http://www.cses.washington.edu/db/pdf/kc05sectorssumall475.pdf
Kay, J.E., J.H. Casola, and A.K. Snover. 2005b. “Climate Impacts Science Primer”. Fact sheet prepared for King County (Washington)’s October 27, 2005 climate change conference “The Future Ain’t What It Used to Be: Preparing for Climate Disruption”. Climate Impacts Group, Center for Science in the Earth System, Joint Institute for the Study of the Atmosphere and Ocean, University of Washington, Seattle. Available for download at: http://www.cses.washington.edu/db/pdf/kc05regccscience466.pdf
Kunkel, K.E., D.R. Easterling, K. Hubbard, and K. Redmond. 2004. Temporal variations in frost-free season in the United States: 1895-2000. Geophysical Research Letters 31, L03201, doi:10.1029/2003GL018624, 2004.
Levitus, S., J. Antonov, and T. Boyer. 2005. Warming of the world ocean, 1955–2003. Geophysical Research Letters 32, L02604, doi:10.1029/2004GL021592.
Ligeti, E., J. Penney, and I. Wieditz. 2007. Cities Preparing for Climate Change: A Study of Six Urban Regions. Clean Air Partnership, Toronto, Canada.
Logan, J. A., and J. A. Powell. 2005. Ecological consequences of climate change altered forest insect disturbance regimes. In F. H. Wagner (ed.), Climate Change in Western North America: Evidence and Environmental Effects. Allen Press (In review).
London Climate Change Partnership. 2006. Adapting to Climate Change: Lessons for London. Greater London Authority, London, England. Available for download at http://www.london.gov.uk/climatechangepartnership/
Lu, Q., R. Lund, and L. Seymour. 2005. An update of U.S. temperature trends. Journal of Climate 18(22): 4906-4914.
Meehl, G.A., W.M. Washington, W.D. Collins, J.M. Arblaster, A. Hu, L.E. Buja, W.G. Strand, H. Teng. 2005. How much more global warming and sea level rise?, Science 207(5716): 1769-1772, DOI: 10.1126/science.1106663
PREPARING FOR CLIMATE CHANGE126
Molnia, B. F. 2001. Assessing the response of Alaska’s glaciers to Post-Little Ice Age climate change. American Geophysical Union, Fall Meeting 2001, abstract #IP41A-03.
Mote, P.W. 2005. Declining mountain snowpack in western North America. Bulletin of the American Meteorological Society 86: 39-49.
Mote, P. W. 2006. Climate-driven variability and trends in mountain snowpack in western North America. Journal of Climate 19(23): 6209-6220.
Mote, P. W., D. J. Canning, D. L. Fluharty, R. C. Francis, J. F. Franklin, A. F. Hamlet, M. Hershman, M. Holmberg, K. N. Ideker, W. S. Keeton, D. P. Lettenmaier, L. R. Leung, N. J. Mantua, E. L. Miles, B. Noble, H. Parandvash, D. W. Peterson, A. K. Snover, and S. R. Willard. 1999. Impacts of Climate Variability and Change, Pacific Northwest. National Atmospheric and Oceanic Administration, Office of Global Programs, and JISAO/SMA Climate Impacts Group, Seattle, WA. 110 pp.
Mote, P. W., E. A. Parson, A. F. Hamlet, K. N. Ideker, W. S. Keeton, D. P. Lettenmaier, N. J. Mantua, E. L. Miles, D. W. Peterson, D. L. Peterson, R. Slaughter, and A. K. Snover. 2003. Preparing for climatic change: The water, salmon, and forests of the Pacific Northwest. Climatic Change 61:45-88.
Mote, P.W., A.F. Hamlet, M.P. Clark, and D.P. Lettenmaier. 2005a. Declining mountain snowpack in western North America. Bulletin of the American Meteorological Society 86(1): 39-49.
Mote, P. W., E. P. Salathé, and C. Peacock. 2005b. Scenarios of Future Climate for the Pacific Northwest. A report prepared for King County (Washington)’s October 27, 2005 climate change conference “The Future Ain’t What It Used to Be: Preparing for Climate Disruption”. Climate Impacts Group, Center for Science in the Earth System, Joint Institute for the Study of the Atmosphere and Ocean, University of Washington, Seattle.
National Academy of Sciences (undated), “The National Academies Study Process: Ensuring Independent, Objective Advice”, Washington, D.C. Brochure available for download from http://www.nationalacademies.org/onpi/brochures/studyprocess.pdf (accessed 5/6/07)
(NAST) National Assessment Synthesis Team. 2000. Climate Change Impacts on the United States: The Potential Consequences of Climate Variability and Change. U.S. Global Change Research Program, Washington D.C.
(NAST) National Assessment Synthesis Team. 2001. Climate Change Impacts on the United States: The Potential Consequences of Climate Variability and Change, Foundation Report. U.S. Global Change Research Program, Washington D.C.
(NPS) National Park Service Glacier Monitoring Program for North Cascades National Park (http://www.nps.gov/noca/naturescience/glacial-mass-balance1.htm, accessed 11/6/06)
(NRC) National Research Council Water Science and Technology Board. 2004. Managing the Columbia River: Instream Flows, Water Withdrawals, and Salmon Survival. Washington, D.C.: The National Academies Press. http://books.nap.edu/catalog.php?record_id=10962#toc
A GUIDEBOOK FOR LOCAL, REGIONAL, AND STATE GOVERNMENTS 127
National Snow and Ice Data Center Press Release, April 5, 2006, “Winter Sea Ice Fails to Recover, Down to Record Low” http://nsidc.org/news/press/20060404_winterrecovery.html (accessed 2/14/07)
Orr, J.C., V.J. Fabry, O. Aumont, L. Bopp, S.C. Doney, R.A. Feely, A. Gnanadesikan, N. Gruber, A. Ishida, F. Joos, R.M Key, K. Lindsay, E. Maier-Reimer, R. Matear, P. Monfray, A. Mouchet, R.G. Najjar, G.K. Plattner, K.B. Rodgers, C.L. Sabine, J.L. Sarmiento, R. Schlitzer, R.D. Slater, I.J. Totterdell, M.F. Weirig, Y. Yamanaka, and A. Yool. 2005. Anthropogenic ocean acidification over the twenty-first century and its impact on calcifying organisms. Nature 437(7059): 681-686.
Palmer, R., M.Wiley, A. Polebitski, B. Enfield, K. King, C. O’Neill, and L. Traynham. 2006. Climate Change Building Blocks. Report to the Climate Change Technical Subcommittee of the Regional Water Supply Planning Process. University of Washington, Seattle.
Parmesan, C. and H. Galbraith. 2004. Observed Impacts of Climate Change in the U.S. Pew Center on Global Climate Change, Arlington, VA.
Parry M.L., O.F. Canziani, J.P. Palutikof, P.J. van der Linden and C.E. Hanson (Eds.). 2007. Climate Change 2007: Impacts, Adaptation and Vulnerability. Contribution of Working Group II to the Fourth Assessment Report of the Intergovernmental Panel on Climate Change. Cambridge University Press, Cambridge, United Kingdom.
Perry, N. 2005. Climate change hits home. Seattle Times 28 October 2005.
Robert E. Kennedy Library, 2002. “Peer Reviewed or Redereed Journals”, California Polytechnic State University, San Luis Obispo, California. Fact sheet last updated January 2002. Available for download at http://www.lib.calpoly.edu/research/guides/pdfs/peer_review.pdf (accessed 5.6.07)
Rothrock, D.A.,Y.Yu and G.A. Maykut. 1999. Thinning of the Arctic sea-ice cover. Geophysical Research Letters 26:3469–3472.
Sagan, Carl. 1996. The Demon-Haunted World: Science As a Candle in the Dark. Ballantine Books, March 1997 ISBN 0-345-40946-9, 480 pgs. 1996 hardback edition: Random House, ISBN 0-394-53512-X, xv+457 pages plus addenda insert (some printings).
Shea, E. and the Pacific Islands Regional Assessment Group. 2001. Preparing for a Changing Climate: The Potential Consequences of Climate Variability and Change, Pacific Islands Report. East-West Center, Honolulu, Hawai‘i.
Shriner, D.S., and R.B. Street. 1997. Chapter 8: North America. In R.T. Watson, M.C. Zinyowera, and R.H. Moss (eds), IPCC Special Report on The Regional Impacts of Climate Change, An Assessment of Vulnerability, A Special Report of IPCC Working Group II. Cambridge University Press, Cambridge, England.
Smith, J.B. 1997. Setting priorities for adapting to climate change. Global Environmental Change 7(3): 251-264.
PREPARING FOR CLIMATE CHANGE128
Snover, A.K., P.W. Mote, L.C. Whitely Binder, A.F. Hamlet, and N.J. Mantua. 2005. Uncertain Future: Climate Change and Its Effects on Puget Sound. Climate Impacts Group, Center for Science in the Earth System, Joint Institute for the Study of the Atmosphere and Oceans, University of Washington. Available for download from: http://www.cses.washington.edu/db/pdf/snoveretalpsat461.pdf
Stewart, I. T., D. R. Cayan, and M. D. Dettinger. 2004. Changes in snowmelt runoff timing in western North America under a ‘business as usual climate change scenario’, Climatic Change 62:217-232.
Stirling, J. 2004. “Evaluating Scientific Information on the World-Wide-Web”. Flinders Medical Centre, Bedford Park SA, Australia. Fact sheet available for download at: http://www.lib.flinders.edu.au/info/branch/medical/evaluation.pdf (accessed 5.6.07)
(UCS) Union of Concerned Scientists. 2006. Climate Change in the U.S. Northeast: A Report of the Northeast Climate Impacts Assessment. Union of Concerned Scientists, Cambridge, MA.
(UKCIP) UK Climate Impacts Programme. 2003. “Climate change and local communities – How prepared are you?”, UK Climate Impacts Programme, Oxford, England.
(UKCIP) UK Climate Impacts Programme. 2007. “UKCIP Tools: Adaptation Wizard (prototype version 1.1).” UK Climate Impacts Programme, Oxford, England. http://www.ukcip.org.uk/resources/tools/adapt.asp (accessed 5/07/07)
(USEPA) United States Environmental Protection Agency. 2002. “Saving Florida’s Vanishing Shores” (brochure). EPA publication number EPA-430-F-02-007. http://www.epa.gov/climatechange/effects/coastal/saving_FL.pdf
(USEPA) United States Environmental Protection Agency. 2006a. “Climate Change – Greenhouse Gas Emissions”, http://epa.gov/climatechange/emissions/co2.html, accessed 2.15.07
(USEPA) United States Environmental Protection Agency. 2006c. “Methane”, http://www.epa.gov/methane/sources.html, accessed 2.15.07
(USEPA) United States Environmental Protection Agency. 2006c. “Nitrous Oxide”, http://www.epa.gov/nitrousoxide/sources.html, accessed 2.15.07
Ward, P. 2005. It’s Written In Stone: Global Warming Is Real. Seattle Post – Intelligencer 6 February 2005: sec. G:1.
Wigley, T. M. L. 2005. The climate change commitment. Science 307(5716): 1766–1769.
Wiley, M.W. 2004. Analysis techniques to incorporate climate change information into Seattle’s long range water supply planning. M.S.C.E. thesis, Department of Civil and Environmental Engineering, University of Washington, Seattle.
Willows, R. and R. Connell (editors). 2003. Climate Adaptation: Risk, Uncertainty, and Decision-making. UK Climate Impacts Programme, Oxford, England.
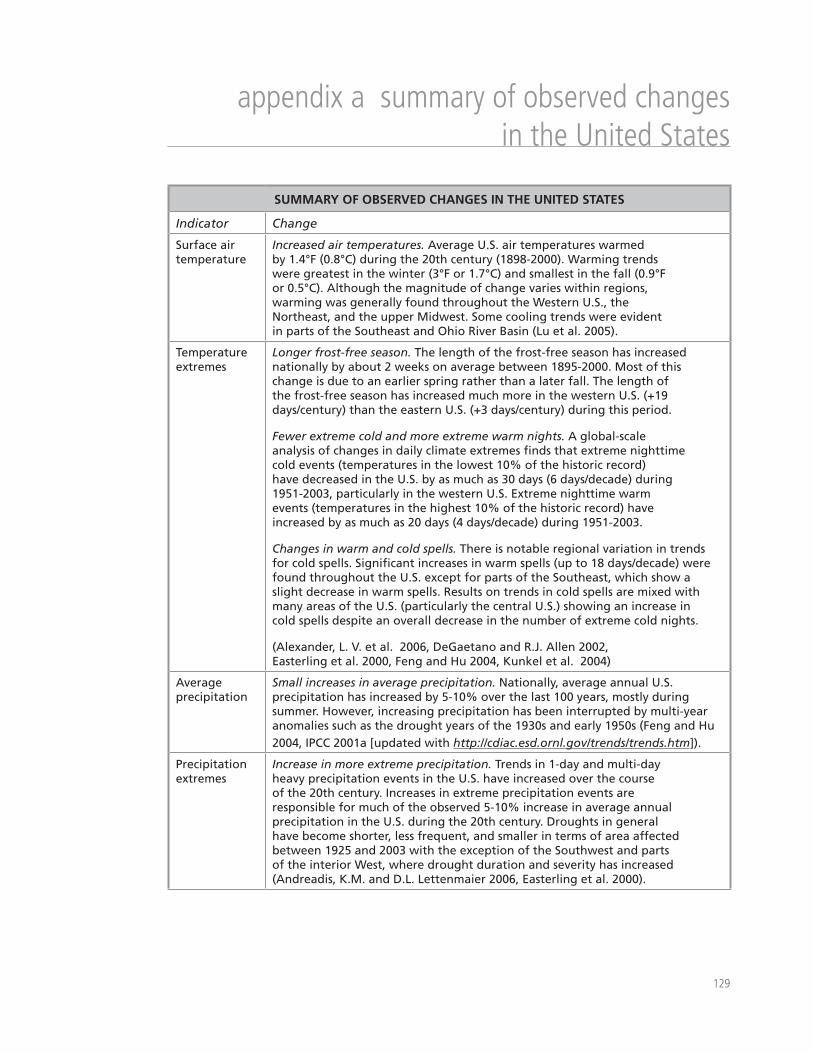
���
append�x a summary of observed changes �n the Un�ted States
SUMMARY OF OBSERVED CHANGES IN THE UNITED STATES
Indicator Change
Surface air temperature
Increased air temperatures. Average U.S. air temperatures warmed by 1.4°F (0.8°C) during the 20th century (1898-2000). Warming trends were greatest in the winter (3°F or 1.7°C) and smallest in the fall (0.9°F or 0.5°C). Although the magnitude of change varies within regions, warming was generally found throughout the Western U.S., the Northeast, and the upper Midwest. Some cooling trends were evident in parts of the Southeast and Ohio River Basin (Lu et al. 2005).
Temperature extremes
Longer frost-free season. The length of the frost-free season has increased nationally by about 2 weeks on average between 1895-2000. Most of this change is due to an earlier spring rather than a later fall. The length of the frost-free season has increased much more in the western U.S. (+19 days/century) than the eastern U.S. (+3 days/century) during this period.
Fewer extreme cold and more extreme warm nights. A global-scale analysis of changes in daily climate extremes finds that extreme nighttime cold events (temperatures in the lowest 10% of the historic record) have decreased in the U.S. by as much as 30 days (6 days/decade) during 1951-2003, particularly in the western U.S. Extreme nighttime warm events (temperatures in the highest 10% of the historic record) have increased by as much as 20 days (4 days/decade) during 1951-2003.
Changes in warm and cold spells. There is notable regional variation in trends for cold spells. Significant increases in warm spells (up to 18 days/decade) were found throughout the U.S. except for parts of the Southeast, which show a slight decrease in warm spells. Results on trends in cold spells are mixed with many areas of the U.S. (particularly the central U.S.) showing an increase in cold spells despite an overall decrease in the number of extreme cold nights.
(Alexander, L. V. et al. 2006, DeGaetano and R.J. Allen 2002, Easterling et al. 2000, Feng and Hu 2004, Kunkel et al. 2004)
Average precipitation
Small increases in average precipitation. Nationally, average annual U.S. precipitation has increased by 5-10% over the last 100 years, mostly during summer. However, increasing precipitation has been interrupted by multi-year anomalies such as the drought years of the 1930s and early 1950s (Feng and Hu 2004, IPCC 2001a [updated with http://cdiac.esd.ornl.gov/trends/trends.htm]).
Precipitation extremes
Increase in more extreme precipitation. Trends in 1-day and multi-day heavy precipitation events in the U.S. have increased over the course of the 20th century. Increases in extreme precipitation events are responsible for much of the observed 5-10% increase in average annual precipitation in the U.S. during the 20th century. Droughts in general have become shorter, less frequent, and smaller in terms of area affected between 1925 and 2003 with the exception of the Southwest and parts of the interior West, where drought duration and severity has increased (Andreadis, K.M. and D.L. Lettenmaier 2006, Easterling et al. 2000).
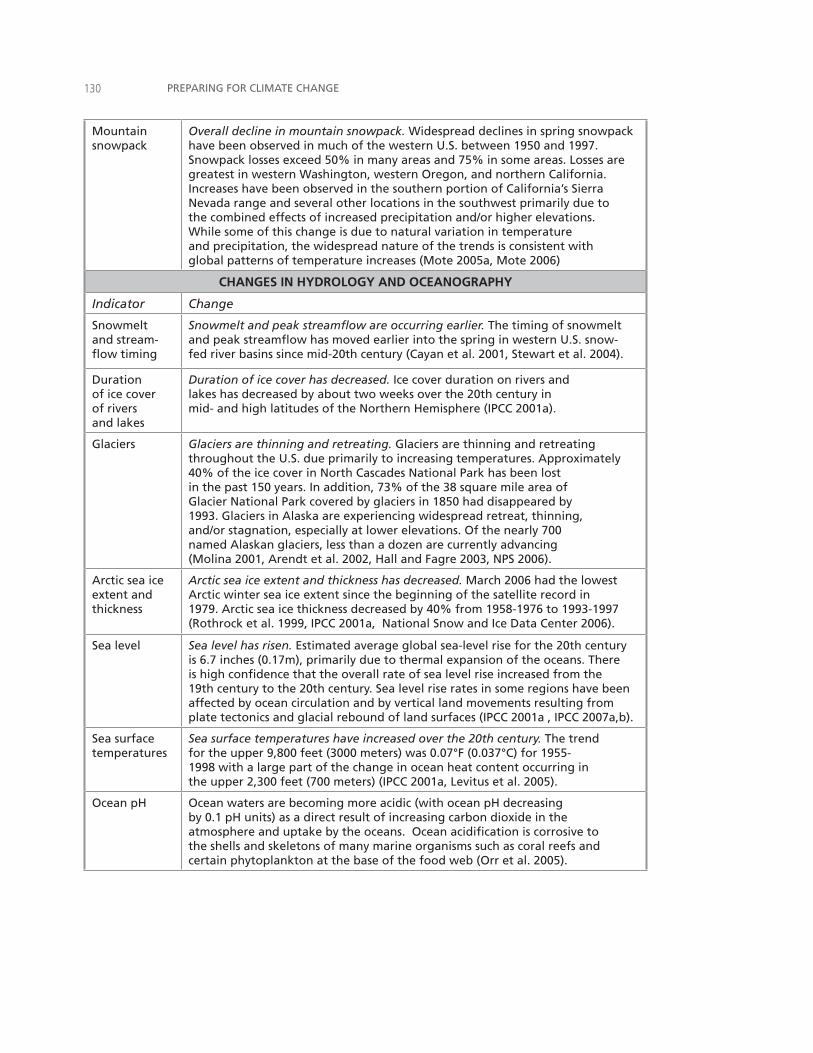
PREPARING FOR CLIMATE CHANGE��0
Mountain snowpack
Overall decline in mountain snowpack. Widespread declines in spring snowpack have been observed in much of the western U.S. between 1950 and 1997. Snowpack losses exceed 50% in many areas and 75% in some areas. Losses are greatest in western Washington, western Oregon, and northern California. Increases have been observed in the southern portion of California’s Sierra Nevada range and several other locations in the southwest primarily due to the combined effects of increased precipitation and/or higher elevations. While some of this change is due to natural variation in temperature and precipitation, the widespread nature of the trends is consistent with global patterns of temperature increases (Mote 2005a, Mote 2006)
CHANGES IN HYDROLOGY AND OCEANOGRAPHY
Indicator Change
Snowmelt and stream-flow timing
Snowmelt and peak streamflow are occurring earlier. The timing of snowmelt and peak streamflow has moved earlier into the spring in western U.S. snow-fed river basins since mid-20th century (Cayan et al. 2001, Stewart et al. 2004).
Duration of ice cover of rivers and lakes
Duration of ice cover has decreased. Ice cover duration on rivers and lakes has decreased by about two weeks over the 20th century in mid- and high latitudes of the Northern Hemisphere (IPCC 2001a).
Glaciers Glaciers are thinning and retreating. Glaciers are thinning and retreating throughout the U.S. due primarily to increasing temperatures. Approximately 40% of the ice cover in North Cascades National Park has been lost in the past 150 years. In addition, 73% of the 38 square mile area of Glacier National Park covered by glaciers in 1850 had disappeared by 1993. Glaciers in Alaska are experiencing widespread retreat, thinning, and/or stagnation, especially at lower elevations. Of the nearly 700 named Alaskan glaciers, less than a dozen are currently advancing (Molina 2001, Arendt et al. 2002, Hall and Fagre 2003, NPS 2006).
Arctic sea ice extent and thickness
Arctic sea ice extent and thickness has decreased. March 2006 had the lowest Arctic winter sea ice extent since the beginning of the satellite record in 1979. Arctic sea ice thickness decreased by 40% from 1958-1976 to 1993-1997 (Rothrock et al. 1999, IPCC 2001a, National Snow and Ice Data Center 2006).
Sea level Sea level has risen. Estimated average global sea-level rise for the 20th century is 6.7 inches (0.17m), primarily due to thermal expansion of the oceans. There is high confidence that the overall rate of sea level rise increased from the 19th century to the 20th century. Sea level rise rates in some regions have been affected by ocean circulation and by vertical land movements resulting from plate tectonics and glacial rebound of land surfaces (IPCC 2001a , IPCC 2007a,b).
Sea surface temperatures
Sea surface temperatures have increased over the 20th century. The trend for the upper 9,800 feet (3000 meters) was 0.07°F (0.037°C) for 1955-1998 with a large part of the change in ocean heat content occurring in the upper 2,300 feet (700 meters) (IPCC 2001a, Levitus et al. 2005).
Ocean pH Ocean waters are becoming more acidic (with ocean pH decreasing by 0.1 pH units) as a direct result of increasing carbon dioxide in the atmosphere and uptake by the oceans. Ocean acidification is corrosive to the shells and skeletons of many marine organisms such as coral reefs and certain phytoplankton at the base of the food web (Orr et al. 2005).
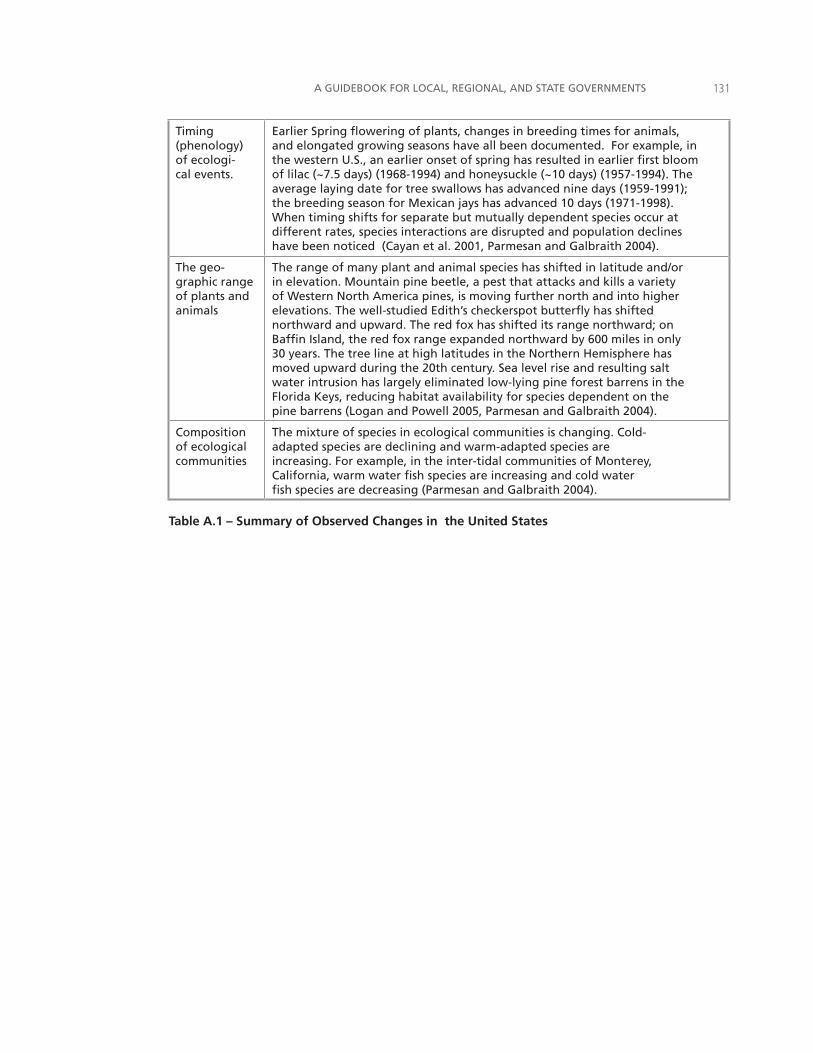
A GUIDEBOOK FOR LOCAL, REGIONAL, AND STATE GOVERNMENTS ���
Timing (phenology) of ecologi-cal events.
Earlier Spring flowering of plants, changes in breeding times for animals, and elongated growing seasons have all been documented. For example, in the western U.S., an earlier onset of spring has resulted in earlier first bloom of lilac (~7.5 days) (1968-1994) and honeysuckle (~10 days) (1957-1994). The average laying date for tree swallows has advanced nine days (1959-1991); the breeding season for Mexican jays has advanced 10 days (1971-1998). When timing shifts for separate but mutually dependent species occur at different rates, species interactions are disrupted and population declines have been noticed (Cayan et al. 2001, Parmesan and Galbraith 2004).
The geo-graphic range of plants and animals
The range of many plant and animal species has shifted in latitude and/or in elevation. Mountain pine beetle, a pest that attacks and kills a variety of Western North America pines, is moving further north and into higher elevations. The well-studied Edith’s checkerspot butterfly has shifted northward and upward. The red fox has shifted its range northward; on Baffin Island, the red fox range expanded northward by 600 miles in only 30 years. The tree line at high latitudes in the Northern Hemisphere has moved upward during the 20th century. Sea level rise and resulting salt water intrusion has largely eliminated low-lying pine forest barrens in the Florida Keys, reducing habitat availability for species dependent on the pine barrens (Logan and Powell 2005, Parmesan and Galbraith 2004).
Composition of ecological communities
The mixture of species in ecological communities is changing. Cold-adapted species are declining and warm-adapted species are increasing. For example, in the inter-tidal communities of Monterey, California, warm water fish species are increasing and cold water fish species are decreasing (Parmesan and Galbraith 2004).
Table A.1 – Summary of Observed Changes in the United States

PREPARING FOR CLIMATE CHANGE���
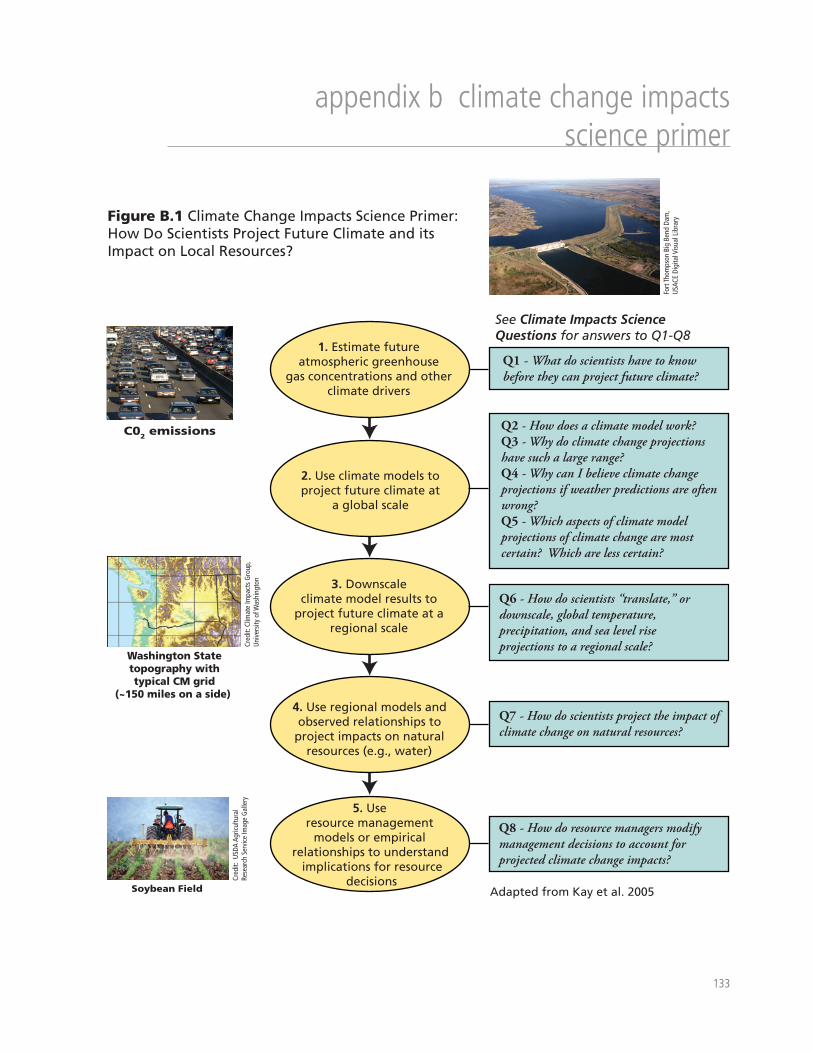
���
append�x b cl�mate change �mpacts sc�ence pr�mer
Fort
Tho
mps
on B
ig B
end
Dam
, U
SACE
Dig
ital V
isua
l Lib
rary
Q1 - What do scientists have to know before they can project future climate?
Q7 - How do scientists project the impact of climate change on natural resources?
Q2 - How does a climate model work?Q3 - Why do climate change projections have such a large range? Q4 - Why can I believe climate change projections if weather predictions are often wrong? Q5 - Which aspects of climate model projections of climate change are most certain? Which are less certain?
2. Use climate models to project future climate at
a global scale
3. Downscaleclimate model results to
project future climate at a regional scale
5. Useresource management
models or empirical relationships to understand
implications for resource decisions
4. Use regional models and observed relationships to
project impacts on natural resources (e.g., water)
1. Estimate future atmospheric greenhouse
gas concentrations and other climate drivers
Q6 - How do scientists “translate,” or downscale, global temperature, precipitation, and sea level rise projections to a regional scale?
Q8 - How do resource managers modify management decisions to account for projected climate change impacts?
See Climate Impacts Science Questions for answers to Q1-Q8
C02 emissions
Soybean Field
Cred
it: U
SDA
Agric
ultu
ral
Rese
arch
Ser
vice
Imag
e G
alle
ry
Washington Statetopography withtypical CM grid
(~150 miles on a side)
Cred
it: C
limat
e Im
pact
s G
roup
, U
nive
rsity
of W
ashi
ngto
n
Figure B.1 Climate Change Impacts Science Primer: How Do Scientists Project Future Climate and its Impact on Local Resources?
Adapted from Kay et al. 2005
PREPARING FOR CLIMATE CHANGE���
Q1: What do scientists have to know before they can project future climate?
Before scientists can project future climate, they need to estimate how factors that influence climate (“climate drivers”) are likely to change in the future. Two important climate drivers are atmospheric concentrations of greenhouse gases and small particles known as aerosols, which are released through fossil fuel combustion and biomass burning and can affect the amount of solar radiation reaching the earth’s surface. These drivers are affected by human choices about energy use, implementation of new technologies, family size, land use change, and other factors. Scientists develop scenarios for future greenhouse gas and aerosol emissions by making a range of assumptions about trends in future development, global population, and per capita energy consumption. These emission scenarios are then put into climate models to project future climate changes (see Q2).
Q2: How does a climate model work?
A climate model is a computer program that solves a series of scientifically established equations to “model” the interactions between major components of the climate system, including the atmosphere, ocean, land surface, ice sheets, and the biosphere3. The relatively coarse resolution of climate models (approximately 150 mile [241 km] horizontal resolution, 0.6 mile [.07 km] vertical resolution, and one-half hour temporal resolution) means some physical processes must be simplified. Because the regionally important influence of local topography and water bodies on climate is not included in climate models, “downscaled” climate model results should used to project future changes in climate at a regional (sub-national) scale (see Q6).
Q3: Why do climate change projections have such a large range?
Roughly speaking, the range of future climate change projections results from two sources of uncertainty: uncertainty in future climate drivers (see Q1) and uncertainty in modeling how the climate system works (see Q2). With improved understanding of the climate system, some of the uncertainty in future model projections could be reduced. However, even if scientists had perfect models of the climate system, future socio-economic and political decisions and their influence on human climate drivers make it impossible to exactly project future climate conditions. The uncertainty in human climate drivers is smaller in the near future (e.g., 2020s), but much larger in the distant future (e.g., 2090s).
Q4: Why can I believe climate change projections if weather predictions are often wrong?
Although frequently viewed as the same, weather and climate forecasting are actually quite different. Much of this difference is attributable to the difference between weather and climate and how this distinction affects the sensitivity of forecasting models. Weather refers to the state of the atmosphere at a specific place, day, and time while climate describes the long-term statistics (averages, ranges) of weather conditions associated with a location. A successful weather forecast describes the state of the atmosphere at an exact time, e.g., Monday afternoon or Wednesday morning. Skillful weather forecasts are only possible to about seven days because weather forecasts depend heavily on the exact state of the atmosphere at the beginning of a weather model forecast
3 The term “biosphere” refers to those portions of earth’s land, ocean, and atmospheric systems inhabited by living organisms as well as dead organic matter such as soil organic matter and oceanic remains (Source: IPCC 2001a)
A GUIDEBOOK FOR LOCAL, REGIONAL, AND STATE GOVERNMENTS ���
(“initial conditions”), which are very difficult to determine precisely. Small changes in initial conditions can have important effects on the overall forecast.
Climate prediction, on the other hand, is not as sensitive to initial conditions. Climate prediction depends on well-understood interactions between the atmosphere, land surface, oceans, and ice sheets, as well as slowly varying climate drivers like greenhouse gases, solar radiation, and volcanic aerosols. Consequently, to the extent that the physical interactions are understood and climate drivers are reasonably predicted, the climate can be well simulated over extended periods of time (typically 30 years).
Q5: Which aspects of climate model projections of climate change are most certain? Which are less certain?
Climate scientists have the most confidence in climate model temperature projections for several reasons. First, the warming trends and variability observed over the 20th century are well represented in climate model simulations for that period, which helps to directly relate simulated warming patterns with rising greenhouse gasses. Second, the simulated warming trends are substantial compared to year-to-year and decade-to-decade variability in temperature, which implies the trends are a robust result. Third, there is close agreement among all climate models on the magnitude of warming resulting from increased greenhouse gasses.
Confidence in sea level rise projections is also high, although recent evidence that the Greenland ice sheet is melting faster than expected could lead to higher estimates of sea level rise if the recent increase continues and is not a short-term phenomenon (IPCC 2007a,b).
Scientists are less certain about precipitation changes in the climate simulations. First, processes controlling precipitation vary considerably around the globe and do not respond in the same way to climate change. Thus, the precipitation response to climate change will be regionally specific. Second, many of the processes that control precipitation in the atmosphere (e.g., spatial resolution, topography) are not well represented in current models due to the limitations of current computers and the long simulations needed for climate research. Third, unlike temperature projections, there is a lack of agreement in both the direction (wetter/drier) and magnitude (how much wetter/drier) in the response of precipitation to climate change in global climate models. Finally, the year-to-year and decade-to-decade variability in precipitation is large compared to any trend due to climate change, so simulated trends are difficult to distinguish from natural variability.
Climate models also have trouble representing important patterns of climate variability such as the El Niño-Southern Oscillation (ENSO), which can influence temperature and precipitation patterns in many parts of the world. It is unknown at this time how ENSO or other natural patterns of climate variability could change as a result of climate change.
Q6: How do scientists “translate” (or “downscale”) global temperature, precipitation, and sea level rise projections to a regional scale?
Raw global climate model output has very coarse spatial resolution (see Q2) that cannot resolve all of the processes important for future climate projections at the regional scale. Projecting regional climate change, therefore, requires downscaling global climate model results. Downscaling is important because it allows climate scientists to incorporate the influence of finer
PREPARING FOR CLIMATE CHANGE���
scale influences of topography and water bodies on regional climate into future climate projections.
Two methods of downscaling are commonly used: statistical methods and regional climate modeling (RCM). Statistical methods relate climate model projections to historical regional climate variations. Statistical methods assume that climate change will only affect the mean climate, not the variability in climate. RCM uses global climate model output and models finer-scale climate features resulting from local topography and water bodies. In principle, RCM should be more realistic than statistical downscaling because no assumptions about future variability in climate are made when using RCM.
In addition to temperature and precipitation projections, global sea level rise projections must be downscaled. Sea level projections depend not only on changes in global sea level but also on changes in local land elevation (e.g. subsidence and uplift due to regional plate tectonics or glacial rebound) and ocean circulation. Once global sea level rise and regional factors affecting sea level are taken into account, regional sea level rise projections can be determined and used to assess the impacts on coastal resources.
Q7: How do scientists project the impact of climate change on natural resources?
Once regional-scale climate projections are obtained (see Q2 and Q6), these projections – combined with resource models and observations of how climate affects resources – can be used to project climate change impacts on natural resources. For example, regional hydrology models can be used to assess climate change impacts on stream flow timing and volume. Observed impacts can also be used to formulate equations for projecting climate change impacts. For example, if scientists can develop an equation that describes the dependence of winter wheat production on temperature in the current climate, this equation can be used with projected future temperatures to estimate winter wheat production in future climates.
Q8: How do resource managers modify management decisions to account for projected climate change impacts?
After identifying projected changes in regional climate (Q6) and natural resources (Q7), resource management models and observations can be used to assess the impact of climate change on management decisions. For example, resource managers could use altered streamflow scenarios to drive a water management model and estimate the impacts of climate change on hydropower operations or municipal water supply. For resources such as forestry and fisheries where quantitative management models do not exist or are being developed, resource managers can use observations of how historic climate fluctuations have affected the resource to get a baseline understanding of potential climate change impacts.
���
append�x c U.S. nat�onal assessment reg�onal summar�es
The following “mega region” summaries provide an overview of findings from the U.S. Global Change Research Program’s 2000 U.S. National Assessment (NAST 2000). For a map of the regions, see Figure 2.5. Additional studies on regional impacts have subsequently been published in some U.S. regions and support the National Assessment’s findings, further reinforcing the importance of understanding how climate change may affect the range of issues that regional and local governments manage on a day-to-day basis. When possible, the newer regional studies are used to supplement the NAST 2000 regional summaries. For a list of the National Assessment regional studies and other studies, see Appendix D.
1. Northeast United States4 Maine, New Hampshire, Vermont, Massachusetts, Connecticut, Rhode Island, New York, New Jersey, Delaware, Pennsylvania, Maryland, West Virginia, and the District of Columbia
A recent assessment (UCS 2006) of climate change impacts to the Northeast projected increases in average temperatures by 2100 on the order of 5-11°F for summer and 6-10°F for winter depending on which of two greenhouse gas emissions scenarios used in the assessment (a low versus high carbon dioxide emissions scenario) is realized over the 21st century. Annual precipitation is projected to increase 10% by the end of the century. Winter precipitation, which was sensitive to the choice of emissions scenarios in the UCS 2006 study, is projected to increase 20-30% by 2100 under the higher emissions scenario. Little change is expected in summer precipitation in either scenario but both scenarios lead to more intense more frequent heavy precipitation events.
The projected changes in temperature and precipitation are expected to affect many aspects of the Northeast’s environment. Streamflows and water supply could be impacted as warmer winter temperatures lead to more winter precipitation falling as rain rather than snow, lower snowpack, and earlier spring snowmelt. Winter flood risk and winter streamflows are likely to be greater with the shift to more winter rain and projections for an overall increase in winter precipitation. The risk for late summer and fall drought increases despite the projected increase in winter precipitation, however, due to higher summer temperatures, increased evaporation, a longer growing season, and lower summer streamflows.
Changes in extreme heat are a concern in the Northeast. For the low emissions scenario, the Northeast may see at least 30 more days per year when average temperatures exceed 90°F and three to nine more days where temperatures exceed 100°F. For the high emissions scenario, the number of days exceeding 90°F increases to more than 60 days per year and the number of days above 100°F increases between 20 and 30 days. When the effects of humidity are taken into account along with the projected increases in temperature, the typical New England summer day is expected to feel 12-16°F warmer than the typical summer day for the period 1961 to 1990.
4 The UCS 2006 assessment defines the Northeast as including the states of Maine, New Hampshire, Vermont, Massachusetts, Connecticut, Rhode Island, New York, New Jersey, and Pennsylvania. The NAST 2000 assessment also included Maryland, Delaware, West Virginia, and the District of Columbia in definition of this region
PREPARING FOR CLIMATE CHANGE���
Many aspects of the Northeast economy are vulnerable to climate change impacts (NAST 2000)5. Coastal development is at increased risk of coastal flooding and damage from storm surges due to sea level rise. Increased water temperatures in the region’s estuaries, bays, and coastal wetlands may force lobsters to migrate to cooler waters. The length of the winter snow season could be cut 25-50%, impacting the region’s ski and snowboarding industry. The potential for more snow-free days could, however, increase warm-season recreation activities such as hiking. The region’s fall foliage, a major tourist attraction currently dominated by maple, beech, and birch trees, could be affected by the northward migration of species in response to increasing regional temperature. Forest diebacks and a delay or mis-timing of peak colors could also negatively affect fall foliage-related tourist activities (NAST 2000, Carter 2003a).
2. Southeast United StatesVirginia, North Carolina, South Carolina, Kentucky, Tennessee, Georgia, Alabama, Louisiana, Mississippi, Arkansas, eastern Texas, and Florida
Average annual temperature in the Southeast is projected to increase 4-10°F over the 21st century while changes in precipitation vary from near zero to a 25% increased depending on the model analyzed (Carter 2003b). Increases in high temperatures, the regional heat index, and ground-level ozone are also anticipated. This raises concerns for human health in the Southeast, particularly for lower income households which have fewer financial resources for air conditioning and other adaptive measures. Existing problems with regional water quantity and quality are likely to worsen due to the increased risk for drought, salt water intrusion, warmer water temperatures, and extreme precipitation events. The incidence of red tides, fishkills, and bacterial contamination in shellfish is expected to increase with warmer summer temperatures (ibid). Additionally, more flooding in low-lying coastal communities is expected (NAST 2000).
Climate change impacts on agricultural production in the Southeast vary by crop, area, and climate change scenario. Some crops, including rice, soybeans, cotton, and peanuts, may benefit from the CO2 fertilization effect (see Section 2.3) (Carter 2003b). The benefit is lost, however, if temperatures are too high or precipitation losses are too great (-20% or more) (ibid). Citrus yields may benefit from fewer freeze events or decline as a result of a shortened (but necessary) period of dormancy. An increase in the frequency of extreme hot summer days may lead to more heat stress in crops and increase the need for irrigation, which many agricultural operations in the Southeast do not have. Overall, agricultural impacts are expected to be negative in the lower Mississippi Valley and Gulf Coast and positive in the Atlantic Coastal Plain (NAST 2000).
Estimates of changes in forest growth are uncertain. Forest process models run with wetter, less warm scenarios (relative to other warming scenarios) project increased pine and hardwood forest growth in the Southeast by the end of the 21st century, particularly in the northern half of the region. Models run with warmer and drier climate scenarios, however, show decreased forest growth in some areas and shifts from pine-dominated forests to savannas and grasslands as a result of increased fire and decreased soil moisture.
5 Like the UCS 2006 study, the National Assessment (NAST 2000, 2001) projects that Northeast temperatures will increase as a result of global warming. The projections in the National Assessment are slightly different from those found in UCS 2006, however, due to differences in the area covered and the climate models and emissions scenarios used for each assessment. NAST 2000 projects that minimum winter temperature will increase from about 4-5°F to as high as 9°F by the end of the 21st century. Summer maximum temperatures are expected to increase on the order of 2-3°F or 7-11°F depending on the model chosen (NAST 2001).
A GUIDEBOOK FOR LOCAL, REGIONAL, AND STATE GOVERNMENTS ���
Sea level rise and storm surge are a major concern for the Southeast. In Florida, approximately 8% (4,500 square miles) of the state’s total land area lies within 4.5 feet of sea level (USEPA 2002). Most of this is located in southern Florida. Saltwater intrusion into the Everglades – a freshwater ecosystem – from higher sea level and tidal flooding would negatively affect how the ecosystem functions and the diversity of life within it. Additionally, high sea levels could affect the Biscayne Aquifer, which is recharged by freshwater from the Everglades. The Biscayne Aquifer provides almost all of the freshwater for the Florida Keys, the City of Miami, and the lower East Coast of Florida (ibid).
Human development and natural subsidence of coastal land areas can compound the impacts of sea level rise. The greater New Orleans metropolitan area currently sits 5-10 feet below sea level and is continuing to sink as much as 0.4 inches annually due to groundwater pumping, natural compaction of soils, and tectonic activity (Burkett 2003). The combined effects of sea level rise and subsidence could leave the New Orleans region 8 to 12 feet below mean sea level by 2100, increasing the risk of flooding even as the region struggles to improve flood control systems in the wake of 2005’s Hurricane Katrina (ibid).
3. Midwest United States
Ohio, Indiana, Michigan, Illinois, Wisconsin, Minnesota, Iowa, and Missouri
Average annual temperature in the Midwest is projected to increase 5-10°F over the 21st century and precipitation is likely to increase 10 to 30% on average in much of the region (NAST 2000). Changes in average winter temperature are potentially more significant, particularly in the most northern areas of the region. One climate model used in the NAST 2000 projected an increase in average winter temperatures on the order of 15°F in northern Minnesota and Michigan’s Upper Peninsula. This is in addition to the average 4°F warming already observed in these northern areas during the 20th century.
Climate change is projected to have important impacts on Midwest water resources. Water levels in the Great Lakes are expected to decline significantly due to increasing temperatures and evaporation. These declines are likely to lead to more competition for water within the region and between the U.S. and Canada, decreased hydropower generation, fewer wetlands, and increased water-based transportation costs, some of which may be offset by decreased ice cover and a longer navigation season. Projected increases in heavy precipitation events are likely to lead to more flooding and non-point source pollution.
With respect to human health impacts, the Midwest is likely to benefit from fewer extreme cold outbreaks while the potential for more heat-related illnesses increases during the summer. Heat-related stress is particularly a concern for urban areas where the concentration of paved surfaces elevates nighttime temperatures. Urban areas are also likely to see more problems with summer air quality as a result of warmer temperatures. Finally, the projected increase in extreme precipitation events may lead to an increase in insect or tick-borne disease.
Agricultural production is generally expected to increase due to lengthening of the growing season and the carbon dioxide fertilization effect (see Section 2.3), but not in all areas. Warmer air temperatures and reduced soil moisture are expected to increase forest fire risk and forest susceptibility to disease and insects, contributing to declines in both coniferous and deciduous trees. Impacts on the forest industry could be significant particularly when combined with the pressure to convert forest land to other land uses.
PREPARING FOR CLIMATE CHANGE��0
Major changes in freshwater ecosystems are expected. Warmer water temperatures favor warm water fish species over cold water fish species and increase the risk of invasive species. The potential for more nutrient pollution (from the projected increase in heavy precipitation events) and warmer water temperatures increases the risk for algae growth in freshwater lakes. As noted previously, declining lake levels throughout the region could reduce wetlands habitat. This has implications for the migrating birds and other wildlife dependent on wetland systems for all or part of their life stages.
4. Great Plains Montana, Wyoming, North and South Dakota, Nebraska, Kansas, Oklahoma, Texas
Average annual temperature in the Great Plains is projected to increase 5-12°F over the 21st century, although the distribution of this warming will vary spatially and by season (NAST 2000). Temperature increases are likely to be greatest along the eastern edge of the Rocky Mountains and more warming is expected in winter and spring than summer and fall (Carter 2003c). Precipitation changes also vary by location. Overall, annual precipitation is expected to increase by 13% or more with the largest increases in the eastern and northern parts of the Great Plains. More intense rainfall events are expected, especially in the Southern Great Plains. Both models used in NAST 2000 show a decreasing precipitation trend along the eastern flanks of the Rocky Mountains during the 21st century, however.
Climate change is projected to increase competition for water among agricultural, urban, industrial, recreational, and natural ecosystem water uses through increased temperature, increased evaporation, reduced soil moisture, and changes in the timing of snowmelt runoff from the Rocky Mountains (NAST 2000). An increased risk of drought will also heighten competition for water.
The carbon dioxide fertilization effect (see Section 2.3) will likely increase productivity of crops and grasses in the region provided there is sufficient water supply and soil nitrogen. Specific changes in agricultural production and irrigation water needs water will vary by crop type and location, however. The potential for invasive species such as leafy spurge, field bindweed, and jointed goatgrass to out-compete native species on agricultural land and range lands is already a major concern in the region; climate change may contribute to the spread of invasive species where native species are unable to adapt quickly enough to changes in temperature and soil moisture.
The potential for more extreme heat is expected to increase. Extreme heat events can have a major impact on livestock as well as people in the region. Urban and rural flooding is more likely given projected increases in storm intensity. More intense rainfall events will also lead to more soil erosion and degraded surface and ground water quality from stormwater runoff containing fertilizers, herbicides, pesticides, livestock wastes, salts, and sediments. The stress of managing climate impacts is expected to disproportionately affect rural family farmers and ranchers and the urban poor.
A GUIDEBOOK FOR LOCAL, REGIONAL, AND STATE GOVERNMENTS ���
5. West
California, Nevada, Utah, Arizona, New Mexico, and Colorado
Average annual temperature in the West is projected to increase 3-4°F by the 2030s and 8-11°F by the 2090s (NAST 2000). Both wetter and drier conditions are expected. A major concern in the West is climate change impacts on water resources. Western states are reliant on winter snowpack for most of their summer water supply. Warmer temperatures are expected to significantly reduce mountain snowpack, altering the timing of peak snowmelt runoff and reducing the amount of water available during spring and summer. These changes have implications for municipal and industrial water supply, irrigation, hydropower generation, and provision of instream flows for threatened and endangered freshwater species. Snowpack losses could be offset to some degree by increased winter precipitation if climate change brings a wetter winter climate and water supply systems are able to capture the additional precipitation. A wetter climate would also bring concern for increased soil saturation, landslides, and flooding in some areas.
Forest growth could increase as a result of the carbon dioxide fertilization effect (see Section 2.3). This could lead to less desert area and a shift towards more woodlands and forests in parts of the West. Productivity may eventually decline, however, if climate is drier, temperature increases are too great, and/or the carbon dioxide fertilization effect levels off. The potential for more forest fires is also a potential limiting factor. Forest fires are expected to increase regardless of changes in average precipitation; as long as year-to-year variability remains high, wet years will encourage more plant growth and the accumulation of fuel loads which are then available to burn in dry years.
Potential impacts on agricultural production in the West vary. Crop yields in Western states could increase given the potential for a carbon dioxide fertilization effect and increased precipitation. Warmer temperatures could lengthen the growing season and, where adequate irrigation water is available, shift growing regions northwards. Warmer temperatures could also contribute to more heat stress, pests, weeds, and disease in agricultural crops. Temperature and the length of the growing season are particularly important to wine production. Changes in the types of wine grapes and location of growing areas in California may be required as a result of increasing temperatures. Warmer temperatures are also likely to affect the timing of key physical processes in grape production and development, affecting the ability of grapes to reach optimal levels of sugar, acid, and flavor (Jones et al. 2005). Adaptation capabilities of fruit and nut trees, which take decades to get established and form an integral part of the West’s agricultural economy, are a concern. In all cases, the availability of adequate irrigation water supplies is a potentially limiting factor.
Recreation and tourism in the West are also likely to be affected by climate change. Winter sporting activities are expected to have a shorter season, particularly in low elevation areas and areas where snowmaking is not an option. The summer recreation season is likely to be lengthened due to warmer temperatures but may be limited by heat during the peak of the season.
PREPARING FOR CLIMATE CHANGE���
6. Pacific NorthwestWashington, Oregon, and Idaho
Average regional temperature in the Pacific Northwest (PNW) is expected to increase 2°F by the 2020s and 3°F by the 2040s compared to 1970-1999 (Mote et al. 2005b). Temperatures are projected to increase across all seasons with the greatest increase occurring during the summer months. Changes in annual precipitation are less certain but most models project a slight increase in winter precipitation. Changes in extreme precipitation events are uncertain. The effect of warmer temperatures on winter snowpack and summer water supplies is a major concern in the PNW. Warmer winter temperatures are expected to lead to more winter precipitation falling as rain rather than snow, particularly in mid-elevation basins where average winter temperatures are currently near freezing. This will result in to less winter snow accumulation, higher winter streamflows, earlier spring snowmelt, earlier peak spring streamflow, and lower summer streamflows in rivers that depend on snowmelt (i.e., most rivers in the PNW). These changes, combined with population growth, are likely to increase existing conflicts among competing water uses, including urban water supplies, instream flows for salmon, irrigated agriculture, hydropower, navigation, and recreation.
Climate change is expected to affect salmon – a culturally and economically significant PNW resource – across all freshwater life stages as a result of changes in the timing and volume of streamflow. Projected increases in winter flooding, decreased summer and fall streamflows, and warmer summer water temperatures will further degrade freshwater and estuary salmon habitat in the PNW. These changes will likely cause severe problems for already stressed salmon stocks, including federally protected stocks listed under the Endangered Species Act. The projected impacts of climate change on PNW forests will vary by forest type and sensitivity to changes in soil moisture and snowpack. Forests located in areas where soil moisture is the dominant limiting factor (like lower elevations in eastern Washington), for example, are likely to be negatively affected given projected decreases in soil moisture. Increased drought stress increases the risk of forest fire and vulnerability to insects such as the mountain pine beetle, particularly in areas east of the Cascades Mountains. Sea level rise is expected to require substantial infrastructure investments, increase the risk of coastal erosion, and threaten coastal habitat. Impacts on agriculture will vary with crop type and availability of irrigation water, particularly in the semi-arid interior PNW. The carbon dioxide fertilization effect (see Section 2.3) may increase agricultural production where water supplies are sufficient but may also increase competition with weeds and vulnerability to pests.
7. Alaska and the Arctic Region
Average annual temperature for the Arctic region, which includes Alaska, northern Canada, Greenland, Norway, Sweden, Finland, and northern Russia, is projected to increase 5.4 to 9°F over land for the 21st century (ACIA 2004). Projected winter temperature increases are even larger; models show an increase in average winter (December, January, and February) temperature on the order of 7.2 to 12.6°F over land by the 2090s. Total annual precipitation is likely to increase about 20% with most of the increase concentrated in the coastal regions and in winter and autumn. Although substantial, the expected increase in precipitation is not likely to be enough in many areas to compensate for increased evaporation from warmer temperatures.
The warming projected for the Arctic region will exacerbate many changes already occurring as a result of the dramatic warming seen in much of the region since the mid-20th century (up to
A GUIDEBOOK FOR LOCAL, REGIONAL, AND STATE GOVERNMENTS ���
7.2°F during winter months). Sea ice extent is expected to decline 10 to 50% by the 2090s with most of the loss coming in the summer months. Animals dependent on sea ice, including polar bears and ringed seals, could become extinct before the end of the century as a result of this decline. Snow cover is likely to be reduced by 10-20%. Boreal (northern) forests are projected to expand northward into tundra regions while tundra expands into the polar desert regions, limiting habitat availability for some species and disrupting closely integrated ecosystems. White and black spruce, key tree species in Alaska’s boreal forests, are likely to see decreased growth in drier interior regions as warmer temperatures increase drought stress. Increased drought stress and warmer temperatures also contribute to projected increases in the frequency, intensity, and duration of forest fires and losses from insects such as the spruce bark beetle and spruce budworm.
The social, cultural, and economic implications of climate change for the Arctic region are significant. Indigenous communities dependent on hunting, trapping, gathering, and fishing for sustenance as well as social and cultural traditions are likely to face greater challenges as the range of key species like salmon, herring, walrus, whales, caribou, and moose shift in response to warming temperatures. Thinning ice and thawing permafrost also increase the risk associated with hunting and gathering.
Damage to coastal infrastructure is likely to increase as sea level rise, increased winter storm surge reach (from loss of sea ice), and thawing permafrost contribute to increased coastal erosion. In the interior, thawing permafrost can damage water and sanitation pipes, oil and gas pipelines, roads, airstrips, buildings, and other critical infrastructure. Longer periods of thawing permafrost are also likely to limit access to logging and land-based oil and gas production activities. Alaska has already seen a 50% decline in the number of days where the tundra is sufficiently frozen to allow for transport of oil and gas exploration and extraction equipment. On the positive side, reduced sea ice may open more summer shipping routes and increase opportunities for off-shore oil exploration and extraction.
8. Islands of the Caribbean and the PacificCommonwealth of Puerto Rico and U.S. Virgin Islands in the Caribbean; Hawaiian Islands, American Samoa, Commonwealth of the Northern Mariana Islands, Guam, the Federated States of Micronesia, the Republic of the Marshall Islands, and the Republic of Palau in the Pacific.
The Hadley Center global climate model projects an increase in average annual temperature in the tropical Pacific Basin of 1.8°F for the 2025-2034 period (Shea et al. 2001). Much of this warming is concentrated in a horseshoe-shaped pattern extending southwest from the U.S./Mexico border and due west along the equator from the coasts of Central American and northern South America towards the international dateline. Additional analysis of late 21st century temperature projections (2071-2100) for the Pacific using nine global climate models projects an increase in average annual temperature of 3.6°F to 4.7°F depending on the greenhouse gas emissions scenario (ibid). The pattern of concentrated warming is similar to that projected by the Hadley Center model. No specific temperature projections were provided in the National Assessment for the Caribbean, although average air and water temperatures are also projected to increase in the Caribbean (NAST 2000).
Precipitation projections for the Caribbean and the Pacific are variable depending on location, season, and model period. Winters are projected to get slightly wetter and summers slightly drier
PREPARING FOR CLIMATE CHANGE���
in the Caribbean in the 21st century (ibid). For the Pacific region, more precipitation is expected in some areas while other areas may experience drier conditions.
Climate change impacts to the Caribbean and Pacific Island regions are expected to be driven by increasing air and water temperatures; changes in natural variability (particularly the El Niño/La Niña oscillation); changes in the frequency, intensity, and pathways of tropical hurricanes and typhoons (collectively referred to as “cyclones”); changes in ocean circulation patterns; and sea level rise (ibid). The small size and relative isolation of the islands make these areas particularly vulnerable to climate change impacts. Additionally, key components of many island economies – subsistence agriculture and fishing, tourism, commercial fishing, and commercial agricultural production – are highly sensitive to climate.
The availability of freshwater is a major concern. Many islands already face problems with freshwater supply as a result of increasing population, tourism, and urban centers (NAST 2000). These shortages are compounded by a lack of adequate storage and/or a mismatch between where the rain falls and where it is needed most. Climate change may reduce the amount and quality of freshwater by increasing the risk of drought and salt water intrusion into groundwater supplies, particularly on smaller islands. In the Caribbean, an increased risk of flooding and landslides due to more intense precipitation events is also a major concern (ibid).
Sea level rise and storm surge are expected to have significant impacts on islands in the Caribbean and the Pacific. Many economic activities and population centers are concentrated on the coasts (Shea et al. 2001). Sea level in the Pacific region is projected to increase 3.9-4.7 inches in the 2020-2040 period and 11.8-15.0 inches by the 2080-2099 period (ibid). Sea level rise increases the risk for erosion, inundation of low-lying areas, damage from storm surges, and salt water intrusion into groundwater supplies (NAST 2000).
Biodiversity of island ecosystems – both terrestrial and aquatic – is likely to be further stressed by climate change. Extinction rates in the island regions are already the highest relative to other regions of the U.S. due to habitat destruction and competition from invasive species. Species have limited ability to migrate in response to these and future changes given their small populations and physical isolation. Climate change may negatively affect forest ecosystems by increasing the risk for flooding, drought, fires, or disease (NAST 2000). Coastal mangrove swamps may also be squeezed out of existence where there is inadequate space to move inland in response to sea level rise. Warmer ocean temperatures may negatively impact coral reef communities by causing coral bleaching, in turn affecting the cultures, economies, and ecology of many island communities.
Changes in cyclone intensity, frequency, and paths could also have significant impacts on islands in the Caribbean and the Pacific. There is great uncertainty as to how climate change may affect these characteristics, however (NAST 2000). Increasing sea surface temperature in the Pacific is likely to expand areas in the Pacific where tropical cyclones form and migrate through, potentially increasing the risk of cyclones to many Pacific island communities (Shea et al. 2001).
9. Native Peoples and Homelands
Projected climate changes affecting native peoples and homelands in the United States in the coming century differ based on geographic location. At present, more than half of the two million native individuals currently registered with a tribe in the United States live on or near reservations, many acres of which are located in the western United States, southwestern United States, Great Plains and Alaska (NAST 2000). Projected climate change information for these
A GUIDEBOOK FOR LOCAL, REGIONAL, AND STATE GOVERNMENTS ���
regions, provided in other summaries, can be potentially useful information for native peoples who live there. Other native people live in Hawaii and the Pacific and Caribbean Islands; the projected climate change impacts to these regions are also covered in separate summaries. However, specific information about climate change impacts does not exist uniformly for many native communities.
Native communities often rely more heavily on natural resources for subsistence and economic livelihood, have already been stressed by past relocations, and have fewer financial resources for disruptions to daily life (ibid). Climate change impacts thus pose unique social, economic and cultural threats to these communities beyond what numerical information about temperature, precipitation and other climate trends can convey.
One example is that areas of the Arctic (including Alaska), where many native peoples rely on the land and the sea for food and livelihood, are projected to experience significant climate change impacts. According to models, rapid Arctic warming will continue to affect Alaska, with temperatures projected to increase between 1.5 and 5°F by 2030, and either 5 - 12°F or 7 - 18°F by 2100, depending on the model used (Hadley and Canadian, respectively) (ibid). Northern regions and the winter season are expected to see the strongest warming trend. In the results of both commonly used models (Hadley and Canadian), precipitation is projected to increase across most of Alaska, with upwards of 20-25 percent projected increase in precipitation in the north and northwest, and a 10 percent projected decrease in the coastal south (ibid). However, models also project that warming will be associated with increased evaporation, offsetting the precipitation increases and leading to drier soils throughout Alaska.
Anecdotally, Eskimo communities such as the Yupik have observed that winter seasons are warming, and that temperature shifts are disrupting key species in the regional food web on which their people rely. Satellite photos and related ecological analysis of sea ice retreat are consistent with these community observations that populations of fish, seals, walruses and other food sources are being weakened as a result of climate change (ibid).
It is clear that a number of emerging issues expected to result from climate change will be common across native communities, such as:
impacts to land-based and coastal economic livelihoods and subsistence, such as described in the Yupik community example, and exacerbating already poor economic conditions;
human health impacts, such as extreme heat, expected to worsen already poor living conditions in rural areas which may not have electricity for cooling systems;
impacts to status of water rights due to potentially reduced snowpack and changes in previously accepted seasonal streamflow patterns; and
damage to or loss of historical and special heritage sites, such as ceremonial landscapes with culturally important traditions involving fish and wildlife (ibid).
•
•
•
•

PREPARING FOR CLIMATE CHANGE���
���
append�x d sources of �nformat�on on cl�mate change sc�ence, �mpacts, and adaptat�on
There are many sources of climate change information. These fall into several general categories, which are described below in Appendix D.1. Appendices D.2 through D.4 list a variety of organizations, reports, fact sheets, and web sites that may be helpful. This Appendix also includes information on the National Oceanic and Atmospheric Administration’s Regional Integrated Sciences and Assessment (RISA) program, whose regional teams may provide a good starting point for understanding how climate change may affect your region (Appendix D.5).
D.1 Types of Climate Change InformationBefore publication, most scientific results are examined and critiqued by independent scientific scholars in a process called “peer review.” The peer review process helps prevent the publication of bad science. The process of critiquing a document is also called “refereeing.”
Peer-reviewed assessment reports. Assessment reports, such as those developed by the Intergovernmental Panel on Climate Change or the United States’ National Academy of Sciences, are invaluable. Scientific assessments collect the disparate and sometimes conflicting pieces, reviewing hundreds of scientific papers published in peer-reviewed journals. They reconcile different points of view where possible and note them where not, and summarize the state of knowledge in an (often lengthy) document.
Most peer-reviewed climate change assessment reports to-date provide climate change (temperature, precipitation, sea level rise) scenarios for various large regions of the world. These reports are also useful for developing a general sense of how different sectors are sensitive to climate. Regionally focused assessment reports can provide more in-depth and spatially relevant information on climate impacts.
Pros: highly credible, often all or partially “translated” for understanding by an educated layperson, comprehensive evaluation of current state of understanding.
Cons: typically focused on large geographic areas (continents, globe), may not provide sufficiently detailed information for regional planning efforts, scientific findings may be dense and difficult to understand despite translation.
Peer-reviewed journal articles and books. Single peer-reviewed journal articles and/or books can be useful for science advice, but are sometimes too limited in scope to provide policymakers with a robust perspective. These documents should be used in context of other findings, ideally under the guidance of a trained professional.
Pros: highly credible, can provide more detailed information relevant to specific geographic areas and/or ecosystems/sectors.
Cons: highly technical, narrow focus, difficult for layperson to ascertain the consistency of a single article or study with the broader scientific consensus.
•
•
•
•
PREPARING FOR CLIMATE CHANGE���
The “gray literature” (papers and reports from research groups and governmental agencies; conference proceedings). Governmental agencies (like the Environmental Protection Agency and the Department of Energy), academic research groups, professional societies, and non-governmental organizations may produce papers or reports describing the results of research or assessment. This is referred to as gray literature. Conference proceedings are the collected papers presented at a conference or workshop. They often present preliminary research results, are not usually peer-reviewed, and may not be the final thoughts of the author. Some of these papers, reports, and conference papers are rewritten for later publication in a scientific or scholarly journal that is peer-reviewed.
Pros: provide quick access to research results, may provide more in-depth and spatially relevant information on climate impacts
Cons: may not be peer-reviewed, often hard to find (If you know that an agency or group has studied the problem you’re interested in, you might need to contact them directly to find out whether they have a relevant research report.)
Fact sheets and brochures. Many institutions and organizations, such as the Environmental Protection Agency, Union of Concerned Scientists, produce fact sheets and/or brochures on climate change geared for the non-expert.
Pros: typically presented in a form easily understood by the educated layperson
Cons: summary format, lacks details and nuances necessary for confident use of the information in planning and analysis, often prepared by advocacy groups with possible biases, sources often not referenced (making it difficult to verify information and/or find more details on specific points).
Media Stories. National and local media outlets are increasingly reporting on the projected impacts of climate change. However, it is difficult for news stories to adequately convey the nuances and caveats associated with scientific information. Before using any of the information cited in a media story it is essential to verify it with the quoted source. Obtaining the more detailed information underlying that presented in the story helps ensure that the results are relevant for the application you have in mind.
Pros: local media often focus on impacts projected for your specific community or region, presented in an easily understandable form.
Cons: information must be verified with original source before using.
Sources: Robert E. Kennedy Library 2002, IPCC 2004, Stirling 2004, Center for Democracy and Technology 2007, National Academy of Sciences 2007.
•
•
•
•
•
•
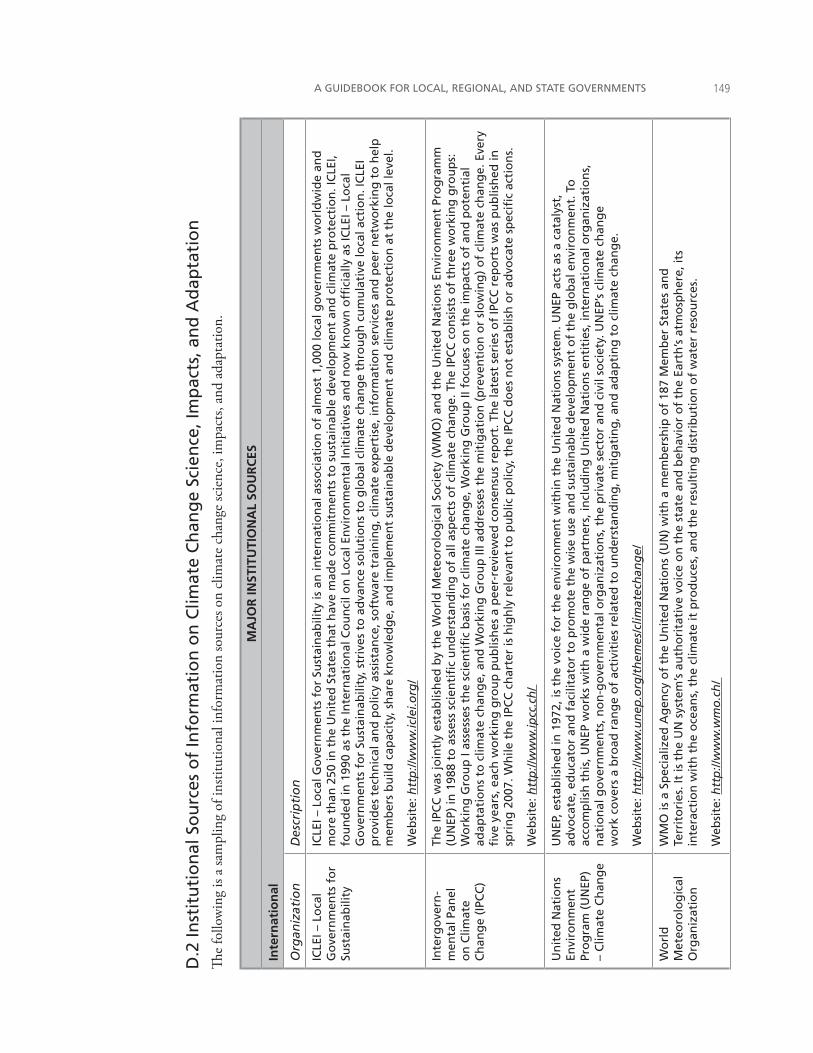
A GUIDEBOOK FOR LOCAL, REGIONAL, AND STATE GOVERNMENTS ���
D.2
Inst
itu
tio
nal
So
urc
es o
f In
form
atio
n o
n C
limat
e C
han
ge
Scie
nce
, Im
pac
ts, a
nd
Ad
apta
tio
n
The
follo
win
g is
a sa
mpl
ing
of in
stitu
tiona
l inf
orm
atio
n so
urce
s on
clim
ate
chan
ge sc
ienc
e, im
pact
s, an
d ad
apta
tion.
MA
JOR
INST
ITU
TIO
NA
L SO
UR
CES
Inte
rnat
ion
al
Org
aniz
atio
nD
escr
ipti
on
ICLE
I – L
oca
l G
ove
rnm
ents
fo
r Su
stai
nab
ility
ICLE
I – L
oca
l Go
vern
men
ts f
or
Sust
ain
abili
ty is
an
inte
rnat
ion
al a
sso
ciat
ion
of
alm
ost
1,0
00 lo
cal g
ove
rnm
ents
wo
rld
wid
e an
d
mo
re t
han
250
in t
he
Un
ited
Sta
tes
that
hav
e m
ade
com
mit
men
ts t
o s
ust
ain
able
dev
elo
pm
ent
and
clim
ate
pro
tect
ion
. IC
LEI,
fou
nd
ed in
199
0 as
th
e In
tern
atio
nal
Co
un
cil o
n L
oca
l En
viro
nm
enta
l In
itia
tive
s an
d n
ow
kn
ow
n o
ffici
ally
as
ICLE
I – L
oca
l G
ove
rnm
ents
fo
r Su
stai
nab
ility
, str
ives
to
ad
van
ce s
olu
tio
ns
to g
lob
al c
limat
e ch
ang
e th
rou
gh
cu
mu
lati
ve lo
cal a
ctio
n. I
CLE
I p
rovi
des
tec
hn
ical
an
d p
olic
y as
sist
ance
, so
ftw
are
trai
nin
g, c
limat
e ex
per
tise
, in
form
atio
n s
ervi
ces
and
pee
r n
etw
ork
ing
to
hel
p
mem
ber
s b
uild
cap
acit
y, s
har
e kn
ow
led
ge,
an
d im
ple
men
t su
stai
nab
le d
evel
op
men
t an
d c
limat
e p
rote
ctio
n a
t th
e lo
cal l
evel
.
Web
site
: htt
p://
ww
w.ic
lei.o
rg/
Inte
rgo
vern
-m
enta
l Pan
el
on
Clim
ate
Ch
ang
e (I
PCC
)
The
IPC
C w
as jo
intl
y es
tab
lish
ed b
y th
e W
orl
d M
eteo
rolo
gic
al S
oci
ety
(WM
O)
and
th
e U
nit
ed N
atio
ns
Envi
ron
men
t Pr
og
ram
m
(UN
EP)
in 1
988
to a
sses
s sc
ien
tifi
c u
nd
erst
and
ing
of
all a
spec
ts o
f cl
imat
e ch
ang
e. T
he
IPC
C c
on
sist
s o
f th
ree
wo
rkin
g g
rou
ps:
W
ork
ing
Gro
up
I as
sess
es t
he
scie
nti
fic
bas
is f
or
clim
ate
chan
ge,
Wo
rkin
g G
rou
p II
fo
cuse
s o
n t
he
imp
acts
of
and
po
ten
tial
ad
apta
tio
ns
to c
limat
e ch
ang
e, a
nd
Wo
rkin
g G
rou
p II
I ad
dre
sses
th
e m
itig
atio
n (
pre
ven
tio
n o
r sl
ow
ing
) o
f cl
imat
e ch
ang
e. E
very
fi
ve y
ears
, eac
h w
ork
ing
gro
up
pu
blis
hes
a p
eer-
revi
ewed
co
nse
nsu
s re
po
rt. T
he
late
st s
erie
s o
f IP
CC
rep
ort
s w
as p
ub
lish
ed in
sp
rin
g 2
007.
Wh
ile t
he
IPC
C c
har
ter
is h
igh
ly r
elev
ant
to p
ub
lic p
olic
y, t
he
IPC
C d
oes
no
t es
tab
lish
or
advo
cate
sp
ecifi
c ac
tio
ns.
Web
site
: htt
p://
ww
w.ip
cc.c
h/
Un
ited
Nat
ion
s En
viro
nm
ent
Pro
gra
m (
UN
EP)
– C
limat
e C
han
ge
UN
EP, e
stab
lish
ed in
197
2, is
th
e vo
ice
for
the
envi
ron
men
t w
ith
in t
he
Un
ited
Nat
ion
s sy
stem
. UN
EP a
cts
as a
cat
alys
t,
advo
cate
, ed
uca
tor
and
fac
ilita
tor
to p
rom
ote
th
e w
ise
use
an
d s
ust
ain
able
dev
elo
pm
ent
of
the
glo
bal
en
viro
nm
ent.
To
ac
com
plis
h t
his
, UN
EP w
ork
s w
ith
a w
ide
ran
ge
of
par
tner
s, in
clu
din
g U
nit
ed N
atio
ns
enti
ties
, in
tern
atio
nal
org
aniz
atio
ns,
n
atio
nal
go
vern
men
ts, n
on
-go
vern
men
tal o
rgan
izat
ion
s, t
he
pri
vate
sec
tor
and
civ
il so
ciet
y. U
NEP
’s c
limat
e ch
ang
e w
ork
co
vers
a b
road
ran
ge
of
acti
viti
es r
elat
ed t
o u
nd
erst
and
ing
, mit
igat
ing
, an
d a
dap
tin
g t
o c
limat
e ch
ang
e.
Web
site
: htt
p://
ww
w.u
nep
.org
/th
emes
/clim
atec
han
ge/
Wo
rld
M
eteo
rolo
gic
al
Org
aniz
atio
n
WM
O is
a S
pec
ializ
ed A
gen
cy o
f th
e U
nit
ed N
atio
ns
(UN
) w
ith
a m
emb
ersh
ip o
f 18
7 M
emb
er S
tate
s an
d
Terr
ito
ries
. It
is t
he
UN
sys
tem
’s a
uth
ori
tati
ve v
oic
e o
n t
he
stat
e an
d b
ehav
ior
of
the
Eart
h’s
atm
osp
her
e, it
s in
tera
ctio
n w
ith
th
e o
cean
s, t
he
clim
ate
it p
rod
uce
s, a
nd
th
e re
sult
ing
dis
trib
uti
on
of
wat
er r
eso
urc
es.
Web
site
: htt
p://
ww
w.w
mo
.ch
/
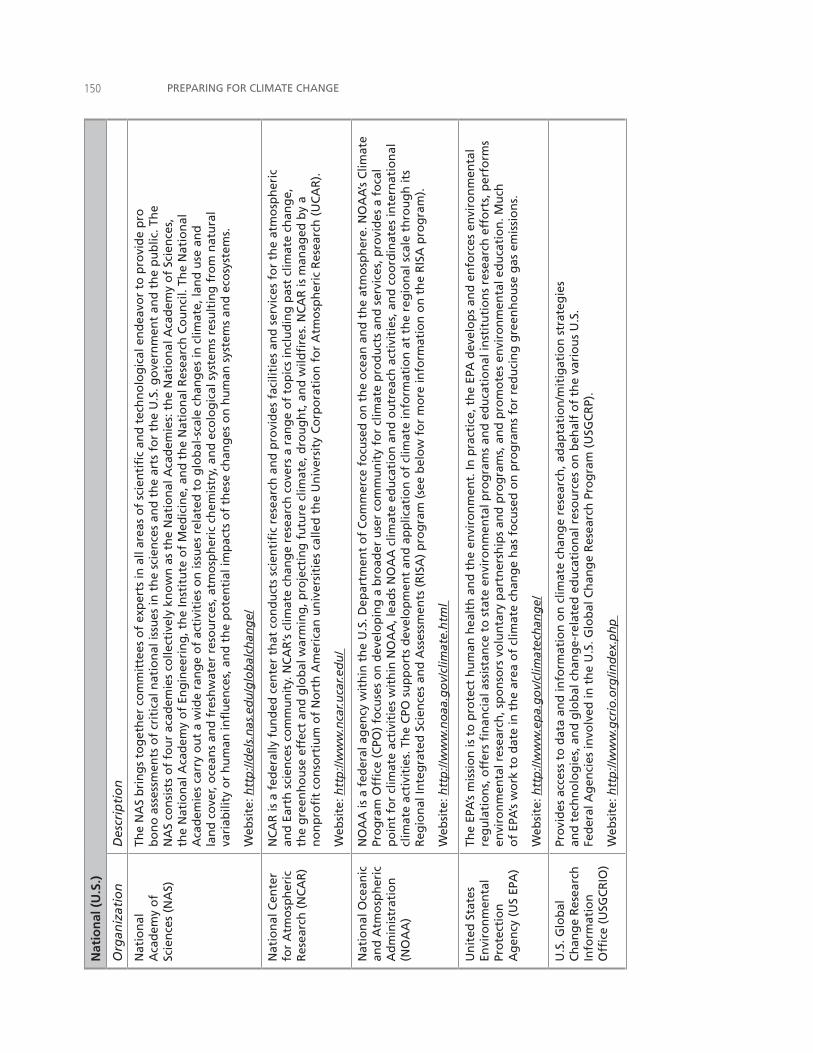
PREPARING FOR CLIMATE CHANGE��0N
atio
nal
(U
.S.)
Org
aniz
atio
nD
escr
ipti
on
Nat
ion
al
Aca
dem
y o
f Sc
ien
ces
(NA
S)
The
NA
S b
rin
gs
tog
eth
er c
om
mit
tees
of
exp
erts
in a
ll ar
eas
of
scie
nti
fic
and
tec
hn
olo
gic
al e
nd
eavo
r to
pro
vid
e p
ro
bo
no
ass
essm
ents
of
crit
ical
nat
ion
al is
sues
in t
he
scie
nce
s an
d t
he
arts
fo
r th
e U
.S. g
ove
rnm
ent
and
th
e p
ub
lic. T
he
NA
S co
nsi
sts
of
fou
r ac
adem
ies
colle
ctiv
ely
kno
wn
as
the
Nat
ion
al A
cad
emie
s: t
he
Nat
ion
al A
cad
emy
of
Scie
nce
s,
the
Nat
ion
al A
cad
emy
of
Eng
inee
rin
g, t
he
Inst
itu
te o
f M
edic
ine,
an
d t
he
Nat
ion
al R
esea
rch
Co
un
cil.
The
Nat
ion
al
Aca
dem
ies
carr
y o
ut
a w
ide
ran
ge
of
acti
viti
es o
n is
sues
rel
ated
to
glo
bal
-sca
le c
han
ges
in c
limat
e, la
nd
use
an
d
lan
d c
ove
r, o
cean
s an
d f
resh
wat
er r
eso
urc
es, a
tmo
sph
eric
ch
emis
try,
an
d e
colo
gic
al s
yste
ms
resu
ltin
g f
rom
nat
ura
l va
riab
ility
or
hu
man
infl
uen
ces,
an
d t
he
po
ten
tial
imp
acts
of
thes
e ch
ang
es o
n h
um
an s
yste
ms
and
eco
syst
ems.
Web
site
: htt
p://
del
s.n
as.e
du
/glo
bal
chan
ge/
Nat
ion
al C
ente
r fo
r A
tmo
sph
eric
R
esea
rch
(N
CA
R)
NC
AR
is a
fed
eral
ly f
un
ded
cen
ter
that
co
nd
uct
s sc
ien
tifi
c re
sear
ch a
nd
pro
vid
es f
acili
ties
an
d s
ervi
ces
for
the
atm
osp
her
ic
and
Ear
th s
cien
ces
com
mu
nit
y. N
CA
R’s
clim
ate
chan
ge
rese
arch
co
vers
a r
ang
e o
f to
pic
s in
clu
din
g p
ast
clim
ate
chan
ge,
th
e g
reen
ho
use
eff
ect
and
glo
bal
war
min
g, p
roje
ctin
g f
utu
re c
limat
e, d
rou
gh
t, a
nd
wild
fire
s. N
CA
R is
man
aged
by
a n
on
pro
fit
con
sort
ium
of
No
rth
Am
eric
an u
niv
ersi
ties
cal
led
th
e U
niv
ersi
ty C
orp
ora
tio
n f
or
Atm
osp
her
ic R
esea
rch
(U
CA
R).
Web
site
: htt
p://
ww
w.n
car.u
car.e
du
/
Nat
ion
al O
cean
ic
and
Atm
osp
her
ic
Ad
min
istr
atio
n
(NO
AA
)
NO
AA
is a
fed
eral
ag
ency
wit
hin
th
e U
.S. D
epar
tmen
t o
f C
om
mer
ce f
ocu
sed
on
th
e o
cean
an
d t
he
atm
osp
her
e. N
OA
A’s
Clim
ate
Pro
gra
m O
ffice
(C
PO)
focu
ses
on
dev
elo
pin
g a
bro
ader
use
r co
mm
un
ity
for
clim
ate
pro
du
cts
and
ser
vice
s, p
rovi
des
a f
oca
l p
oin
t fo
r cl
imat
e ac
tivi
ties
wit
hin
NO
AA
, lea
ds
NO
AA
clim
ate
edu
cati
on
an
d o
utr
each
act
ivit
ies,
an
d c
oo
rdin
ates
inte
rnat
ion
al
clim
ate
acti
viti
es. T
he
CPO
su
pp
ort
s d
evel
op
men
t an
d a
pp
licat
ion
of
clim
ate
info
rmat
ion
at
the
reg
ion
al s
cale
th
rou
gh
its
Reg
ion
al In
teg
rate
d S
cien
ces
and
Ass
essm
ents
(R
ISA
) p
rog
ram
(se
e b
elo
w f
or
mo
re in
form
atio
n o
n t
he
RIS
A p
rog
ram
).
Web
site
: htt
p://
ww
w.n
oaa
.go
v/cl
imat
e.h
tml
Un
ited
Sta
tes
Envi
ron
men
tal
Pro
tect
ion
A
gen
cy (
US
EPA
)
The
EPA
’s m
issi
on
is t
o p
rote
ct h
um
an h
ealt
h a
nd
th
e en
viro
nm
ent.
In p
ract
ice,
th
e EP
A d
evel
op
s an
d e
nfo
rces
en
viro
nm
enta
l re
gu
lati
on
s, o
ffer
s fi
nan
cial
ass
ista
nce
to
sta
te e
nvi
ron
men
tal p
rog
ram
s an
d e
du
cati
on
al in
stit
uti
on
s re
sear
ch e
ffo
rts,
per
form
s en
viro
nm
enta
l res
earc
h, s
po
nso
rs v
olu
nta
ry p
artn
ersh
ips
and
pro
gra
ms,
an
d p
rom
ote
s en
viro
nm
enta
l ed
uca
tio
n. M
uch
o
f EP
A’s
wo
rk t
o d
ate
in t
he
area
of
clim
ate
chan
ge
has
fo
cuse
d o
n p
rog
ram
s fo
r re
du
cin
g g
reen
ho
use
gas
em
issi
on
s.
Web
site
: htt
p://
ww
w.e
pa.
go
v/cl
imat
ech
ang
e/
U.S
. Glo
bal
C
han
ge
Res
earc
h
Info
rmat
ion
O
ffice
(U
SGC
RIO
)
Pro
vid
es a
cces
s to
dat
a an
d in
form
atio
n o
n c
limat
e ch
ang
e re
sear
ch, a
dap
tati
on
/mit
igat
ion
str
ateg
ies
and
tec
hn
olo
gie
s, a
nd
glo
bal
ch
ang
e-re
late
d e
du
cati
on
al r
eso
urc
es o
n b
ehal
f o
f th
e va
rio
us
U.S
. Fe
der
al A
gen
cies
invo
lved
in t
he
U.S
. Glo
bal
Ch
ang
e R
esea
rch
Pro
gra
m (
USG
CR
P).
Web
site
: htt
p://
ww
w.g
crio
.org
/ind
ex.p
hp
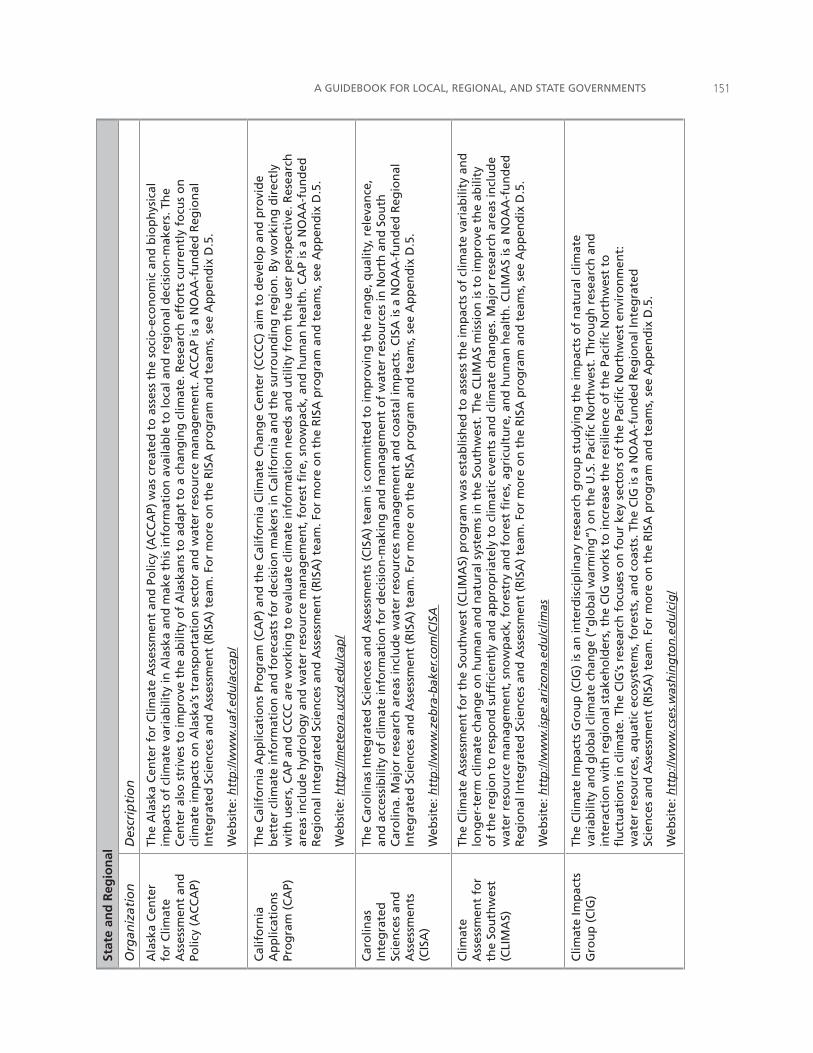
A GUIDEBOOK FOR LOCAL, REGIONAL, AND STATE GOVERNMENTS ���
Stat
e an
d R
egio
nal
Org
aniz
atio
nD
escr
ipti
on
Ala
ska
Cen
ter
for
Clim
ate
Ass
essm
ent
and
Po
licy
(AC
CA
P)
The
Ala
ska
Cen
ter
for
Clim
ate
Ass
essm
ent
and
Po
licy
(AC
CA
P) w
as c
reat
ed t
o a
sses
s th
e so
cio
-eco
no
mic
an
d b
iop
hys
ical
im
pac
ts o
f cl
imat
e va
riab
ility
in A
lask
a an
d m
ake
this
info
rmat
ion
ava
ilab
le t
o lo
cal a
nd
reg
ion
al d
ecis
ion
-mak
ers.
Th
e C
ente
r al
so s
triv
es t
o im
pro
ve t
he
abili
ty o
f A
lask
ans
to a
dap
t to
a c
han
gin
g c
limat
e. R
esea
rch
eff
ort
s cu
rren
tly
focu
s o
n
clim
ate
imp
acts
on
Ala
ska’
s tr
ansp
ort
atio
n s
ecto
r an
d w
ater
res
ou
rce
man
agem
ent.
AC
CA
P is
a N
OA
A-f
un
ded
Reg
ion
al
Inte
gra
ted
Sci
ence
s an
d A
sses
smen
t (R
ISA
) te
am. F
or
mo
re o
n t
he
RIS
A p
rog
ram
an
d t
eam
s, s
ee A
pp
end
ix D
.5.
Web
site
: htt
p://
ww
w.u
af.e
du
/acc
ap/
Cal
ifo
rnia
A
pp
licat
ion
s Pr
og
ram
(C
AP)
The
Cal
ifo
rnia
Ap
plic
atio
ns
Pro
gra
m (
CA
P) a
nd
th
e C
alif
orn
ia C
limat
e C
han
ge
Cen
ter
(CC
CC
) ai
m t
o d
evel
op
an
d p
rovi
de
bet
ter
clim
ate
info
rmat
ion
an
d f
ore
cast
s fo
r d
ecis
ion
mak
ers
in C
alif
orn
ia a
nd
th
e su
rro
un
din
g r
egio
n. B
y w
ork
ing
dir
ectl
y w
ith
use
rs, C
AP
and
CC
CC
are
wo
rkin
g t
o e
valu
ate
clim
ate
info
rmat
ion
nee
ds
and
uti
lity
fro
m t
he
use
r p
ersp
ecti
ve. R
esea
rch
ar
eas
incl
ud
e h
ydro
log
y an
d w
ater
res
ou
rce
man
agem
ent,
fo
rest
fire
, sn
ow
pac
k, a
nd
hu
man
hea
lth
. CA
P is
a N
OA
A-f
un
ded
R
egio
nal
Inte
gra
ted
Sci
ence
s an
d A
sses
smen
t (R
ISA
) te
am. F
or
mo
re o
n t
he
RIS
A p
rog
ram
an
d t
eam
s, s
ee A
pp
end
ix D
.5.
Web
site
: htt
p://
met
eora
.ucs
d.e
du
/cap
/
Car
olin
as
Inte
gra
ted
Sc
ien
ces
and
A
sses
smen
ts
(CIS
A)
The
Car
olin
as In
teg
rate
d S
cien
ces
and
Ass
essm
ents
(C
ISA
) te
am is
co
mm
itte
d t
o im
pro
vin
g t
he
ran
ge,
qu
alit
y, r
elev
ance
, an
d a
cces
sib
ility
of
clim
ate
info
rmat
ion
fo
r d
ecis
ion
-mak
ing
an
d m
anag
emen
t o
f w
ater
res
ou
rces
in N
ort
h a
nd
So
uth
C
aro
lina.
Maj
or
rese
arch
are
as in
clu
de
wat
er r
eso
urc
es m
anag
emen
t an
d c
oas
tal i
mp
acts
. CIS
A is
a N
OA
A-f
un
ded
Reg
ion
al
Inte
gra
ted
Sci
ence
s an
d A
sses
smen
t (R
ISA
) te
am. F
or
mo
re o
n t
he
RIS
A p
rog
ram
an
d t
eam
s, s
ee A
pp
end
ix D
.5.
Web
site
: htt
p://
ww
w.z
ebra
-bak
er.c
om
/CIS
A
Clim
ate
Ass
essm
ent
for
the
Sou
thw
est
(CLI
MA
S)
The
Clim
ate
Ass
essm
ent
for
the
Sou
thw
est
(CLI
MA
S) p
rog
ram
was
est
ablis
hed
to
ass
ess
the
imp
acts
of
clim
ate
vari
abili
ty a
nd
lo
ng
er-t
erm
clim
ate
chan
ge
on
hu
man
an
d n
atu
ral s
yste
ms
in t
he
Sou
thw
est.
Th
e C
LIM
AS
mis
sio
n is
to
imp
rove
th
e ab
ility
o
f th
e re
gio
n t
o r
esp
on
d s
uffi
cien
tly
and
ap
pro
pri
atel
y to
clim
atic
eve
nts
an
d c
limat
e ch
ang
es. M
ajo
r re
sear
ch a
reas
incl
ud
e w
ater
res
ou
rce
man
agem
ent,
sn
ow
pac
k, f
ore
stry
an
d f
ore
st fi
res,
ag
ricu
ltu
re, a
nd
hu
man
hea
lth
. CLI
MA
S is
a N
OA
A-f
un
ded
R
egio
nal
Inte
gra
ted
Sci
ence
s an
d A
sses
smen
t (R
ISA
) te
am. F
or
mo
re o
n t
he
RIS
A p
rog
ram
an
d t
eam
s, s
ee A
pp
end
ix D
.5.
Web
site
: htt
p://
ww
w.is
pe.
ariz
on
a.ed
u/c
limas
Clim
ate
Imp
acts
G
rou
p (
CIG
)Th
e C
limat
e Im
pac
ts G
rou
p (
CIG
) is
an
inte
rdis
cip
linar
y re
sear
ch g
rou
p s
tud
yin
g t
he
imp
acts
of
nat
ura
l clim
ate
vari
abili
ty a
nd
glo
bal
clim
ate
chan
ge
(“g
lob
al w
arm
ing
”) o
n t
he
U.S
. Pac
ific
No
rth
wes
t. T
hro
ug
h r
esea
rch
an
d
inte
ract
ion
wit
h r
egio
nal
sta
keh
old
ers,
th
e C
IG w
ork
s to
incr
ease
th
e re
silie
nce
of
the
Paci
fic
No
rth
wes
t to
fl
uct
uat
ion
s in
clim
ate.
Th
e C
IG’s
res
earc
h f
ocu
ses
on
fo
ur
key
sect
ors
of
the
Paci
fic
No
rth
wes
t en
viro
nm
ent:
w
ater
res
ou
rces
, aq
uat
ic e
cosy
stem
s, f
ore
sts,
an
d c
oas
ts. T
he
CIG
is a
NO
AA
-fu
nd
ed R
egio
nal
Inte
gra
ted
Sc
ien
ces
and
Ass
essm
ent
(RIS
A)
team
. Fo
r m
ore
on
th
e R
ISA
pro
gra
m a
nd
tea
ms,
see
Ap
pen
dix
D.5
.
Web
site
: htt
p://
ww
w.c
ses.
was
hin
gto
n.e
du
/cig
/
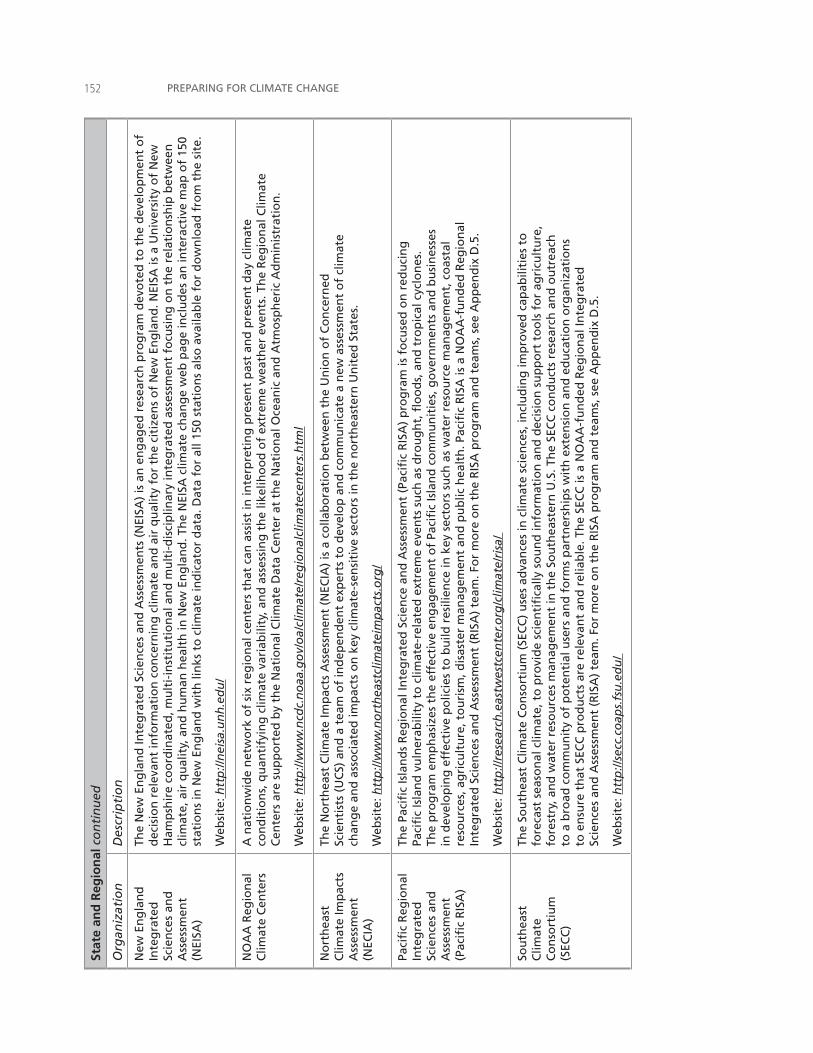
PREPARING FOR CLIMATE CHANGE���St
ate
and
Reg
ion
al c
on
tin
ued
Org
aniz
atio
nD
escr
ipti
on
New
En
gla
nd
In
teg
rate
d
Scie
nce
s an
d
Ass
essm
ent
(NEI
SA)
The
New
En
gla
nd
Inte
gra
ted
Sci
ence
s an
d A
sses
smen
ts (
NEI
SA)
is a
n e
ng
aged
res
earc
h p
rog
ram
dev
ote
d t
o t
he
dev
elo
pm
ent
of
dec
isio
n r
elev
ant
info
rmat
ion
co
nce
rnin
g c
limat
e an
d a
ir q
ual
ity
for
the
citi
zen
s o
f N
ew E
ng
lan
d. N
EISA
is a
Un
iver
sity
of
New
H
amp
shir
e co
ord
inat
ed, m
ult
i-in
stit
uti
on
al a
nd
mu
lti-
dis
cip
linar
y in
teg
rate
d a
sses
smen
t fo
cusi
ng
on
th
e re
lati
on
ship
bet
wee
n
clim
ate,
air
qu
alit
y, a
nd
hu
man
hea
lth
in N
ew E
ng
lan
d. T
he
NEI
SA c
limat
e ch
ang
e w
eb p
age
incl
ud
es a
n in
tera
ctiv
e m
ap o
f 15
0 st
atio
ns
in N
ew E
ng
lan
d w
ith
lin
ks t
o c
limat
e in
dic
ato
r d
ata.
Dat
a fo
r al
l 150
sta
tio
ns
also
ava
ilab
le f
or
do
wn
load
fro
m t
he
site
.
Web
site
: htt
p://
nei
sa.u
nh
.ed
u/
NO
AA
Reg
ion
al
Clim
ate
Cen
ters
A n
atio
nw
ide
net
wo
rk o
f si
x re
gio
nal
cen
ters
th
at c
an a
ssis
t in
inte
rpre
tin
g p
rese
nt
pas
t an
d p
rese
nt
day
clim
ate
con
dit
ion
s, q
uan
tify
ing
clim
ate
vari
abili
ty, a
nd
ass
essi
ng
th
e lik
elih
oo
d o
f ex
trem
e w
eath
er e
ven
ts. T
he
Reg
ion
al C
limat
e C
ente
rs a
re s
up
po
rted
by
the
Nat
ion
al C
limat
e D
ata
Cen
ter
at t
he
Nat
ion
al O
cean
ic a
nd
Atm
osp
her
ic A
dm
inis
trat
ion
.
Web
site
: htt
p://
ww
w.n
cdc.
no
aa.g
ov/
oa/
clim
ate/
reg
ion
alcl
imat
ecen
ters
.htm
l
No
rth
east
C
limat
e Im
pac
ts
Ass
essm
ent
(NEC
IA)
The
No
rth
east
Clim
ate
Imp
acts
Ass
essm
ent
(NEC
IA)
is a
co
llab
ora
tio
n b
etw
een
th
e U
nio
n o
f C
on
cern
ed
Scie
nti
sts
(UC
S) a
nd
a t
eam
of
ind
epen
den
t ex
per
ts t
o d
evel
op
an
d c
om
mu
nic
ate
a n
ew a
sses
smen
t o
f cl
imat
e ch
ang
e an
d a
sso
ciat
ed im
pac
ts o
n k
ey c
limat
e-se
nsi
tive
sec
tors
in t
he
no
rth
east
ern
Un
ited
Sta
tes.
Web
site
: htt
p://
ww
w.n
ort
hea
stcl
imat
eim
pac
ts.o
rg/
Paci
fic
Reg
ion
al
Inte
gra
ted
Sc
ien
ces
and
A
sses
smen
t (P
acifi
c R
ISA
)
The
Paci
fic
Isla
nd
s R
egio
nal
Inte
gra
ted
Sci
ence
an
d A
sses
smen
t (P
acifi
c R
ISA
) p
rog
ram
is f
ocu
sed
on
red
uci
ng
Pa
cifi
c Is
lan
d v
uln
erab
ility
to
clim
ate-
rela
ted
ext
rem
e ev
ents
su
ch a
s d
rou
gh
t, fl
oo
ds,
an
d t
rop
ical
cyc
lon
es.
The
pro
gra
m e
mp
has
izes
th
e ef
fect
ive
eng
agem
ent
of
Paci
fic
Isla
nd
co
mm
un
itie
s, g
ove
rnm
ents
an
d b
usi
nes
ses
in d
evel
op
ing
eff
ecti
ve p
olic
ies
to b
uild
res
ilien
ce in
key
sec
tors
su
ch a
s w
ater
res
ou
rce
man
agem
ent,
co
asta
l re
sou
rces
, ag
ricu
ltu
re, t
ou
rism
, dis
aste
r m
anag
emen
t an
d p
ub
lic h
ealt
h. P
acifi
c R
ISA
is a
NO
AA
-fu
nd
ed R
egio
nal
In
teg
rate
d S
cien
ces
and
Ass
essm
ent
(RIS
A)
team
. Fo
r m
ore
on
th
e R
ISA
pro
gra
m a
nd
tea
ms,
see
Ap
pen
dix
D.5
.
Web
site
: htt
p://
rese
arch
.eas
twes
tcen
ter.o
rg/c
limat
e/ri
sa/
Sou
thea
st
Clim
ate
Co
nso
rtiu
m
(SEC
C)
The
Sou
thea
st C
limat
e C
on
sort
ium
(SE
CC
) u
ses
adva
nce
s in
clim
ate
scie
nce
s, in
clu
din
g im
pro
ved
cap
abili
ties
to
fo
reca
st s
easo
nal
clim
ate,
to
pro
vid
e sc
ien
tifi
cally
so
un
d in
form
atio
n a
nd
dec
isio
n s
up
po
rt t
oo
ls f
or
agri
cult
ure
, fo
rest
ry, a
nd
wat
er r
eso
urc
es m
anag
emen
t in
th
e So
uth
east
ern
U.S
. Th
e SE
CC
co
nd
uct
s re
sear
ch a
nd
ou
trea
ch
to a
bro
ad c
om
mu
nit
y o
f p
ote
nti
al u
sers
an
d f
orm
s p
artn
ersh
ips
wit
h e
xten
sio
n a
nd
ed
uca
tio
n o
rgan
izat
ion
s to
en
sure
th
at S
ECC
pro
du
cts
are
rele
van
t an
d r
elia
ble
. Th
e SE
CC
is a
NO
AA
-fu
nd
ed R
egio
nal
Inte
gra
ted
Sc
ien
ces
and
Ass
essm
ent
(RIS
A)
team
. Fo
r m
ore
on
th
e R
ISA
pro
gra
m a
nd
tea
ms,
see
Ap
pen
dix
D.5
.
Web
site
: htt
p://
secc
.co
aps.
fsu
.ed
u/
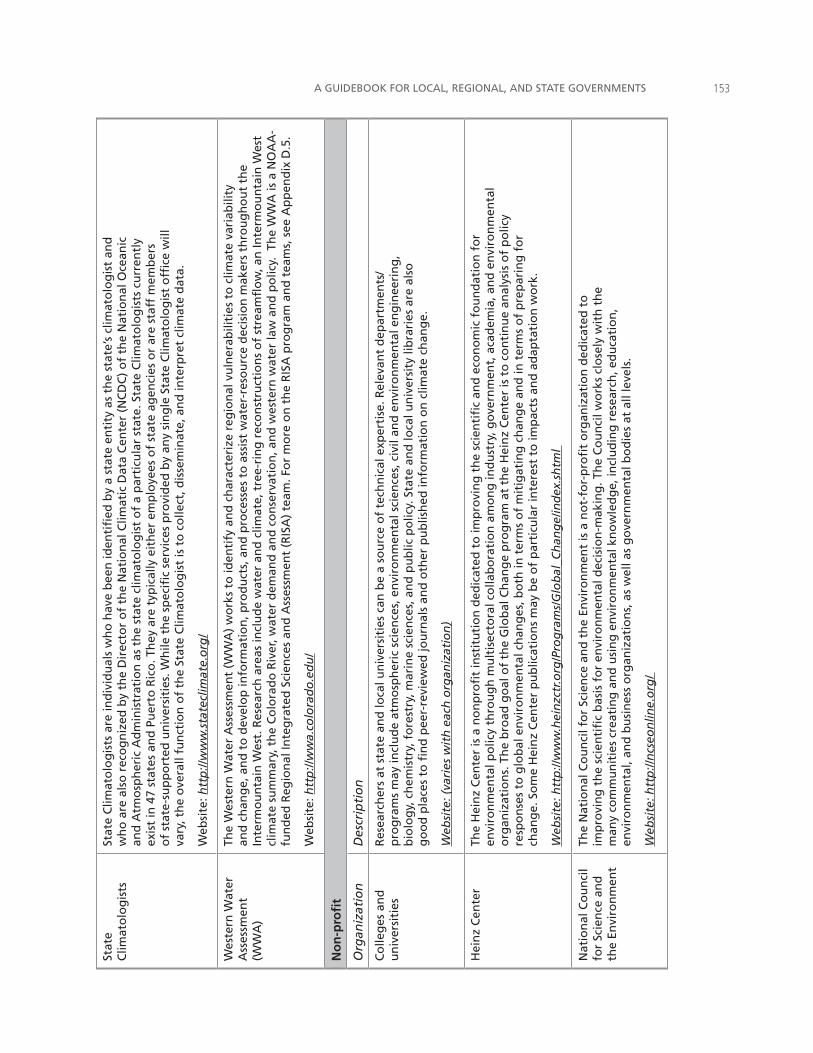
A GUIDEBOOK FOR LOCAL, REGIONAL, AND STATE GOVERNMENTS ���
Stat
e C
limat
olo
gis
tsSt
ate
Clim
ato
log
ists
are
ind
ivid
ual
s w
ho
hav
e b
een
iden
tifi
ed b
y a
stat
e en
tity
as
the
stat
e’s
clim
ato
log
ist
and
w
ho
are
als
o r
eco
gn
ized
by
the
Dir
ecto
r o
f th
e N
atio
nal
Clim
atic
Dat
a C
ente
r (N
CD
C)
of
the
Nat
ion
al O
cean
ic
and
Atm
osp
her
ic A
dm
inis
trat
ion
as
the
stat
e cl
imat
olo
gis
t o
f a
par
ticu
lar
stat
e. S
tate
Clim
ato
log
ists
cu
rren
tly
exis
t in
47
stat
es a
nd
Pu
erto
Ric
o. T
hey
are
typ
ical
ly e
ith
er e
mp
loye
es o
f st
ate
agen
cies
or
are
staf
f m
emb
ers
of
stat
e-su
pp
ort
ed u
niv
ersi
ties
. Wh
ile t
he
spec
ific
serv
ices
pro
vid
ed b
y an
y si
ng
le S
tate
Clim
ato
log
ist
offi
ce w
ill
vary
, th
e o
vera
ll fu
nct
ion
of
the
Stat
e C
limat
olo
gis
t is
to
co
llect
, dis
sem
inat
e, a
nd
inte
rpre
t cl
imat
e d
ata.
Web
site
: htt
p://
ww
w.s
tate
clim
ate.
org
/
Wes
tern
Wat
er
Ass
essm
ent
(WW
A)
The
Wes
tern
Wat
er A
sses
smen
t (W
WA
) w
ork
s to
iden
tify
an
d c
har
acte
rize
reg
ion
al v
uln
erab
iliti
es t
o c
limat
e va
riab
ility
an
d c
han
ge,
an
d t
o d
evel
op
info
rmat
ion
, pro
du
cts,
an
d p
roce
sses
to
ass
ist
wat
er-r
eso
urc
e d
ecis
ion
mak
ers
thro
ug
ho
ut
the
Inte
rmo
un
tain
Wes
t. R
esea
rch
are
as in
clu
de
wat
er a
nd
clim
ate,
tre
e-ri
ng
rec
on
stru
ctio
ns
of
stre
amfl
ow
, an
Inte
rmo
un
tain
Wes
t cl
imat
e su
mm
ary,
th
e C
olo
rad
o R
iver
, wat
er d
eman
d a
nd
co
nse
rvat
ion
, an
d w
este
rn w
ater
law
an
d p
olic
y. T
he
WW
A is
a N
OA
A-
fun
ded
Reg
ion
al In
teg
rate
d S
cien
ces
and
Ass
essm
ent
(RIS
A)
team
. Fo
r m
ore
on
th
e R
ISA
pro
gra
m a
nd
tea
ms,
see
Ap
pen
dix
D.5
.
Web
site
: htt
p://
ww
a.co
lora
do
.ed
u/
No
n-p
rofi
t
Org
aniz
atio
nD
escr
ipti
on
Co
lleg
es a
nd
u
niv
ersi
ties
R
esea
rch
ers
at s
tate
an
d lo
cal u
niv
ersi
ties
can
be
a so
urc
e o
f te
chn
ical
exp
erti
se. R
elev
ant
dep
artm
ents
/p
rog
ram
s m
ay in
clu
de
atm
osp
her
ic s
cien
ces,
en
viro
nm
enta
l sci
ence
s, c
ivil
and
en
viro
nm
enta
l en
gin
eeri
ng
, b
iolo
gy,
ch
emis
try,
fo
rest
ry, m
arin
e sc
ien
ces,
an
d p
ub
lic p
olic
y. S
tate
an
d lo
cal u
niv
ersi
ty li
bra
ries
are
als
o
go
od
pla
ces
to fi
nd
pee
r-re
view
ed jo
urn
als
and
oth
er p
ub
lish
ed in
form
atio
n o
n c
limat
e ch
ang
e.
Web
site
: (va
ries
wit
h e
ach
org
aniz
atio
n)
Hei
nz
Cen
ter
The
Hei
nz
Cen
ter
is a
no
np
rofi
t in
stit
uti
on
ded
icat
ed t
o im
pro
vin
g t
he
scie
nti
fic
and
eco
no
mic
fo
un
dat
ion
fo
r en
viro
nm
enta
l po
licy
thro
ug
h m
ult
isec
tora
l co
llab
ora
tio
n a
mo
ng
ind
ust
ry, g
ove
rnm
ent,
aca
dem
ia, a
nd
en
viro
nm
enta
l o
rgan
izat
ion
s. T
he
bro
ad g
oal
of
the
Glo
bal
Ch
ang
e p
rog
ram
at
the
Hei
nz
Cen
ter
is t
o c
on
tin
ue
anal
ysis
of
po
licy
resp
on
ses
to g
lob
al e
nvi
ron
men
tal c
han
ges
, bo
th in
ter
ms
of
mit
igat
ing
ch
ang
e an
d in
ter
ms
of
pre
par
ing
fo
r ch
ang
e. S
om
e H
ein
z C
ente
r p
ub
licat
ion
s m
ay b
e o
f p
arti
cula
r in
tere
st t
o im
pac
ts a
nd
ad
apta
tio
n w
ork
.
Web
site
: htt
p://
ww
w.h
ein
zctr
.org
/Pro
gra
ms/
Glo
bal
_Ch
ang
e/in
dex
.sh
tml
Nat
ion
al C
ou
nci
l fo
r Sc
ien
ce a
nd
th
e En
viro
nm
ent
The
Nat
ion
al C
ou
nci
l fo
r Sc
ien
ce a
nd
th
e En
viro
nm
ent
is a
no
t-fo
r-p
rofi
t o
rgan
izat
ion
ded
icat
ed t
o
imp
rovi
ng
th
e sc
ien
tifi
c b
asis
fo
r en
viro
nm
enta
l dec
isio
n-m
akin
g. T
he
Co
un
cil w
ork
s cl
ose
ly w
ith
th
e m
any
com
mu
nit
ies
crea
tin
g a
nd
usi
ng
en
viro
nm
enta
l kn
ow
led
ge,
incl
ud
ing
res
earc
h, e
du
cati
on
, en
viro
nm
enta
l, an
d b
usi
nes
s o
rgan
izat
ion
s, a
s w
ell a
s g
ove
rnm
enta
l bo
die
s at
all
leve
ls.
Web
site
: htt
p://
ncs
eon
line.
org
/
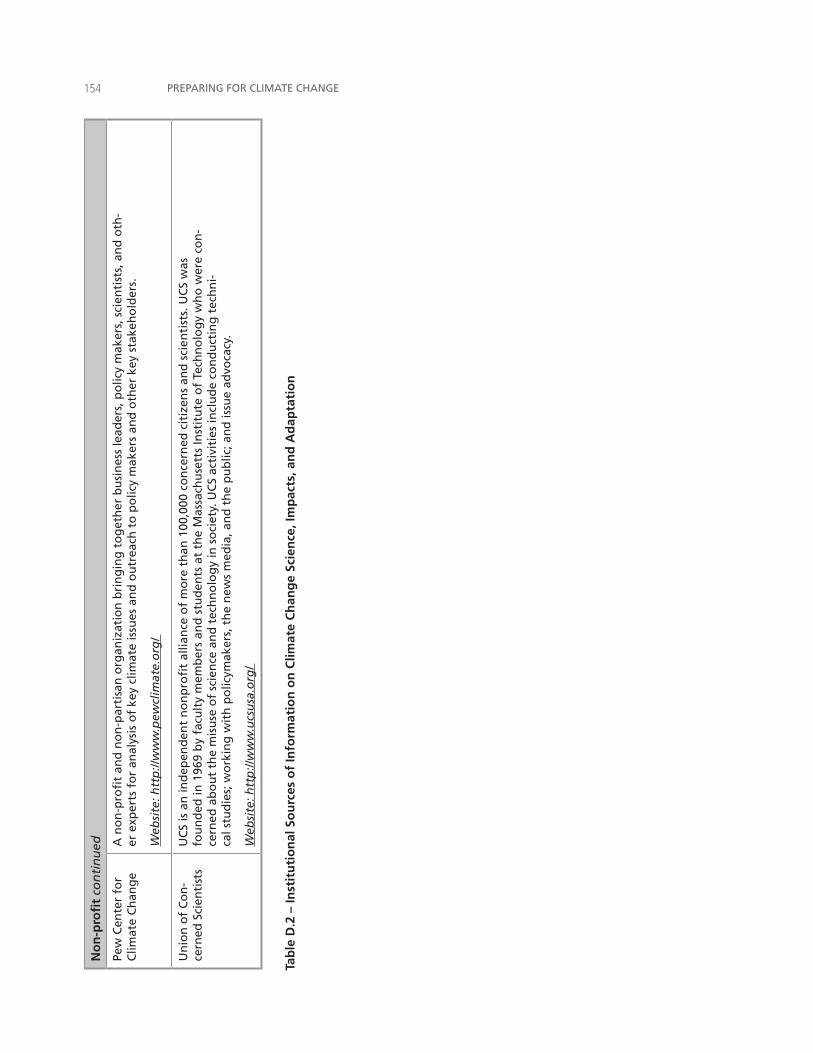
PREPARING FOR CLIMATE CHANGE���N
on
-pro
fit
con
tin
ued
Pew
Cen
ter
for
Clim
ate
Ch
ang
eA
no
n-p
rofi
t an
d n
on
-par
tisa
n o
rgan
izat
ion
bri
ng
ing
to
get
her
bu
sin
ess
lead
ers,
po
licy
mak
ers,
sci
enti
sts,
an
d o
th-
er e
xper
ts f
or
anal
ysis
of
key
clim
ate
issu
es a
nd
ou
trea
ch t
o p
olic
y m
aker
s an
d o
ther
key
sta
keh
old
ers.
Web
site
: htt
p://
ww
w.p
ewcl
imat
e.o
rg/
Un
ion
of
Co
n-
cern
ed S
cien
tist
sU
CS
is a
n in
dep
end
ent
no
np
rofi
t al
lian
ce o
f m
ore
th
an 1
00,0
00 c
on
cern
ed c
itiz
ens
and
sci
enti
sts.
UC
S w
as
fou
nd
ed in
196
9 b
y fa
cult
y m
emb
ers
and
stu
den
ts a
t th
e M
assa
chu
sett
s In
stit
ute
of
Tech
no
log
y w
ho
wer
e co
n-
cern
ed a
bo
ut
the
mis
use
of
scie
nce
an
d t
ech
no
log
y in
so
ciet
y. U
CS
acti
viti
es in
clu
de
con
du
ctin
g t
ech
ni-
cal s
tud
ies;
wo
rkin
g w
ith
po
licym
aker
s, t
he
new
s m
edia
, an
d t
he
pu
blic
; an
d is
sue
advo
cacy
.
Web
site
: htt
p://
ww
w.u
csu
sa.o
rg/
Tab
le D
.2 –
Inst
itu
tio
nal
So
urc
es o
f In
form
atio
n o
n C
limat
e C
han
ge
Scie
nce
, Im
pac
ts, a
nd
Ad
apta
tio
n
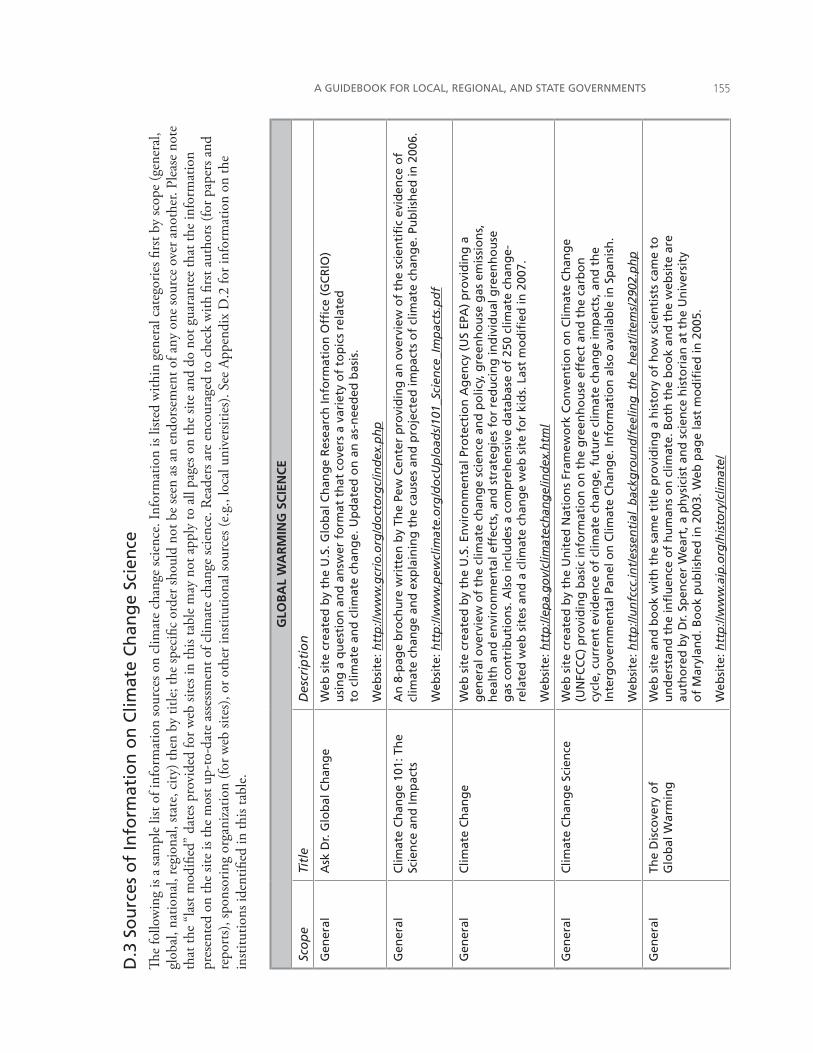
A GUIDEBOOK FOR LOCAL, REGIONAL, AND STATE GOVERNMENTS ���
D.3
So
urc
es o
f In
form
atio
n o
n C
limat
e C
han
ge
Scie
nce
The
follo
win
g is
a sa
mpl
e lis
t of i
nfor
mat
ion
sour
ces o
n cl
imat
e ch
ange
scie
nce.
Info
rmat
ion
is lis
ted
with
in g
ener
al c
ateg
orie
s firs
t by
scop
e (g
ener
al,
glob
al, n
atio
nal,
regi
onal
, sta
te, c
ity) t
hen
by ti
tle; t
he sp
ecifi
c or
der s
houl
d no
t be
seen
as a
n en
dors
emen
t of a
ny o
ne so
urce
ove
r ano
ther
. Ple
ase
note
th
at th
e “l
ast m
odifi
ed”
date
s pro
vide
d fo
r web
site
s in
this
tabl
e m
ay n
ot a
pply
to a
ll pa
ges o
n th
e sit
e an
d do
not
gua
rant
ee th
at th
e in
form
atio
n pr
esen
ted
on th
e sit
e is
the
mos
t up-
to-d
ate
asse
ssm
ent o
f clim
ate
chan
ge sc
ienc
e. R
eade
rs a
re e
ncou
rage
d to
che
ck w
ith fi
rst a
utho
rs (f
or p
aper
s and
re
port
s), s
pons
orin
g or
gani
zatio
n (fo
r web
site
s), o
r oth
er in
stitu
tiona
l sou
rces
(e.g
., lo
cal u
nive
rsiti
es).
See
Appe
ndix
D.2
for i
nfor
mat
ion
on th
e in
stitu
tions
iden
tified
in th
is ta
ble.
GLO
BA
L W
AR
MIN
G S
CIE
NC
E
Sco
pe
Titl
eD
escr
ipti
on
Gen
eral
Ask
Dr.
Glo
bal
Ch
ang
eW
eb s
ite
crea
ted
by
the
U.S
. Glo
bal
Ch
ang
e R
esea
rch
Info
rmat
ion
Offi
ce (
GC
RIO
) u
sin
g a
qu
esti
on
an
d a
nsw
er f
orm
at t
hat
co
vers
a v
arie
ty o
f to
pic
s re
late
d
to c
limat
e an
d c
limat
e ch
ang
e. U
pd
ated
on
an
as-
nee
ded
bas
is.
Web
site
: htt
p://
ww
w.g
crio
.org
/do
cto
rgc/
ind
ex.p
hp
Gen
eral
Clim
ate
Ch
ang
e 10
1: T
he
Scie
nce
an
d Im
pac
tsA
n 8
-pag
e b
roch
ure
wri
tten
by
The
Pew
Cen
ter
pro
vid
ing
an
ove
rvie
w o
f th
e sc
ien
tifi
c ev
iden
ce o
f cl
imat
e ch
ang
e an
d e
xpla
inin
g t
he
cau
ses
and
pro
ject
ed im
pac
ts o
f cl
imat
e ch
ang
e. P
ub
lish
ed in
200
6.
Web
site
: htt
p://
ww
w.p
ewcl
imat
e.o
rg/d
ocU
plo
ads/
101_
Scie
nce
_Im
pac
ts.p
df
Gen
eral
Clim
ate
Ch
ang
eW
eb s
ite
crea
ted
by
the
U.S
. En
viro
nm
enta
l Pro
tect
ion
Ag
ency
(U
S EP
A)
pro
vid
ing
a
gen
eral
ove
rvie
w o
f th
e cl
imat
e ch
ang
e sc
ien
ce a
nd
po
licy,
gre
enh
ou
se g
as e
mis
sio
ns,
h
ealt
h a
nd
en
viro
nm
enta
l eff
ects
, an
d s
trat
egie
s fo
r re
du
cin
g in
div
idu
al g
reen
ho
use
g
as c
on
trib
uti
on
s. A
lso
incl
ud
es a
co
mp
reh
ensi
ve d
atab
ase
of
250
clim
ate
chan
ge-
rela
ted
web
sit
es a
nd
a c
limat
e ch
ang
e w
eb s
ite
for
kid
s. L
ast
mo
difi
ed in
200
7.
Web
site
: htt
p://
epa.
go
v/cl
imat
ech
ang
e/in
dex
.htm
l
Gen
eral
Clim
ate
Ch
ang
e Sc
ien
ceW
eb s
ite
crea
ted
by
the
Un
ited
Nat
ion
s Fr
amew
ork
Co
nve
nti
on
on
Clim
ate
Ch
ang
e (U
NFC
CC
) p
rovi
din
g b
asic
info
rmat
ion
on
th
e g
reen
ho
use
eff
ect
and
th
e ca
rbo
n
cycl
e, c
urr
ent
evid
ence
of
clim
ate
chan
ge,
fu
ture
clim
ate
chan
ge
imp
acts
, an
d t
he
Inte
rgo
vern
men
tal P
anel
on
Clim
ate
Ch
ang
e. In
form
atio
n a
lso
ava
ilab
le in
Sp
anis
h.
Web
site
: htt
p://
un
fccc
.int/
esse
nti
al_b
ackg
rou
nd
/fee
ling
_th
e_h
eat/
item
s/29
02.p
hp
Gen
eral
The
Dis
cove
ry o
f G
lob
al W
arm
ing
Web
sit
e an
d b
oo
k w
ith
th
e sa
me
titl
e p
rovi
din
g a
his
tory
of
ho
w s
cien
tist
s ca
me
to
un
der
stan
d t
he
infl
uen
ce o
f h
um
ans
on
clim
ate.
Bo
th t
he
bo
ok
and
th
e w
ebsi
te a
re
auth
ore
d b
y D
r. Sp
ence
r W
eart
, a p
hys
icis
t an
d s
cien
ce h
isto
rian
at
the
Un
iver
sity
o
f M
aryl
and
. Bo
ok
pu
blis
hed
in 2
003.
Web
pag
e la
st m
od
ified
in 2
005.
Web
site
: htt
p://
ww
w.a
ip.o
rg/h
isto
ry/c
limat
e/
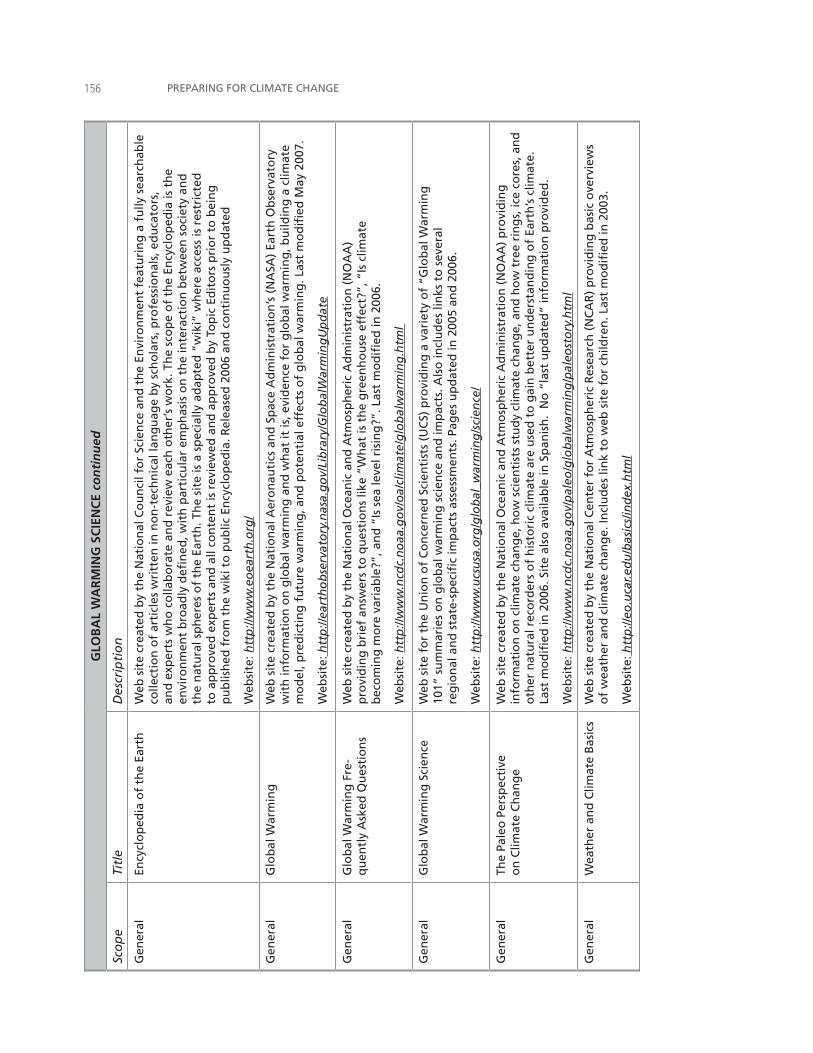
PREPARING FOR CLIMATE CHANGE���G
LOB
AL
WA
RM
ING
SC
IEN
CE
con
tin
ued
Sco
pe
Titl
eD
escr
ipti
on
Gen
eral
Ency
clo
ped
ia o
f th
e Ea
rth
Web
sit
e cr
eate
d b
y th
e N
atio
nal
Co
un
cil f
or
Scie
nce
an
d t
he
Envi
ron
men
t fe
atu
rin
g a
fu
lly s
earc
hab
le
colle
ctio
n o
f ar
ticl
es w
ritt
en in
no
n-t
ech
nic
al la
ng
uag
e b
y sc
ho
lars
, pro
fess
ion
als,
ed
uca
tors
, an
d e
xper
ts w
ho
co
llab
ora
te a
nd
rev
iew
eac
h o
ther
’s w
ork
. Th
e sc
op
e o
f th
e En
cycl
op
edia
is t
he
envi
ron
men
t b
road
ly d
efin
ed, w
ith
par
ticu
lar
emp
has
is o
n t
he
inte
ract
ion
bet
wee
n s
oci
ety
and
th
e n
atu
ral s
ph
eres
of
the
Eart
h. T
he
site
is a
sp
ecia
lly a
dap
ted
“w
iki”
wh
ere
acce
ss is
res
tric
ted
to
ap
pro
ved
exp
erts
an
d a
ll co
nte
nt
is r
evie
wed
an
d a
pp
rove
d b
y To
pic
Ed
ito
rs p
rio
r to
bei
ng
p
ub
lish
ed f
rom
th
e w
iki t
o p
ub
lic E
ncy
clo
ped
ia. R
elea
sed
200
6 an
d c
on
tin
uo
usl
y u
pd
ated
Web
site
: htt
p://
ww
w.e
oea
rth
.org
/
Gen
eral
Glo
bal
War
min
gW
eb s
ite
crea
ted
by
the
Nat
ion
al A
ero
nau
tics
an
d S
pac
e A
dm
inis
trat
ion
’s (
NA
SA)
Eart
h O
bse
rvat
ory
w
ith
info
rmat
ion
on
glo
bal
war
min
g a
nd
wh
at it
is, e
vid
ence
fo
r g
lob
al w
arm
ing
, bu
ildin
g a
clim
ate
mo
del
, pre
dic
tin
g f
utu
re w
arm
ing
, an
d p
ote
nti
al e
ffec
ts o
f g
lob
al w
arm
ing
. Las
t m
od
ified
May
200
7.
Web
site
: htt
p://
eart
ho
bse
rvat
ory
.nas
a.g
ov/
Lib
rary
/Glo
bal
War
min
gU
pd
ate
Gen
eral
Glo
bal
War
min
g F
re-
qu
entl
y A
sked
Qu
esti
on
sW
eb s
ite
crea
ted
by
the
Nat
ion
al O
cean
ic a
nd
Atm
osp
her
ic A
dm
inis
trat
ion
(N
OA
A)
pro
vid
ing
bri
ef a
nsw
ers
to q
ues
tio
ns
like
“Wh
at is
th
e g
reen
ho
use
eff
ect?
”, “
Is c
limat
e b
eco
min
g m
ore
var
iab
le?”
, an
d “
Is s
ea le
vel r
isin
g?”
. Las
t m
od
ified
in 2
006.
Web
site
: htt
p://
ww
w.n
cdc.
no
aa.g
ov/
oa/
clim
ate/
glo
bal
war
min
g.h
tml
Gen
eral
Glo
bal
War
min
g S
cien
ceW
eb s
ite
for
the
Un
ion
of
Co
nce
rned
Sci
enti
sts
(UC
S) p
rovi
din
g a
var
iety
of
“Glo
bal
War
min
g
101”
su
mm
arie
s o
n g
lob
al w
arm
ing
sci
ence
an
d im
pac
ts. A
lso
incl
ud
es li
nks
to
sev
eral
re
gio
nal
an
d s
tate
-sp
ecifi
c im
pac
ts a
sses
smen
ts. P
ages
up
dat
ed in
200
5 an
d 2
006.
Web
site
: htt
p://
ww
w.u
csu
sa.o
rg/g
lob
al_w
arm
ing
/sci
ence
/
Gen
eral
The
Pale
o P
ersp
ecti
ve
on
Clim
ate
Ch
ang
eW
eb s
ite
crea
ted
by
the
Nat
ion
al O
cean
ic a
nd
Atm
osp
her
ic A
dm
inis
trat
ion
(N
OA
A)
pro
vid
ing
in
form
atio
n o
n c
limat
e ch
ang
e, h
ow
sci
enti
sts
stu
dy
clim
ate
chan
ge,
an
d h
ow
tre
e ri
ng
s, ic
e co
res,
an
d
oth
er n
atu
ral r
eco
rder
s o
f h
isto
ric
clim
ate
are
use
d t
o g
ain
bet
ter
un
der
stan
din
g o
f Ea
rth
’s c
limat
e.
Last
mo
difi
ed in
200
6. S
ite
also
ava
ilab
le in
Sp
anis
h.
No
“la
st u
pd
ated
” in
form
atio
n p
rovi
ded
.
Web
site
: htt
p://
ww
w.n
cdc.
no
aa.g
ov/
pal
eo/g
lob
alw
arm
ing
/pal
eost
ory
.htm
l
Gen
eral
Wea
ther
an
d C
limat
e B
asic
sW
eb s
ite
crea
ted
by
the
Nat
ion
al C
ente
r fo
r A
tmo
sph
eric
Res
earc
h (
NC
AR
) p
rovi
din
g b
asic
ove
rvie
ws
of
wea
ther
an
d c
limat
e ch
ang
e. In
clu
des
lin
k to
web
sit
e fo
r ch
ildre
n. L
ast
mo
difi
ed in
200
3.
Web
site
: htt
p://
eo.u
car.e
du
/bas
ics/
ind
ex.h
tml
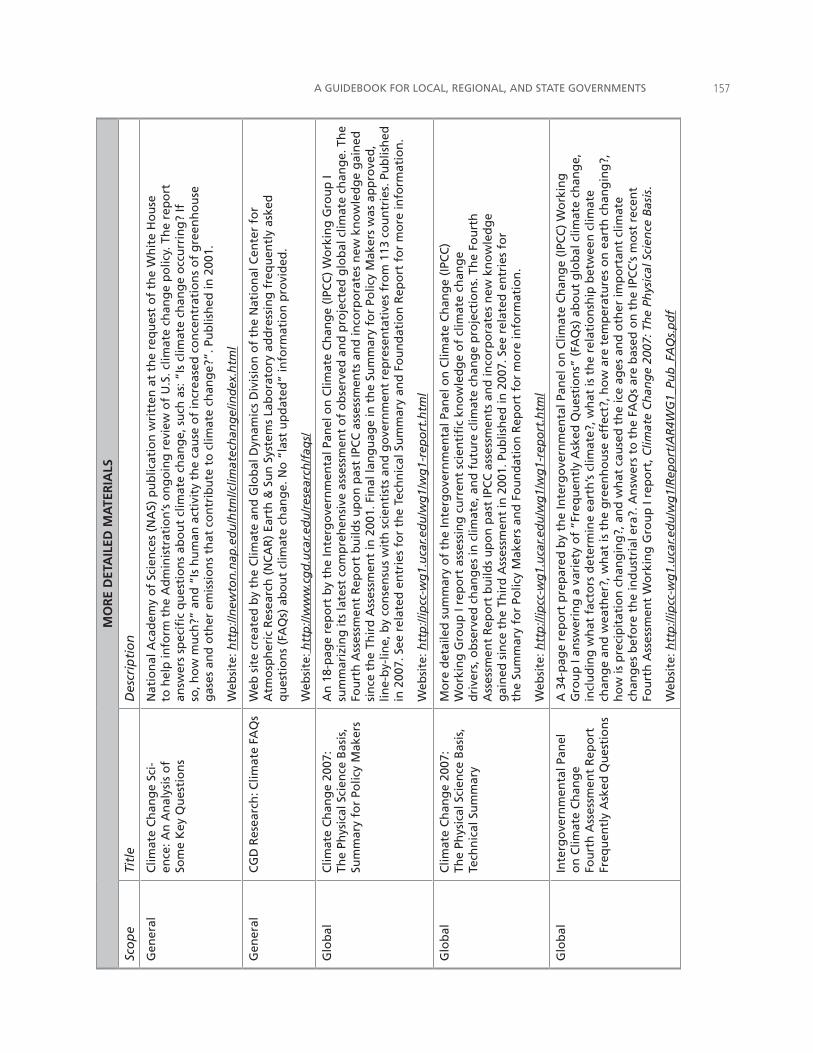
A GUIDEBOOK FOR LOCAL, REGIONAL, AND STATE GOVERNMENTS ���
MO
RE
DET
AIL
ED M
ATE
RIA
LS
Sco
pe
Titl
eD
escr
ipti
on
Gen
eral
Clim
ate
Ch
ang
e Sc
i-en
ce: A
n A
nal
ysis
of
Som
e K
ey Q
ues
tio
ns
Nat
ion
al A
cad
emy
of
Scie
nce
s (N
AS)
pu
blic
atio
n w
ritt
en a
t th
e re
qu
est
of
the
Wh
ite
Ho
use
to
hel
p in
form
th
e A
dm
inis
trat
ion
’s o
ng
oin
g r
evie
w o
f U
.S. c
limat
e ch
ang
e p
olic
y. T
he
rep
ort
an
swer
s sp
ecifi
c q
ues
tio
ns
abo
ut
clim
ate
chan
ge,
su
ch a
s: “
Is c
limat
e ch
ang
e o
ccu
rrin
g?
If
so, h
ow
mu
ch?”
an
d “
Is h
um
an a
ctiv
ity
the
cau
se o
f in
crea
sed
co
nce
ntr
atio
ns
of
gre
enh
ou
se
gas
es a
nd
oth
er e
mis
sio
ns
that
co
ntr
ibu
te t
o c
limat
e ch
ang
e?”.
Pu
blis
hed
in 2
001.
Web
site
: htt
p://
new
ton
.nap
.ed
u/h
tml/c
limat
ech
ang
e/in
dex
.htm
l
Gen
eral
CG
D R
esea
rch
: Clim
ate
FAQ
sW
eb s
ite
crea
ted
by
the
Clim
ate
and
Glo
bal
Dyn
amic
s D
ivis
ion
of
the
Nat
ion
al C
ente
r fo
r A
tmo
sph
eric
Res
earc
h (
NC
AR
) Ea
rth
& S
un
Sys
tem
s La
bo
rato
ry a
dd
ress
ing
fre
qu
entl
y as
ked
q
ues
tio
ns
(FA
Qs)
ab
ou
t cl
imat
e ch
ang
e. N
o “
last
up
dat
ed”
info
rmat
ion
pro
vid
ed.
Web
site
: htt
p://
ww
w.c
gd
.uca
r.ed
u/r
esea
rch
/faq
s/
Glo
bal
Clim
ate
Ch
ang
e 20
07:
The
Phys
ical
Sci
ence
Bas
is,
Sum
mar
y fo
r Po
licy
Mak
ers
An
18-
pag
e re
po
rt b
y th
e In
terg
ove
rnm
enta
l Pan
el o
n C
limat
e C
han
ge
(IPC
C)
Wo
rkin
g G
rou
p I
sum
mar
izin
g it
s la
test
co
mp
reh
ensi
ve a
sses
smen
t o
f o
bse
rved
an
d p
roje
cted
glo
bal
clim
ate
chan
ge.
Th
e Fo
urt
h A
sses
smen
t R
epo
rt b
uild
s u
po
n p
ast
IPC
C a
sses
smen
ts a
nd
inco
rpo
rate
s n
ew k
no
wle
dg
e g
ain
ed
sin
ce t
he
Thir
d A
sses
smen
t in
200
1. F
inal
lan
gu
age
in t
he
Sum
mar
y fo
r Po
licy
Mak
ers
was
ap
pro
ved
, lin
e-b
y-lin
e, b
y co
nse
nsu
s w
ith
sci
enti
sts
and
go
vern
men
t re
pre
sen
tati
ves
fro
m 1
13 c
ou
ntr
ies.
Pu
blis
hed
in
200
7. S
ee r
elat
ed e
ntr
ies
for
the
Tech
nic
al S
um
mar
y an
d F
ou
nd
atio
n R
epo
rt f
or
mo
re in
form
atio
n.
Web
site
: htt
p://
ipcc
-wg
1.u
car.e
du
/wg
1/w
g1-
rep
ort
.htm
l
Glo
bal
Clim
ate
Ch
ang
e 20
07:
The
Phys
ical
Sci
ence
Bas
is,
Tech
nic
al S
um
mar
y
Mo
re d
etai
led
su
mm
ary
of
the
Inte
rgo
vern
men
tal P
anel
on
Clim
ate
Ch
ang
e (I
PCC
) W
ork
ing
Gro
up
I re
po
rt a
sses
sin
g c
urr
ent
scie
nti
fic
kno
wle
dg
e o
f cl
imat
e ch
ang
e d
rive
rs, o
bse
rved
ch
ang
es in
clim
ate,
an
d f
utu
re c
limat
e ch
ang
e p
roje
ctio
ns.
Th
e Fo
urt
h
Ass
essm
ent
Rep
ort
bu
ilds
up
on
pas
t IP
CC
ass
essm
ents
an
d in
corp
ora
tes
new
kn
ow
led
ge
gai
ned
sin
ce t
he
Thir
d A
sses
smen
t in
200
1. P
ub
lish
ed in
200
7. S
ee r
elat
ed e
ntr
ies
for
the
Sum
mar
y fo
r Po
licy
Mak
ers
and
Fo
un
dat
ion
Rep
ort
fo
r m
ore
info
rmat
ion
.
Web
site
: htt
p://
ipcc
-wg
1.u
car.e
du
/wg
1/w
g1-
rep
ort
.htm
l
Glo
bal
Inte
rgo
vern
men
tal P
anel
o
n C
limat
e C
han
ge
Fou
rth
Ass
essm
ent
Rep
ort
Fr
equ
entl
y A
sked
Qu
esti
on
s
A 3
4-p
age
rep
ort
pre
par
ed b
y th
e In
terg
ove
rnm
enta
l Pan
el o
n C
limat
e C
han
ge
(IPC
C)
Wo
rkin
g
Gro
up
I an
swer
ing
a v
arie
ty o
f “F
req
uen
tly
Ask
ed Q
ues
tio
ns”
(FA
Qs)
ab
ou
t g
lob
al c
limat
e ch
ang
e,
incl
ud
ing
wh
at f
acto
rs d
eter
min
e ea
rth
’s c
limat
e?, w
hat
is t
he
rela
tio
nsh
ip b
etw
een
clim
ate
chan
ge
and
wea
ther
?, w
hat
is t
he
gre
enh
ou
se e
ffec
t?, h
ow
are
tem
per
atu
res
on
ear
th c
han
gin
g?,
h
ow
is p
reci
pit
atio
n c
han
gin
g?,
an
d w
hat
cau
sed
th
e ic
e ag
es a
nd
oth
er im
po
rtan
t cl
imat
e ch
ang
es b
efo
re t
he
ind
ust
rial
era
?. A
nsw
ers
to t
he
FAQ
s ar
e b
ased
on
th
e IP
CC
’s m
ost
rec
ent
Fou
rth
Ass
essm
ent
Wo
rkin
g G
rou
p I
rep
ort
, Clim
ate
Ch
ang
e 20
07: T
he
Phys
ical
Sci
ence
Bas
is.
Web
site
: htt
p://
ipcc
-wg
1.u
car.e
du
/wg
1/R
epo
rt/A
R4W
G1_
Pub
_FA
Qs.
pd
f
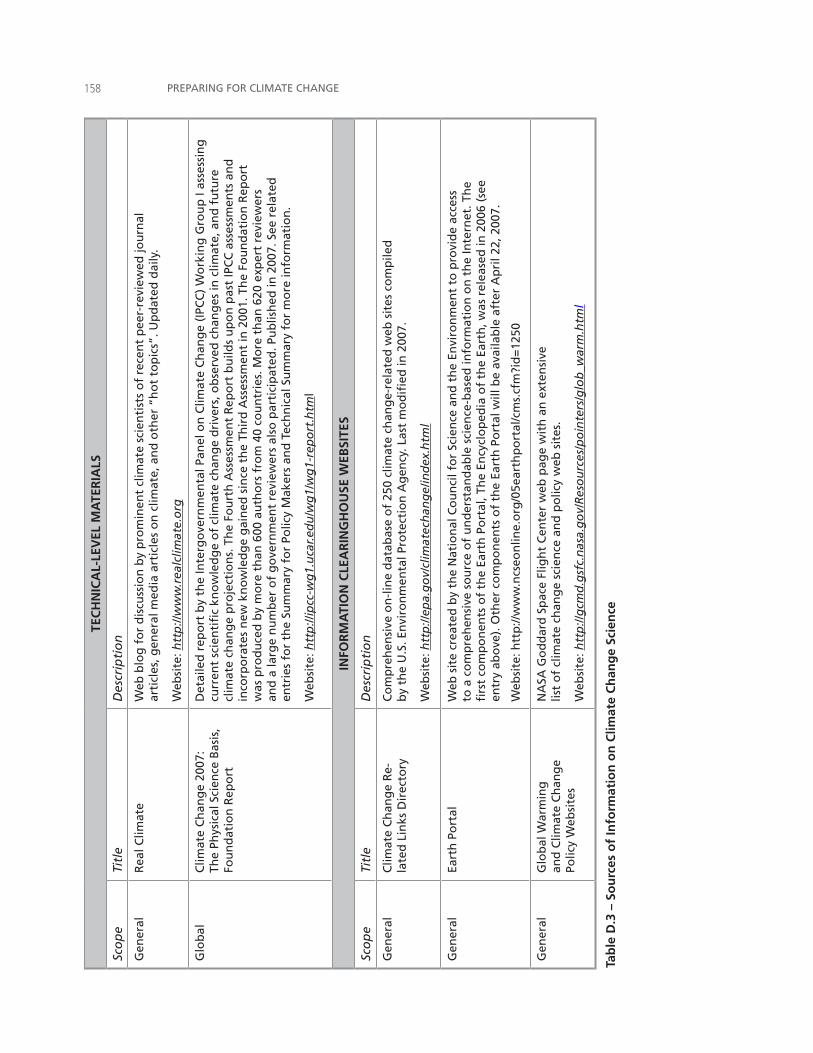
PREPARING FOR CLIMATE CHANGE���TE
CH
NIC
AL-
LEV
EL M
ATE
RIA
LS
Sco
pe
Titl
eD
escr
ipti
on
Gen
eral
Rea
l Clim
ate
Web
blo
g f
or
dis
cuss
ion
by
pro
min
ent
clim
ate
scie
nti
sts
of
rece
nt
pee
r-re
view
ed jo
urn
al
arti
cles
, gen
eral
med
ia a
rtic
les
on
clim
ate,
an
d o
ther
“h
ot
top
ics”
. Up
dat
ed d
aily
.
Web
site
: htt
p://
ww
w.r
ealc
limat
e.o
rg
Glo
bal
Clim
ate
Ch
ang
e 20
07:
The
Phys
ical
Sci
ence
Bas
is,
Fou
nd
atio
n R
epo
rt
Det
aile
d r
epo
rt b
y th
e In
terg
ove
rnm
enta
l Pan
el o
n C
limat
e C
han
ge
(IPC
C)
Wo
rkin
g G
rou
p I
asse
ssin
g
curr
ent
scie
nti
fic
kno
wle
dg
e o
f cl
imat
e ch
ang
e d
rive
rs, o
bse
rved
ch
ang
es in
clim
ate,
an
d f
utu
re
clim
ate
chan
ge
pro
ject
ion
s. T
he
Fou
rth
Ass
essm
ent
Rep
ort
bu
ilds
up
on
pas
t IP
CC
ass
essm
ents
an
d
inco
rpo
rate
s n
ew k
no
wle
dg
e g
ain
ed s
ince
th
e Th
ird
Ass
essm
ent
in 2
001.
Th
e Fo
un
dat
ion
Rep
ort
w
as p
rod
uce
d b
y m
ore
th
an 6
00 a
uth
ors
fro
m 4
0 co
un
trie
s. M
ore
th
an 6
20 e
xper
t re
view
ers
and
a la
rge
nu
mb
er o
f g
ove
rnm
ent
revi
ewer
s al
so p
arti
cip
ated
. Pu
blis
hed
in 2
007.
See
rel
ated
en
trie
s fo
r th
e Su
mm
ary
for
Polic
y M
aker
s an
d T
ech
nic
al S
um
mar
y fo
r m
ore
info
rmat
ion
.
Web
site
: htt
p://
ipcc
-wg
1.u
car.e
du
/wg
1/w
g1-
rep
ort
.htm
l
INFO
RM
ATI
ON
CLE
AR
ING
HO
USE
WEB
SITE
S
Sco
pe
Titl
eD
escr
ipti
on
Gen
eral
Clim
ate
Ch
ang
e R
e-la
ted
Lin
ks D
irec
tory
C
om
pre
hen
sive
on
-lin
e d
atab
ase
of
250
clim
ate
chan
ge-
rela
ted
web
sit
es c
om
pile
d
by
the
U.S
. En
viro
nm
enta
l Pro
tect
ion
Ag
ency
. Las
t m
od
ified
in 2
007.
Web
site
: htt
p://
epa.
go
v/cl
imat
ech
ang
e/in
dex
.htm
l
Gen
eral
Eart
h P
ort
alW
eb s
ite
crea
ted
by
the
Nat
ion
al C
ou
nci
l fo
r Sc
ien
ce a
nd
th
e En
viro
nm
ent
to p
rovi
de
acce
ss
to a
co
mp
reh
ensi
ve s
ou
rce
of
un
der
stan
dab
le s
cien
ce-b
ased
info
rmat
ion
on
th
e In
tern
et. T
he
firs
t co
mp
on
ents
of
the
Eart
h P
ort
al, T
he
Ency
clo
ped
ia o
f th
e Ea
rth
, was
rel
ease
d in
200
6 (s
ee
entr
y ab
ove
). O
ther
co
mp
on
ents
of
the
Eart
h P
ort
al w
ill b
e av
aila
ble
aft
er A
pri
l 22,
200
7.
Web
site
: htt
p://
ww
w.n
cseo
nlin
e.o
rg/0
5ear
thp
ort
al/c
ms.
cfm
?id
=12
50
Gen
eral
Glo
bal
War
min
g
and
Clim
ate
Ch
ang
e Po
licy
Web
site
s
NA
SA G
od
dar
d S
pac
e Fl
igh
t C
ente
r w
eb p
age
wit
h a
n e
xten
sive
lis
t o
f cl
imat
e ch
ang
e sc
ien
ce a
nd
po
licy
web
sit
es.
Web
site
: htt
p://
gcm
d.g
sfc.
nas
a.g
ov/
Res
ou
rces
/po
inte
rs/g
lob
_war
m.h
tml
Tab
le D
.3 –
So
urc
es o
f In
form
atio
n o
n C
limat
e C
han
ge
Scie
nce
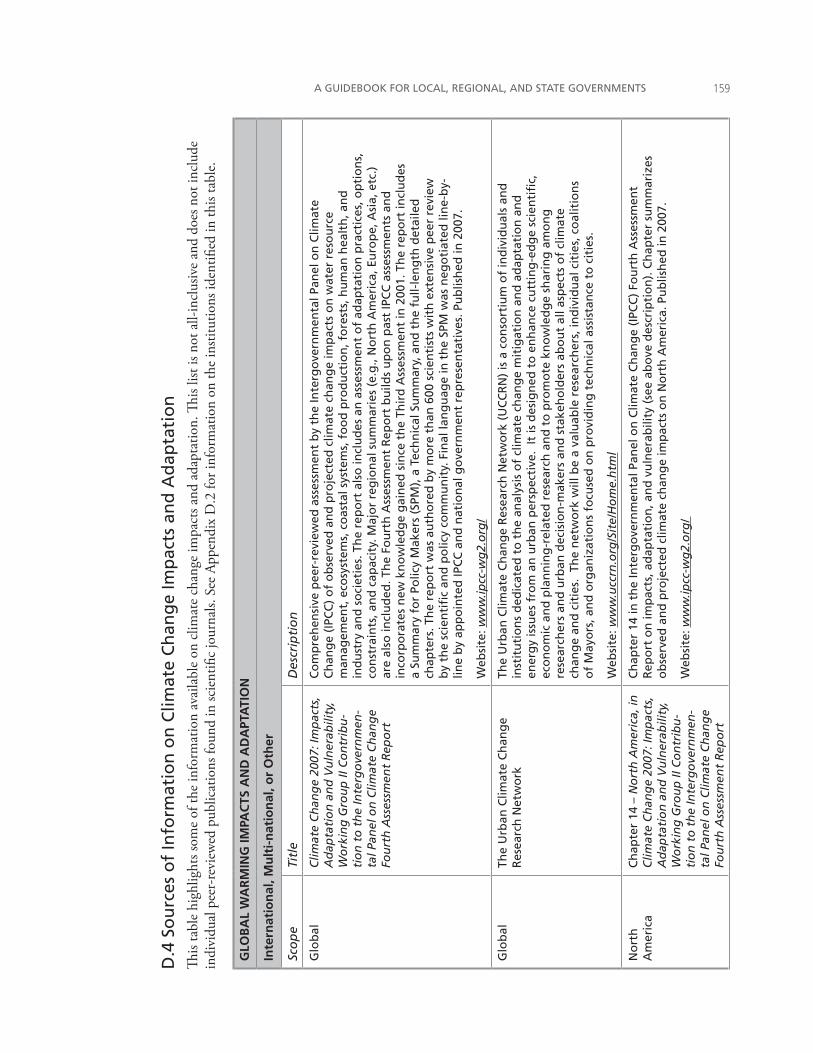
A GUIDEBOOK FOR LOCAL, REGIONAL, AND STATE GOVERNMENTS ���
D.4
So
urc
es o
f In
form
atio
n o
n C
limat
e C
han
ge
Imp
acts
an
d A
dap
tati
on
This
tabl
e hi
ghlig
hts s
ome
of th
e in
form
atio
n av
aila
ble
on c
limat
e ch
ange
impa
cts a
nd a
dapt
atio
n. Th
is lis
t is n
ot a
ll-in
clus
ive
and
does
not
incl
ude
indi
vidu
al p
eer-
revi
ewed
pub
licat
ions
foun
d in
scie
ntifi
c jo
urna
ls. S
ee A
ppen
dix
D.2
for i
nfor
mat
ion
on th
e in
stitu
tions
iden
tified
in th
is ta
ble.
GLO
BA
L W
AR
MIN
G IM
PAC
TS A
ND
AD
APT
ATI
ON
Inte
rnat
ion
al, M
ult
i-n
atio
nal
, or
Oth
er
Sco
pe
Titl
eD
escr
ipti
on
Glo
bal
Clim
ate
Ch
ang
e 20
07: I
mp
acts
, A
dap
tati
on
an
d V
uln
erab
ility
, W
ork
ing
Gro
up
II C
on
trib
u-
tio
n t
o t
he
Inte
rgo
vern
men
-ta
l Pan
el o
n C
limat
e C
han
ge
Fou
rth
Ass
essm
ent
Rep
ort
Co
mp
reh
ensi
ve p
eer-
revi
ewed
ass
essm
ent
by
the
Inte
rgo
vern
men
tal P
anel
on
Clim
ate
Ch
ang
e (I
PCC
) o
f o
bse
rved
an
d p
roje
cted
clim
ate
chan
ge
imp
acts
on
wat
er r
eso
urc
e m
anag
emen
t, e
cosy
stem
s, c
oas
tal s
yste
ms,
fo
od
pro
du
ctio
n, f
ore
sts,
hu
man
hea
lth
, an
d
ind
ust
ry a
nd
so
ciet
ies.
Th
e re
po
rt a
lso
incl
ud
es a
n a
sses
smen
t o
f ad
apta
tio
n p
ract
ices
, op
tio
ns,
co
nst
rain
ts, a
nd
cap
acit
y. M
ajo
r re
gio
nal
su
mm
arie
s (e
.g.,
No
rth
Am
eric
a, E
uro
pe,
Asi
a, e
tc.)
ar
e al
so in
clu
ded
. Th
e Fo
urt
h A
sses
smen
t R
epo
rt b
uild
s u
po
n p
ast
IPC
C a
sses
smen
ts a
nd
in
corp
ora
tes
new
kn
ow
led
ge
gai
ned
sin
ce t
he
Thir
d A
sses
smen
t in
200
1. T
he
rep
ort
incl
ud
es
a Su
mm
ary
for
Polic
y M
aker
s (S
PM),
a T
ech
nic
al S
um
mar
y, a
nd
th
e fu
ll-le
ng
th d
etai
led
ch
apte
rs. T
he
rep
ort
was
au
tho
red
by
mo
re t
han
600
sci
enti
sts
wit
h e
xten
sive
pee
r re
view
b
y th
e sc
ien
tifi
c an
d p
olic
y co
mm
un
ity.
Fin
al la
ng
uag
e in
th
e SP
M w
as n
ego
tiat
ed li
ne-
by-
line
by
app
oin
ted
IPC
C a
nd
nat
ion
al g
ove
rnm
ent
rep
rese
nta
tive
s. P
ub
lish
ed in
200
7.
Web
site
: ww
w.ip
cc-w
g2.
org
/
Glo
bal
The
Urb
an C
limat
e C
han
ge
Res
earc
h N
etw
ork
Th
e U
rban
Clim
ate
Ch
ang
e R
esea
rch
Net
wo
rk (
UC
CR
N)
is a
co
nso
rtiu
m o
f in
div
idu
als
and
in
stit
uti
on
s d
edic
ated
to
th
e an
alys
is o
f cl
imat
e ch
ang
e m
itig
atio
n a
nd
ad
apta
tio
n a
nd
en
erg
y is
sues
fro
m a
n u
rban
per
spec
tive
. It
is d
esig
ned
to
en
han
ce c
utt
ing
-ed
ge
scie
nti
fic,
ec
on
om
ic a
nd
pla
nn
ing
-rel
ated
res
earc
h a
nd
to
pro
mo
te k
no
wle
dg
e sh
arin
g a
mo
ng
re
sear
cher
s an
d u
rban
dec
isio
n-m
aker
s an
d s
take
ho
lder
s ab
ou
t al
l asp
ects
of
clim
ate
chan
ge
and
cit
ies.
Th
e n
etw
ork
will
be
a va
luab
le r
esea
rch
ers,
ind
ivid
ual
cit
ies,
co
alit
ion
s o
f M
ayo
rs, a
nd
org
aniz
atio
ns
focu
sed
on
pro
vid
ing
tec
hn
ical
ass
ista
nce
to
cit
ies.
Web
site
: ww
w.u
ccrn
.org
/Sit
e/H
om
e.h
tml
No
rth
A
mer
ica
Ch
apte
r 14
– N
ort
h A
mer
ica,
in
Clim
ate
Ch
ang
e 20
07: I
mp
acts
, A
dap
tati
on
an
d V
uln
erab
ility
, W
ork
ing
Gro
up
II C
on
trib
u-
tio
n t
o t
he
Inte
rgo
vern
men
-ta
l Pan
el o
n C
limat
e C
han
ge
Fou
rth
Ass
essm
ent
Rep
ort
Ch
apte
r 14
in t
he
Inte
rgo
vern
men
tal P
anel
on
Clim
ate
Ch
ang
e (I
PCC
) Fo
urt
h A
sses
smen
t R
epo
rt o
n im
pac
ts, a
dap
tati
on
, an
d v
uln
erab
ility
(se
e ab
ove
des
crip
tio
n).
Ch
apte
r su
mm
ariz
es
ob
serv
ed a
nd
pro
ject
ed c
limat
e ch
ang
e im
pac
ts o
n N
ort
h A
mer
ica.
Pu
blis
hed
in 2
007.
Web
site
: ww
w.ip
cc-w
g2.
org
/
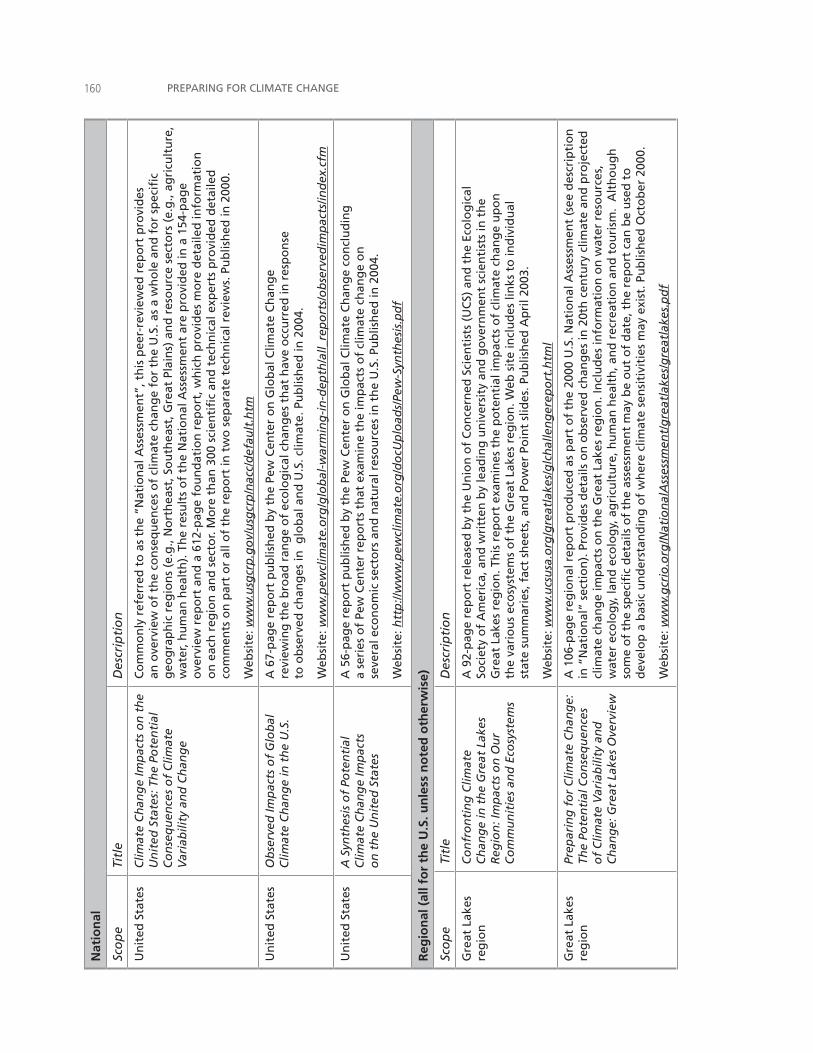
PREPARING FOR CLIMATE CHANGE��0N
atio
nal
Sco
pe
Titl
eD
escr
ipti
on
Un
ited
Sta
tes
Clim
ate
Ch
ang
e Im
pac
ts o
n t
he
Un
ited
Sta
tes:
Th
e Po
ten
tial
C
on
seq
uen
ces
of
Clim
ate
Var
iab
ility
an
d C
han
ge
Co
mm
on
ly r
efer
red
to
as
the
“Nat
ion
al A
sses
smen
t”, t
his
pee
r-re
view
ed r
epo
rt p
rovi
des
an
ove
rvie
w o
f th
e co
nse
qu
ence
s o
f cl
imat
e ch
ang
e fo
r th
e U
.S. a
s a
wh
ole
an
d f
or
spec
ific
geo
gra
ph
ic r
egio
ns
(e.g
., N
ort
hea
st, S
ou
thea
st, G
reat
Pla
ins)
an
d r
eso
urc
e se
cto
rs (
e.g
., ag
ricu
ltu
re,
wat
er, h
um
an h
ealt
h).
Th
e re
sult
s o
f th
e N
atio
nal
Ass
essm
ent
are
pro
vid
ed in
a 1
54-p
age
ove
rvie
w r
epo
rt a
nd
a 6
12-p
age
fou
nd
atio
n r
epo
rt, w
hic
h p
rovi
des
mo
re d
etai
led
info
rmat
ion
o
n e
ach
reg
ion
an
d s
ecto
r. M
ore
th
an 3
00 s
cien
tifi
c an
d t
ech
nic
al e
xper
ts p
rovi
ded
det
aile
d
com
men
ts o
n p
art
or
all o
f th
e re
po
rt in
tw
o s
epar
ate
tech
nic
al r
evie
ws.
Pu
blis
hed
in 2
000.
Web
site
: ww
w.u
sgcr
p.g
ov/
usg
crp
/nac
c/d
efau
lt.h
tm
Un
ited
Sta
tes
Ob
serv
ed Im
pac
ts o
f G
lob
al
Clim
ate
Ch
ang
e in
th
e U
.S.
A 6
7-p
age
rep
ort
pu
blis
hed
by
the
Pew
Cen
ter
on
Glo
bal
Clim
ate
Ch
ang
e re
view
ing
th
e b
road
ran
ge
of
eco
log
ical
ch
ang
es t
hat
hav
e o
ccu
rred
in r
esp
on
se
to o
bse
rved
ch
ang
es in
glo
bal
an
d U
.S. c
limat
e. P
ub
lish
ed in
200
4.
Web
site
: ww
w.p
ewcl
imat
e.o
rg/g
lob
al-w
arm
ing
-in
-dep
th/a
ll_re
po
rts/
ob
serv
edim
pac
ts/in
dex
.cfm
Un
ited
Sta
tes
A S
ynth
esis
of
Pote
nti
al
Clim
ate
Ch
ang
e Im
pac
ts
on
th
e U
nit
ed S
tate
s
A 5
6-p
age
rep
ort
pu
blis
hed
by
the
Pew
Cen
ter
on
Glo
bal
Clim
ate
Ch
ang
e co
ncl
ud
ing
a
seri
es o
f Pe
w C
ente
r re
po
rts
that
exa
min
e th
e im
pac
ts o
f cl
imat
e ch
ang
e o
n
seve
ral e
con
om
ic s
ecto
rs a
nd
nat
ura
l res
ou
rces
in t
he
U.S
. Pu
blis
hed
in 2
004.
Web
site
: htt
p://
ww
w.p
ewcl
imat
e.o
rg/d
ocU
plo
ads/
Pew
-Syn
thes
is.p
df
Reg
ion
al (
all f
or
the
U.S
. un
less
no
ted
oth
erw
ise)
Sco
pe
Titl
eD
escr
ipti
on
Gre
at L
akes
re
gio
nC
on
fro
nti
ng
Clim
ate
Ch
ang
e in
th
e G
reat
Lak
es
Reg
ion
: Im
pac
ts o
n O
ur
Co
mm
un
itie
s an
d E
cosy
stem
s
A 9
2-p
age
rep
ort
rel
ease
d b
y th
e U
nio
n o
f C
on
cern
ed S
cien
tist
s (U
CS)
an
d t
he
Eco
log
ical
So
ciet
y o
f A
mer
ica,
an
d w
ritt
en b
y le
adin
g u
niv
ersi
ty a
nd
go
vern
men
t sc
ien
tist
s in
th
e G
reat
Lak
es r
egio
n. T
his
rep
ort
exa
min
es t
he
po
ten
tial
imp
acts
of
clim
ate
chan
ge
up
on
th
e va
rio
us
eco
syst
ems
of
the
Gre
at L
akes
reg
ion
. Web
sit
e in
clu
des
lin
ks t
o in
div
idu
al
stat
e su
mm
arie
s, f
act
shee
ts, a
nd
Po
wer
Po
int
slid
es. P
ub
lish
ed A
pri
l 200
3.
Web
site
: ww
w.u
csu
sa.o
rg/g
reat
lake
s/g
lch
alle
ng
erep
ort
.htm
l
Gre
at L
akes
re
gio
nPr
epar
ing
fo
r C
limat
e C
han
ge:
Th
e Po
ten
tial
Co
nse
qu
ence
s o
f C
limat
e V
aria
bili
ty a
nd
C
han
ge:
Gre
at L
akes
Ove
rvie
w
A 1
06-p
age
reg
ion
al r
epo
rt p
rod
uce
d a
s p
art
of
the
2000
U.S
. Nat
ion
al A
sses
smen
t (s
ee d
escr
ipti
on
in
“N
atio
nal
” se
ctio
n).
Pro
vid
es d
etai
ls o
n o
bse
rved
ch
ang
es in
20t
h c
entu
ry c
limat
e an
d p
roje
cted
cl
imat
e ch
ang
e im
pac
ts o
n t
he
Gre
at L
akes
reg
ion
. In
clu
des
info
rmat
ion
on
wat
er r
eso
urc
es,
wat
er e
colo
gy,
lan
d e
colo
gy,
ag
ricu
ltu
re, h
um
an h
ealt
h, a
nd
rec
reat
ion
an
d t
ou
rism
. A
lth
ou
gh
so
me
of
the
spec
ific
det
ails
of
the
asse
ssm
ent
may
be
ou
t o
f d
ate,
th
e re
po
rt c
an b
e u
sed
to
d
evel
op
a b
asic
un
der
stan
din
g o
f w
her
e cl
imat
e se
nsi
tivi
ties
may
exi
st. P
ub
lish
ed O
cto
ber
200
0.
Web
site
: ww
w.g
crio
.org
/Nat
ion
alA
sses
smen
t/g
reat
lake
s/g
reat
lake
s.p
df
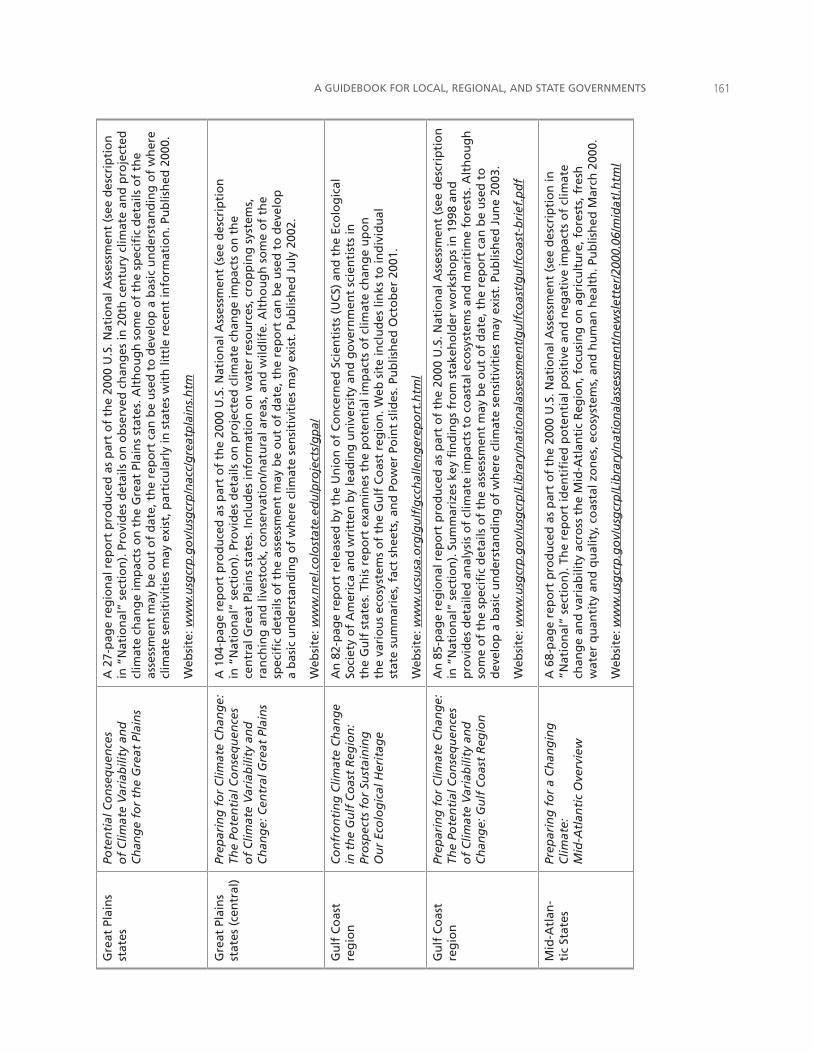
A GUIDEBOOK FOR LOCAL, REGIONAL, AND STATE GOVERNMENTS ���
Gre
at P
lain
s st
ates
Po
ten
tial
Co
nse
qu
ence
s o
f C
limat
e V
aria
bili
ty a
nd
C
han
ge
for
the
Gre
at P
lain
s
A 2
7-p
age
reg
ion
al r
epo
rt p
rod
uce
d a
s p
art
of
the
2000
U.S
. Nat
ion
al A
sses
smen
t (s
ee d
escr
ipti
on
in
“N
atio
nal
” se
ctio
n).
Pro
vid
es d
etai
ls o
n o
bse
rved
ch
ang
es in
20t
h c
entu
ry c
limat
e an
d p
roje
cted
cl
imat
e ch
ang
e im
pac
ts o
n t
he
Gre
at P
lain
s st
ates
. Alt
ho
ug
h s
om
e o
f th
e sp
ecifi
c d
etai
ls o
f th
e as
sess
men
t m
ay b
e o
ut
of
dat
e, t
he
rep
ort
can
be
use
d t
o d
evel
op
a b
asic
un
der
stan
din
g o
f w
her
e cl
imat
e se
nsi
tivi
ties
may
exi
st, p
arti
cula
rly
in s
tate
s w
ith
litt
le r
ecen
t in
form
atio
n. P
ub
lish
ed 2
000.
Web
site
: ww
w.u
sgcr
p.g
ov/
usg
crp
/nac
c/g
reat
pla
ins.
htm
Gre
at P
lain
s st
ates
(ce
ntr
al)
Prep
arin
g f
or
Clim
ate
Ch
ang
e:
The
Pote
nti
al C
on
seq
uen
ces
of
Clim
ate
Var
iab
ility
an
d
Ch
ang
e: C
entr
al G
reat
Pla
ins
A 1
04-p
age
rep
ort
pro
du
ced
as
par
t o
f th
e 20
00 U
.S. N
atio
nal
Ass
essm
ent
(see
des
crip
tio
n
in “
Nat
ion
al”
sect
ion
). P
rovi
des
det
ails
on
pro
ject
ed c
limat
e ch
ang
e im
pac
ts o
n t
he
cen
tral
Gre
at P
lain
s st
ates
. In
clu
des
info
rmat
ion
on
wat
er r
eso
urc
es, c
rop
pin
g s
yste
ms,
ra
nch
ing
an
d li
vest
ock
, co
nse
rvat
ion
/nat
ura
l are
as, a
nd
wild
life.
Alt
ho
ug
h s
om
e o
f th
e sp
ecifi
c d
etai
ls o
f th
e as
sess
men
t m
ay b
e o
ut
of
dat
e, t
he
rep
ort
can
be
use
d t
o d
evel
op
a
bas
ic u
nd
erst
and
ing
of
wh
ere
clim
ate
sen
siti
viti
es m
ay e
xist
. Pu
blis
hed
Ju
ly 2
002.
Web
site
: ww
w.n
rel.c
olo
stat
e.ed
u/p
roje
cts/
gp
a/
Gu
lf C
oas
t re
gio
nC
on
fro
nti
ng
Clim
ate
Ch
ang
e in
th
e G
ulf
Co
ast
Reg
ion
: Pr
osp
ects
fo
r Su
stai
nin
g
Ou
r Ec
olo
gic
al H
erit
age
An
82-
pag
e re
po
rt r
elea
sed
by
the
Un
ion
of
Co
nce
rned
Sci
enti
sts
(UC
S) a
nd
th
e Ec
olo
gic
al
Soci
ety
of
Am
eric
a an
d w
ritt
en b
y le
adin
g u
niv
ersi
ty a
nd
go
vern
men
t sc
ien
tist
s in
th
e G
ulf
sta
tes.
Th
is r
epo
rt e
xam
ines
th
e p
ote
nti
al im
pac
ts o
f cl
imat
e ch
ang
e u
po
n
the
vari
ou
s ec
osy
stem
s o
f th
e G
ulf
Co
ast
reg
ion
. Web
sit
e in
clu
des
lin
ks t
o in
div
idu
al
stat
e su
mm
arie
s, f
act
shee
ts, a
nd
Po
wer
Po
int
slid
es. P
ub
lish
ed O
cto
ber
200
1.
Web
site
: ww
w.u
csu
sa.o
rg/g
ulf
/gcc
hal
len
ger
epo
rt.h
tml
Gu
lf C
oas
t re
gio
nPr
epar
ing
fo
r C
limat
e C
han
ge:
Th
e Po
ten
tial
Co
nse
qu
ence
s o
f C
limat
e V
aria
bili
ty a
nd
C
han
ge:
Gu
lf C
oas
t R
egio
n
An
85-
pag
e re
gio
nal
rep
ort
pro
du
ced
as
par
t o
f th
e 20
00 U
.S. N
atio
nal
Ass
essm
ent
(see
des
crip
tio
n
in “
Nat
ion
al”
sect
ion
). S
um
mar
izes
key
fin
din
gs
fro
m s
take
ho
lder
wo
rksh
op
s in
199
8 an
d
pro
vid
es d
etai
led
an
alys
is o
f cl
imat
e im
pac
ts t
o c
oas
tal e
cosy
stem
s an
d m
arit
ime
fore
sts.
Alt
ho
ug
h
som
e o
f th
e sp
ecifi
c d
etai
ls o
f th
e as
sess
men
t m
ay b
e o
ut
of
dat
e, t
he
rep
ort
can
be
use
d t
o
dev
elo
p a
bas
ic u
nd
erst
and
ing
of
wh
ere
clim
ate
sen
siti
viti
es m
ay e
xist
. Pu
blis
hed
Ju
ne
2003
.
Web
site
: ww
w.u
sgcr
p.g
ov/
usg
crp
/Lib
rary
/nat
ion
alas
sess
men
t/g
ulf
coas
t/g
ulf
coas
t-b
rief
.pd
f
Mid
-Atl
an-
tic
Stat
esPr
epar
ing
fo
r a
Ch
ang
ing
C
limat
e:
Mid
-Atl
anti
c O
verv
iew
A 6
8-p
age
rep
ort
pro
du
ced
as
par
t o
f th
e 20
00 U
.S. N
atio
nal
Ass
essm
ent
(see
des
crip
tio
n in
“N
atio
nal
” se
ctio
n).
Th
e re
po
rt id
enti
fied
po
ten
tial
po
siti
ve a
nd
neg
ativ
e im
pac
ts o
f cl
imat
e ch
ang
e an
d v
aria
bili
ty a
cro
ss t
he
Mid
-Atl
anti
c R
egio
n, f
ocu
sin
g o
n a
gri
cult
ure
, fo
rest
s, f
resh
w
ater
qu
anti
ty a
nd
qu
alit
y, c
oas
tal z
on
es, e
cosy
stem
s, a
nd
hu
man
hea
lth
. Pu
blis
hed
Mar
ch 2
000.
Web
site
: ww
w.u
sgcr
p.g
ov/
usg
crp
/Lib
rary
/nat
ion
alas
sess
men
t/n
ewsl
ette
r/20
00.0
6/m
idat
l.htm
l
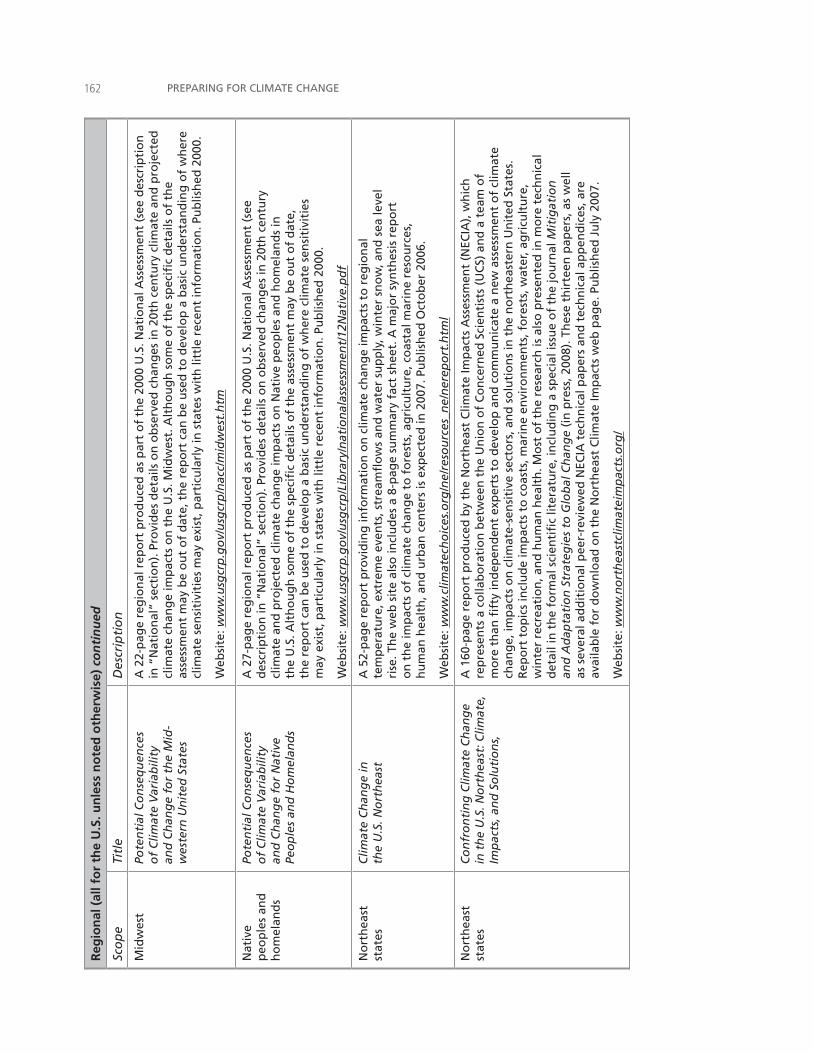
PREPARING FOR CLIMATE CHANGE���R
egio
nal
(al
l fo
r th
e U
.S. u
nle
ss n
ote
d o
ther
wis
e) c
on
tin
ued
Sco
pe
Titl
eD
escr
ipti
on
Mid
wes
tPo
ten
tial
Co
nse
qu
ence
s o
f C
limat
e V
aria
bili
ty
and
Ch
ang
e fo
r th
e M
id-
wes
tern
Un
ited
Sta
tes
A 2
2-p
age
reg
ion
al r
epo
rt p
rod
uce
d a
s p
art
of
the
2000
U.S
. Nat
ion
al A
sses
smen
t (s
ee d
escr
ipti
on
in
“N
atio
nal
” se
ctio
n).
Pro
vid
es d
etai
ls o
n o
bse
rved
ch
ang
es in
20t
h c
entu
ry c
limat
e an
d p
roje
cted
cl
imat
e ch
ang
e im
pac
ts o
n t
he
U.S
. Mid
wes
t. A
lth
ou
gh
so
me
of
the
spec
ific
det
ails
of
the
asse
ssm
ent
may
be
ou
t o
f d
ate,
th
e re
po
rt c
an b
e u
sed
to
dev
elo
p a
bas
ic u
nd
erst
and
ing
of
wh
ere
clim
ate
sen
siti
viti
es m
ay e
xist
, par
ticu
larl
y in
sta
tes
wit
h li
ttle
rec
ent
info
rmat
ion
. Pu
blis
hed
200
0.
Web
site
: ww
w.u
sgcr
p.g
ov/
usg
crp
/nac
c/m
idw
est.
htm
Nat
ive
peo
ple
s an
d
ho
mel
and
s
Pote
nti
al C
on
seq
uen
ces
of
Clim
ate
Var
iab
ility
an
d C
han
ge
for
Nat
ive
Peo
ple
s an
d H
om
elan
ds
A 2
7-p
age
reg
ion
al r
epo
rt p
rod
uce
d a
s p
art
of
the
2000
U.S
. Nat
ion
al A
sses
smen
t (s
ee
des
crip
tio
n in
“N
atio
nal
” se
ctio
n).
Pro
vid
es d
etai
ls o
n o
bse
rved
ch
ang
es in
20t
h c
entu
ry
clim
ate
and
pro
ject
ed c
limat
e ch
ang
e im
pac
ts o
n N
ativ
e p
eop
les
and
ho
mel
and
s in
th
e U
.S. A
lth
ou
gh
so
me
of
the
spec
ific
det
ails
of
the
asse
ssm
ent
may
be
ou
t o
f d
ate,
th
e re
po
rt c
an b
e u
sed
to
dev
elo
p a
bas
ic u
nd
erst
and
ing
of
wh
ere
clim
ate
sen
siti
viti
es
may
exi
st, p
arti
cula
rly
in s
tate
s w
ith
litt
le r
ecen
t in
form
atio
n. P
ub
lish
ed 2
000.
Web
site
: ww
w.u
sgcr
p.g
ov/
usg
crp
/Lib
rary
/nat
ion
alas
sess
men
t/12
Nat
ive.
pd
f
No
rth
east
st
ates
Clim
ate
Ch
ang
e in
th
e U
.S. N
ort
hea
stA
52-
pag
e re
po
rt p
rovi
din
g in
form
atio
n o
n c
limat
e ch
ang
e im
pac
ts t
o r
egio
nal
te
mp
erat
ure
, ext
rem
e ev
ents
, str
eam
flo
ws
and
wat
er s
up
ply
, win
ter
sno
w, a
nd
sea
leve
l ri
se. T
he
web
sit
e al
so in
clu
des
a 8
-pag
e su
mm
ary
fact
sh
eet.
A m
ajo
r sy
nth
esis
rep
ort
o
n t
he
imp
acts
of
clim
ate
chan
ge
to f
ore
sts,
ag
ricu
ltu
re, c
oas
tal m
arin
e re
sou
rces
, h
um
an h
ealt
h, a
nd
urb
an c
ente
rs is
exp
ecte
d in
200
7. P
ub
lish
ed O
cto
ber
200
6.
Web
site
: ww
w.c
limat
ech
oic
es.o
rg/n
e/re
sou
rces
_ne/
ner
epo
rt.h
tml
No
rth
east
st
ates
Co
nfr
on
tin
g C
limat
e C
han
ge
in t
he
U.S
. No
rth
east
: Clim
ate,
Im
pac
ts, a
nd
So
luti
on
s,
A 1
60-p
age
rep
ort
pro
du
ced
by
the
No
rth
east
Clim
ate
Imp
acts
Ass
essm
ent
(NEC
IA),
wh
ich
re
pre
sen
ts a
co
llab
ora
tio
n b
etw
een
th
e U
nio
n o
f C
on
cern
ed S
cien
tist
s (U
CS)
an
d a
tea
m o
f m
ore
th
an fi
fty
ind
epen
den
t ex
per
ts t
o d
evel
op
an
d c
om
mu
nic
ate
a n
ew a
sses
smen
t o
f cl
imat
e ch
ang
e, im
pac
ts o
n c
limat
e-se
nsi
tive
sec
tors
, an
d s
olu
tio
ns
in t
he
no
rth
east
ern
Un
ited
Sta
tes.
R
epo
rt t
op
ics
incl
ud
e im
pac
ts t
o c
oas
ts, m
arin
e en
viro
nm
ents
, fo
rest
s, w
ater
, ag
ricu
ltu
re,
win
ter
recr
eati
on
, an
d h
um
an h
ealt
h. M
ost
of
the
rese
arch
is a
lso
pre
sen
ted
in m
ore
tec
hn
ical
d
etai
l in
th
e fo
rmal
sci
enti
fic
liter
atu
re, i
ncl
ud
ing
a s
pec
ial i
ssu
e o
f th
e jo
urn
al M
itig
atio
n
and
Ad
apta
tio
n S
trat
egie
s to
Glo
bal
Ch
ang
e (i
n p
ress
, 200
8). T
hes
e th
irte
en p
aper
s, a
s w
ell
as s
ever
al a
dd
itio
nal
pee
r-re
view
ed N
ECIA
tec
hn
ical
pap
ers
and
tec
hn
ical
ap
pen
dic
es, a
re
avai
lab
le f
or
do
wn
load
on
th
e N
ort
hea
st C
limat
e Im
pac
ts w
eb p
age.
Pu
blis
hed
Ju
ly 2
007.
Web
site
: ww
w.n
ort
hea
stcl
imat
eim
pac
ts.o
rg/
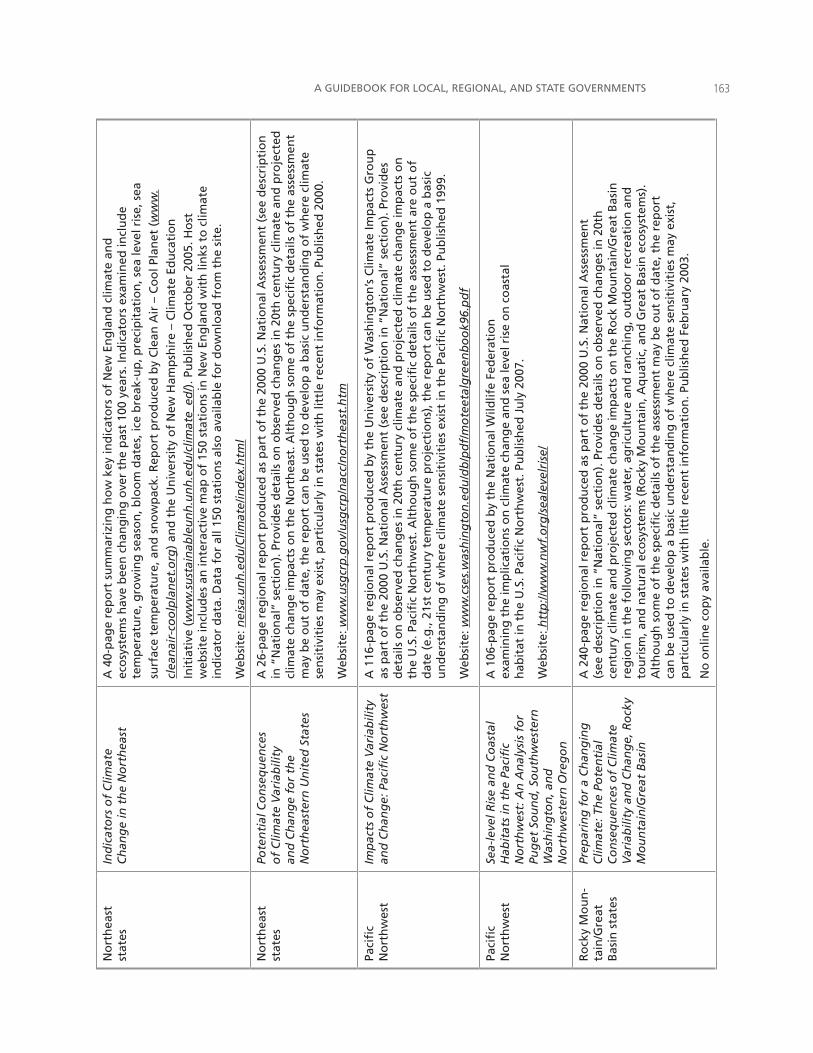
A GUIDEBOOK FOR LOCAL, REGIONAL, AND STATE GOVERNMENTS ���
No
rth
east
st
ates
Ind
icat
ors
of
Clim
ate
Ch
ang
e in
th
e N
ort
hea
stA
40-
pag
e re
po
rt s
um
mar
izin
g h
ow
key
ind
icat
ors
of
New
En
gla
nd
clim
ate
and
ec
osy
stem
s h
ave
bee
n c
han
gin
g o
ver
the
pas
t 10
0 ye
ars.
Ind
icat
ors
exa
min
ed in
clu
de
tem
per
atu
re, g
row
ing
sea
son
, blo
om
dat
es, i
ce b
reak
-up
, pre
cip
itat
ion
, sea
leve
l ris
e, s
ea
surf
ace
tem
per
atu
re, a
nd
sn
ow
pac
k. R
epo
rt p
rod
uce
d b
y C
lean
Air
– C
oo
l Pla
net
(w
ww
.
clea
nai
r-co
olp
lan
et.o
rg)
and
th
e U
niv
ersi
ty o
f N
ew H
amp
shir
e –
Clim
ate
Edu
cati
on
In
itia
tive
(w
ww
.su
stai
nab
leu
nh
.un
h.e
du
/clim
ate_
ed/)
. Pu
blis
hed
Oct
ob
er 2
005.
Ho
st
web
site
incl
ud
es a
n in
tera
ctiv
e m
ap o
f 15
0 st
atio
ns
in N
ew E
ng
lan
d w
ith
lin
ks t
o c
limat
e in
dic
ato
r d
ata.
Dat
a fo
r al
l 150
sta
tio
ns
also
ava
ilab
le f
or
do
wn
load
fro
m t
he
site
.
Web
site
: nei
sa.u
nh
.ed
u/C
limat
e/in
dex
.htm
l
No
rth
east
st
ates
Pote
nti
al C
on
seq
uen
ces
of
Clim
ate
Var
iab
ility
an
d C
han
ge
for
the
No
rth
east
ern
Un
ited
Sta
tes
A 2
6-p
age
reg
ion
al r
epo
rt p
rod
uce
d a
s p
art
of
the
2000
U.S
. Nat
ion
al A
sses
smen
t (s
ee d
escr
ipti
on
in
“N
atio
nal
” se
ctio
n).
Pro
vid
es d
etai
ls o
n o
bse
rved
ch
ang
es in
20t
h c
entu
ry c
limat
e an
d p
roje
cted
cl
imat
e ch
ang
e im
pac
ts o
n t
he
No
rth
east
. Alt
ho
ug
h s
om
e o
f th
e sp
ecifi
c d
etai
ls o
f th
e as
sess
men
t m
ay b
e o
ut
of
dat
e, t
he
rep
ort
can
be
use
d t
o d
evel
op
a b
asic
un
der
stan
din
g o
f w
her
e cl
imat
e se
nsi
tivi
ties
may
exi
st, p
arti
cula
rly
in s
tate
s w
ith
litt
le r
ecen
t in
form
atio
n. P
ub
lish
ed 2
000.
Web
site
: ww
w.u
sgcr
p.g
ov/
usg
crp
/nac
c/n
ort
hea
st.h
tm
Paci
fic
No
rth
wes
tIm
pac
ts o
f C
limat
e V
aria
bili
ty
and
Ch
ang
e: P
acifi
c N
ort
hw
est
A 1
16-p
age
reg
ion
al r
epo
rt p
rod
uce
d b
y th
e U
niv
ersi
ty o
f W
ash
ing
ton
’s C
limat
e Im
pac
ts G
rou
p
as p
art
of
the
2000
U.S
. Nat
ion
al A
sses
smen
t (s
ee d
escr
ipti
on
in “
Nat
ion
al”
sect
ion
). P
rovi
des
d
etai
ls o
n o
bse
rved
ch
ang
es in
20t
h c
entu
ry c
limat
e an
d p
roje
cted
clim
ate
chan
ge
imp
acts
on
th
e U
.S. P
acifi
c N
ort
hw
est.
Alt
ho
ug
h s
om
e o
f th
e sp
ecifi
c d
etai
ls o
f th
e as
sess
men
t ar
e o
ut
of
dat
e (e
.g.,
21st
cen
tury
tem
per
atu
re p
roje
ctio
ns)
, th
e re
po
rt c
an b
e u
sed
to
dev
elo
p a
bas
ic
un
der
stan
din
g o
f w
her
e cl
imat
e se
nsi
tivi
ties
exi
st in
th
e Pa
cifi
c N
ort
hw
est.
Pu
blis
hed
199
9.
Web
site
: ww
w.c
ses.
was
hin
gto
n.e
du
/db
/pd
f/m
ote
etal
gre
enb
oo
k96.
pd
f
Paci
fic
No
rth
wes
tSe
a-le
vel R
ise
and
Co
asta
l H
abit
ats
in t
he
Paci
fic
No
rth
wes
t: A
n A
nal
ysis
fo
r Pu
get
So
un
d, S
ou
thw
este
rn
Was
hin
gto
n, a
nd
N
ort
hw
este
rn O
reg
on
A 1
06-p
age
rep
ort
pro
du
ced
by
the
Nat
ion
al W
ildlif
e Fe
der
atio
n
exam
inin
g t
he
imp
licat
ion
s o
n c
limat
e ch
ang
e an
d s
ea le
vel r
ise
on
co
asta
l h
abit
at in
th
e U
.S. P
acifi
c N
ort
hw
est.
Pu
blis
hed
Ju
ly 2
007.
Web
site
: htt
p://
ww
w.n
wf.
org
/sea
leve
lris
e/
Ro
cky
Mo
un
-ta
in/G
reat
B
asin
sta
tes
Prep
arin
g f
or
a C
han
gin
g
Clim
ate:
Th
e Po
ten
tial
C
on
seq
uen
ces
of
Clim
ate
Var
iab
ility
an
d C
han
ge,
Ro
cky
Mo
un
tain
/Gre
at B
asin
A 2
40-p
age
reg
ion
al r
epo
rt p
rod
uce
d a
s p
art
of
the
2000
U.S
. Nat
ion
al A
sses
smen
t (s
ee d
escr
ipti
on
in “
Nat
ion
al”
sect
ion
). P
rovi
des
det
ails
on
ob
serv
ed c
han
ges
in 2
0th
ce
ntu
ry c
limat
e an
d p
roje
cted
clim
ate
chan
ge
imp
acts
on
th
e R
ock
Mo
un
tain
/Gre
at B
asin
re
gio
n in
th
e fo
llow
ing
sec
tors
: wat
er, a
gri
cult
ure
an
d r
anch
ing
, ou
tdo
or
recr
eati
on
an
d
tou
rism
, an
d n
atu
ral e
cosy
stem
s (R
ock
y M
ou
nta
in, A
qu
atic
, an
d G
reat
Bas
in e
cosy
stem
s).
Alt
ho
ug
h s
om
e o
f th
e sp
ecifi
c d
etai
ls o
f th
e as
sess
men
t m
ay b
e o
ut
of
dat
e, t
he
rep
ort
ca
n b
e u
sed
to
dev
elo
p a
bas
ic u
nd
erst
and
ing
of
wh
ere
clim
ate
sen
siti
viti
es m
ay e
xist
, p
arti
cula
rly
in s
tate
s w
ith
litt
le r
ecen
t in
form
atio
n. P
ub
lish
ed F
ebru
ary
2003
.
No
on
line
cop
y av
aila
ble
.
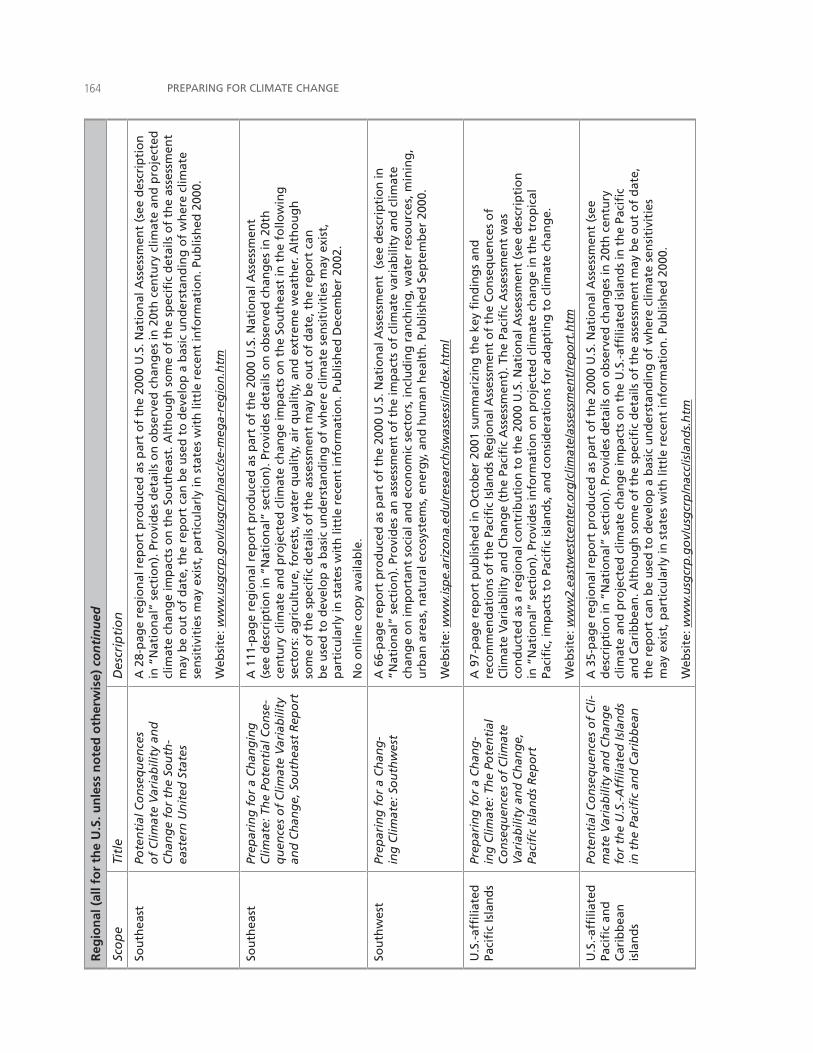
PREPARING FOR CLIMATE CHANGE���R
egio
nal
(al
l fo
r th
e U
.S. u
nle
ss n
ote
d o
ther
wis
e) c
on
tin
ued
Sco
pe
Titl
eD
escr
ipti
on
Sou
thea
stPo
ten
tial
Co
nse
qu
ence
s o
f C
limat
e V
aria
bili
ty a
nd
C
han
ge
for
the
Sou
th-
east
ern
Un
ited
Sta
tes
A 2
8-p
age
reg
ion
al r
epo
rt p
rod
uce
d a
s p
art
of
the
2000
U.S
. Nat
ion
al A
sses
smen
t (s
ee d
escr
ipti
on
in
“N
atio
nal
” se
ctio
n).
Pro
vid
es d
etai
ls o
n o
bse
rved
ch
ang
es in
20t
h c
entu
ry c
limat
e an
d p
roje
cted
cl
imat
e ch
ang
e im
pac
ts o
n t
he
Sou
thea
st. A
lth
ou
gh
so
me
of
the
spec
ific
det
ails
of
the
asse
ssm
ent
may
be
ou
t o
f d
ate,
th
e re
po
rt c
an b
e u
sed
to
dev
elo
p a
bas
ic u
nd
erst
and
ing
of
wh
ere
clim
ate
sen
siti
viti
es m
ay e
xist
, par
ticu
larl
y in
sta
tes
wit
h li
ttle
rec
ent
info
rmat
ion
. Pu
blis
hed
200
0.
Web
site
: ww
w.u
sgcr
p.g
ov/
usg
crp
/nac
c/se
-meg
a-re
gio
n.h
tm
Sou
thea
st
Prep
arin
g f
or
a C
han
gin
g
Clim
ate:
Th
e Po
ten
tial
Co
nse
-q
uen
ces
of
Clim
ate
Var
iab
ility
an
d C
han
ge,
So
uth
east
Rep
ort
A 1
11-p
age
reg
ion
al r
epo
rt p
rod
uce
d a
s p
art
of
the
2000
U.S
. Nat
ion
al A
sses
smen
t (s
ee d
escr
ipti
on
in “
Nat
ion
al”
sect
ion
). P
rovi
des
det
ails
on
ob
serv
ed c
han
ges
in 2
0th
ce
ntu
ry c
limat
e an
d p
roje
cted
clim
ate
chan
ge
imp
acts
on
th
e So
uth
east
in t
he
follo
win
g
sect
ors
: ag
ricu
ltu
re, f
ore
sts,
wat
er q
ual
ity,
air
qu
alit
y, a
nd
ext
rem
e w
eath
er. A
lth
ou
gh
so
me
of
the
spec
ific
det
ails
of
the
asse
ssm
ent
may
be
ou
t o
f d
ate,
th
e re
po
rt c
an
be
use
d t
o d
evel
op
a b
asic
un
der
stan
din
g o
f w
her
e cl
imat
e se
nsi
tivi
ties
may
exi
st,
par
ticu
larl
y in
sta
tes
wit
h li
ttle
rec
ent
info
rmat
ion
. Pu
blis
hed
Dec
emb
er 2
002.
No
on
line
cop
y av
aila
ble
.
Sou
thw
est
Prep
arin
g f
or
a C
han
g-
ing
Clim
ate:
So
uth
wes
tA
66-
pag
e re
po
rt p
rod
uce
d a
s p
art
of
the
2000
U.S
. Nat
ion
al A
sses
smen
t (
see
des
crip
tio
n in
“N
atio
nal
” se
ctio
n).
Pro
vid
es a
n a
sses
smen
t o
f th
e im
pac
ts o
f cl
imat
e va
riab
ility
an
d c
limat
e ch
ang
e o
n im
po
rtan
t so
cial
an
d e
con
om
ic s
ecto
rs, i
ncl
ud
ing
ran
chin
g, w
ater
res
ou
rces
, min
ing
, u
rban
are
as, n
atu
ral e
cosy
stem
s, e
ner
gy,
an
d h
um
an h
ealt
h. P
ub
lish
ed S
epte
mb
er 2
000.
Web
site
: ww
w.is
pe.
ariz
on
a.ed
u/r
esea
rch
/sw
asse
ss/in
dex
.htm
l
U.S
.-af
filia
ted
Pa
cifi
c Is
lan
ds
Prep
arin
g f
or
a C
han
g-
ing
Clim
ate:
Th
e Po
ten
tial
C
on
seq
uen
ces
of
Clim
ate
Var
iab
ility
an
d C
han
ge,
Pa
cifi
c Is
lan
ds
Rep
ort
A 9
7-p
age
rep
ort
pu
blis
hed
in O
cto
ber
200
1 su
mm
ariz
ing
th
e ke
y fi
nd
ing
s an
d
reco
mm
end
atio
ns
of
the
Paci
fic
Isla
nd
s R
egio
nal
Ass
essm
ent
of
the
Co
nse
qu
ence
s o
f C
limat
e V
aria
bili
ty a
nd
Ch
ang
e (t
he
Paci
fic
Ass
essm
ent)
. Th
e Pa
cifi
c A
sses
smen
t w
as
con
du
cted
as
a re
gio
nal
co
ntr
ibu
tio
n t
o t
he
2000
U.S
. Nat
ion
al A
sses
smen
t (s
ee d
escr
ipti
on
in
“N
atio
nal
” se
ctio
n).
Pro
vid
es in
form
atio
n o
n p
roje
cted
clim
ate
chan
ge
in t
he
tro
pic
al
Paci
fic,
imp
acts
to
Pac
ific
isla
nd
s, a
nd
co
nsi
der
atio
ns
for
adap
tin
g t
o c
limat
e ch
ang
e.
Web
site
: ww
w2.
east
wes
tcen
ter.o
rg/c
limat
e/as
sess
men
t/re
po
rt.h
tm
U.S
.-af
filia
ted
Pa
cifi
c an
d
Car
ibb
ean
is
lan
ds
Pote
nti
al C
on
seq
uen
ces
of
Cli-
mat
e V
aria
bili
ty a
nd
Ch
ang
e fo
r th
e U
.S.-
Affi
liate
d Is
lan
ds
in t
he
Paci
fic
and
Car
ibb
ean
A 3
5-p
age
reg
ion
al r
epo
rt p
rod
uce
d a
s p
art
of
the
2000
U.S
. Nat
ion
al A
sses
smen
t (s
ee
des
crip
tio
n in
“N
atio
nal
” se
ctio
n).
Pro
vid
es d
etai
ls o
n o
bse
rved
ch
ang
es in
20t
h c
entu
ry
clim
ate
and
pro
ject
ed c
limat
e ch
ang
e im
pac
ts o
n t
he
U.S
.-af
filia
ted
isla
nd
s in
th
e Pa
cifi
c an
d C
arib
bea
n. A
lth
ou
gh
so
me
of
the
spec
ific
det
ails
of
the
asse
ssm
ent
may
be
ou
t o
f d
ate,
th
e re
po
rt c
an b
e u
sed
to
dev
elo
p a
bas
ic u
nd
erst
and
ing
of
wh
ere
clim
ate
sen
siti
viti
es
may
exi
st, p
arti
cula
rly
in s
tate
s w
ith
litt
le r
ecen
t in
form
atio
n. P
ub
lish
ed 2
000.
Web
site
: ww
w.u
sgcr
p.g
ov/
usg
crp
/nac
c/is
lan
ds.
htm
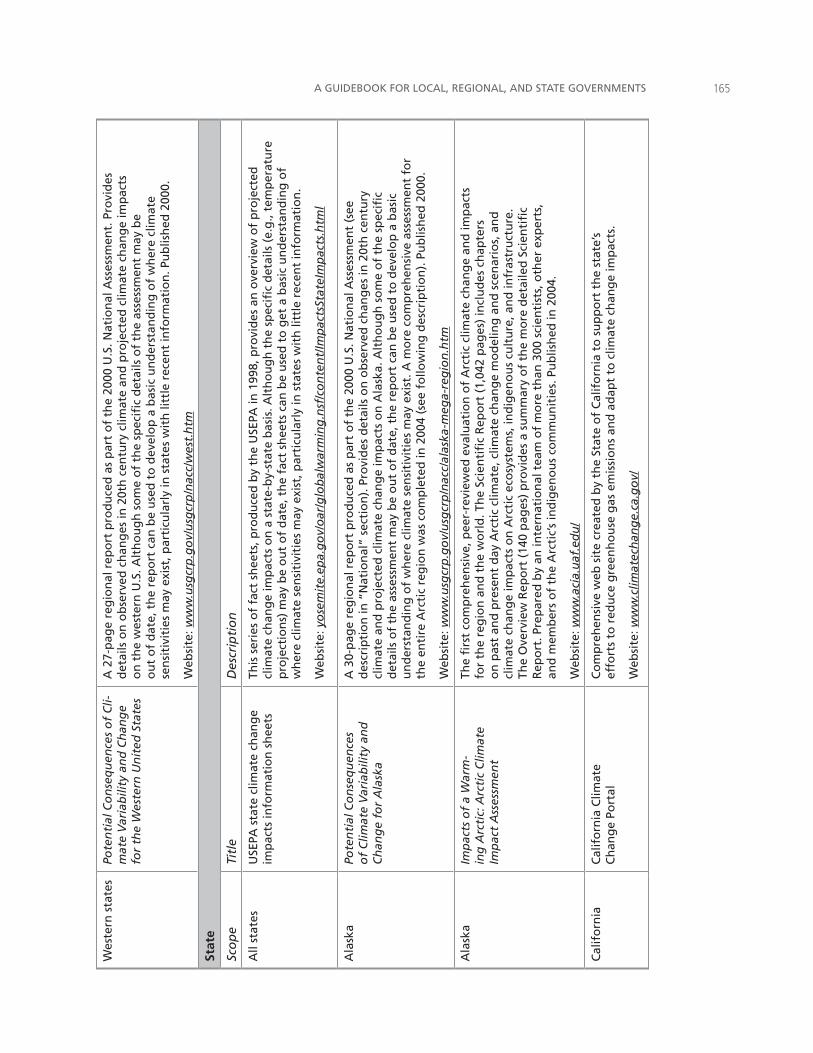
A GUIDEBOOK FOR LOCAL, REGIONAL, AND STATE GOVERNMENTS ���
Wes
tern
sta
tes
Pote
nti
al C
on
seq
uen
ces
of
Cli-
mat
e V
aria
bili
ty a
nd
Ch
ang
e fo
r th
e W
este
rn U
nit
ed S
tate
s
A 2
7-p
age
reg
ion
al r
epo
rt p
rod
uce
d a
s p
art
of
the
2000
U.S
. Nat
ion
al A
sses
smen
t. P
rovi
des
d
etai
ls o
n o
bse
rved
ch
ang
es in
20t
h c
entu
ry c
limat
e an
d p
roje
cted
clim
ate
chan
ge
imp
acts
o
n t
he
wes
tern
U.S
. Alt
ho
ug
h s
om
e o
f th
e sp
ecifi
c d
etai
ls o
f th
e as
sess
men
t m
ay b
e o
ut
of
dat
e, t
he
rep
ort
can
be
use
d t
o d
evel
op
a b
asic
un
der
stan
din
g o
f w
her
e cl
imat
e se
nsi
tivi
ties
may
exi
st, p
arti
cula
rly
in s
tate
s w
ith
litt
le r
ecen
t in
form
atio
n. P
ub
lish
ed 2
000.
Web
site
: ww
w.u
sgcr
p.g
ov/
usg
crp
/nac
c/w
est.
htm
Stat
e
Sco
pe
Titl
eD
escr
ipti
on
All
stat
esU
SEPA
sta
te c
limat
e ch
ang
e im
pac
ts in
form
atio
n s
hee
ts
This
ser
ies
of
fact
sh
eets
, pro
du
ced
by
the
USE
PA in
199
8, p
rovi
des
an
ove
rvie
w o
f p
roje
cted
cl
imat
e ch
ang
e im
pac
ts o
n a
sta
te-b
y-st
ate
bas
is. A
lth
ou
gh
th
e sp
ecifi
c d
etai
ls (
e.g
., te
mp
erat
ure
p
roje
ctio
ns)
may
be
ou
t o
f d
ate,
th
e fa
ct s
hee
ts c
an b
e u
sed
to
get
a b
asic
un
der
stan
din
g o
f w
her
e cl
imat
e se
nsi
tivi
ties
may
exi
st, p
arti
cula
rly
in s
tate
s w
ith
litt
le r
ecen
t in
form
atio
n.
Web
site
: yo
sem
ite.
epa.
go
v/o
ar/g
lob
alw
arm
ing
.nsf
/co
nte
nt/
Imp
acts
Stat
eIm
pac
ts.h
tml
Ala
ska
Pote
nti
al C
on
seq
uen
ces
of
Clim
ate
Var
iab
ility
an
d
Ch
ang
e fo
r A
lask
a
A 3
0-p
age
reg
ion
al r
epo
rt p
rod
uce
d a
s p
art
of
the
2000
U.S
. Nat
ion
al A
sses
smen
t (s
ee
des
crip
tio
n in
“N
atio
nal
” se
ctio
n).
Pro
vid
es d
etai
ls o
n o
bse
rved
ch
ang
es in
20t
h c
entu
ry
clim
ate
and
pro
ject
ed c
limat
e ch
ang
e im
pac
ts o
n A
lask
a. A
lth
ou
gh
so
me
of
the
spec
ific
det
ails
of
the
asse
ssm
ent
may
be
ou
t o
f d
ate,
th
e re
po
rt c
an b
e u
sed
to
dev
elo
p a
bas
ic
un
der
stan
din
g o
f w
her
e cl
imat
e se
nsi
tivi
ties
may
exi
st. A
mo
re c
om
pre
hen
sive
ass
essm
ent
for
the
enti
re A
rcti
c re
gio
n w
as c
om
ple
ted
in 2
004
(see
fo
llow
ing
des
crip
tio
n).
Pu
blis
hed
200
0.
Web
site
: ww
w.u
sgcr
p.g
ov/
usg
crp
/nac
c/al
aska
-meg
a-re
gio
n.h
tm
Ala
ska
Imp
acts
of
a W
arm
-in
g A
rcti
c: A
rcti
c C
limat
e Im
pac
t A
sses
smen
t
The
firs
t co
mp
reh
ensi
ve, p
eer-
revi
ewed
eva
luat
ion
of
Arc
tic
clim
ate
chan
ge
and
imp
acts
fo
r th
e re
gio
n a
nd
th
e w
orl
d. T
he
Scie
nti
fic
Rep
ort
(1,
042
pag
es)
incl
ud
es c
hap
ters
o
n p
ast
and
pre
sen
t d
ay A
rcti
c cl
imat
e, c
limat
e ch
ang
e m
od
elin
g a
nd
sce
nar
ios,
an
d
clim
ate
chan
ge
imp
acts
on
Arc
tic
eco
syst
ems,
ind
igen
ou
s cu
ltu
re, a
nd
infr
astr
uct
ure
. Th
e O
verv
iew
Rep
ort
(14
0 p
ages
) p
rovi
des
a s
um
mar
y o
f th
e m
ore
det
aile
d S
cien
tifi
c R
epo
rt. P
rep
ared
by
an in
tern
atio
nal
tea
m o
f m
ore
th
an 3
00 s
cien
tist
s, o
ther
exp
erts
, an
d m
emb
ers
of
the
Arc
tic’
s in
dig
eno
us
com
mu
nit
ies.
Pu
blis
hed
in 2
004.
Web
site
: ww
w.a
cia.
uaf
.ed
u/
Cal
ifo
rnia
Cal
ifo
rnia
Clim
ate
Ch
ang
e Po
rtal
Co
mp
reh
ensi
ve w
eb s
ite
crea
ted
by
the
Stat
e o
f C
alif
orn
ia t
o s
up
po
rt t
he
stat
e’s
effo
rts
to r
edu
ce g
reen
ho
use
gas
em
issi
on
s an
d a
dap
t to
clim
ate
chan
ge
imp
acts
.
Web
site
: ww
w.c
limat
ech
ang
e.ca
.go
v/
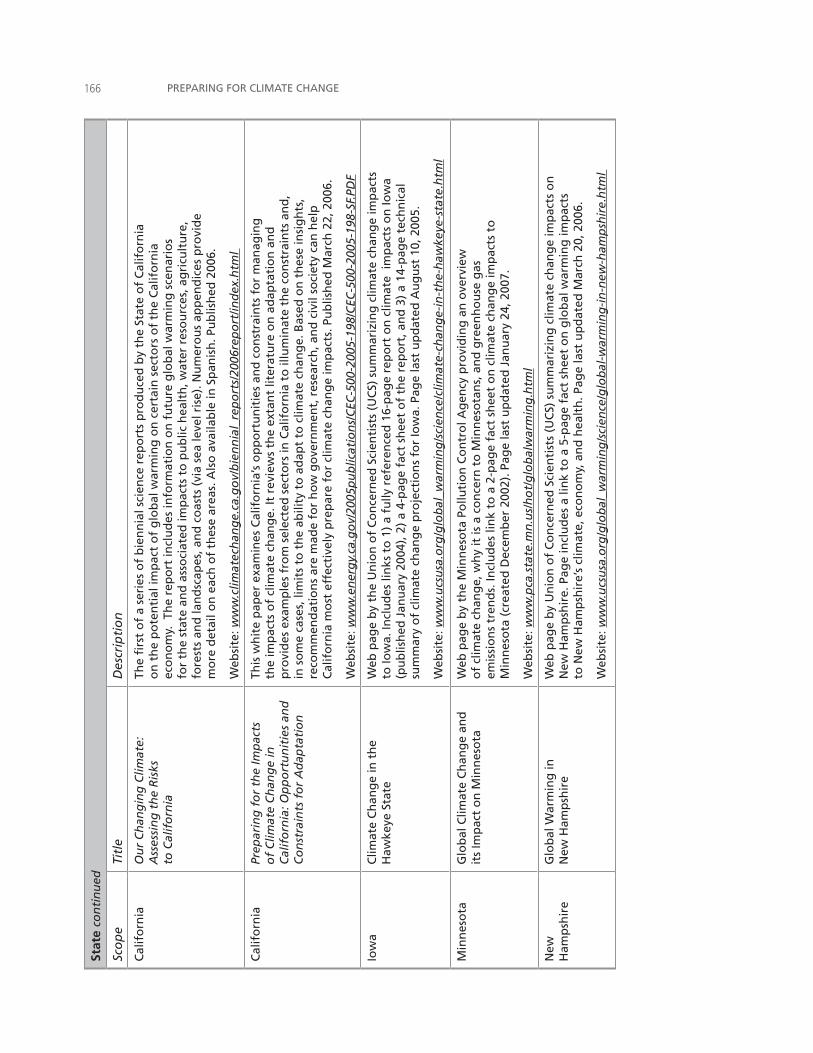
PREPARING FOR CLIMATE CHANGE���St
ate
con
tin
ued
Sco
pe
Titl
eD
escr
ipti
on
Cal
ifo
rnia
Ou
r C
han
gin
g C
limat
e:
Ass
essi
ng
th
e R
isks
to
Cal
ifo
rnia
The
firs
t o
f a
seri
es o
f b
ien
nia
l sci
ence
rep
ort
s p
rod
uce
d b
y th
e St
ate
of
Cal
ifo
rnia
o
n t
he
po
ten
tial
imp
act
of
glo
bal
war
min
g o
n c
erta
in s
ecto
rs o
f th
e C
alif
orn
ia
eco
no
my.
Th
e re
po
rt in
clu
des
info
rmat
ion
on
fu
ture
glo
bal
war
min
g s
cen
ario
s fo
r th
e st
ate
and
ass
oci
ated
imp
acts
to
pu
blic
hea
lth
, wat
er r
eso
urc
es, a
gri
cult
ure
, fo
rest
s an
d la
nd
scap
es, a
nd
co
asts
(vi
a se
a le
vel r
ise)
. Nu
mer
ou
s ap
pen
dic
es p
rovi
de
mo
re d
etai
l on
eac
h o
f th
ese
area
s. A
lso
ava
ilab
le in
Sp
anis
h. P
ub
lish
ed 2
006.
Web
site
: ww
w.c
limat
ech
ang
e.ca
.go
v/b
ien
nia
l_re
po
rts/
2006
rep
ort
/ind
ex.h
tml
Cal
ifo
rnia
Prep
arin
g f
or
the
Imp
acts
o
f C
limat
e C
han
ge
in
Cal
ifo
rnia
: Op
po
rtu
nit
ies
and
C
on
stra
ints
fo
r A
dap
tati
on
This
wh
ite
pap
er e
xam
ines
Cal
ifo
rnia
’s o
pp
ort
un
itie
s an
d c
on
stra
ints
fo
r m
anag
ing
th
e im
pac
ts o
f cl
imat
e ch
ang
e. It
rev
iew
s th
e ex
tan
t lit
erat
ure
on
ad
apta
tio
n a
nd
p
rovi
des
exa
mp
les
fro
m s
elec
ted
sec
tors
in C
alif
orn
ia t
o il
lum
inat
e th
e co
nst
rain
ts a
nd
, in
so
me
case
s, li
mit
s to
th
e ab
ility
to
ad
apt
to c
limat
e ch
ang
e. B
ased
on
th
ese
insi
gh
ts,
reco
mm
end
atio
ns
are
mad
e fo
r h
ow
go
vern
men
t, r
esea
rch
, an
d c
ivil
soci
ety
can
hel
p
Cal
ifo
rnia
mo
st e
ffec
tive
ly p
rep
are
for
clim
ate
chan
ge
imp
acts
. Pu
blis
hed
Mar
ch 2
2, 2
006.
Web
site
: ww
w.e
ner
gy.
ca.g
ov/
2005
pu
blic
atio
ns/
CEC
-500
-200
5-19
8/C
EC-5
00-2
005-
198-
SF.P
DF
Iow
aC
limat
e C
han
ge
in t
he
Haw
keye
Sta
te
Web
pag
e b
y th
e U
nio
n o
f C
on
cern
ed S
cien
tist
s (U
CS)
su
mm
ariz
ing
clim
ate
chan
ge
imp
acts
to
Iow
a. In
clu
des
lin
ks t
o 1
) a
fully
ref
eren
ced
16-
pag
e re
po
rt o
n c
limat
e im
pac
ts o
n Io
wa
(pu
blis
hed
Jan
uar
y 20
04),
2)
a 4-
pag
e fa
ct s
hee
t o
f th
e re
po
rt, a
nd
3)
a 14
-pag
e te
chn
ical
su
mm
ary
of
clim
ate
chan
ge
pro
ject
ion
s fo
r Io
wa.
Pag
e la
st u
pd
ated
Au
gu
st 1
0, 2
005.
Web
site
: ww
w.u
csu
sa.o
rg/g
lob
al_w
arm
ing
/sci
ence
/clim
ate-
chan
ge-
in-t
he-
haw
keye
-sta
te.h
tml
Min
nes
ota
Glo
bal
Clim
ate
Ch
ang
e an
d
its
Imp
act
on
Min
nes
ota
Web
pag
e b
y th
e M
inn
eso
ta P
ollu
tio
n C
on
tro
l Ag
ency
pro
vid
ing
an
ove
rvie
w
of
clim
ate
chan
ge,
wh
y it
is a
co
nce
rn t
o M
inn
eso
tan
s, a
nd
gre
enh
ou
se g
as
emis
sio
ns
tren
ds.
Incl
ud
es li
nk
to a
2-p
age
fact
sh
eet
on
clim
ate
chan
ge
imp
acts
to
M
inn
eso
ta (
crea
ted
Dec
emb
er 2
002)
. Pag
e la
st u
pd
ated
Jan
uar
y 24
, 200
7.
Web
site
: ww
w.p
ca.s
tate
.mn
.us/
ho
t/g
lob
alw
arm
ing
.htm
l
New
H
amp
shir
eG
lob
al W
arm
ing
in
New
Ham
psh
ire
Web
pag
e b
y U
nio
n o
f C
on
cern
ed S
cien
tist
s (U
CS)
su
mm
ariz
ing
clim
ate
chan
ge
imp
acts
on
N
ew H
amp
shir
e. P
age
incl
ud
es a
lin
k to
a 5
-pag
e fa
ct s
hee
t o
n g
lob
al w
arm
ing
imp
acts
to
New
Ham
psh
ire’
s cl
imat
e, e
con
om
y, a
nd
hea
lth
. Pag
e la
st u
pd
ated
Mar
ch 2
0, 2
006.
Web
site
: ww
w.u
csu
sa.o
rg/g
lob
al_w
arm
ing
/sci
ence
/glo
bal
-war
min
g-i
n-n
ew-h
amp
shir
e.h
tml
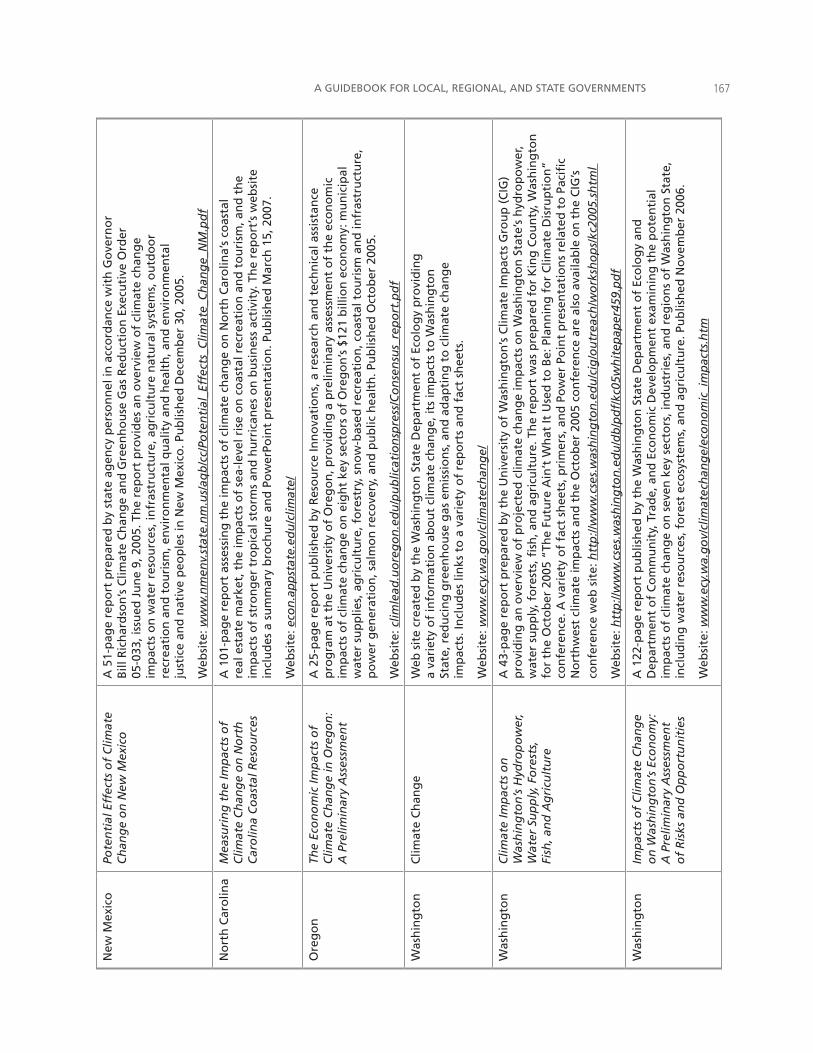
A GUIDEBOOK FOR LOCAL, REGIONAL, AND STATE GOVERNMENTS ���
New
Mex
ico
Pote
nti
al E
ffec
ts o
f C
limat
e C
han
ge
on
New
Mex
ico
A 5
1-p
age
rep
ort
pre
par
ed b
y st
ate
agen
cy p
erso
nn
el in
acc
ord
ance
wit
h G
ove
rno
r B
ill R
ich
ard
son
’s C
limat
e C
han
ge
and
Gre
enh
ou
se G
as R
edu
ctio
n E
xecu
tive
Ord
er
05-0
33, i
ssu
ed J
un
e 9,
200
5. T
he
rep
ort
pro
vid
es a
n o
verv
iew
of
clim
ate
chan
ge
imp
acts
on
wat
er r
eso
urc
es, i
nfr
astr
uct
ure
, ag
ricu
ltu
re n
atu
ral s
yste
ms,
ou
tdo
or
recr
eati
on
an
d t
ou
rism
, en
viro
nm
enta
l qu
alit
y an
d h
ealt
h, a
nd
en
viro
nm
enta
l ju
stic
e an
d n
ativ
e p
eop
les
in N
ew M
exic
o. P
ub
lish
ed D
ecem
ber
30,
200
5.
Web
site
: ww
w.n
men
v.st
ate.
nm
.us/
aqb
/cc/
Pote
nti
al_E
ffec
ts_C
limat
e_C
han
ge_
NM
.pd
f
No
rth
Car
olin
aM
easu
rin
g t
he
Imp
acts
of
Clim
ate
Ch
ang
e o
n N
ort
h
Car
olin
a C
oas
tal R
eso
urc
es
A 1
01-p
age
rep
ort
ass
essi
ng
th
e im
pac
ts o
f cl
imat
e ch
ang
e o
n N
ort
h C
aro
lina’
s co
asta
l re
al e
stat
e m
arke
t, t
he
imp
acts
of
sea-
leve
l ris
e o
n c
oas
tal r
ecre
atio
n a
nd
to
uri
sm, a
nd
th
e im
pac
ts o
f st
ron
ger
tro
pic
al s
torm
s an
d h
urr
ican
es o
n b
usi
nes
s ac
tivi
ty. T
he
rep
ort
’s w
ebsi
te
incl
ud
es a
su
mm
ary
bro
chu
re a
nd
Po
wer
Poin
t p
rese
nta
tio
n. P
ub
lish
ed M
arch
15,
200
7.
Web
site
: eco
n.a
pp
stat
e.ed
u/c
limat
e/
Ore
go
nTh
e Ec
on
om
ic Im
pac
ts o
f C
limat
e C
han
ge
in O
reg
on
: A
Pre
limin
ary
Ass
essm
ent
A 2
5-p
age
rep
ort
pu
blis
hed
by
Res
ou
rce
Inn
ova
tio
ns,
a r
esea
rch
an
d t
ech
nic
al a
ssis
tan
ce
pro
gra
m a
t th
e U
niv
ersi
ty o
f O
reg
on
, pro
vid
ing
a p
relim
inar
y as
sess
men
t o
f th
e ec
on
om
ic
imp
acts
of
clim
ate
chan
ge
on
eig
ht
key
sect
ors
of
Ore
go
n’s
$12
1 b
illio
n e
con
om
y: m
un
icip
al
wat
er s
up
plie
s, a
gri
cult
ure
, fo
rest
ry, s
no
w-b
ased
rec
reat
ion
, co
asta
l to
uri
sm a
nd
infr
astr
uct
ure
, p
ow
er g
ener
atio
n, s
alm
on
rec
ove
ry, a
nd
pu
blic
hea
lth
. Pu
blis
hed
Oct
ob
er 2
005.
Web
site
: clim
lead
.uo
reg
on
.ed
u/p
ub
licat
ion
spre
ss/C
on
sen
sus_
rep
ort
.pd
f
Was
hin
gto
nC
limat
e C
han
ge
Web
sit
e cr
eate
d b
y th
e W
ash
ing
ton
Sta
te D
epar
tmen
t o
f Ec
olo
gy
pro
vid
ing
a
vari
ety
of
info
rmat
ion
ab
ou
t cl
imat
e ch
ang
e, it
s im
pac
ts t
o W
ash
ing
ton
St
ate,
red
uci
ng
gre
enh
ou
se g
as e
mis
sio
ns,
an
d a
dap
tin
g t
o c
limat
e ch
ang
e im
pac
ts. I
ncl
ud
es li
nks
to
a v
arie
ty o
f re
po
rts
and
fac
t sh
eets
.
Web
site
: ww
w.e
cy.w
a.g
ov/
clim
atec
han
ge/
Was
hin
gto
nC
limat
e Im
pac
ts o
n
Was
hin
gto
n’s
Hyd
rop
ow
er,
Wat
er S
up
ply
, Fo
rest
s,
Fish
, an
d A
gri
cult
ure
A 4
3-p
age
rep
ort
pre
par
ed b
y th
e U
niv
ersi
ty o
f W
ash
ing
ton
’s C
limat
e Im
pac
ts G
rou
p (
CIG
) p
rovi
din
g a
n o
verv
iew
of
pro
ject
ed c
limat
e ch
ang
e im
pac
ts o
n W
ash
ing
ton
Sta
te’s
hyd
rop
ow
er,
wat
er s
up
ply
, fo
rest
s, fi
sh, a
nd
ag
ricu
ltu
re. T
he
rep
ort
was
pre
par
ed f
or
Kin
g C
ou
nty
, Was
hin
gto
n
for
the
Oct
ob
er 2
005
“Th
e Fu
ture
Ain
’t W
hat
It U
sed
to
Be:
Pla
nn
ing
fo
r C
limat
e D
isru
pti
on
” co
nfe
ren
ce. A
var
iety
of
fact
sh
eets
, pri
mer
s, a
nd
Po
wer
Po
int
pre
sen
tati
on
s re
late
d t
o P
acifi
c N
ort
hw
est
clim
ate
imp
acts
an
d t
he
Oct
ob
er 2
005
con
fere
nce
are
als
o a
vaila
ble
on
th
e C
IG’s
co
nfe
ren
ce w
eb s
ite:
htt
p://
ww
w.c
ses.
was
hin
gto
n.e
du
/cig
/ou
trea
ch/w
ork
sho
ps/
kc20
05.s
htm
l
Web
site
: htt
p://
ww
w.c
ses.
was
hin
gto
n.e
du
/db
/pd
f/kc
05w
hit
epap
er45
9.p
df
Was
hin
gto
nIm
pac
ts o
f C
limat
e C
han
ge
on
Was
hin
gto
n’s
Eco
no
my:
A
Pre
limin
ary
Ass
essm
ent
of
Ris
ks a
nd
Op
po
rtu
nit
ies
A 1
22-p
age
rep
ort
pu
blis
hed
by
the
Was
hin
gto
n S
tate
Dep
artm
ent
of
Eco
log
y an
d
Dep
artm
ent
of
Co
mm
un
ity,
Tra
de,
an
d E
con
om
ic D
evel
op
men
t ex
amin
ing
th
e p
ote
nti
al
imp
acts
of
clim
ate
chan
ge
on
sev
en k
ey s
ecto
rs, i
nd
ust
ries
, an
d r
egio
ns
of
Was
hin
gto
n S
tate
, in
clu
din
g w
ater
res
ou
rces
, fo
rest
eco
syst
ems,
an
d a
gri
cult
ure
. Pu
blis
hed
No
vem
ber
200
6.
Web
site
: ww
w.e
cy.w
a.g
ov/
clim
atec
han
ge/
eco
no
mic
_im
pac
ts.h
tm
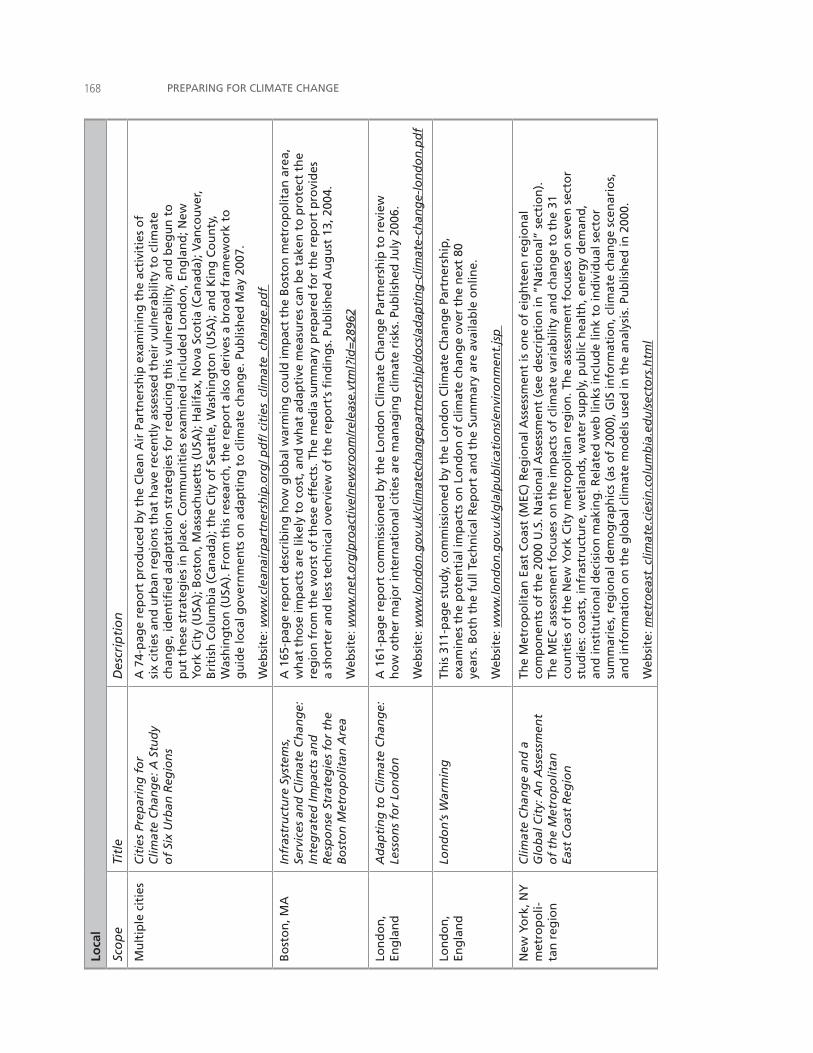
PREPARING FOR CLIMATE CHANGE���Lo
cal
Sco
pe
Titl
eD
escr
ipti
on
Mu
ltip
le c
itie
sC
itie
s Pr
epar
ing
fo
r C
limat
e C
han
ge:
A S
tud
y o
f Si
x U
rban
Reg
ion
s
A 7
4-p
age
rep
ort
pro
du
ced
by
the
Cle
an A
ir P
artn
ersh
ip e
xam
inin
g t
he
acti
viti
es o
f si
x ci
ties
an
d u
rban
reg
ion
s th
at h
ave
rece
ntl
y as
sess
ed t
hei
r vu
lner
abili
ty t
o c
limat
e ch
ang
e, id
enti
fied
ad
apta
tio
n s
trat
egie
s fo
r re
du
cin
g t
his
vu
lner
abili
ty, a
nd
beg
un
to
p
ut
thes
e st
rate
gie
s in
pla
ce. C
om
mu
nit
ies
exam
ined
incl
ud
ed L
on
do
n, E
ng
lan
d; N
ew
York
Cit
y (U
SA);
Bo
sto
n, M
assa
chu
sett
s (U
SA);
Hal
ifax
, No
va S
coti
a (C
anad
a); V
anco
uve
r, B
riti
sh C
olu
mb
ia (
Can
ada)
; th
e C
ity
of
Seat
tle,
Was
hin
gto
n (
USA
); a
nd
Kin
g C
ou
nty
, W
ash
ing
ton
(U
SA).
Fro
m t
his
res
earc
h, t
he
rep
ort
als
o d
eriv
es a
bro
ad f
ram
ewo
rk t
o
gu
ide
loca
l go
vern
men
ts o
n a
dap
tin
g t
o c
limat
e ch
ang
e. P
ub
lish
ed M
ay 2
007.
Web
site
: ww
w.c
lean
airp
artn
ersh
ip.o
rg/ p
df/
cit
ies_
clim
ate_
chan
ge.
pd
f
Bo
sto
n, M
AIn
fras
tru
ctu
re S
yste
ms,
Se
rvic
es a
nd
Clim
ate
Ch
ang
e:
Inte
gra
ted
Imp
acts
an
d
Res
po
nse
Str
ateg
ies
for
the
Bo
sto
n M
etro
po
litan
Are
a
A 1
65-p
age
rep
ort
des
crib
ing
ho
w g
lob
al w
arm
ing
co
uld
imp
act
the
Bo
sto
n m
etro
po
litan
are
a,
wh
at t
ho
se im
pac
ts a
re li
kely
to
co
st, a
nd
wh
at a
dap
tive
mea
sure
s ca
n b
e ta
ken
to
pro
tect
th
e re
gio
n f
rom
th
e w
ors
t o
f th
ese
effe
cts.
Th
e m
edia
su
mm
ary
pre
par
ed f
or
the
rep
ort
pro
vid
es
a sh
ort
er a
nd
less
tec
hn
ical
ove
rvie
w o
f th
e re
po
rt’s
fin
din
gs.
Pu
blis
hed
Au
gu
st 1
3, 2
004.
Web
site
: ww
w.n
et.o
rg/p
roac
tive
/new
sro
om
/rel
ease
.vtm
l?id
=28
962
Lon
do
n,
Eng
lan
dA
dap
tin
g t
o C
limat
e C
han
ge:
Le
sso
ns
for
Lon
do
nA
161
-pag
e re
po
rt c
om
mis
sio
ned
by
the
Lon
do
n C
limat
e C
han
ge
Part
ner
ship
to
rev
iew
h
ow
oth
er m
ajo
r in
tern
atio
nal
cit
ies
are
man
agin
g c
limat
e ri
sks.
Pu
blis
hed
Ju
ly 2
006.
Web
site
: ww
w.lo
nd
on
.go
v.u
k/cl
imat
ech
ang
epar
tner
ship
/do
cs/a
dap
tin
g-c
limat
e-ch
ang
e-lo
nd
on
.pd
f
Lon
do
n,
Eng
lan
dLo
nd
on
’s W
arm
ing
This
311
-pag
e st
ud
y, c
om
mis
sio
ned
by
the
Lon
do
n C
limat
e C
han
ge
Part
ner
ship
, ex
amin
es t
he
po
ten
tial
imp
acts
on
Lo
nd
on
of
clim
ate
chan
ge
ove
r th
e n
ext
80
year
s. B
oth
th
e fu
ll Te
chn
ical
Rep
ort
an
d t
he
Sum
mar
y ar
e av
aila
ble
on
line.
Web
site
: ww
w.lo
nd
on
.go
v.u
k/g
la/p
ub
licat
ion
s/en
viro
nm
ent.
jsp
New
Yo
rk, N
Y
met
rop
oli-
tan
reg
ion
Clim
ate
Ch
ang
e an
d a
G
lob
al C
ity:
An
Ass
essm
ent
of
the
Met
rop
olit
an
East
Co
ast
Reg
ion
The
Met
rop
olit
an E
ast
Co
ast
(MEC
) R
egio
nal
Ass
essm
ent
is o
ne
of
eig
hte
en r
egio
nal
co
mp
on
ents
of
the
2000
U.S
. Nat
ion
al A
sses
smen
t (s
ee d
escr
ipti
on
in “
Nat
ion
al”
sect
ion
).
The
MEC
ass
essm
ent
focu
ses
on
th
e im
pac
ts o
f cl
imat
e va
riab
ility
an
d c
han
ge
to t
he
31
cou
nti
es o
f th
e N
ew Y
ork
Cit
y m
etro
po
litan
reg
ion
. Th
e as
sess
men
t fo
cuse
s o
n s
even
sec
tor
stu
die
s: c
oas
ts, i
nfr
astr
uct
ure
, wet
lan
ds,
wat
er s
up
ply
, pu
blic
hea
lth
, en
erg
y d
eman
d,
and
inst
itu
tio
nal
dec
isio
n m
akin
g. R
elat
ed w
eb li
nks
incl
ud
e lin
k to
ind
ivid
ual
sec
tor
sum
mar
ies,
reg
ion
al d
emo
gra
ph
ics
(as
of
2000
), G
IS in
form
atio
n, c
limat
e ch
ang
e sc
enar
ios,
an
d in
form
atio
n o
n t
he
glo
bal
clim
ate
mo
del
s u
sed
in t
he
anal
ysis
. Pu
blis
hed
in 2
000.
Web
site
: met
roea
st_c
limat
e.ci
esin
.co
lum
bia
.ed
u/s
ecto
rs.h
tml
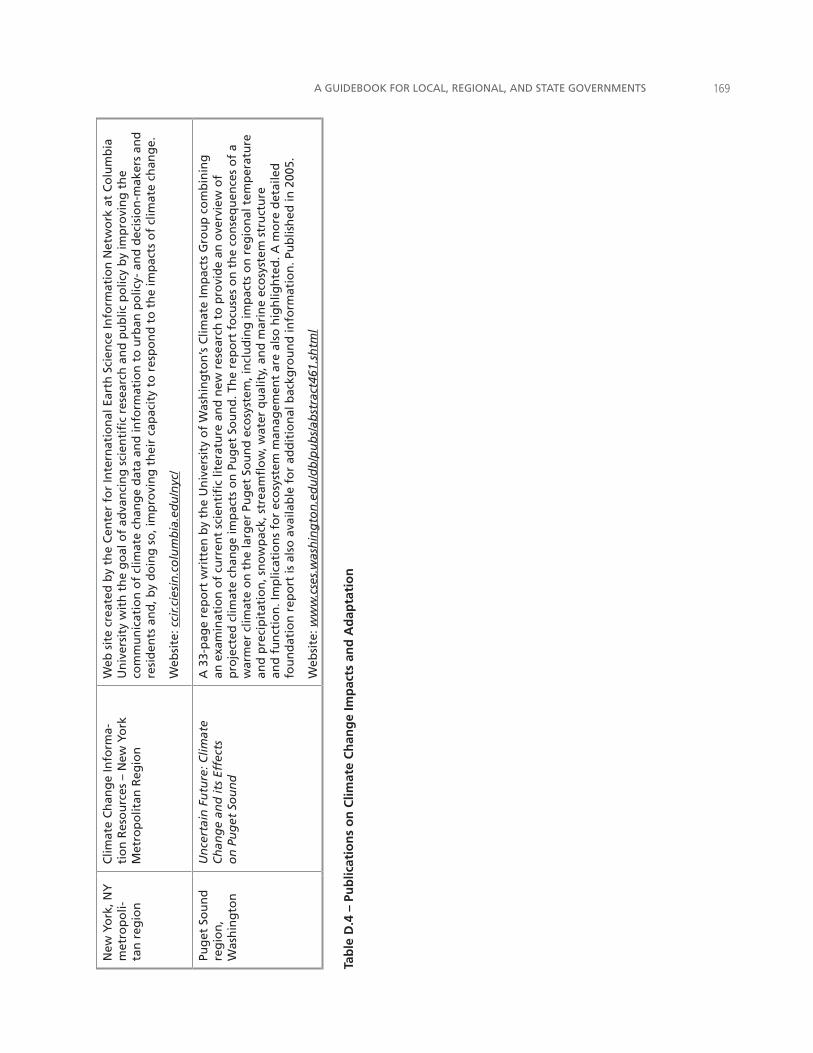
A GUIDEBOOK FOR LOCAL, REGIONAL, AND STATE GOVERNMENTS ���
New
Yo
rk, N
Y
met
rop
oli-
tan
reg
ion
Clim
ate
Ch
ang
e In
form
a-ti
on
Res
ou
rces
– N
ew Y
ork
M
etro
po
litan
Reg
ion
Web
sit
e cr
eate
d b
y th
e C
ente
r fo
r In
tern
atio
nal
Ear
th S
cien
ce In
form
atio
n N
etw
ork
at
Co
lum
bia
U
niv
ersi
ty w
ith
th
e g
oal
of
adva
nci
ng
sci
enti
fic
rese
arch
an
d p
ub
lic p
olic
y b
y im
pro
vin
g t
he
com
mu
nic
atio
n o
f cl
imat
e ch
ang
e d
ata
and
info
rmat
ion
to
urb
an p
olic
y- a
nd
dec
isio
n-m
aker
s an
d
resi
den
ts a
nd
, by
do
ing
so
, im
pro
vin
g t
hei
r ca
pac
ity
to r
esp
on
d t
o t
he
imp
acts
of
clim
ate
chan
ge.
Web
site
: cci
r.cie
sin
.co
lum
bia
.ed
u/n
yc/
Pug
et S
ou
nd
re
gio
n,
Was
hin
gto
n
Un
cert
ain
Fu
ture
: Clim
ate
Ch
ang
e an
d it
s Ef
fect
s o
n P
ug
et S
ou
nd
A 3
3-p
age
rep
ort
wri
tten
by
the
Un
iver
sity
of
Was
hin
gto
n’s
Clim
ate
Imp
acts
Gro
up
co
mb
inin
g
an e
xam
inat
ion
of
curr
ent
scie
nti
fic
liter
atu
re a
nd
new
res
earc
h t
o p
rovi
de
an o
verv
iew
of
pro
ject
ed c
limat
e ch
ang
e im
pac
ts o
n P
ug
et S
ou
nd
. Th
e re
po
rt f
ocu
ses
on
th
e co
nse
qu
ence
s o
f a
war
mer
clim
ate
on
th
e la
rger
Pu
get
So
un
d e
cosy
stem
, in
clu
din
g im
pac
ts o
n r
egio
nal
tem
per
atu
re
and
pre
cip
itat
ion
, sn
ow
pac
k, s
trea
mfl
ow
, wat
er q
ual
ity,
an
d m
arin
e ec
osy
stem
str
uct
ure
an
d f
un
ctio
n. I
mp
licat
ion
s fo
r ec
osy
stem
man
agem
ent
are
also
hig
hlig
hte
d. A
mo
re d
etai
led
fo
un
dat
ion
rep
ort
is a
lso
ava
ilab
le f
or
add
itio
nal
bac
kgro
un
d in
form
atio
n. P
ub
lish
ed in
200
5.
Web
site
: ww
w.c
ses.
was
hin
gto
n.e
du
/db
/pu
bs/
abst
ract
461.
shtm
l
Tab
le D
.4 –
Pu
blic
atio
ns
on
Clim
ate
Ch
ang
e Im
pac
ts a
nd
Ad
apta
tio
n
PREPARING FOR CLIMATE CHANGE��0
D.5 Regional Resources on Climate: NOAA’s Regional Integrated Sciences and Assessment TeamsThe Regional Integrated Sciences and Assessments (RISA) program, funded by the National Oceanic and Atmospheric Administration’s Climate Program Office, was established in the mid-1990s to improve the link between climate sciences and society. The RISA program supports research and stakeholder interaction aimed at improving our understanding of how climate affects various regions of the United States, and facilitating the use of climate information in decision making at the regional and local level.
RISA research team members are primarily based at universities though some of the team members are based at government research facilities, non-profit organizations, or private sector entities. Currently funded RISA teams are shown in Figure D.5.1. These teams are responsible for monitoring and analyzing climate data and applying, providing, and interpreting climate information for resource managers and policymakers in the U.S. RISAs can be a good resource for regionally-specific information about climate change and regional climate change impacts. Depending on the region, the research focuses on the fisheries, water, wildfire, agriculture, public health, and coastal restoration sectors. Current RISA team locations and the regions and sectors they currently study are listed in Table D.5.1.
The RISA program may expand in the future into regions not currently covered as funding and opportunities become available. Please check with the Federal Registry to see current funding opportunities under the RISA program. RISA expansion would require the support of NOAA leadership and Congress. More information about RISA can be found on the web: http://www.climate.noaa.gov/cpo_pa/risa/.
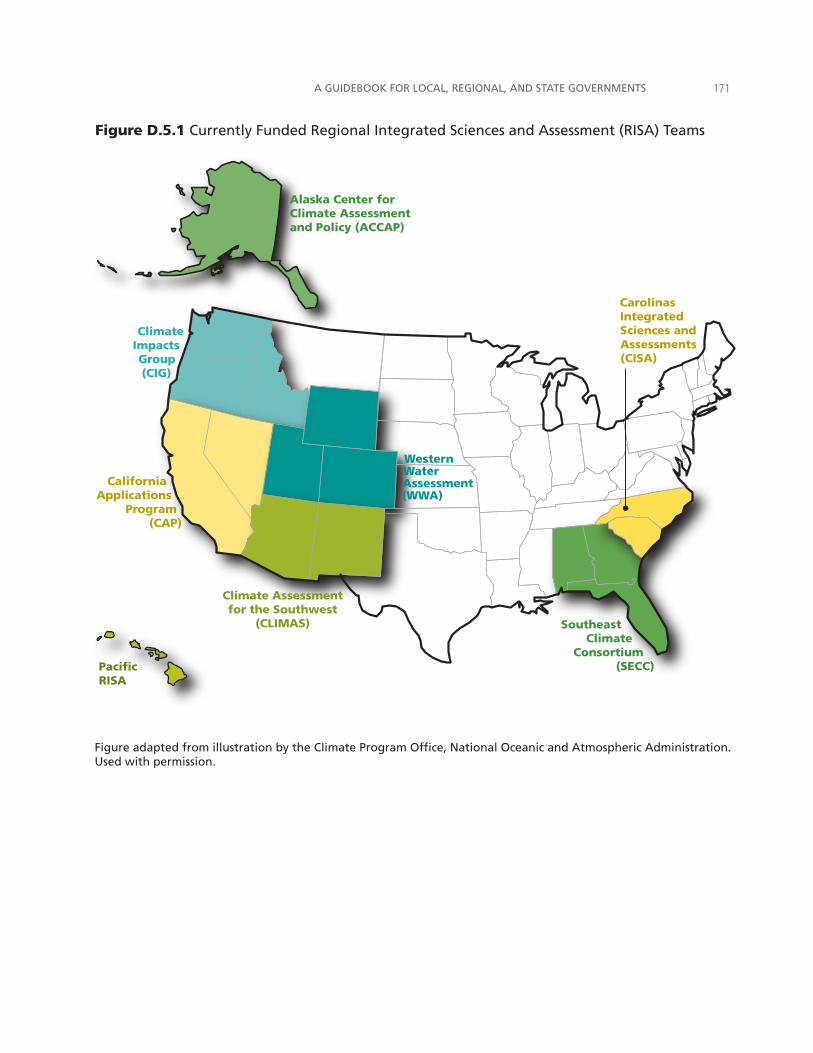
A GUIDEBOOK FOR LOCAL, REGIONAL, AND STATE GOVERNMENTS ���
Figure D.5.1 Currently Funded Regional Integrated Sciences and Assessment (RISA) Teams
Figure adapted from illustration by the Climate Program Office, National Oceanic and Atmospheric Administration. Used with permission.
Alaska Center for Climate Assessment and Policy (ACCAP)
SoutheastClimate
Consortium(SECC)
Western Water Assessment(WWA)
Carolinas IntegratedSciences and Assessments(CISA)
Climate Assessment for the Southwest
(CLIMAS)
PacificRISA
ClimateImpactsGroup (CIG)
California Applications
Program (CAP)
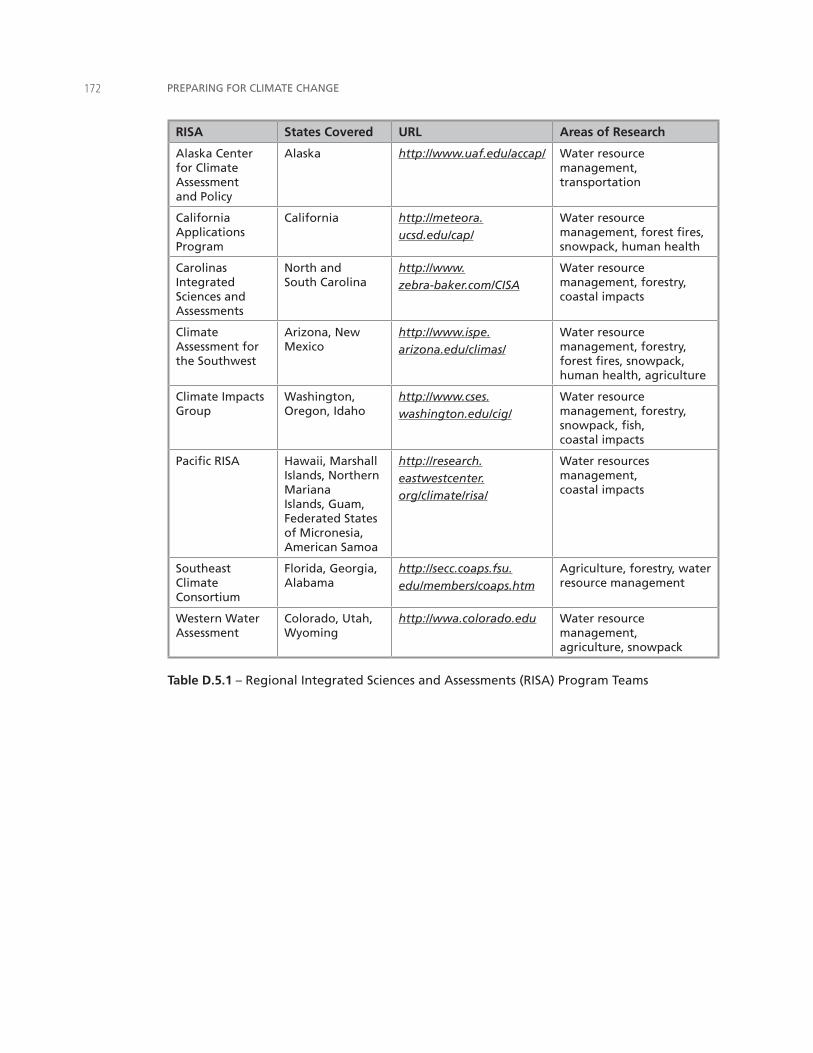
PREPARING FOR CLIMATE CHANGE���
RISA States Covered URL Areas of Research
Alaska Center for Climate Assessment and Policy
Alaska http://www.uaf.edu/accap/ Water resource management, transportation
California Applications Program
California http://meteora.
ucsd.edu/cap/
Water resource management, forest fires, snowpack, human health
Carolinas Integrated Sciences and Assessments
North and South Carolina
http://www.
zebra-baker.com/CISA
Water resource management, forestry, coastal impacts
Climate Assessment for the Southwest
Arizona, New Mexico
http://www.ispe.
arizona.edu/climas/
Water resource management, forestry, forest fires, snowpack, human health, agriculture
Climate Impacts Group
Washington, Oregon, Idaho
http://www.cses.
washington.edu/cig/
Water resource management, forestry, snowpack, fish, coastal impacts
Pacific RISA Hawaii, Marshall Islands, Northern Mariana Islands, Guam, Federated States of Micronesia, American Samoa
http://research.
eastwestcenter.
org/climate/risa/
Water resources management, coastal impacts
Southeast Climate Consortium
Florida, Georgia, Alabama
http://secc.coaps.fsu.
edu/members/coaps.htm
Agriculture, forestry, water resource management
Western Water Assessment
Colorado, Utah, Wyoming
http://wwa.colorado.edu Water resource management, agriculture, snowpack
Table D.5.1 – Regional Integrated Sciences and Assessments (RISA) Program Teams

If you are a local, regional, or state decision-maker, this guidebook will answer your questions about preparing for climate change:
• How do you scope out the problems of climate change across sectors of your community?
• How do you raise and maintain support to prepare for climate change?
• Whom should you include on a climate change preparedness team?
• Which of your planning areas are relevant to climate change impacts?
• How do you evaluate your climate sensitivity and adaptive capacity (i.e., conduct a climate change vulnerability assessment)? How do you conduct a climate change risk assessment?
• How do identify your climate change priority planning areas?
• How do you establish a vision and guiding principles for a climate resilient community?
• How do you begin to develop climate change preparedness goals and actions in these priority planning areas?
• How do you develop a climate change preparedness plan?
• How do you ensure that you have the right implementation tools to take your preparedness actions?
• How do you develop measures of resilience to track your progress and update your plans over time, to ensure that your efforts are really making your community more resilient to climate change?