Embed Size (px)
Citation preview
A Hard Bargain? A cost benefit analysis of an improved cookstove program in
India
Prepared by: Alisha Pinto Master of Public Policy Candidate
The Sanford School of Public Policy Duke University
Faculty Advisor: Dr. Marc Jeuland
Disclaimer: This student paper was prepared in 2016 in partial completion of the requirement of the Master’s Project, a major assignment for the Master of Public Policy Program at the Sanford School of Public Policy at Duke University. The research analysis and policy alternatives and recommendations contained in this paper are the work of the student who authored the document, and do not represent the official or unofficial views of the Sanford School of Public Policy or Duke University. Without the specific permission of the author, this paper may not be used or cited for any purpose other than to inform the client organization about the subject matter. The author relied in many instances on the data provided by the client and related organizations and makes no independent representations as to the accuracy of the data.
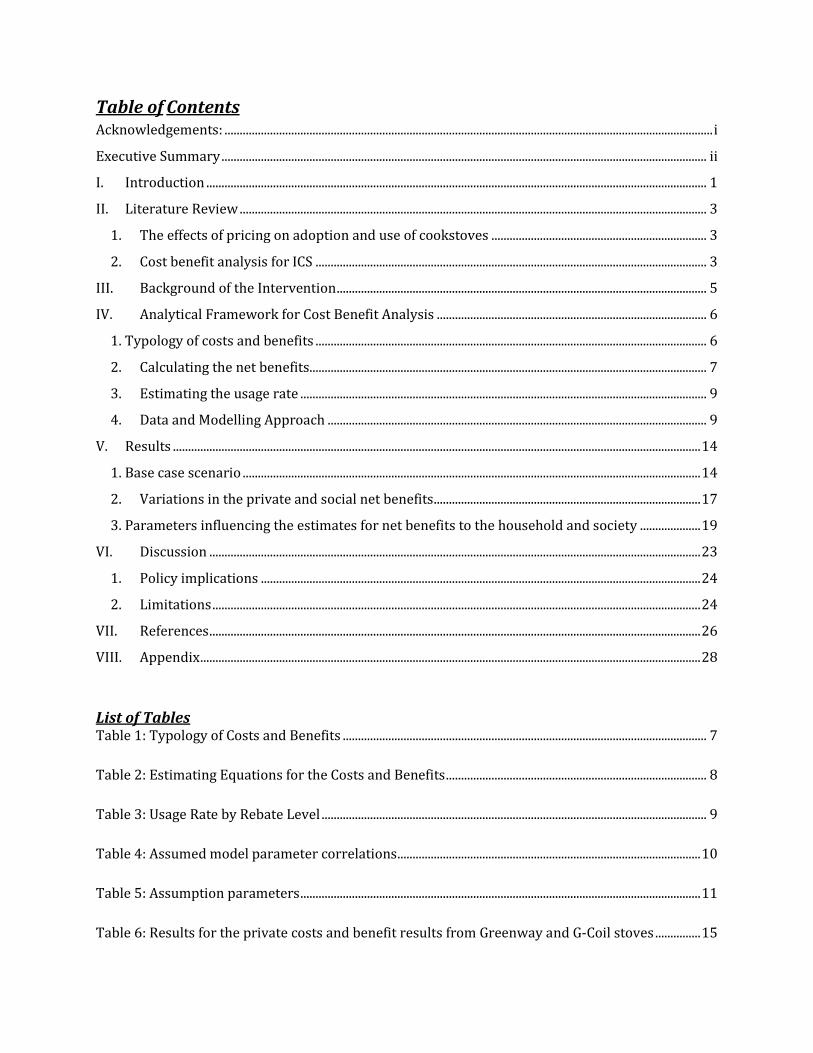
Table of Contents Acknowledgements: ................................................................................................................................................................. i
Executive Summary ................................................................................................................................................................ ii
I. Introduction ..................................................................................................................................................................... 1
II. Literature Review .......................................................................................................................................................... 3
1. The effects of pricing on adoption and use of cookstoves ....................................................................... 3
2. Cost benefit analysis for ICS ................................................................................................................................. 3
III. Background of the Intervention .......................................................................................................................... 5
IV. Analytical Framework for Cost Benefit Analysis ......................................................................................... 6
1. Typology of costs and benefits ................................................................................................................................. 6
2. Calculating the net benefits................................................................................................................................... 7
3. Estimating the usage rate ...................................................................................................................................... 9
4. Data and Modelling Approach ............................................................................................................................. 9
V. Results .............................................................................................................................................................................. 14
1. Base case scenario ....................................................................................................................................................... 14
2. Variations in the private and social net benefits ........................................................................................ 17
3. Parameters influencing the estimates for net benefits to the household and society .................... 19
VI. Discussion .................................................................................................................................................................. 23
1. Policy implications ................................................................................................................................................. 24
2. Limitations ................................................................................................................................................................. 24
VII. References .................................................................................................................................................................. 26
VIII. Appendix ..................................................................................................................................................................... 28
List of Tables Table 1: Typology of Costs and Benefits ........................................................................................................................ 7
Table 2: Estimating Equations for the Costs and Benefits ...................................................................................... 8
Table 3: Usage Rate by Rebate Level ............................................................................................................................... 9
Table 4: Assumed model parameter correlations .................................................................................................... 10
Table 5: Assumption parameters .................................................................................................................................... 11
Table 6: Results for the private costs and benefit results from Greenway and G-Coil stoves ............... 15
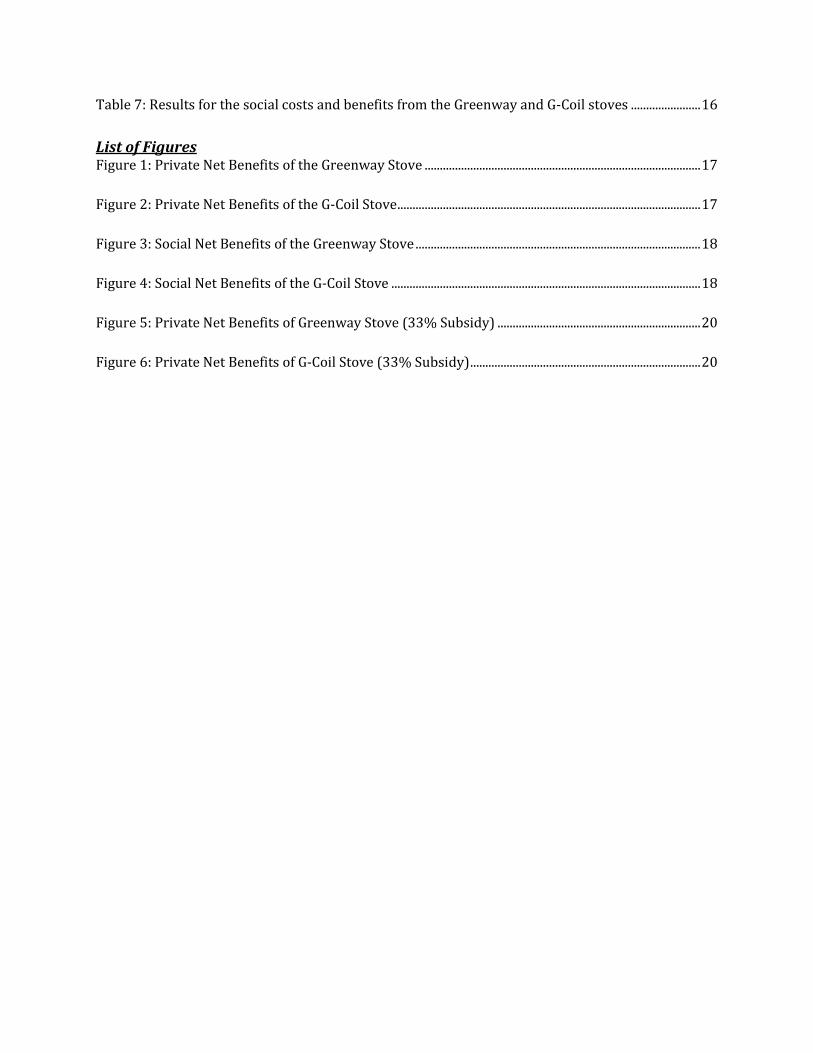
Table 7: Results for the social costs and benefits from the Greenway and G-Coil stoves ....................... 16
List of Figures Figure 1: Private Net Benefits of the Greenway Stove ........................................................................................... 17
Figure 2: Private Net Benefits of the G-Coil Stove .................................................................................................... 17
Figure 3: Social Net Benefits of the Greenway Stove .............................................................................................. 18
Figure 4: Social Net Benefits of the G-Coil Stove ...................................................................................................... 18
Figure 5: Private Net Benefits of Greenway Stove (33% Subsidy) ................................................................... 20
Figure 6: Private Net Benefits of G-Coil Stove (33% Subsidy) ............................................................................ 20

i
Acknowledgements:
Sanford School of Public Policy
Marc Jeuland
Subhrendu Pattanayak
Pope (Mac) McCorkle
Alex Pfaff
Family
Audry, Frederick, Preethi & Vinay Pinto
Blanche Saldanha
Aloysius & Suzanne Pinto
John & Susan Saldanha
Fatima, Victor, Ryan & Amanda Pinheiro
Mary Saldanha
And, Azam Khan
Friends
Dhara Mehta
Ariadne Rivera
Adi Pradana
Matthew Borden
Marialejandra Guzman
Anam Shoaib
Foundations:
R.D.Sethna Foundation
Ratan Tata Trust
Lotus Foundation
ii
EXECUTIVE SUMMARY
INTRODUCTION In developing countries, access to modern energy for cooking and heating still remains a challenge to raising households out of poverty. About 2.5 billion people depend on solid fuels such as biomass, wood, charcoal and animal dung. The use of solid fuels has negative outcomes for health, the environment and economic development (Universal Energy Access, UNDP). In low income countries, 1.3 million deaths occur due to indoor smoke or air pollution from burning solid fuels in small, confined and unventilated kitchens or homes. In addition, pollutants such as black carbon, methane and ozone, emitted when burning inefficient fuels, are responsible for a fraction of the climate change and air pollution (Scovronick, 2015). There are international efforts to promote the use of clean cookstoves in developing countries but limited evidence on the economic benefits of such distribution programs. This study undertook a systematic economic evaluation of a program that distributed subsidized improved cookstoves to rural households in India. The evaluation examined the effect of different levels of subsidies on the net benefits to the household and to society. This paper answers the question, “Ex post, what are the economic benefits to various stakeholders of a program that distributed subsidized improved cookstoves?” In addressing this question, the evaluation used empirical data from India applied to a cost-benefit model to examine how subsidies affect the costs and the benefits of the biomass improved cookstove and the electric improved cookstove to different stakeholders. METHODOLOGY
This study assesses a stove distribution project in Uttarakhand, India where households purchased either an improved biomass cookstove or an electric cookstove and paid for it in periodic installments. At the end of the payment period households were randomly offered a rebate of 2 percent, 20 percent or 33 percent of the stove cost. The analysis calculates the net benefits for each type of stove at the different subsidy levels. The model differentiates between private net benefits and social net benefits. The costs include capital or stove costs, program costs, operational and maintenance costs and learning costs for households. The capital, program and the operation and maintenance costs were calculated based on information specific to the implementation of the Uttarakhand program. The benefits from improved cook stoves are health benefits particularly reductions is morbidity and mortality from acute lower respiratory infection (ALRI), chronic obstructive pulmonary disease (COPD), ischemic heart disease (IHD) and lung cancer. The other benefits are the time saved by households through reduced cooking time and fuel collection, fuel savings from greater fuel efficiency, and environmental benefits from reduced emissions and deforestation. To account for uncertainties in the estimated parameters, the study runs Monte Carlo simulations of the net benefits of each model. These simulations provide a range of possible outcomes for the net benefits with various combinations of the parameter values to account for the uncertainty. The study also runs a sensitivity analysis that determines the main drivers of the net benefits. The sensitivity analysis informs us about the parameter values that have the most influence or can lead to the greatest variations in the outcomes.
iii
KEY FINDINGS Overall, the study finds that the net benefits from the improved biomass cookstove are largely negative while the net benefits from the improved electric cookstove are positive. At the baseline, we observe negative private and social net benefits from the biomass stove but positive private and social net benefits for the electric cookstove. There is a low extent of variation in the outcomes at different subsidy levels for households and for society. After running the Monte Carlo simulations and the sensitivity analysis, we observe four main results:
1. Private net benefits from improved biomass cookstoves are highly negative.
The Monte Carlo simulations show that for the private benefits of the improved biomass cookstove at every subsidy level, the probability of having a negative outcome was about 90 percent (Figure 1). The results are driven mainly by the capital costs of the stove, the learning costs (costs associated with learning how to use the stove), the cost of fuelwood and the quantity of wood required for the stove.
2. Social net benefits from improved biomass cookstoves are highly negative
Similarly, the social benefits of this stove are also negative for about 75 percent of the outcomes. Here also, the drivers of these negative results are the same for the private benefits - the capital costs of the stove, the learning costs and the lack of savings from fuelwood. An additional factor affecting the social benefits is the lack of reductions in carbon emissions.
3. Private net benefits from improved electric cookstoves are highly positive
For households using the improved electric cookstove, about 70 percent of the net benefits are positive. The results are driven by the time saved from using an electric stove, the fuelwood saved and the reductions in time spent collecting wood.
4. Social net benefits from improved electric cookstoves are mixed.
The results of the social benefits of the improved electric cookstove are mixed. About 60 percent of the time the net benefits are positive. These net benefits are influenced by the costs of the stove, the time saved and fuel saved and the reductions in the carbon emissions. CONCLUSIONS This study provides a detailed analysis of the costs and benefits arising from an improved cookstove program using a biomass cookstove and an electric cookstove. There are several policy implications of this study: First, the analysis finds that subsidies have a positive influence yet minimal impact on the private net benefits to households. The results show that with higher levels of subsidies, the benefits are more likely to be positive. Poor households can gain access to and the benefits from improved cookstoves if these products are accessible at lower prices. Second, time and fuel savings appear to have greater benefits for households while the health benefits appear to be minimal. This result implies that households attain larger economic benefits
iv
when switching to improved cookstoves through the time and fuel saved rather than the reductions in morbidity or mortality. There needs to be a greater emphasis Third, environmental benefits such as the reduction in carbon emissions have an impact on the net benefits to society for both types of stoves. This finding can make a case for incorporating carbon offsets and other climate mitigation strategies into improved cookstove programs. Finally, social implementers could consider the role of cleaner and more modern stove options such as electric cookstoves based on the positive benefits for households and for society. Improved electric cookstoves appear to have greater benefits than the improved biomass stoves. However, the main caveat is that there are limitations to promoting electric stoves due to the lack of electrification and consistent access to electricity in countries like India. Research and policy needs to focus more on electric cookstoves given the high benefits.
1
I. Introduction
In developing countries, access to modern energy for cooking, heating and transportation still remains a challenge to raising households out of poverty. About 2.5 billion people depend on solid fuels such as biomass, wood, charcoal and animal dung. In September 2015, the United Nations’ Sustainable Development Goals (SDGs) set a target of ensuring ‘affordable, reliable, sustainable and modern energy services’ for countries to achieve by 2030 (UNDESA, 2015). One of the key concerns within the discourse of energy access is a household’s access to cleaner sources of energy and modern stoves for cooking. This problem is particularly acute for developing countries and rural areas within developing countries. In 2013, about 38 percent of the world’s population still depended on biomass for their cooking uses. In India, this condition becomes even direr, about 67 percent of the population relies on traditional biomass (IEA, World Energy Outlook, 2015). The continued use of biomass and the lack of access to better cooking fuels and technologies perpetuate existing inequality and keeps people trapped in a cycle of poverty. The use of biomass has negative outcomes for health, the environment and economic development (Universal Energy Access, UNDP). In low income countries, 1.3 million deaths occur due to indoor smoke or air pollution from burning solid fuels in small, confined and unventilated kitchens or homes. The most vulnerable populations are young children and women who are the primary cooks in a household. Indoor air pollution is one of the leading causes of death, accounting for 4.8 percent of the total high ranking risk factors in low income countries and causes 2 million deaths worldwide (World Health Organization Report, 2009). Traditional stoves not only lead to high incidence of respiratory illnesses but also through the use of inefficient fuels, emit short-lived climate pollutants (SLCP). Pollutants such as black carbon, methane and ozone are responsible for a fraction of the climate change and air pollution (Scovronick, 2015). As their name explains, these SLCP remain in the atmosphere for short periods of time and are seen as easy targets for reducing climate change. Household solid fuels use and emissions contribute to 25% of the total global black carbon emissions, particularly in low income countries (Bond et al, 2013). From a societal perspective, household access to clean energy has high social benefits not just for the community but also for the region. The use of these stoves could lead to reductions in the overall emissions of a region or a country especially for black carbon emissions. In rural areas in northern India, where there is wide scale burning of solid fuels, switching to clean energy and efficient burning of fuels can reduce the localized effects of carbon emission (Shindell et al, 2012; Bond & Sun, 2005). Interventions to address the issue of access to clean cooking fuels and technology have focused on shifting households from traditional cookstoves to Improved Cook Stoves (ICS) that use cleaner fuels and technology such as biomass stoves, electric stoves, LPG stoves. On this front, there are international efforts like the Global Alliance for Clean Cookstoves (GACC) set up in 20101 and country-level programs like the National Biomass Cookstove Initiative in India started in 20092. The research on improved cook stoves has not been consistent in providing evidence highlighting its
1 GACC is an alliance of multilateral organizations, non-profits, foundations, investors and academic institutions set up to promote adoption of clean cook stoves. 2 The NBCI set up by the Ministry of New and Renewable Energy is tasked with the objective to “design and develop the most efficient, cost effective, durable and easy to use device.”
2
benefits. Early research on ICS interventions showed a strong association with positive outcomes, particularly for the health benefits from the use of ICS. If households switched to improved cookstoves and more efficient fuel technology they were more likely to gain from improved health outcomes (Saatkamp et al, 2000). More recently, studies on cookstove interventions have shown mixed results. The reductions in pollution may not be high enough to meet the WHO emission requirements (Thomas et al, 2015). Households have often been slow to adopt non-traditional technology even though they are informed of the benefits of reduced household air pollution and improvements in health outcomes (Rehfuess et al, 2013). These low adoption rates can perhaps be attributed to the heterogeneous nature of preferences of households for different cooking uses (Jeuland et al, 2014) and of the costs and benefits they deliver (Jeuland & Pattanayak, 2012). When households do adopt the ICS, the actual use of the stoves is low since the stove is not designed for other uses such as heating or cooking certain kinds of foods (Bielecki & Wingenbach, 2014). Household characteristics such as income, education level and gender of the household head and the varying uses of stoves play a role in adoption rates (Lewis & Pattanayak, 2012). Initially, the discussion on access to energy was closely linked with the idea of households moving up an energy ladder (Sovacool, 2012). Households switch from traditional sources of energy to newer and cleaner sources particularly when they replace a traditional stove with an ICS. Thus, households would be climbing up the ‘energy ladder’ by moving to more efficient fuels and sophisticated stoves (Smith et al, 1994; Saatkamp et al., 2000). However, research shows that there is a tendency for households to engage in stove stacking instead of replacing stoves. That is, households maintain a number of different types of cooking appliances including the traditional stove and use different stoves for different purposes (Ruiz-Mercado et al, 2011; Hanna et al, 2012). This behaviour is important while studying technology interventions as it can interfere with the true impact of the intervention in delivering positive outcomes. If households engage in energy stacking, then the benefits to health and the environment are reduced. In addition, it could indicate that the impact of policies to provide cleaner fuels and technologies are not having the hypothesized impact. While efforts are being made to promote the use of clean cookstoves in developing countries, there is mixed evidence on the adoption rates of different types of improved cookstoves. There is also limited evidence on the economic benefits of such distribution programs. The purpose of this paper is to undertake a systematic economic evaluation of a program that distributed subsidized improved cookstoves to rural households in India. The evaluation will examine the effect of different levels of subsidies on the net benefits to the household and to society. This paper answers the question, “Ex post, what are the economic benefits to various stakeholders of a program that distributed subsidized improved cookstoves?” In addressing this question, the paper will use empirical data from India applied to a cost-benefit model to look at how subsidies affect the costs and the benefits of the biomass ICS and the electric ICS. The rest of the paper is organized as follows: section II discusses the literature on this topic, how prices affect demand for various development interventions and the current research on cost-benefit analyses for improved cook stoves. Section III gives a background of the project, section IV presents the framework for the cost- benefit analysis – the typology, parameters and estimating equations. Section V provides the results of the cost-benefit analysis, the Monte Carlo simulation and a sensitivity analysis. The paper ends with a discussion of the limitations as well as the policy implications from this research in section VI.
3
II. Literature Review
1. The effects of pricing on adoption and use of cookstoves
For a program that distributes subsidized improved cookstoves, it is important to examine the effects of various pricing strategies on the uptake and use of the stove. Prices can directly affect the acquisition of cookstoves. Higher prices could lead to fewer households adopting cookstoves. On the other hand, lower prices could make the cookstoves more accessible for a wider portion of the population that the program is trying to serve. In general, prices and subsidies can influence the costs of a program as the social implementer bears some of the capital costs. In turn, these stove and program costs could have an impact on whether a household decides to adopt and use an ICS. The literature is limited on explaining the effect of price changes on household behavior especially for adoption of improved cookstoves. There are few studies that examine the effect of pricing and subsidies on clean technology uptake (Levine et al, 2012; Jeuland et al, 2014). These studies find that there is a higher preference for subsidized cook stoves, where a higher rate of adoption is associated with greater levels of subsidy offered to households. Free trials and varying payment mechanisms to avoid large one-time payments are more effective in raising adoption of stoves among both rural and urban households (Levine et al, 2012). In a complementary field using technology interventions for development, Cohen and Dupas (2010) find that uptake of the bed-nets falls when the price is raised. Thus, the literature shows some support for the hypothesis that lower prices could lead to higher rates of adoption for households. In conjunction with adoption, it is necessary to examine how prices affect the rate of use of new technologies within households. When studying the effect of prices for chlorine tablets that reduce water-borne illness, Ashraf et al (2008) find that higher prices don’t necessarily lead to greater use. The amount a household uses an improved cook stove is directly related to the benefits they gain from its use. If the ICS is used along with the traditional stove, the positive impact of the ICS may be lowered and not as significant. The use rate also affects the positive externalities generated by the cook stove to the environment and to society. Some argue that lower prices can enable households to gain access to stoves and derive benefits through its use. Thus, lower prices can stimulate the demand and the use of cook stoves. At a lower price, this technology will also be accessible to a larger proportion of the population. However, adopting a stove doesn’t necessarily translate into higher use or use at all. Prices could affect only adoption of new cookstoves but don’t necessarily affect the use rates of the stoves. Households may be likely to accept free stoves but won’t necessarily use them. If prices are high, there may be fewer people adopting stoves but higher prices are assumed to lead to some use since households who really require a stove will purchase one. This line of reasoning undermines the need for greater access to clean cooking technology and modern fuels by households who cannot afford stoves at high prices. Since empirical evidence on the effect of prices is scare, this paper can address the implications of different prices on the benefits and costs facing households and society.
2. Cost benefit analysis for ICS
Non-market valuation in international development can have specific project-level implications as it informs a social implementer such as a government agency or a non-profit organization whether it should or should not undertake a program given the costs and benefits involved. As Jeuland and
4
Tan Soo (2015) point out, this analysis has academic and policy implications for understanding the effectiveness of such projects in the field of development which does not necessarily undertake cost-benefit valuations before making investments. The literature reveals a range of these analyses performed to determine the policy relevance of programs for improved cook stoves. Some studies undertake a CBA evaluation at the global scale (Hutton et al, 2007), at the regional level (Jeuland and Pattanayak, 2012; Jeuland and Tan Soo, 2015) and project level (García-Frapolli et al, 2010; Malla et al, 2011; Bensch and Peters, 2015). There is variation across studies in the complexity of the analysis and the assumptions made about the parameters such as the reductions in morbidity, mortality, air quality improvements, costs of stoves, and the cost of stove maintenance. Studies that incorporate long term use, do not account for changes in the efficiency and performance of ICS. For instance, Hutton et al (2007) base their evaluation on the assumption that interventions to reduce indoor air pollution must be efficient and sustainable in the long term and accompanied by behavioural change. Their study assumes that cookstoves are consistently high-performance and that there is no deterioration over time. They study the reduction of pollution from switching to cleaner fuels and a reduction from more efficient burning of fuels over a 10-year period. Using projections, this analysis found that the global benefits outweigh the costs seven fold. In much of the literature, there is a similar emphasis on the societal level benefits arising from the switch from traditional stoves to cleaner ones. There are limited evaluations at the program level that have accounted for a household’s sustained use of the ICS and changes in its performance (García-Frapolli et al, 2010). There is a small body of literature that provides a detailed view on how ICS interventions affect the outcomes for different stakeholders (Jeuland and Pattanayak, 2012; Jeuland and Tan Soo, 2015; Malla et al, 2011). For example, Jeuland and Tan Soo undertake a cost-benefit analysis of interventions to promote cookstoves in South Asia. They specifically look at the differences in the private or household level costs and benefits vis-à-vis social net benefits. Their results find that household level benefits are dependent on the type of stove that is being adopted and whether the stove actually affects time saving and fuel efficiency for the households. As with other cost-benefit studies, they find that social benefits are consistently greater than the costs especially in terms of the reductions in climate-damaging emissions. In a study on the private net benefits, Malla et al (2011) conduct a cost benefit analysis of household energy interventions of three programs in Kenya, Nepal and Sudan. They use empirical evidence to provide estimates of the uptake rate, cost estimates and health improvements for households switching to multiple types of clean stoves. It specifically examines the private net benefits from the use of clean stoves accounting for costs such as capital, fuel and maintenance costs. The benefits include health benefits from lowering the risk to ALRI and COPD, fuel savings and time savings. They project the benefits for a period of 10 years and find that there are large net benefits for all three locations. Given that the literature on cost benefit analyses for clean technology access is sparse, this paper adds to it by conducting a cost benefit evaluation of a program that distributed cook stoves at different price levels in India. It uses empirical evidence to make realistic assumptions about the costs and benefits to households and to society. The analysis incorporates a rate of use that is adjusted for the amount of stove stacking within households and the levels of adoption for households offered a stove at a particular price. Finally, it differentiates the net benefits to households and to society to provide a more nuanced perspective of the gains to stakeholders.
5
III. Background of the Intervention
In India, about 58 percent of the population uses solid fuels for their cooking activities. Burning solid fuels indoors increases the risks of respiratory illnesses, particularly for women and children, and contributes to climate change. The study site was located in Uttarakhand, a northern state of India (Appendix Figure A1 has a map of the study site). The population in this study is primarily rural and agrarian3. On average, about 98 percent had a traditional cook stove while 28 percent had an improved cook stove. About 50 percent of the households lived below the poverty line. Duke University with USAID conducted an intervention and surveys over 3 years from 2012 to 2015. The study includes baseline data, focus group interviews, post-intervention survey, and a follow-up survey after a maintenance intervention for a sub-sample of the treatment group. Households in these villages had on average about 17 hours of electricity per day. Prior to the main project, Jeuland et al (2014) conducted a stated preference study conducted in this area and found that households were willing to pay about $10 for reductions in smoke and about $5 for decreased fuel use. They report high interest and latent demand in ICS and a willingness to pay for smoke reductions over decreased fuel use or increased convenience. The study, relevant for this paper, had an experimental design with a sample of 1051 households, of which 762 were in the treatment group (Pattanayak et al, 2015). The treatment communities received a sales offer with information about two stove options and a demonstration of each of the stoves. They were also given a choice of paying for the stove over three installments and given one of three levels of randomized rebate at the time of the purchase of the ICS. The Duke USAID study offered households one of three rebates: 2 percent, 20 percent or 33 percent of costs. However, the treatment household received the rebate amount only at the time of paying the last installment. The study found that there was a much higher interest in the G-Coil electric stove than the Greenway biomass stove. When offered to purchase a cookstove, the households in the treatment arm were found to be sensitive to changes in the price of the stove (Appendix: Tables A2, A3 and A4).The study found that larger subsidies had a greater effect on the adoption but also in inducing greater use of clean stoves and fuels. The use was estimated as the overall proportion of households using the ICS as a percentage of those who purchased a stove. About 23 percent of the households in the treatment group purchased either the G-Coil or the Greenway stove at the 2 percent rebate level. At the 20 percent rebate, purchases of the ICS increased to 53 percent and then to 72 percent for the highest rebate. The study found that there was no differential effect of the rebates on the household’s level of awareness of clean cookstove. It also did not find an effect on the solid fuel savings in terms of the amount of fuel and the collection time. Lastly, the study found that households which demonstrated high levels of price sensitivity, continued to use traditional cookstoves. Given the results from the project in Uttarakhand, this paper uses this empirical evidence to examine how the private benefits and costs for households receiving the different rebates. The next section will outline the analytical framework for the cost benefit analysis for the Uttarakhand study.
3 Appendix Table A1 provides descriptive statistics of the treatment and the control group.
6
IV. Analytical Framework for Cost Benefit Analysis
The primary method of this paper is a cost-benefit evaluation of the stove distribution project in Uttarakhand. The analysis will be based on an existing model set up by Jeuland and Pattanayak (2012) and expanded on by Jeuland and Tan Soo (2015). Jeuland and Pattanayak show that on average household private benefits (without subsidies) from the improved biomass and electric cookstoves have about a 50 percent chance of being positive. From the social perspective, by including carbon emissions reductions and reductions in deforestation, the net benefits from these two stove types improve a little. In their analysis on South Asia, Jeuland and Tan Soo (JTS) found that for households, the improved biomass stove delivers positive benefits about 40 percent of the time while the electric cookstove has highly positive outcomes, about 90 percent of the time. JTS find that the social net benefits of the improved biomass stove are higher than the private benefits and the electric stove becomes less beneficial. This paper will follow the methodology laid out by Jeuland and Tan Soo in setting up a framework for the cost-benefit analysis. The evaluation will use the net benefits criterion rule for calculation the private and social net benefits from switching to either the biomass stove or the electric cookstove (Boardman et al, 2011). It will compare the costs and benefits associated with households switching from traditional cook stoves to either of the two improved cookstoves that were distributed in Uttarakhand, the Greenway biomass or G-coil electric stove. The next sub-section of outlines the costs and benefits included in the analysis, the section after gives the estimating equations for the model and the final sub-section provides an overview of the parameters in the study and the modelling approach.
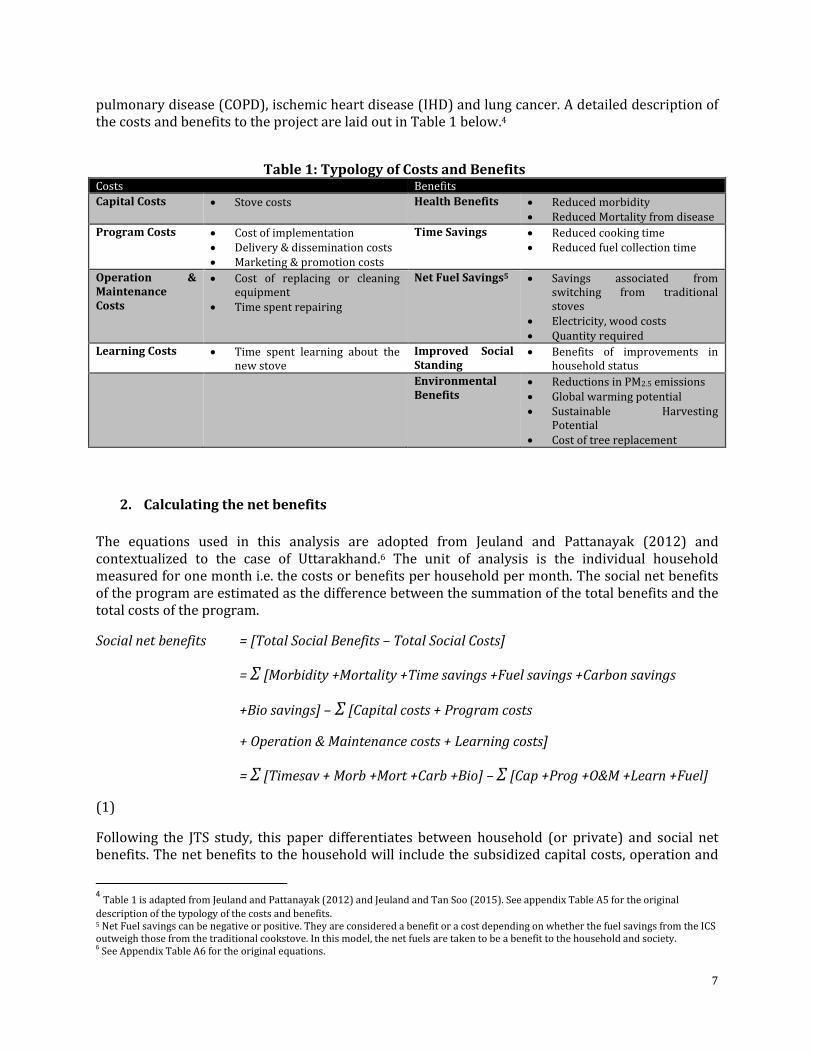
1. Typology of costs and benefits
To conduct an economic evaluation of improved cook stoves, this section lays out the different costs and benefits associated with the adoption and use of the stoves. The costs include capital or stove costs, program costs, operational and maintenance costs and learning costs for households. The capital, program and the operation and maintenance costs will be calculated based on information specific to the Uttarakhand program implementation. The program costs are any costs related to the implementation, marketing and promotion of the stoves. The operations and maintenance cost account for the costs of repairing and replacing parts of the stove as well as the time spent doing these activities. The learning costs are those costs to the household to learn and adjust to new cooking technology and time spent through trial-and-error in using the stove. The benefits from improved cook stoves are health benefits particularly reductions is morbidity and mortality, time saved by households through reduced cooking time and fuel collection, fuel savings from greater fuel efficiency, aesthetic gains, improved social standing of households and environmental benefits from reduced emissions and deforestation. The aesthetic benefits and the improved social standing for households are hard to measure, so are not included in this analysis. The health benefits incorporate the benefits from potential reductions in three different diseases that are related to indoor air pollution: acute lung respiratory illness (ALRI), chronic obstructive
7
pulmonary disease (COPD), ischemic heart disease (IHD) and lung cancer. A detailed description of the costs and benefits to the project are laid out in Table 1 below.4
Table 1: Typology of Costs and Benefits Costs Benefits
Capital Costs Stove costs Health Benefits Reduced morbidity Reduced Mortality from disease
Program Costs Cost of implementation Delivery & dissemination costs Marketing & promotion costs
Time Savings Reduced cooking time Reduced fuel collection time
Operation & Maintenance Costs
Cost of replacing or cleaning equipment
Time spent repairing
Net Fuel Savings5 Savings associated from switching from traditional stoves
Electricity, wood costs Quantity required
Learning Costs Time spent learning about the new stove
Improved Social Standing
Benefits of improvements in household status
Environmental Benefits
Reductions in PM2.5 emissions Global warming potential Sustainable Harvesting
Potential Cost of tree replacement
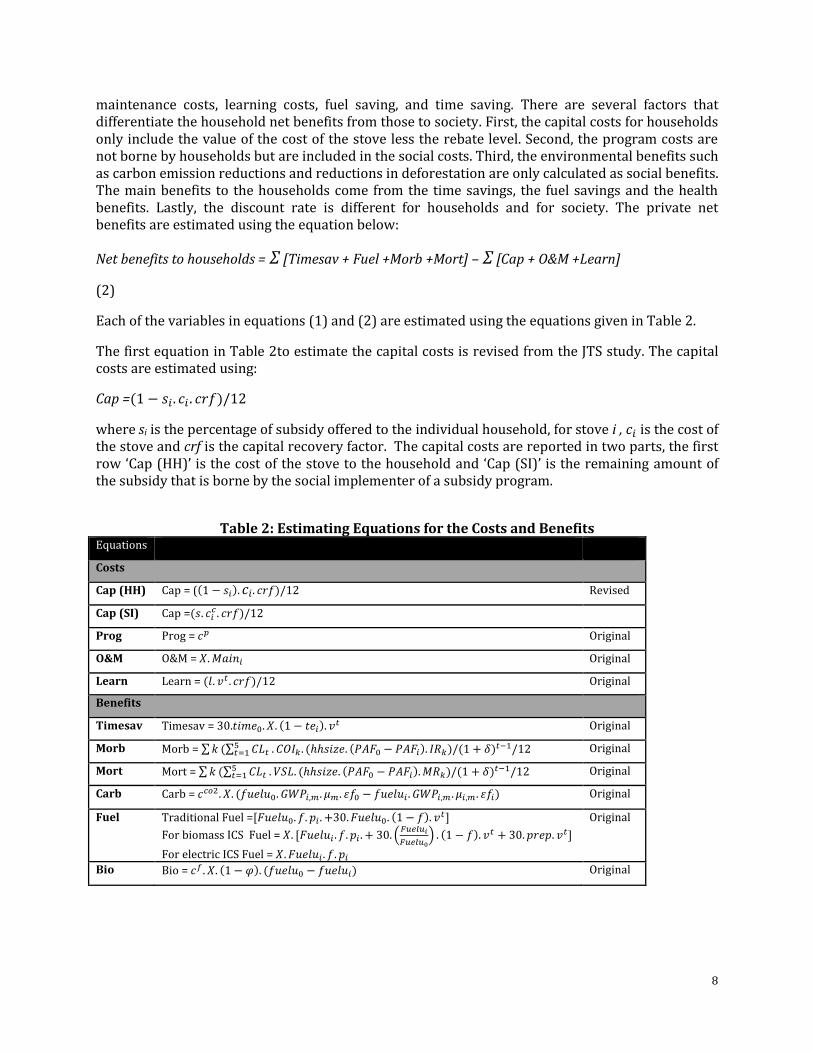
2. Calculating the net benefits
The equations used in this analysis are adopted from Jeuland and Pattanayak (2012) and contextualized to the case of Uttarakhand.6 The unit of analysis is the individual household measured for one month i.e. the costs or benefits per household per month. The social net benefits of the program are estimated as the difference between the summation of the total benefits and the total costs of the program.
Social net benefits = [Total Social Benefits – Total Social Costs]
= Ʃ [Morbidity +Mortality +Time savings +Fuel savings +Carbon savings
+Bio savings] – Ʃ [Capital costs + Program costs
+ Operation & Maintenance costs + Learning costs]
= Ʃ [Timesav + Morb +Mort +Carb +Bio] – Ʃ [Cap +Prog +O&M +Learn +Fuel]
(1)
Following the JTS study, this paper differentiates between household (or private) and social net benefits. The net benefits to the household will include the subsidized capital costs, operation and
4 Table 1 is adapted from Jeuland and Pattanayak (2012) and Jeuland and Tan Soo (2015). See appendix Table A5 for the original
description of the typology of the costs and benefits. 5 Net Fuel savings can be negative or positive. They are considered a benefit or a cost depending on whether the fuel savings from the ICS outweigh those from the traditional cookstove. In this model, the net fuels are taken to be a benefit to the household and society. 6 See Appendix Table A6 for the original equations.
8
maintenance costs, learning costs, fuel saving, and time saving. There are several factors that differentiate the household net benefits from those to society. First, the capital costs for households only include the value of the cost of the stove less the rebate level. Second, the program costs are not borne by households but are included in the social costs. Third, the environmental benefits such as carbon emission reductions and reductions in deforestation are only calculated as social benefits. The main benefits to the households come from the time savings, the fuel savings and the health benefits. Lastly, the discount rate is different for households and for society. The private net benefits are estimated using the equation below:
Net benefits to households = Ʃ [Timesav + Fuel +Morb +Mort] – Ʃ [Cap + O&M +Learn]
(2)
Each of the variables in equations (1) and (2) are estimated using the equations given in Table 2.
The first equation in Table 2to estimate the capital costs is revised from the JTS study. The capital costs are estimated using:
Cap =(1 − 𝑠𝑖. 𝑐𝑖 . 𝑐𝑟𝑓)/12
where si is the percentage of subsidy offered to the individual household, for stove i , 𝑐𝑖 is the cost of the stove and crf is the capital recovery factor. The capital costs are reported in two parts, the first row ‘Cap (HH)’ is the cost of the stove to the household and ‘Cap (SI)’ is the remaining amount of the subsidy that is borne by the social implementer of a subsidy program.
Table 2: Estimating Equations for the Costs and Benefits
Equations
Costs
Cap (HH) Cap = ((1 − 𝑠𝑖). 𝑐𝑖. 𝑐𝑟𝑓)/12 Revised
Cap (SI) Cap =(𝑠. 𝑐𝑖𝑐 . 𝑐𝑟𝑓)/12
Prog Prog = 𝑐𝑝 Original
O&M O&M = 𝑋. 𝑀𝑎𝑖𝑛𝑖 Original
Learn Learn = (𝑙. 𝑣𝑡 . 𝑐𝑟𝑓)/12 Original
Benefits
Timesav Timesav = 30.𝑡𝑖𝑚𝑒0. 𝑋. (1 − 𝑡𝑒𝑖). 𝑣𝑡 Original
Morb Morb = ∑ 𝑘 (∑ 𝐶𝐿𝑡5𝑡=1 . 𝐶𝑂𝐼𝑘. (ℎℎ𝑠𝑖𝑧𝑒. (𝑃𝐴𝐹0 − 𝑃𝐴𝐹𝑖). 𝐼𝑅𝑘)/(1 + 𝛿)𝑡−1/12 Original
Mort Mort = ∑ 𝑘 (∑ 𝐶𝐿𝑡5𝑡=1 . 𝑉𝑆𝐿. (ℎℎ𝑠𝑖𝑧𝑒. (𝑃𝐴𝐹0 − 𝑃𝐴𝐹𝑖). 𝑀𝑅𝑘)/(1 + 𝛿)𝑡−1/12 Original
Carb Carb = 𝑐𝑐𝑜2. 𝑋. (𝑓𝑢𝑒𝑙𝑢0. 𝐺𝑊𝑃𝑖,𝑚. 𝜇𝑚. 휀𝑓0 − 𝑓𝑢𝑒𝑙𝑢𝑖 . 𝐺𝑊𝑃𝑖,𝑚. 𝜇𝑖,𝑚. 휀𝑓𝑖) Original
Fuel Traditional Fuel =[𝐹𝑢𝑒𝑙𝑢0. 𝑓. 𝑝𝑖 . +30. 𝐹𝑢𝑒𝑙𝑢0. (1 − 𝑓). 𝑣𝑡]
For biomass ICS Fuel = 𝑋. [𝐹𝑢𝑒𝑙𝑢𝑖 . 𝑓. 𝑝𝑖 . + 30. (𝐹𝑢𝑒𝑙𝑢𝑖
𝐹𝑢𝑒𝑙𝑢0) . (1 − 𝑓). 𝑣𝑡 + 30. 𝑝𝑟𝑒𝑝. 𝑣𝑡]
For electric ICS Fuel = 𝑋. 𝐹𝑢𝑒𝑙𝑢𝑖 . 𝑓. 𝑝𝑖
Original
Bio Bio = 𝑐𝑓. 𝑋. (1 − 𝜑). (𝑓𝑢𝑒𝑙𝑢0 − 𝑓𝑢𝑒𝑙𝑢𝑖) Original
9
3. Estimating the usage rate
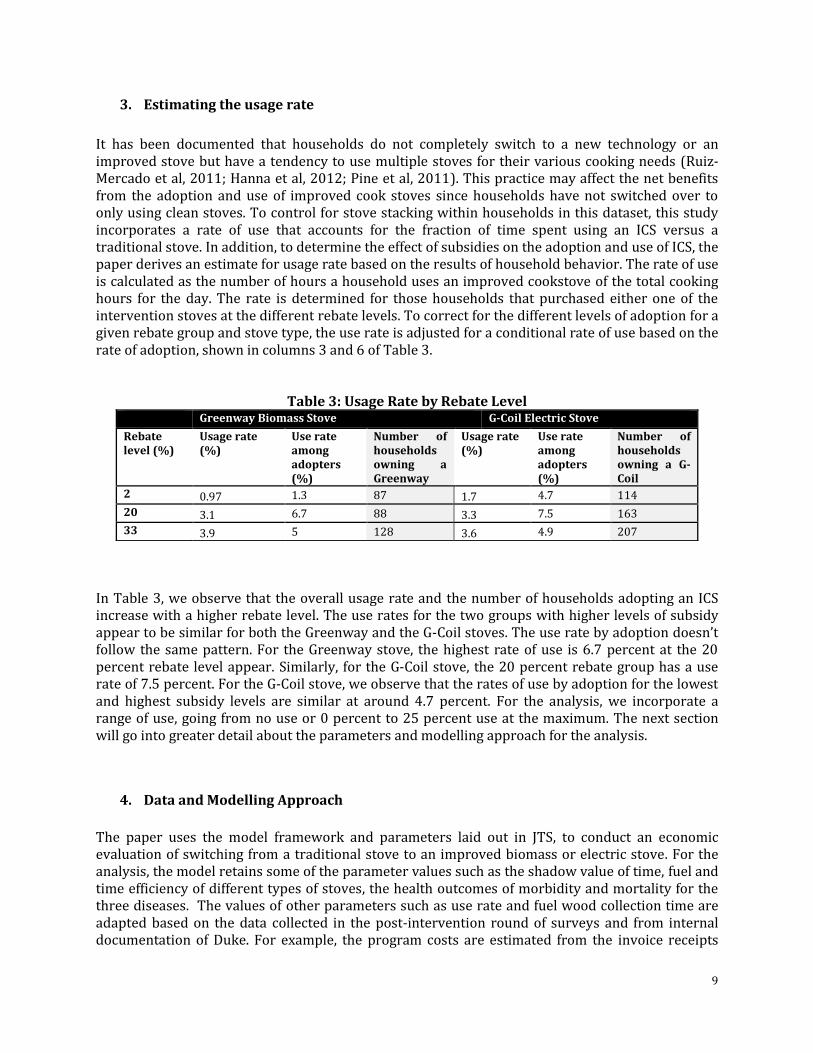
It has been documented that households do not completely switch to a new technology or an improved stove but have a tendency to use multiple stoves for their various cooking needs (Ruiz-Mercado et al, 2011; Hanna et al, 2012; Pine et al, 2011). This practice may affect the net benefits from the adoption and use of improved cook stoves since households have not switched over to only using clean stoves. To control for stove stacking within households in this dataset, this study incorporates a rate of use that accounts for the fraction of time spent using an ICS versus a traditional stove. In addition, to determine the effect of subsidies on the adoption and use of ICS, the paper derives an estimate for usage rate based on the results of household behavior. The rate of use is calculated as the number of hours a household uses an improved cookstove of the total cooking hours for the day. The rate is determined for those households that purchased either one of the intervention stoves at the different rebate levels. To correct for the different levels of adoption for a given rebate group and stove type, the use rate is adjusted for a conditional rate of use based on the rate of adoption, shown in columns 3 and 6 of Table 3.
Table 3: Usage Rate by Rebate Level
In Table 3, we observe that the overall usage rate and the number of households adopting an ICS increase with a higher rebate level. The use rates for the two groups with higher levels of subsidy appear to be similar for both the Greenway and the G-Coil stoves. The use rate by adoption doesn’t follow the same pattern. For the Greenway stove, the highest rate of use is 6.7 percent at the 20 percent rebate level appear. Similarly, for the G-Coil stove, the 20 percent rebate group has a use rate of 7.5 percent. For the G-Coil stove, we observe that the rates of use by adoption for the lowest and highest subsidy levels are similar at around 4.7 percent. For the analysis, we incorporate a range of use, going from no use or 0 percent to 25 percent use at the maximum. The next section will go into greater detail about the parameters and modelling approach for the analysis.
4. Data and Modelling Approach
The paper uses the model framework and parameters laid out in JTS, to conduct an economic evaluation of switching from a traditional stove to an improved biomass or electric stove. For the analysis, the model retains some of the parameter values such as the shadow value of time, fuel and time efficiency of different types of stoves, the health outcomes of morbidity and mortality for the three diseases. The values of other parameters such as use rate and fuel wood collection time are adapted based on the data collected in the post-intervention round of surveys and from internal documentation of Duke. For example, the program costs are estimated from the invoice receipts
Greenway Biomass Stove G-Coil Electric Stove
Rebate level (%)
Usage rate (%)
Use rate among adopters (%)
Number of households owning a Greenway
Usage rate (%)
Use rate among adopters (%)
Number of households owning a G-Coil
2 0.97 1.3 87 1.7 4.7 114
20 3.1 6.7 88 3.3 7.5 163
33 3.9 5 128 3.6 4.9 207
10
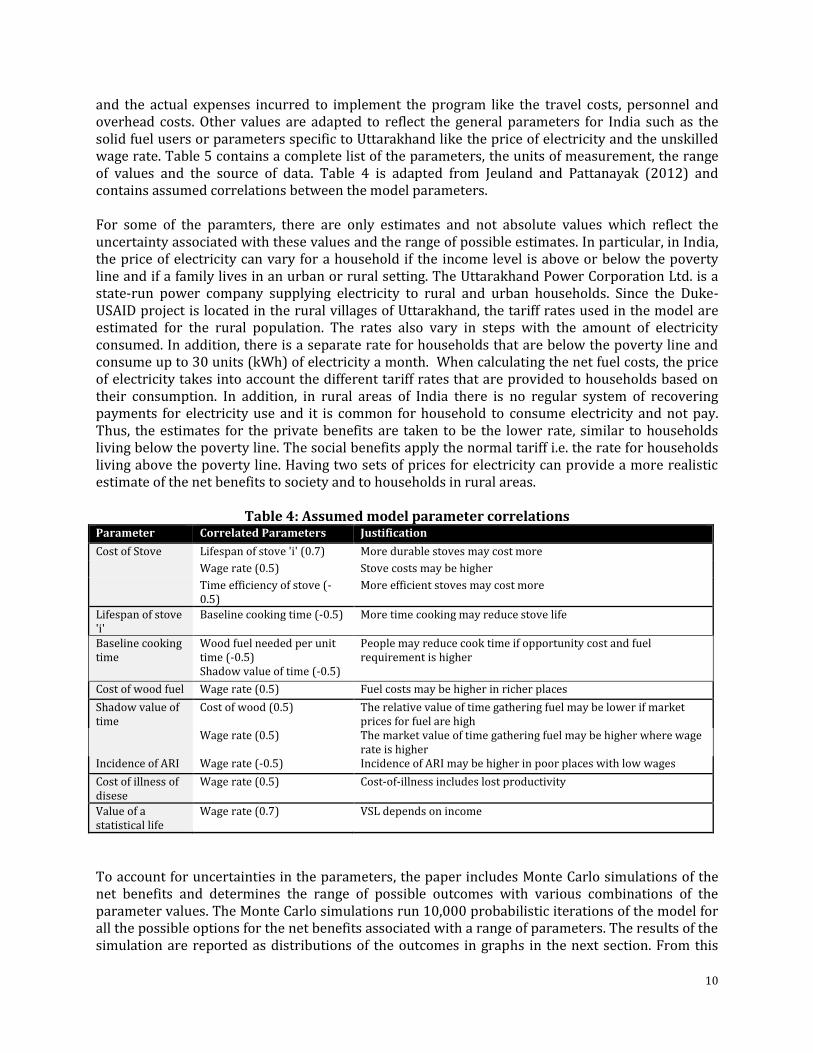
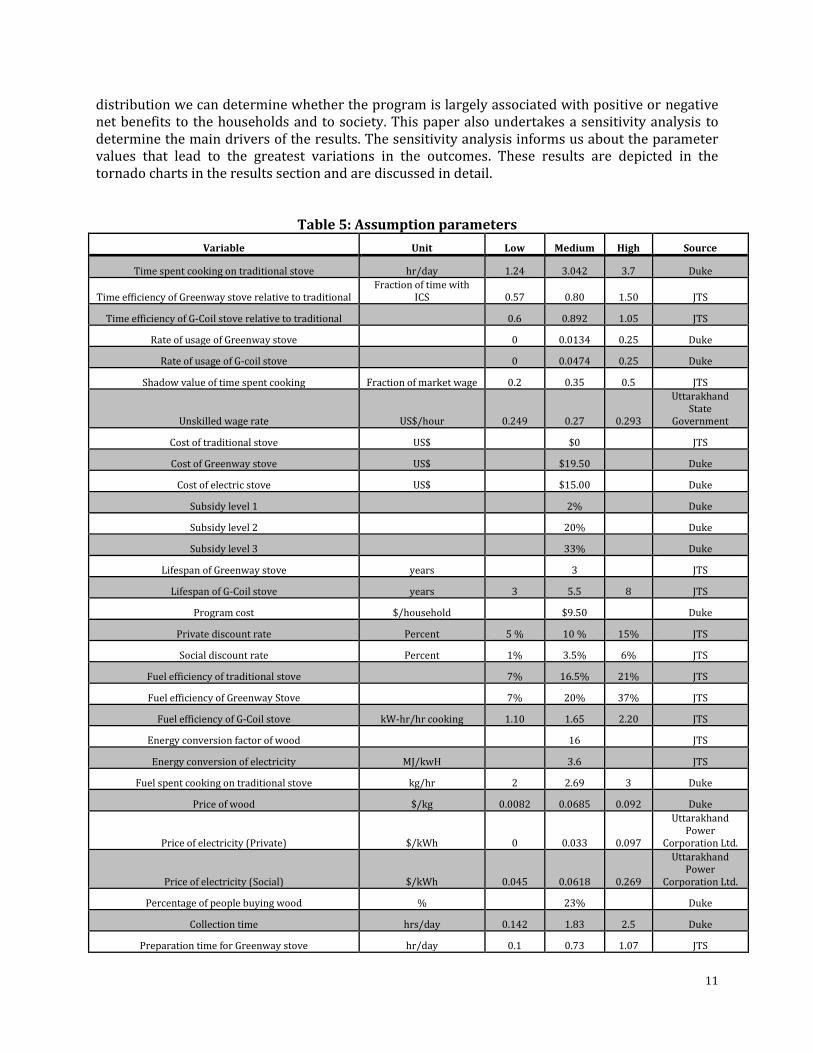
and the actual expenses incurred to implement the program like the travel costs, personnel and overhead costs. Other values are adapted to reflect the general parameters for India such as the solid fuel users or parameters specific to Uttarakhand like the price of electricity and the unskilled wage rate. Table 5 contains a complete list of the parameters, the units of measurement, the range of values and the source of data. Table 4 is adapted from Jeuland and Pattanayak (2012) and contains assumed correlations between the model parameters. For some of the paramters, there are only estimates and not absolute values which reflect the uncertainty associated with these values and the range of possible estimates. In particular, in India, the price of electricity can vary for a household if the income level is above or below the poverty line and if a family lives in an urban or rural setting. The Uttarakhand Power Corporation Ltd. is a state-run power company supplying electricity to rural and urban households. Since the Duke-USAID project is located in the rural villages of Uttarakhand, the tariff rates used in the model are estimated for the rural population. The rates also vary in steps with the amount of electricity consumed. In addition, there is a separate rate for households that are below the poverty line and consume up to 30 units (kWh) of electricity a month. When calculating the net fuel costs, the price of electricity takes into account the different tariff rates that are provided to households based on their consumption. In addition, in rural areas of India there is no regular system of recovering payments for electricity use and it is common for household to consume electricity and not pay. Thus, the estimates for the private benefits are taken to be the lower rate, similar to households living below the poverty line. The social benefits apply the normal tariff i.e. the rate for households living above the poverty line. Having two sets of prices for electricity can provide a more realistic estimate of the net benefits to society and to households in rural areas.
Table 4: Assumed model parameter correlations Parameter Correlated Parameters Justification
Cost of Stove Lifespan of stove 'i' (0.7) More durable stoves may cost more
Wage rate (0.5) Stove costs may be higher
Time efficiency of stove (-0.5)
More efficient stoves may cost more
Lifespan of stove 'i'
Baseline cooking time (-0.5) More time cooking may reduce stove life
Baseline cooking time
Wood fuel needed per unit time (-0.5)
People may reduce cook time if opportunity cost and fuel requirement is higher
Shadow value of time (-0.5)
Cost of wood fuel Wage rate (0.5) Fuel costs may be higher in richer places
Shadow value of time
Cost of wood (0.5) The relative value of time gathering fuel may be lower if market prices for fuel are high
Wage rate (0.5) The market value of time gathering fuel may be higher where wage rate is higher
Incidence of ARI Wage rate (-0.5) Incidence of ARI may be higher in poor places with low wages
Cost of illness of disese
Wage rate (0.5) Cost-of-illness includes lost productivity
Value of a statistical life
Wage rate (0.7) VSL depends on income
To account for uncertainties in the parameters, the paper includes Monte Carlo simulations of the net benefits and determines the range of possible outcomes with various combinations of the parameter values. The Monte Carlo simulations run 10,000 probabilistic iterations of the model for all the possible options for the net benefits associated with a range of parameters. The results of the simulation are reported as distributions of the outcomes in graphs in the next section. From this
11
distribution we can determine whether the program is largely associated with positive or negative net benefits to the households and to society. This paper also undertakes a sensitivity analysis to determine the main drivers of the results. The sensitivity analysis informs us about the parameter values that lead to the greatest variations in the outcomes. These results are depicted in the tornado charts in the results section and are discussed in detail.
Table 5: Assumption parameters Variable Unit Low Medium High Source
Time spent cooking on traditional stove hr/day 1.24 3.042 3.7 Duke
Time efficiency of Greenway stove relative to traditional Fraction of time with
ICS 0.57 0.80 1.50 JTS
Time efficiency of G-Coil stove relative to traditional
0.6 0.892 1.05 JTS
Rate of usage of Greenway stove
0 0.0134 0.25 Duke
Rate of usage of G-coil stove
0 0.0474 0.25 Duke
Shadow value of time spent cooking Fraction of market wage 0.2 0.35 0.5 JTS
Unskilled wage rate US$/hour 0.249 0.27 0.293
Uttarakhand State
Government
Cost of traditional stove US$
$0
JTS
Cost of Greenway stove US$
$19.50
Duke
Cost of electric stove US$
$15.00
Duke
Subsidy level 1
2%
Duke
Subsidy level 2
20%
Duke
Subsidy level 3
33%
Duke
Lifespan of Greenway stove years
3
JTS
Lifespan of G-Coil stove years 3 5.5 8 JTS
Program cost $/household
$9.50
Duke
Private discount rate Percent 5 % 10 % 15% JTS
Social discount rate Percent 1% 3.5% 6% JTS
Fuel efficiency of traditional stove
7% 16.5% 21% JTS
Fuel efficiency of Greenway Stove
7% 20% 37% JTS
Fuel efficiency of G-Coil stove kW-hr/hr cooking 1.10 1.65 2.20 JTS
Energy conversion factor of wood
16
JTS
Energy conversion of electricity MJ/kwH
3.6
JTS
Fuel spent cooking on traditional stove kg/hr 2 2.69 3 Duke
Price of wood $/kg 0.0082 0.0685 0.092 Duke
Price of electricity (Private) $/kWh 0 0.033 0.097
Uttarakhand Power
Corporation Ltd.
Price of electricity (Social) $/kWh 0.045 0.0618 0.269
Uttarakhand Power
Corporation Ltd.
Percentage of people buying wood %
23%
Duke
Collection time hrs/day 0.142 1.83 2.5 Duke
Preparation time for Greenway stove hr/day 0.1 0.73 1.07 JTS
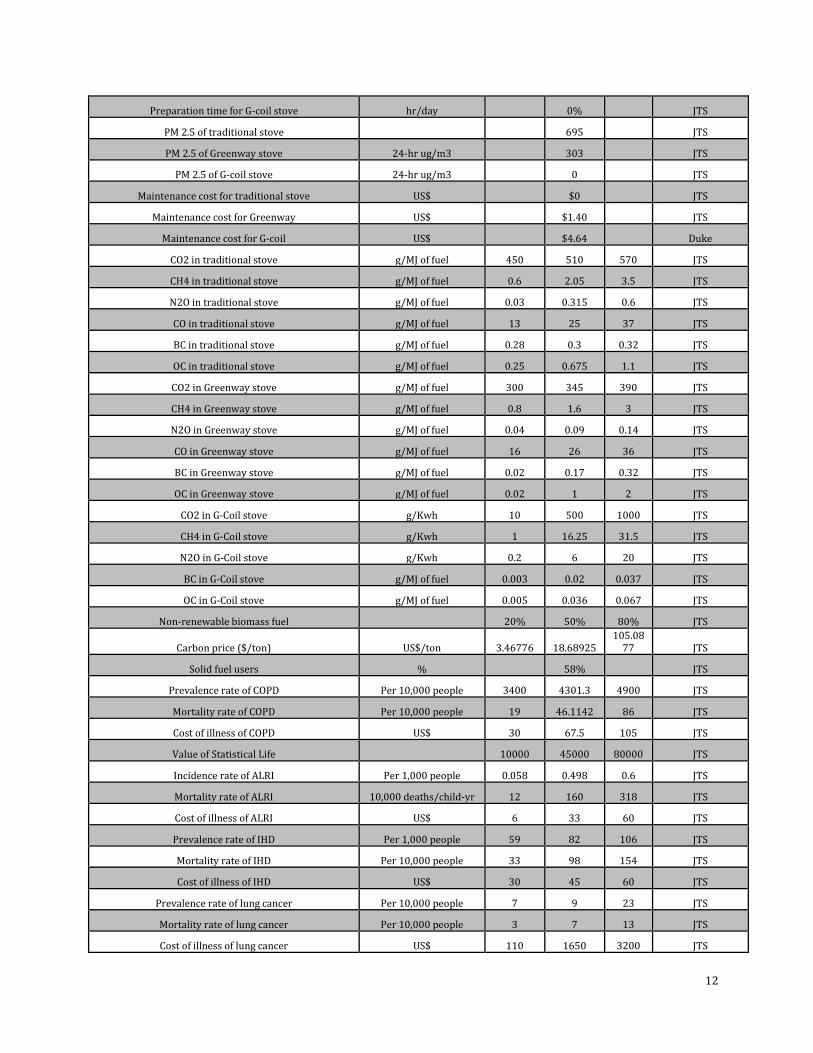
12
Preparation time for G-coil stove hr/day
0%
JTS
PM 2.5 of traditional stove
695
JTS
PM 2.5 of Greenway stove 24-hr ug/m3
303
JTS
PM 2.5 of G-coil stove 24-hr ug/m3
0
JTS
Maintenance cost for traditional stove US$
$0 JTS
Maintenance cost for Greenway US$
$1.40
JTS
Maintenance cost for G-coil US$
$4.64
Duke
CO2 in traditional stove g/MJ of fuel 450 510 570 JTS
CH4 in traditional stove g/MJ of fuel 0.6 2.05 3.5 JTS
N2O in traditional stove g/MJ of fuel 0.03 0.315 0.6 JTS
CO in traditional stove g/MJ of fuel 13 25 37 JTS
BC in traditional stove g/MJ of fuel 0.28 0.3 0.32 JTS
OC in traditional stove g/MJ of fuel 0.25 0.675 1.1 JTS
CO2 in Greenway stove g/MJ of fuel 300 345 390 JTS
CH4 in Greenway stove g/MJ of fuel 0.8 1.6 3 JTS
N2O in Greenway stove g/MJ of fuel 0.04 0.09 0.14 JTS
CO in Greenway stove g/MJ of fuel 16 26 36 JTS
BC in Greenway stove g/MJ of fuel 0.02 0.17 0.32 JTS
OC in Greenway stove g/MJ of fuel 0.02 1 2 JTS
CO2 in G-Coil stove g/Kwh 10 500 1000 JTS
CH4 in G-Coil stove g/Kwh 1 16.25 31.5 JTS
N2O in G-Coil stove g/Kwh 0.2 6 20 JTS
BC in G-Coil stove g/MJ of fuel 0.003 0.02 0.037 JTS
OC in G-Coil stove g/MJ of fuel 0.005 0.036 0.067 JTS
Non-renewable biomass fuel
20% 50% 80% JTS
Carbon price ($/ton) US$/ton 3.46776 18.68925 105.08
77 JTS
Solid fuel users %
58%
JTS
Prevalence rate of COPD Per 10,000 people 3400 4301.3 4900 JTS
Mortality rate of COPD Per 10,000 people 19 46.1142 86 JTS
Cost of illness of COPD US$ 30 67.5 105 JTS
Value of Statistical Life
10000 45000 80000 JTS
Incidence rate of ALRI Per 1,000 people 0.058 0.498 0.6 JTS
Mortality rate of ALRI 10,000 deaths/child-yr 12 160 318 JTS
Cost of illness of ALRI US$ 6 33 60 JTS
Prevalence rate of IHD Per 1,000 people 59 82 106 JTS
Mortality rate of IHD Per 10,000 people 33 98 154 JTS
Cost of illness of IHD US$ 30 45 60 JTS
Prevalence rate of lung cancer Per 10,000 people 7 9 23 JTS
Mortality rate of lung cancer Per 10,000 people 3 7 13 JTS
Cost of illness of lung cancer US$ 110 1650 3200 JTS
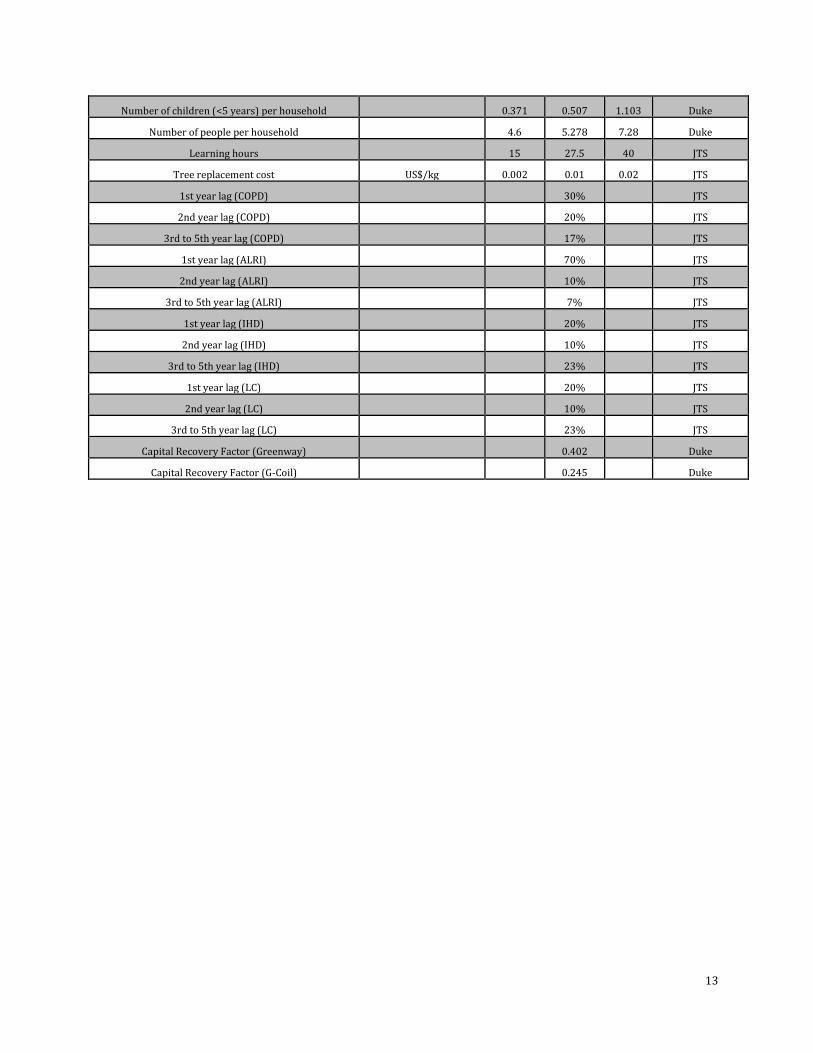
13
Number of children (<5 years) per household
0.371 0.507 1.103 Duke
Number of people per household
4.6 5.278 7.28 Duke
Learning hours
15 27.5 40 JTS
Tree replacement cost US$/kg 0.002 0.01 0.02 JTS
1st year lag (COPD)
30%
JTS
2nd year lag (COPD)
20%
JTS
3rd to 5th year lag (COPD)
17%
JTS
1st year lag (ALRI)
70%
JTS
2nd year lag (ALRI)
10%
JTS
3rd to 5th year lag (ALRI)
7%
JTS
1st year lag (IHD)
20%
JTS
2nd year lag (IHD)
10%
JTS
3rd to 5th year lag (IHD)
23%
JTS
1st year lag (LC)
20%
JTS
2nd year lag (LC)
10%
JTS
3rd to 5th year lag (LC)
23%
JTS
Capital Recovery Factor (Greenway)
0.402
Duke
Capital Recovery Factor (G-Coil) 0.245 Duke
14
V. Results
1. Base case scenario
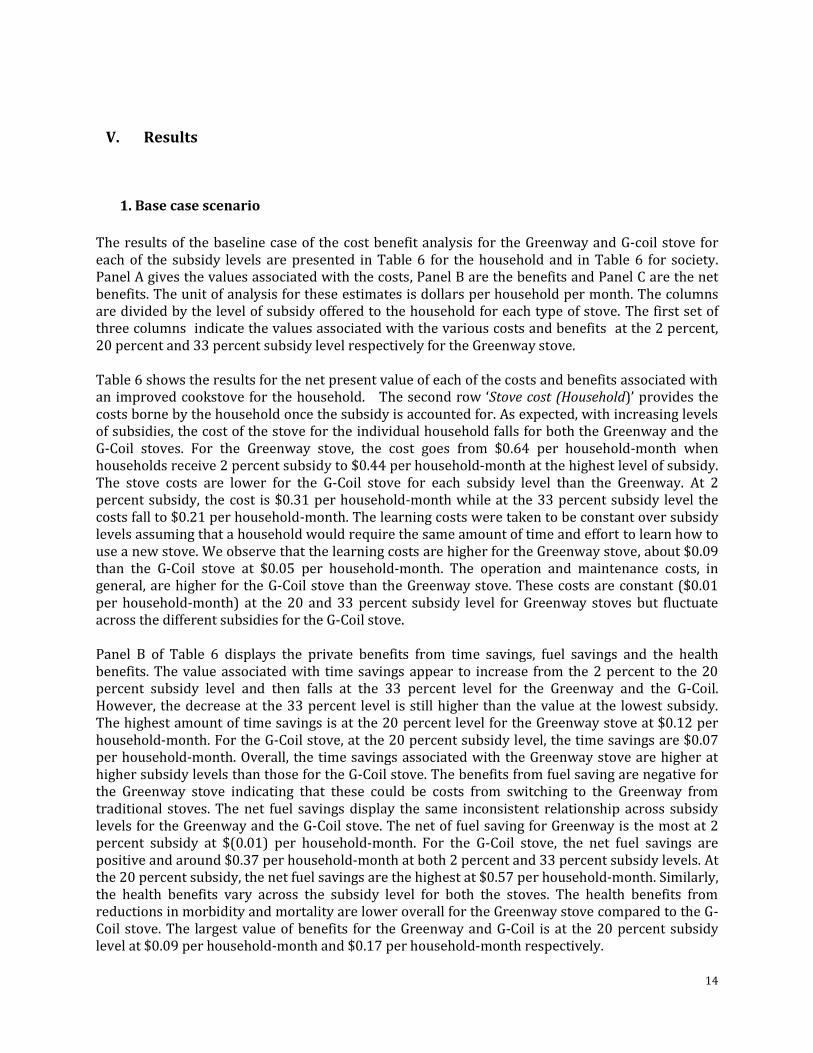
The results of the baseline case of the cost benefit analysis for the Greenway and G-coil stove for each of the subsidy levels are presented in Table 6 for the household and in Table 6 for society. Panel A gives the values associated with the costs, Panel B are the benefits and Panel C are the net benefits. The unit of analysis for these estimates is dollars per household per month. The columns are divided by the level of subsidy offered to the household for each type of stove. The first set of three columns indicate the values associated with the various costs and benefits at the 2 percent, 20 percent and 33 percent subsidy level respectively for the Greenway stove. Table 6 shows the results for the net present value of each of the costs and benefits associated with an improved cookstove for the household. The second row ‘Stove cost (Household)’ provides the costs borne by the household once the subsidy is accounted for. As expected, with increasing levels of subsidies, the cost of the stove for the individual household falls for both the Greenway and the G-Coil stoves. For the Greenway stove, the cost goes from $0.64 per household-month when households receive 2 percent subsidy to $0.44 per household-month at the highest level of subsidy. The stove costs are lower for the G-Coil stove for each subsidy level than the Greenway. At 2 percent subsidy, the cost is $0.31 per household-month while at the 33 percent subsidy level the costs fall to $0.21 per household-month. The learning costs were taken to be constant over subsidy levels assuming that a household would require the same amount of time and effort to learn how to use a new stove. We observe that the learning costs are higher for the Greenway stove, about $0.09 than the G-Coil stove at $0.05 per household-month. The operation and maintenance costs, in general, are higher for the G-Coil stove than the Greenway stove. These costs are constant ($0.01 per household-month) at the 20 and 33 percent subsidy level for Greenway stoves but fluctuate across the different subsidies for the G-Coil stove. Panel B of Table 6 displays the private benefits from time savings, fuel savings and the health benefits. The value associated with time savings appear to increase from the 2 percent to the 20 percent subsidy level and then falls at the 33 percent level for the Greenway and the G-Coil. However, the decrease at the 33 percent level is still higher than the value at the lowest subsidy. The highest amount of time savings is at the 20 percent level for the Greenway stove at $0.12 per household-month. For the G-Coil stove, at the 20 percent subsidy level, the time savings are $0.07 per household-month. Overall, the time savings associated with the Greenway stove are higher at higher subsidy levels than those for the G-Coil stove. The benefits from fuel saving are negative for the Greenway stove indicating that these could be costs from switching to the Greenway from traditional stoves. The net fuel savings display the same inconsistent relationship across subsidy levels for the Greenway and the G-Coil stove. The net of fuel saving for Greenway is the most at 2 percent subsidy at $(0.01) per household-month. For the G-Coil stove, the net fuel savings are positive and around $0.37 per household-month at both 2 percent and 33 percent subsidy levels. At the 20 percent subsidy, the net fuel savings are the highest at $0.57 per household-month. Similarly, the health benefits vary across the subsidy level for both the stoves. The health benefits from reductions in morbidity and mortality are lower overall for the Greenway stove compared to the G-Coil stove. The largest value of benefits for the Greenway and G-Coil is at the 20 percent subsidy level at $0.09 per household-month and $0.17 per household-month respectively.
15
Panel C contains the total costs, total benefits and the net benefits (benefits minus costs) to households. The cost values for the Greenway and G-Coil show a consistent decrease with greater subsidies to households. The total costs at each subsidy level are higher for the Greenway stove than the G-Coil stove. These values go from $(0.73) per household-month to $(0.53) per household-month for the Greenway and from $(0.38) to $(0.28) per household-month for the G-Coil. The benefits show an increase going from 2 percent to 20 percent and then a small decrease at 33 percent level. This pattern is similar to the one observed in the individual benefits in Panel B. The net benefits to households are negative for the Greenway stove and are positive for the G-Coil. For the Greenway stove, with an increase in the subsidy, the net benefits get less negative from $(0.70) to $(0.41) per household-month. The net benefits of the G-Coil stove rise from $0.14 to $0.49 per household-month. Thus for the base case scenario, there is evidence of positive net benefits to households from the G-Coil stove while the Greenway stove is associated with lower and negative net benefits.
Table 6: Results for the private costs and benefit results from Greenway and G-Coil stoves
Greenway Stove G-Coil Stove
Subsidy Level (% of Cost) 2% 20% 33% 2% 20% 33%
Panel A: Costs
Stove Cost (Household) $0.64 $0.52 $0.44 $0.31 $0.25 $0.21
Learning Cost $0.09 $0.09 $0.09 $0.05 $0.05 $0.05
O&M Cost $0.00 $0.01 $0.01 $0.02 $ 0.03 $0.02
Panel B: Benefits
Time Savings $0.02 $0.12 $0.09 $0.04 $ 0.07 $0.05
Net Fuel Savings (Household) $(0.01) $(0.05) $(0.04) $0.37 $0.57 $0.38
Health Benefits $0.02 $0.09 $0.06 $0.11 $0.17 $0.11
Panel C
Total Costs $(0.73) $(0.62) $(0.53) $(0.38) $(0.33) $(0.28)
Total Benefits $ 0.03 $0.16 $ 0.12 $0.52 $0.82 $0.53
Private Net Benefits $ (0.70) $ (0.46) $(0.41) $0.14 $0.49 $0.26
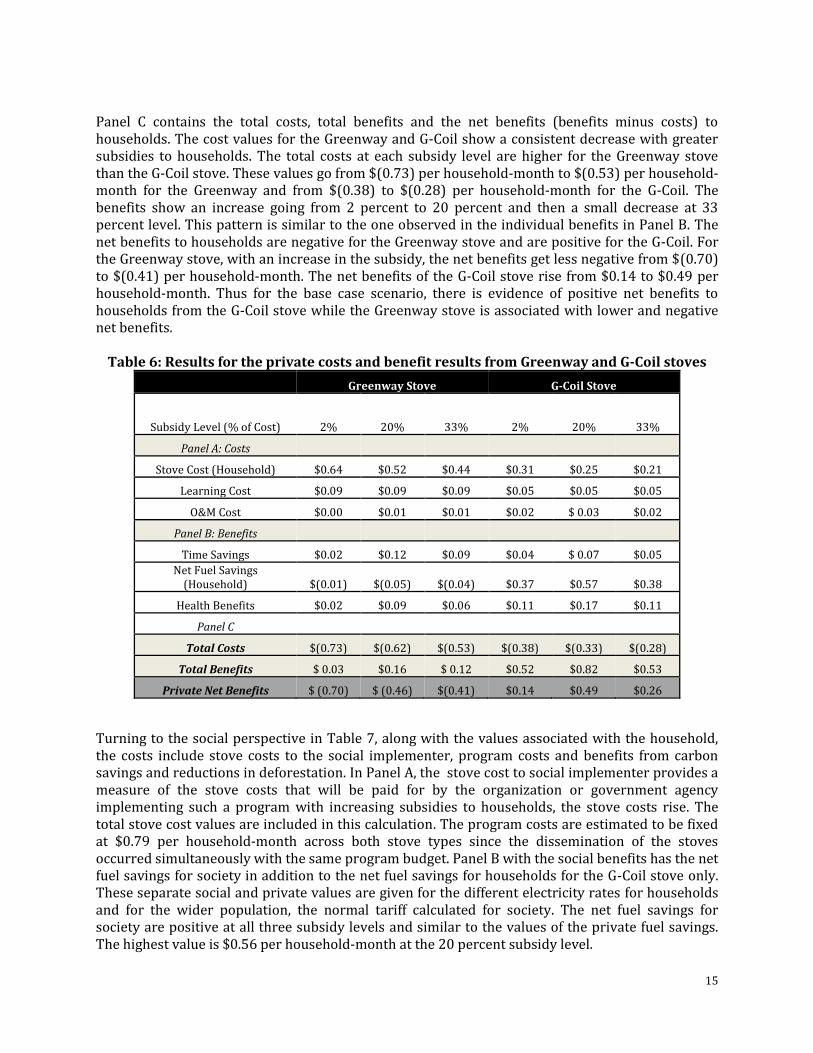
Turning to the social perspective in Table 7, along with the values associated with the household, the costs include stove costs to the social implementer, program costs and benefits from carbon savings and reductions in deforestation. In Panel A, the stove cost to social implementer provides a measure of the stove costs that will be paid for by the organization or government agency implementing such a program with increasing subsidies to households, the stove costs rise. The total stove cost values are included in this calculation. The program costs are estimated to be fixed at $0.79 per household-month across both stove types since the dissemination of the stoves occurred simultaneously with the same program budget. Panel B with the social benefits has the net fuel savings for society in addition to the net fuel savings for households for the G-Coil stove only. These separate social and private values are given for the different electricity rates for households and for the wider population, the normal tariff calculated for society. The net fuel savings for society are positive at all three subsidy levels and similar to the values of the private fuel savings. The highest value is $0.56 per household-month at the 20 percent subsidy level.
16
Panel C shows us that the total costs for the Greenway are higher than the total costs for the G-Coil stove. These costs are relatively similar across subsidy level for each type of stove. For the Greenway stove, the total costs are about $(1.53) per household-month and about $(1.18) per household-month for the G-Coil stove. The total benefits appear to change in the same pattern as the household total benefits, inconsistent with the level of subsidy to the household. For the Greenway stove, the benefits increase from $0.13 to $0.63 per household-month from 2 percent to 20 percent subsidy. Then the benefits fall to $0.48 at the 33 percent subsidy level. On the other hand, for the G-Coil stove, the total benefits are around the same value at the 2 percent and 33 percent subsidy (~$1.3 per household-month) and rise to $2.02 per household-month for the 20 percent subsidy. The overall net benefits to society are negative for the Greenway but are positive for the G-Coil stove. The net benefits of the Greenway fall from $(1.41) at 2 percent subsidy to $(0.91) at 20 percent, then it rises again to $(1.06) per household-month. For the G-Coil stove, the net benefits are low, at $0.11 per household-month, for the 2 percent level (and similar at the 33 percent level, $0.16 per household-month), then increase drastically to $0.84 per household-month at 20 percent subsidy. Thus, we observe, the household and the social, net benefits for the Greenway stove are lower and negative than the net social benefits for the G-Coil stove which are positive for the base case.
Table 7: Results for the social costs and benefits from the Greenway and G-Coil stoves
Greenway Stove G-Coil Stove
Subsidy Level (% of Cost) 2% 20% 33% 2% 20% 33%
Panel A: Costs
Stove Cost (Household) $0.64 $0.52 $ 0.44 $0.31 $0.25 $0.21
Stove Cost (Social Implementer) $0.01 $0.13 $ 0.22 $ 0.01 $0.06 $0.10
Program Cost $ 0.79 $0.79 $0.79 $ 0.79 $0.79 $0.79
Learning Cost $0.09 $ 0.09 $0.09 $0.05 $0.05 $0.05
O&M Cost $ 0.00 $0.01 $0.01 $0.02 $0.03 $0.02
Panel B: Benefits
Time savings $0.02 $0.12 $0.09 $0.04 $0.07 $ 0.05
Net Fuel Savings (Household) $ (0.01) $ (0.05) $ (0.04) $0.37 $0.57 $0.38
Net Fuel Savings (Social) . . . $0.36 $0.56 $0.37
Carbon Savings $0.09 $0.46 $0.35 $0.38 $ 0.60 $ 0.39
Forest Benefits $0.00 $ 0.01 $0.01 $0.03 $0.05 $0.03
Health Benefits $0.02 $0.09 $0.06 $0.11 $0.17 $0.11
Panel C
Total Costs $(1.53) $(1.54) $(1.54) $(1.18) $ (1.18) $ (1.17)
Total Benefits $0.13 $0.63 $0.48 $1.29 $2.02 $1.33
Social Net Benefits $ (1.41) $(0.91) $ (1.06) $0.11 $0.84 $0.16
17
2. Variations in the private and social net benefits
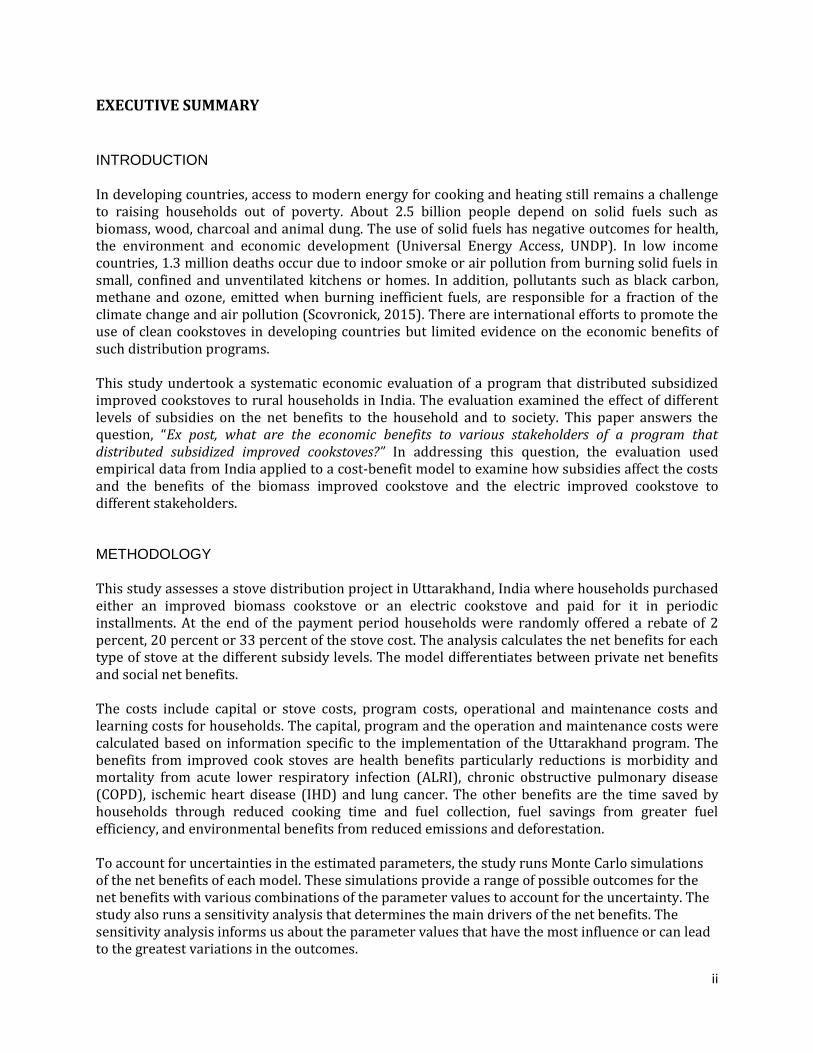
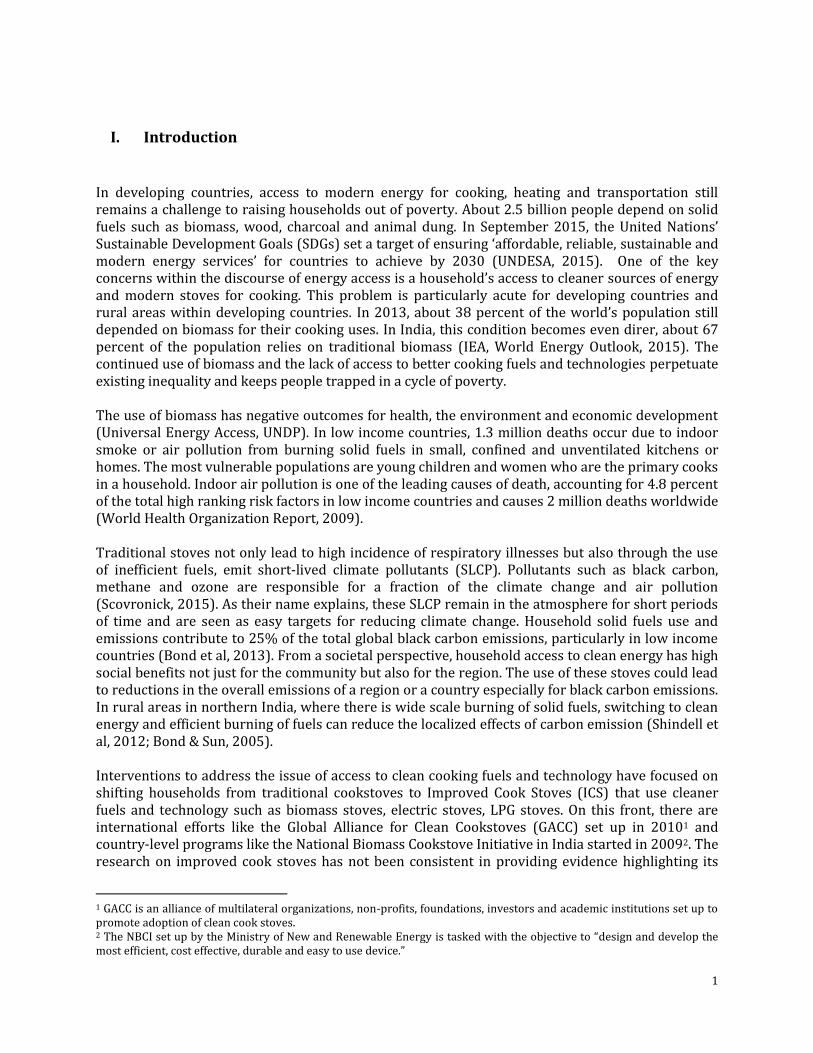
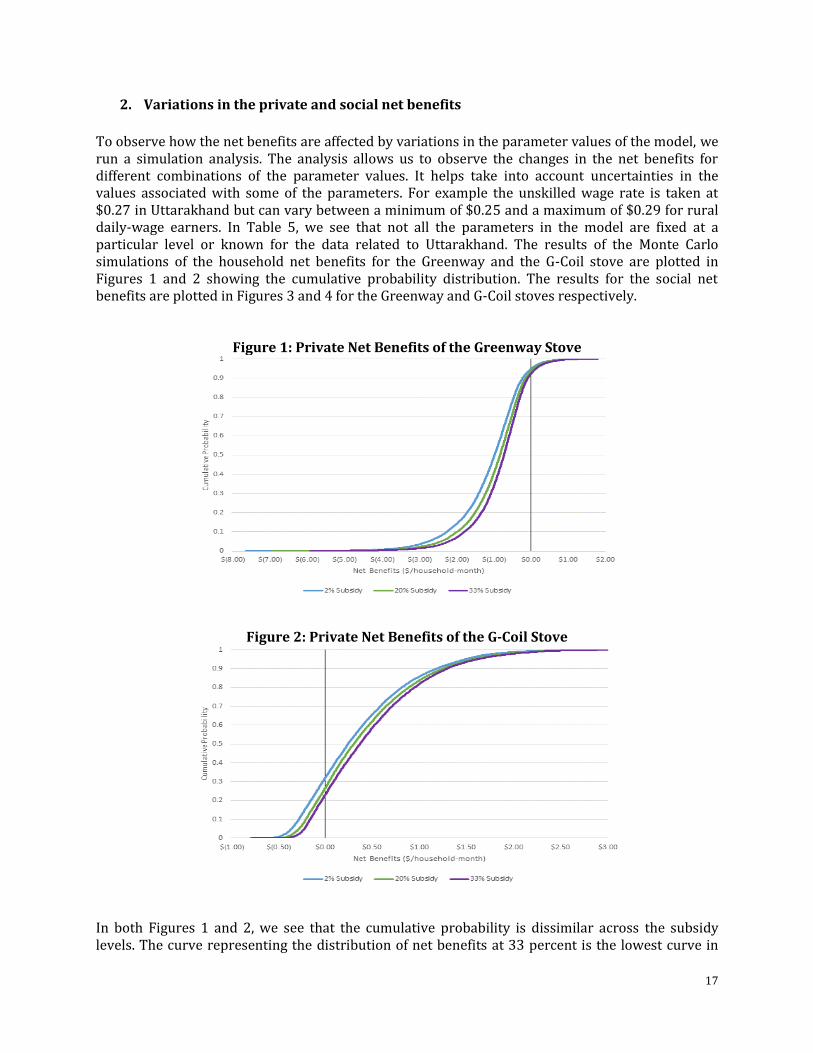
To observe how the net benefits are affected by variations in the parameter values of the model, we run a simulation analysis. The analysis allows us to observe the changes in the net benefits for different combinations of the parameter values. It helps take into account uncertainties in the values associated with some of the parameters. For example the unskilled wage rate is taken at $0.27 in Uttarakhand but can vary between a minimum of $0.25 and a maximum of $0.29 for rural daily-wage earners. In Table 5, we see that not all the parameters in the model are fixed at a particular level or known for the data related to Uttarakhand. The results of the Monte Carlo simulations of the household net benefits for the Greenway and the G-Coil stove are plotted in Figures 1 and 2 showing the cumulative probability distribution. The results for the social net benefits are plotted in Figures 3 and 4 for the Greenway and G-Coil stoves respectively.
Figure 1: Private Net Benefits of the Greenway Stove
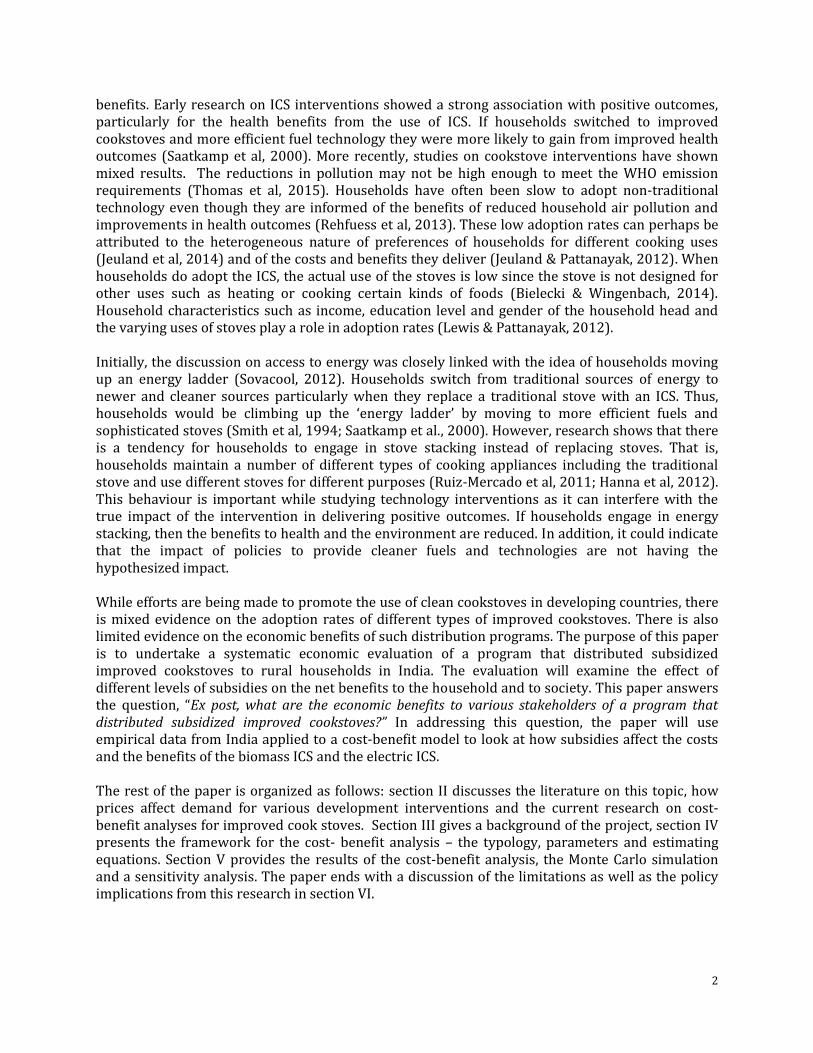
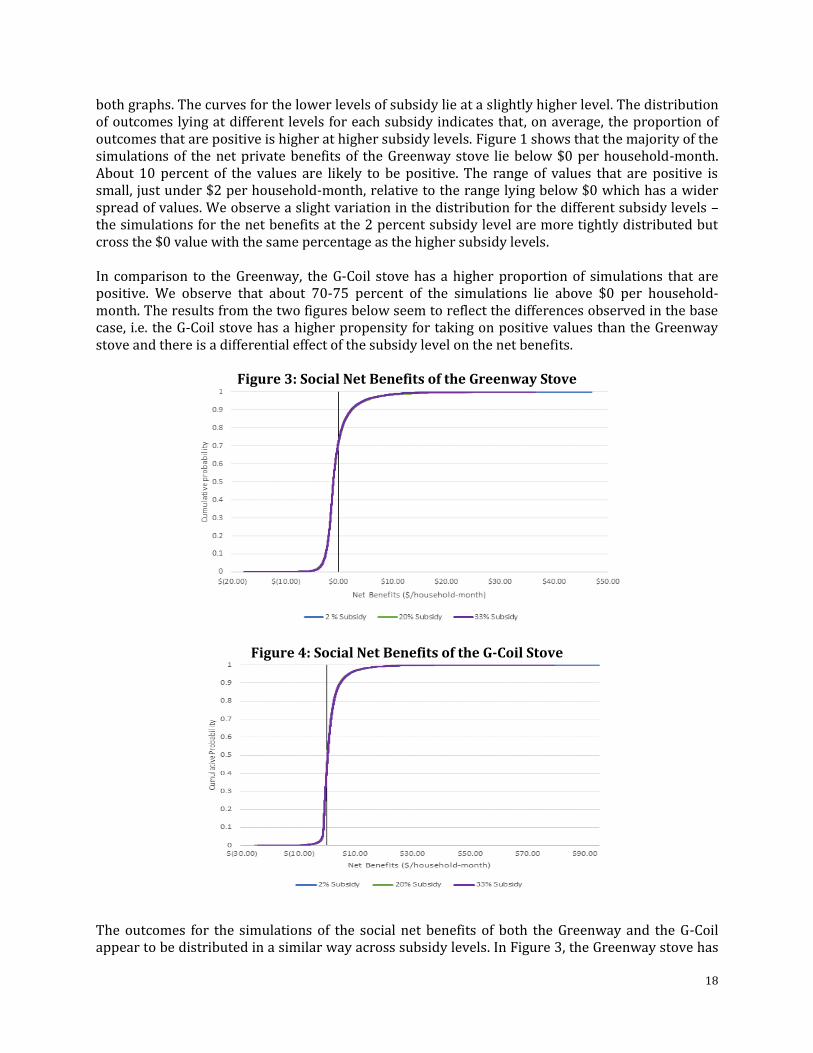
Figure 2: Private Net Benefits of the G-Coil Stove
In both Figures 1 and 2, we see that the cumulative probability is dissimilar across the subsidy levels. The curve representing the distribution of net benefits at 33 percent is the lowest curve in
18
both graphs. The curves for the lower levels of subsidy lie at a slightly higher level. The distribution of outcomes lying at different levels for each subsidy indicates that, on average, the proportion of outcomes that are positive is higher at higher subsidy levels. Figure 1 shows that the majority of the simulations of the net private benefits of the Greenway stove lie below $0 per household-month. About 10 percent of the values are likely to be positive. The range of values that are positive is small, just under $2 per household-month, relative to the range lying below $0 which has a wider spread of values. We observe a slight variation in the distribution for the different subsidy levels – the simulations for the net benefits at the 2 percent subsidy level are more tightly distributed but cross the $0 value with the same percentage as the higher subsidy levels. In comparison to the Greenway, the G-Coil stove has a higher proportion of simulations that are positive. We observe that about 70-75 percent of the simulations lie above $0 per household-month. The results from the two figures below seem to reflect the differences observed in the base case, i.e. the G-Coil stove has a higher propensity for taking on positive values than the Greenway stove and there is a differential effect of the subsidy level on the net benefits.
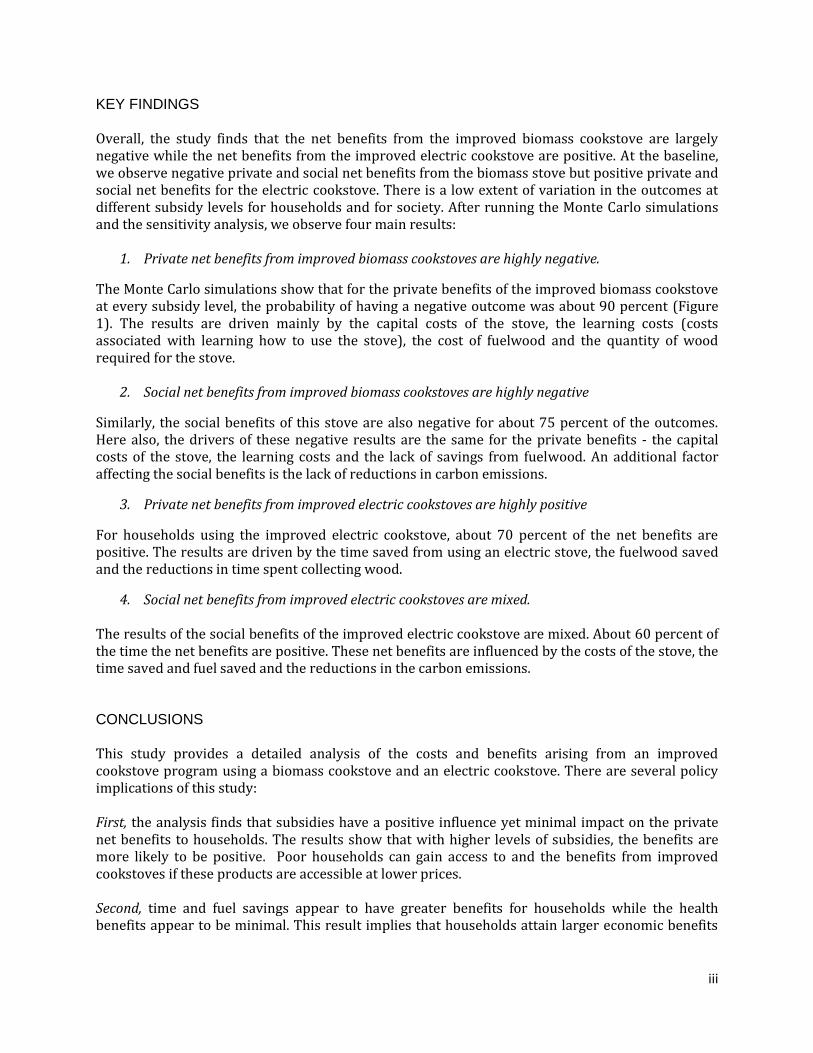
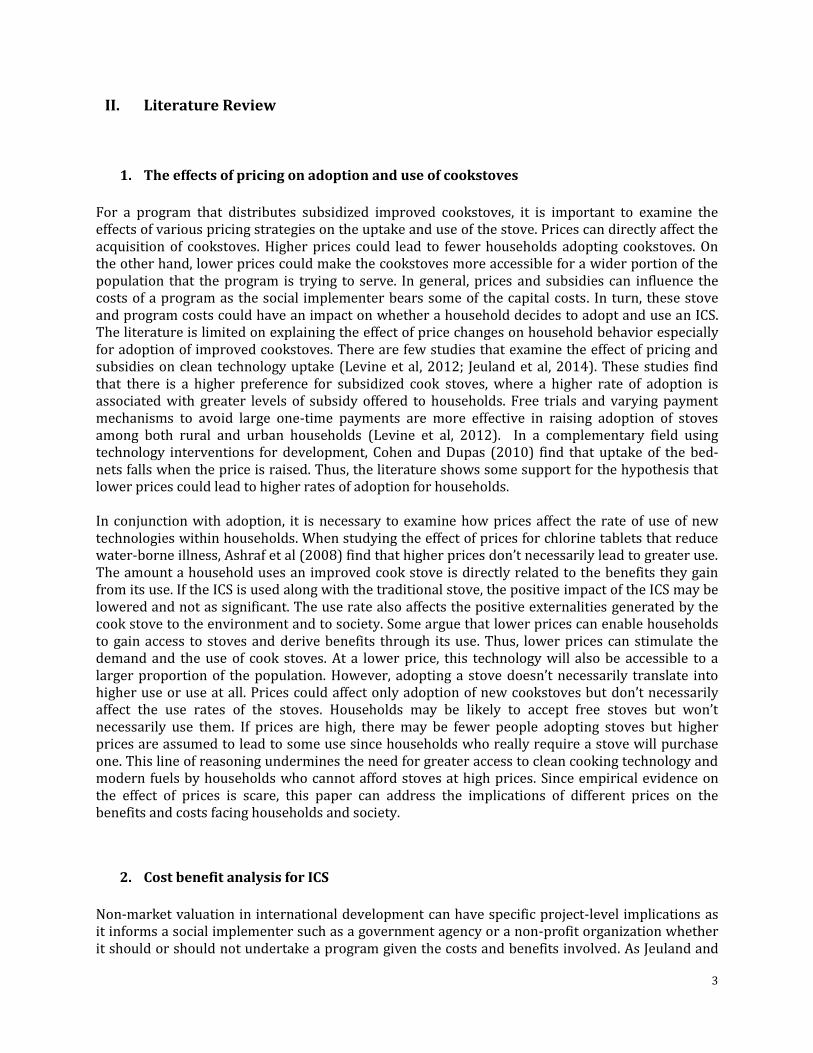
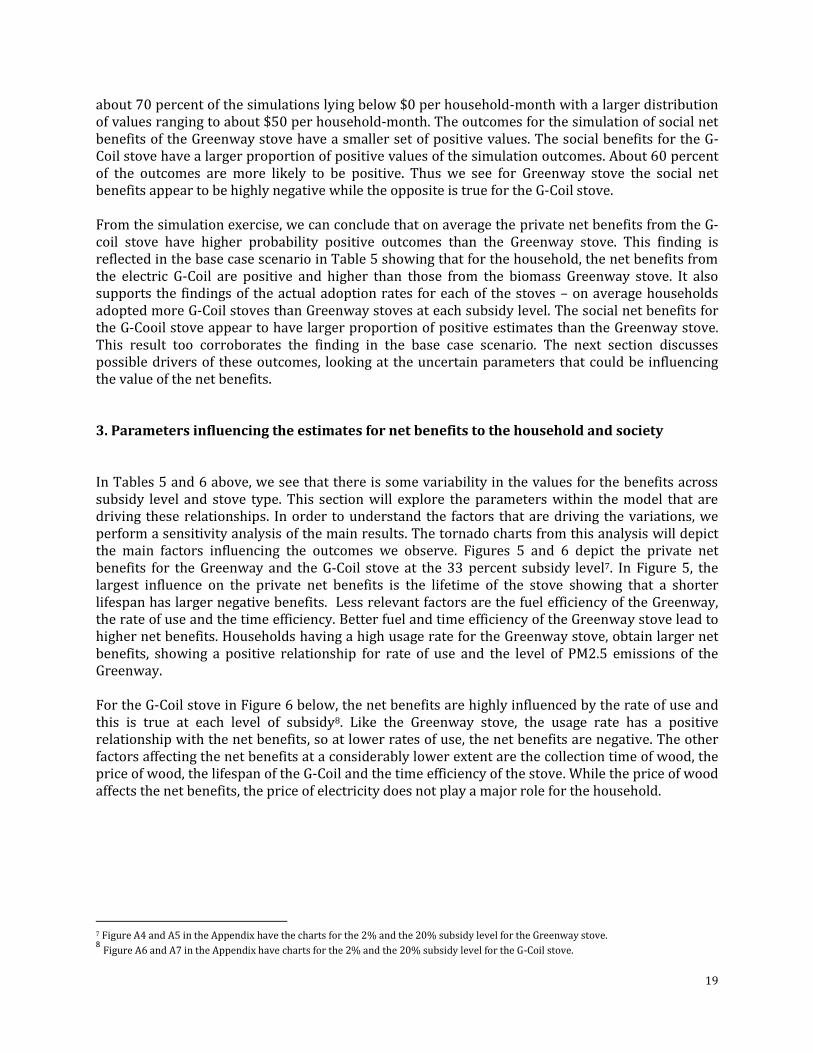
Figure 3: Social Net Benefits of the Greenway Stove
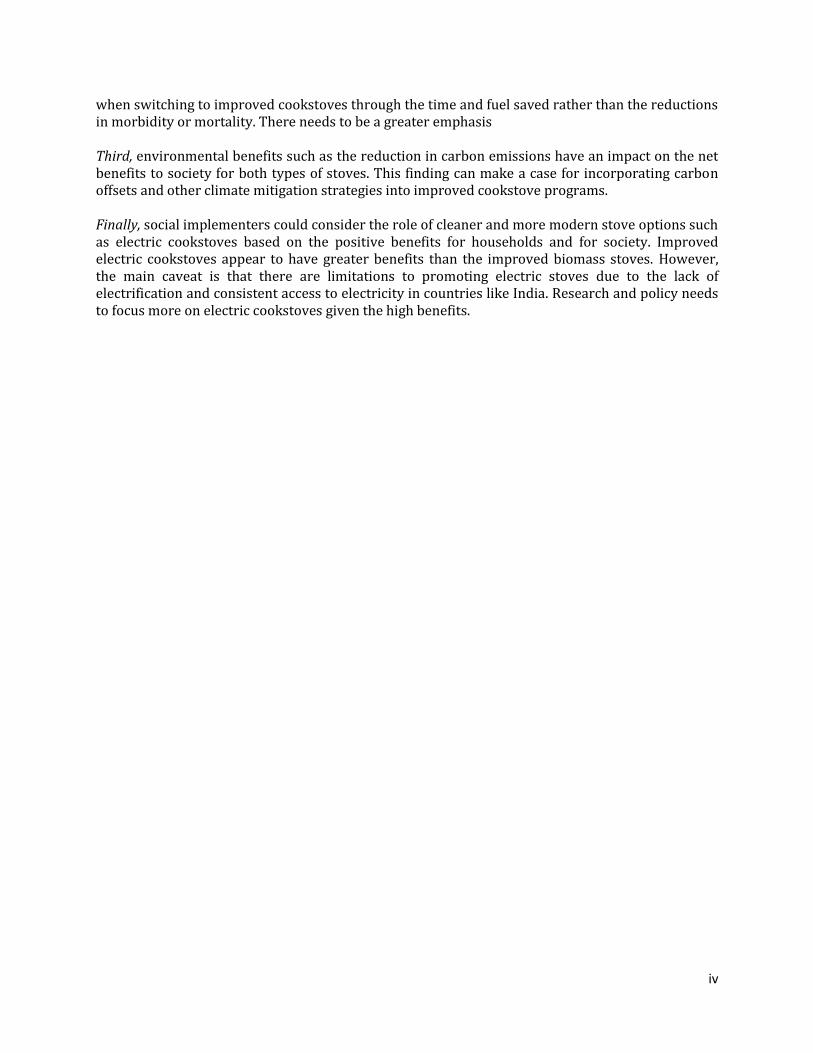
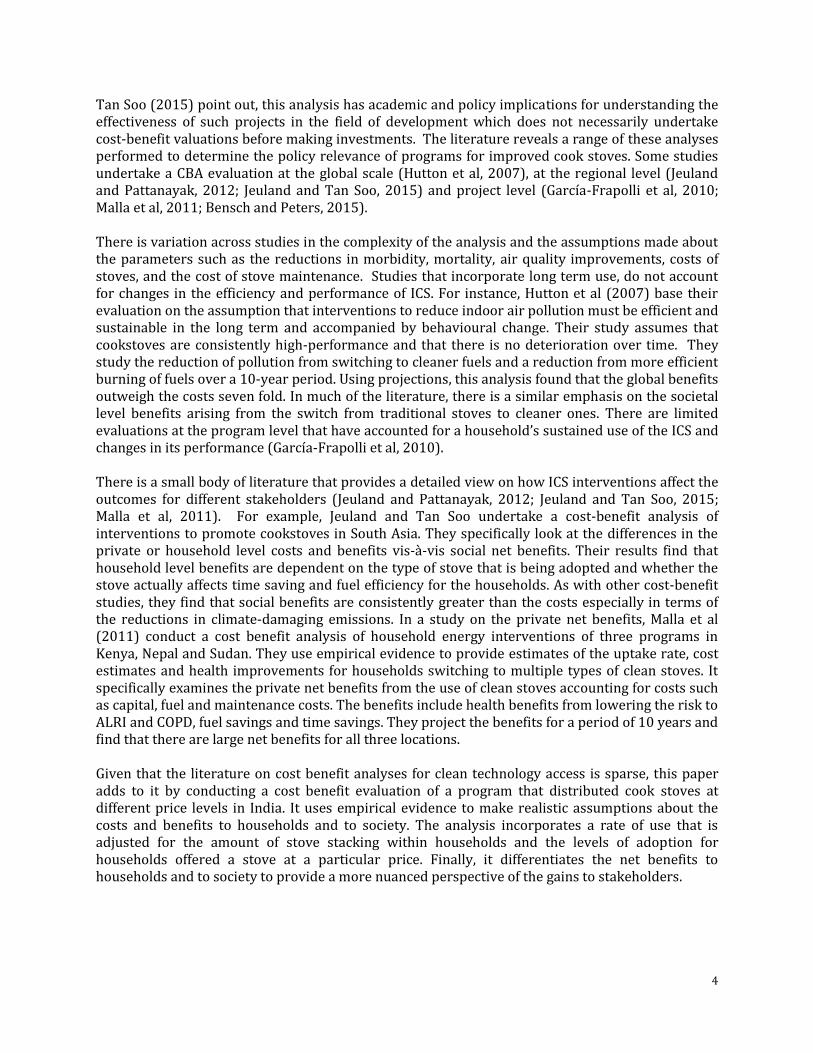
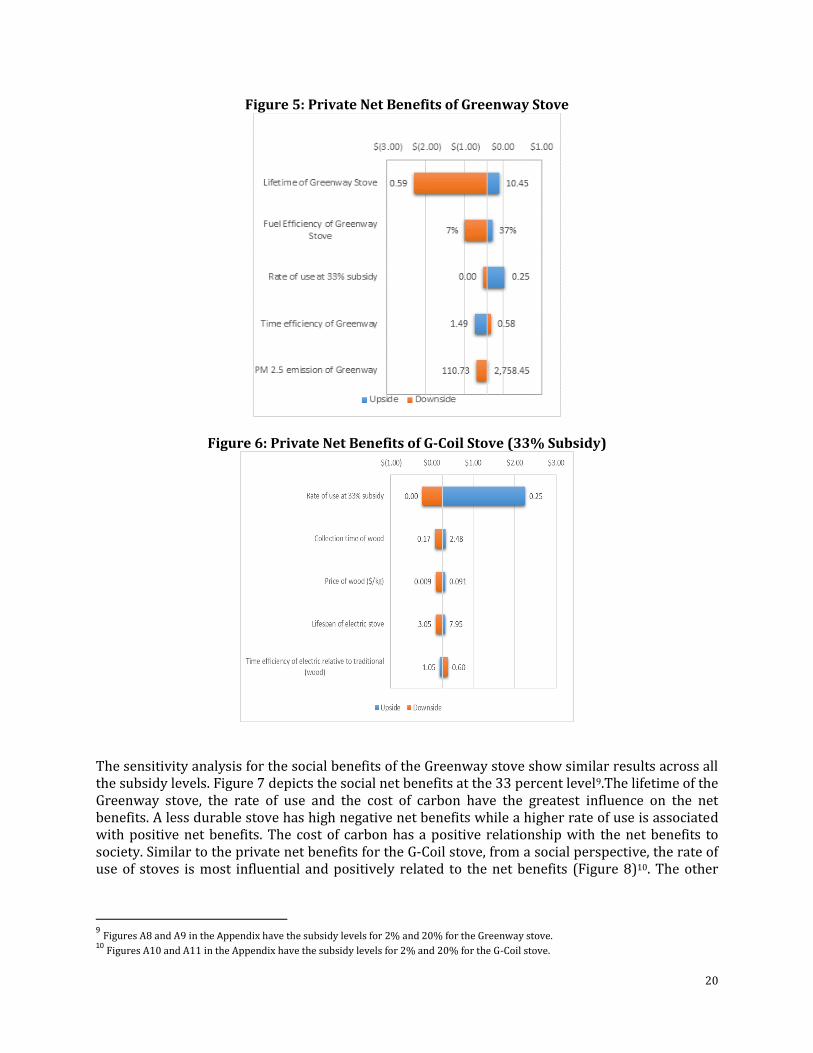
Figure 4: Social Net Benefits of the G-Coil Stove
The outcomes for the simulations of the social net benefits of both the Greenway and the G-Coil appear to be distributed in a similar way across subsidy levels. In Figure 3, the Greenway stove has
19
about 70 percent of the simulations lying below $0 per household-month with a larger distribution of values ranging to about $50 per household-month. The outcomes for the simulation of social net benefits of the Greenway stove have a smaller set of positive values. The social benefits for the G-Coil stove have a larger proportion of positive values of the simulation outcomes. About 60 percent of the outcomes are more likely to be positive. Thus we see for Greenway stove the social net benefits appear to be highly negative while the opposite is true for the G-Coil stove. From the simulation exercise, we can conclude that on average the private net benefits from the G-coil stove have higher probability positive outcomes than the Greenway stove. This finding is reflected in the base case scenario in Table 5 showing that for the household, the net benefits from the electric G-Coil are positive and higher than those from the biomass Greenway stove. It also supports the findings of the actual adoption rates for each of the stoves – on average households adopted more G-Coil stoves than Greenway stoves at each subsidy level. The social net benefits for the G-Cooil stove appear to have larger proportion of positive estimates than the Greenway stove. This result too corroborates the finding in the base case scenario. The next section discusses possible drivers of these outcomes, looking at the uncertain parameters that could be influencing the value of the net benefits. 3. Parameters influencing the estimates for net benefits to the household and society In Tables 5 and 6 above, we see that there is some variability in the values for the benefits across subsidy level and stove type. This section will explore the parameters within the model that are driving these relationships. In order to understand the factors that are driving the variations, we perform a sensitivity analysis of the main results. The tornado charts from this analysis will depict the main factors influencing the outcomes we observe. Figures 5 and 6 depict the private net benefits for the Greenway and the G-Coil stove at the 33 percent subsidy level7. In Figure 5, the largest influence on the private net benefits is the lifetime of the stove showing that a shorter lifespan has larger negative benefits. Less relevant factors are the fuel efficiency of the Greenway, the rate of use and the time efficiency. Better fuel and time efficiency of the Greenway stove lead to higher net benefits. Households having a high usage rate for the Greenway stove, obtain larger net benefits, showing a positive relationship for rate of use and the level of PM2.5 emissions of the Greenway. For the G-Coil stove in Figure 6 below, the net benefits are highly influenced by the rate of use and this is true at each level of subsidy8. Like the Greenway stove, the usage rate has a positive relationship with the net benefits, so at lower rates of use, the net benefits are negative. The other factors affecting the net benefits at a considerably lower extent are the collection time of wood, the price of wood, the lifespan of the G-Coil and the time efficiency of the stove. While the price of wood affects the net benefits, the price of electricity does not play a major role for the household.
7 Figure A4 and A5 in the Appendix have the charts for the 2% and the 20% subsidy level for the Greenway stove. 8 Figure A6 and A7 in the Appendix have charts for the 2% and the 20% subsidy level for the G-Coil stove.
20
Figure 5: Private Net Benefits of Greenway Stove
Figure 6: Private Net Benefits of G-Coil Stove (33% Subsidy)
The sensitivity analysis for the social benefits of the Greenway stove show similar results across all the subsidy levels. Figure 7 depicts the social net benefits at the 33 percent level9.The lifetime of the Greenway stove, the rate of use and the cost of carbon have the greatest influence on the net benefits. A less durable stove has high negative net benefits while a higher rate of use is associated with positive net benefits. The cost of carbon has a positive relationship with the net benefits to society. Similar to the private net benefits for the G-Coil stove, from a social perspective, the rate of use of stoves is most influential and positively related to the net benefits (Figure 8)10. The other
9 Figures A8 and A9 in the Appendix have the subsidy levels for 2% and 20% for the Greenway stove.
10 Figures A10 and A11 in the Appendix have the subsidy levels for 2% and 20% for the G-Coil stove.
21
parameters affecting the social net benefits are the cost of carbon, the time spent cooking on a traditional stove, the amount of nitrous oxide and the collection time for wood.
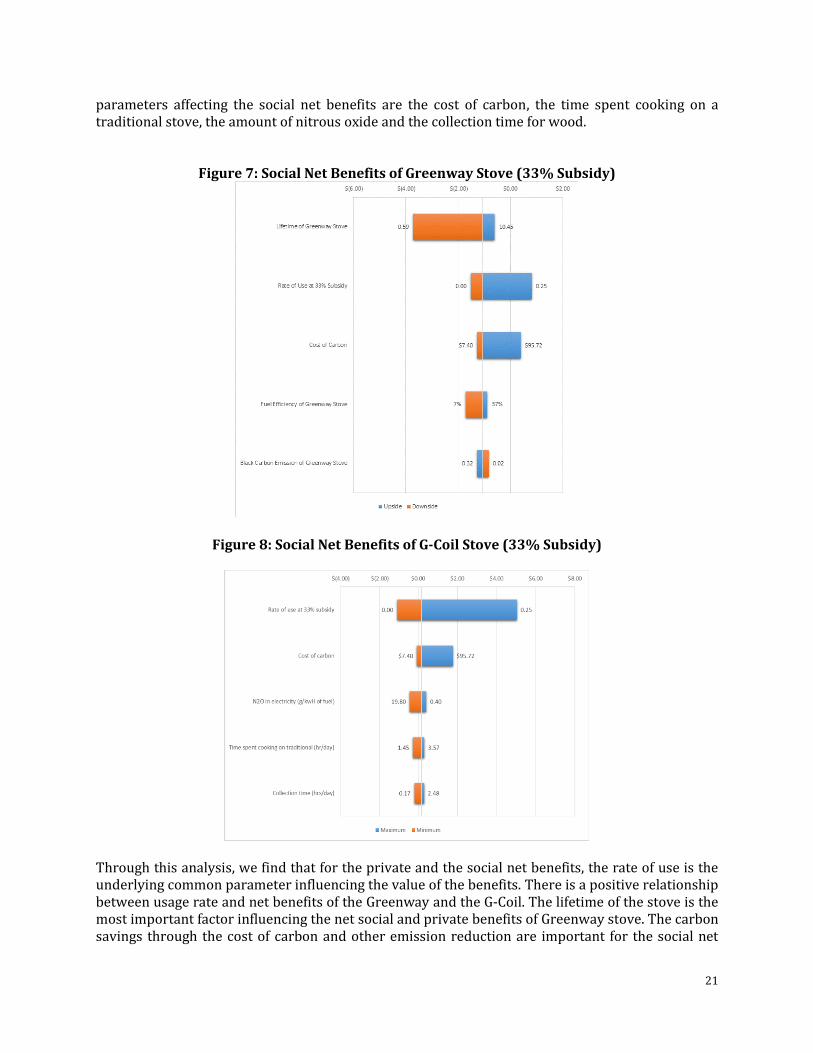
Figure 7: Social Net Benefits of Greenway Stove (33% Subsidy)
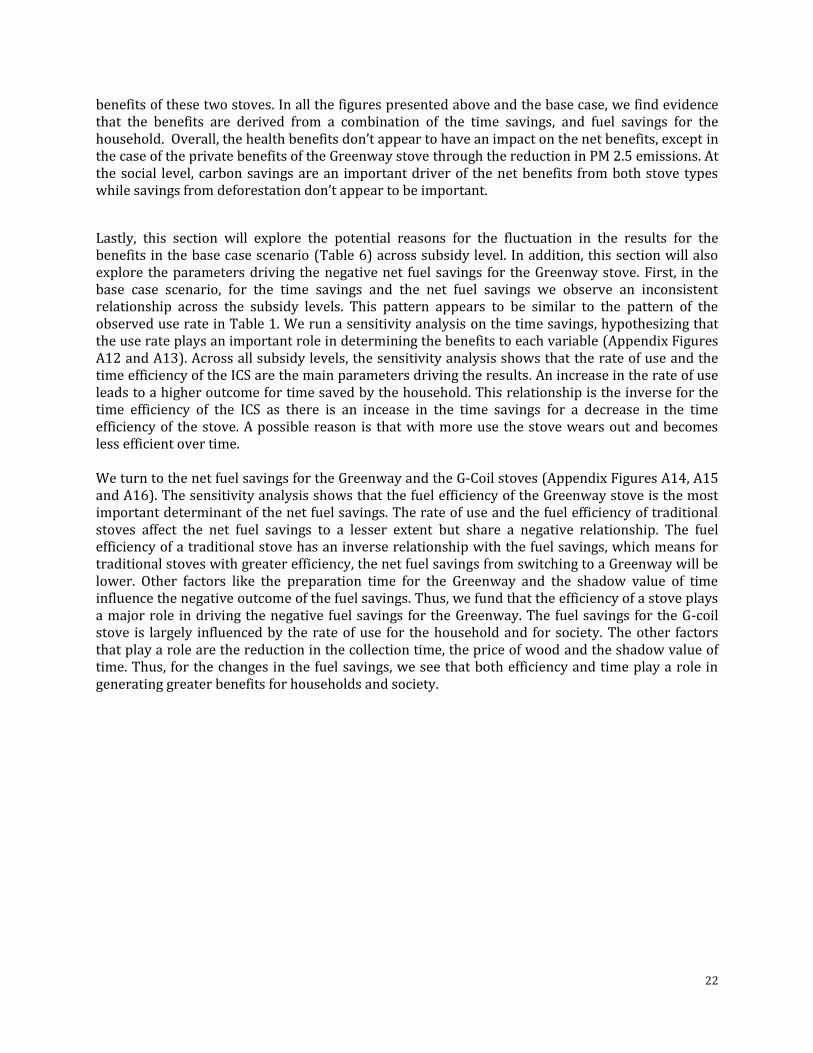
Figure 8: Social Net Benefits of G-Coil Stove (33% Subsidy)
Through this analysis, we find that for the private and the social net benefits, the rate of use is the underlying common parameter influencing the value of the benefits. There is a positive relationship between usage rate and net benefits of the Greenway and the G-Coil. The lifetime of the stove is the most important factor influencing the net social and private benefits of Greenway stove. The carbon savings through the cost of carbon and other emission reduction are important for the social net
22
benefits of these two stoves. In all the figures presented above and the base case, we find evidence that the benefits are derived from a combination of the time savings, and fuel savings for the household. Overall, the health benefits don’t appear to have an impact on the net benefits, except in the case of the private benefits of the Greenway stove through the reduction in PM 2.5 emissions. At the social level, carbon savings are an important driver of the net benefits from both stove types while savings from deforestation don’t appear to be important.
Lastly, this section will explore the potential reasons for the fluctuation in the results for the benefits in the base case scenario (Table 6) across subsidy level. In addition, this section will also explore the parameters driving the negative net fuel savings for the Greenway stove. First, in the base case scenario, for the time savings and the net fuel savings we observe an inconsistent relationship across the subsidy levels. This pattern appears to be similar to the pattern of the observed use rate in Table 1. We run a sensitivity analysis on the time savings, hypothesizing that the use rate plays an important role in determining the benefits to each variable (Appendix Figures A12 and A13). Across all subsidy levels, the sensitivity analysis shows that the rate of use and the time efficiency of the ICS are the main parameters driving the results. An increase in the rate of use leads to a higher outcome for time saved by the household. This relationship is the inverse for the time efficiency of the ICS as there is an incease in the time savings for a decrease in the time efficiency of the stove. A possible reason is that with more use the stove wears out and becomes less efficient over time. We turn to the net fuel savings for the Greenway and the G-Coil stoves (Appendix Figures A14, A15 and A16). The sensitivity analysis shows that the fuel efficiency of the Greenway stove is the most important determinant of the net fuel savings. The rate of use and the fuel efficiency of traditional stoves affect the net fuel savings to a lesser extent but share a negative relationship. The fuel efficiency of a traditional stove has an inverse relationship with the fuel savings, which means for traditional stoves with greater efficiency, the net fuel savings from switching to a Greenway will be lower. Other factors like the preparation time for the Greenway and the shadow value of time influence the negative outcome of the fuel savings. Thus, we fund that the efficiency of a stove plays a major role in driving the negative fuel savings for the Greenway. The fuel savings for the G-coil stove is largely influenced by the rate of use for the household and for society. The other factors that play a role are the reduction in the collection time, the price of wood and the shadow value of time. Thus, for the changes in the fuel savings, we see that both efficiency and time play a role in generating greater benefits for households and society.
23
VI. Discussion
This paper conducts a cost benefit analysis of an improved stove distribution program with different levels of subsidy. The analysis uses empirical evidence to make a realistic estimate of the costs and benefits associated with the biomass Greenway stove and the electric G-Coil stove. Using the Monte Carlo simulations, a second analysis runs a simulation of the results to understand how variations in the parameters affect the net outcomes to households and to society. Finally, the paper also contains a sensitivity analysis to find the parameters that have the largest effect on these outcomes. There are five main results from this paper: first, at the baseline, we observe negative private and social net benefits from the biomass Greenway stove. On the other hand, there were positive private and social net benefits for the electric G-Coil stove. These results correlate with the data on adoption of the stoves that show a higher adoption rate for the G-Coil over the Greenway stove. It also corroborates the findings by Jeuland & Tan Soo (2015) that there are higher benefits for households from electric stoves than biomass stoves. Second, the simulations show similar patterns to the base case results. The probability of having a negative outcome was about 90 percent for the private benefits of the Greenway and lower than 30 percent for the G-Coil stove. The social benefits were positive about 25 percent of the time for the Greenway stove and 60 percent of the time for the G-Coil stove. Thus on average, the G-Coil stove has a greater probability of having positive private and social net benefits. Third, the Monte Carlo simulations also show that there is variation in the private benefits by subsidy level for both stove types i.e. the highest subsidy (33 percent) has the lowest distribution of negative values. In other words, the 33 percent subsidy has a higher probability of a positive outcome than the other two subsidy levels. For each of the lower subsidy levels, the distribution is higher, with a higher percentage of negative outcomes. We do not observe this differential effect on the social net benefits to either stove. Fourth, the sensitivity analysis shows us that the main factors driving the private and social net benefits of the Greenway and G-Coil stoves are the time and fuel savings. These results are similar to the findings in Jeuland and Tan Soo (2015) which show that time-related parameters such as the time efficiency of stoves, the collection time and the shadow value of time play a role in influencing the net benefits. In addition, there is limited evidence that health parameters have an effect on the net benefits to households or to society. For the social net benefits, the carbon savings also play a role in influencing the outcomes through the cost of carbon. Fifth, from the sensitivity analysis of the social and private net benefits and the individual variables, the paper finds that the usage rates play the most important role in determining the outcomes. The range of use is drawn from the evidence in the Uttarakhand study but is considerably lower than the values found in prior studies (Jeuland and Pattanayak, 2012; Jeuland and Tan Soo, 2015). In all the tornado charts of the sensitivity analysis, the rate of use was a parameter consistently affecting the net benefits. The influence of the rate of use was particularly relevant for the private benefits of the G-Coil stove. At all subsidy levels of the G-Coil, the rate of use explained about 98 percent of the outcome.
24
1. Limitations
While this study addresses the economic benefits using empirical evidence and pricing strategies, it is still limited by the lack of comprehensive empirical data for some of the parameters in the model. Estimations for parameters like the shadow value of time and the cost of illness are based on sparse literature in the field. In addition, the variables related various health parameters also approximations on the national and international level. A more robust estimation of the net benefit values can be obtained with parameters that better specify the conditions of the region. Lastly, this study looks at only two types of stoves each of which are low priced and have a relatively short life. Further research in this area can incorporate other clean stove types like LPG, as well as incorporate data on stove usage over the long term.
1. Policy implications
This study provides a detailed analysis of the costs and benefits arising from an improved
cookstove program using a biomass cookstove and an electric cookstove. There are several policy
implications of this study:
First, the analysis finds that subsidies have a positive influence yet minimal impact on the private
net benefits to households. The results show that with higher levels of subsidies, the benefits are
more likely to be positive. Poor households can gain access to and the benefits from improved
cookstoves if these products are accessible at lower prices.
Second, time and fuel savings appear to have greater benefits for households while the health
benefits appear to be minimal. This result implies that households attain larger economic benefits
when switching to improved cookstoves through the time and fuel saved rather than the reductions
in morbidity or mortality. There needs to be a greater emphasis
Third, environmental benefits such as the reduction in carbon emissions have an impact on the net
benefits to society for both types of stoves. This finding can make a case for incorporating carbon
offsets and other climate mitigation strategies into improved cookstove programs.
Finally, social implementers could consider the role of cleaner and more modern stove options such
as electric cookstoves based on the positive benefits for households and for society. Improved
electric cookstoves appear to have greater benefits than the improved biomass stoves. However,
the main caveat is that there are limitations to promoting electric stoves due to the lack of
electrification and consistent access to electricity in countries like India. Research and policy needs
to focus more on electric cookstoves given the high benefits.

25
26
VII. References
Beltramo, T., et al., The effect of marketing messages and payment over time on willingness to pay for fuel-efficient cookstoves. J. Econ. Behav. Organ. (2015), http://dx.doi.org/10.1016/j.jebo.2015.04.025
Bensch, G., & Peters, J. (2015). The intensive margin of technology adoption – Experimental evidence on
improved cooking stoves in rural Senegal. Journal of Health Economics, 42, 44–63. http://doi.org/10.1016/j.jhealeco.2015.03.006
Bielecki, C., & Wingenbach, G. (2014). Rethinking improved cookstove diffusion programs: A case study
of social perceptions and cooking choices in rural Guatemala. Energy Policy, 66, 350–358. http://doi.org/10.1016/j.enpol.2013.10.082
Bond TC, Doherty SJ, Fahey D, Forster P, Berntsen T, DeAngelo B, et al. (2013) Bounding the role of black
carbon in the climate system: A scientific assessment. J Geophys Res. 2013;118(11):5380-552. García-Frapolli, E., Schilmann, A., Berrueta, V. M., Riojas-Rodríguez, H., Edwards, R. D., Johnson, M., …
Masera, O. (2010). Beyond fuelwood savings: Valuing the economic benefits of introducing improved biomass cookstoves in the Purépecha region of Mexico. Ecological Economics, 69(12), 2598–2605. http://doi.org/10.1016/j.ecolecon.2010.08.004
Hutton, G., Rehfuess, E., & Tediosi, F. (2007). Evaluation of the costs and benefits of interventions to
reduce indoor air pollution. Energy for Sustainable Development, 11(4), 34–43. http://doi.org/10.1016/S0973-0826(08)60408-1
Jeuland, M. A., & Pattanayak, S. K. (2012). Benefits and Costs of Improved Cookstoves: Assessing the
Implications of Variability in Health, Forest and Climate Impacts. PLoS ONE, 7(2), e30338. http://doi.org/10.1371/journal.pone.0030338
Jeuland, M.A., & Soo, J. T. (2015). Analyzing the Costs and Benefits of Improved Cooking Solutions.
Working Paper, forthcoming. Jeuland, M., Pattanayak, S. K., Soo, T., & Sheng, J. (2014). Preference Heterogeneity and Adoption of
Environmental Health Improvements: Evidence from a Cookstove Promotion Experiment (SSRN Scholarly Paper No. ID 2490530). Rochester, NY: Social Science Research Network. Retrieved from http://papers.ssrn.com/abstract=2490530
Lewis, J. J., & Pattanayak, S. K. (2012). Who Adopts Improved Fuels and Cookstoves? A Systematic
Review. Environmental Health Perspectives, 120(5), 637–645. http://doi.org/10.1289/ehp.1104194 Levine, D. I., Beltramo, T., Blalock, G., & Cotterman, C. (2012). What Impedes Efficient Adoption of
Products? Evidence from Randomized Variation in Sales Offers for Improved Cookstoves in Uganda. eScholarship. Retrieved from http://escholarship.org/uc/item/86v4x8nn
27
Malla, M. B., Bruce, N., Bates, E., & Rehfuess, E. (2011). Applying global cost-benefit analysis methods to indoor air pollution mitigation interventions in Nepal, Kenya and Sudan: Insights and challenges. Energy Policy, 39(12), 7518-7529.
Pine, K., Edwards, R., Masera, O., Schilmann, A., Marrón-Mares, A., & Riojas-Rodríguez, H. (2011).
Adoption and use of improved biomass stoves in Rural Mexico. Energy for Sustainable Development, 15(2), 176–183. http://doi.org/10.1016/j.esd.2011.04.001
Rehfuess, E. A., Puzzolo, E., Stanistreet, D., Pope, D., & Bruce, N. G. (2013). Enablers and Barriers to Large-
Scale Uptake of Improved Solid Fuel Stoves: A Systematic Review. Environmental Health Perspectives. http://doi.org/10.1289/ehp.1306639
Ruiz-Mercado, I., Masera, O., Zamora, H., & Smith, K. R. (2011). Adoption and sustained use of improved
cookstoves. Energy Policy, 39(12), 7557–7566. http://doi.org/10.1016/j.enpol.2011.03.028 Saatkamp, B. D., Masera, O. R., & Kammen, D. M. (2000). Energy and health transitions in development:
fuel use, stove technology, and morbidity in Jarácuaro, México. Energy for Sustainable Development, 4(2), 7–16. http://doi.org/10.1016/S0973-0826(08)60237-9
SDGs & Topics .:. Sustainable Development Knowledge Platform. (n.d.). Retrieved October 26, 2015, from
https://sustainabledevelopment.un.org/topics Smith, K. R., Apte, M. G., Yuqing, M., Wongsekiarttirat, W., & Kulkarni, A. (1994). Air pollution and the
energy ladder in asian cities. Energy, 19(5), 587–600. http://doi.org/10.1016/0360-5442(94)90054-X
Shindell, D., Kuylenstierna, J. C. I., Vignati, E., Dingenen, R. van, Amann, M., Klimont, Z., … Fowler, D.
(2012). Simultaneously Mitigating Near-Term Climate Change and Improving Human Health and Food Security. Science, 335(6065), 183–189. http://doi.org/10.1126/science.1210026
Sovacool, B. K. (2012). The political economy of energy poverty: A review of key challenges. Energy for
Sustainable Development, 16(3), 272–282. http://doi.org/10.1016/j.esd.2012.05.006 Thomas, E., Wickramasinghe, K., Mendis, S., Roberts, N., & Foster, C. (2015). Improved stove
interventions to reduce household air pollution in low and middle income countries: a descriptive systematic review. BMC Public Health, 15(1), 650. http://doi.org/10.1186/s12889-015-2024-7
WHO | Global health risks. (n.d.). Retrieved October 4, 2015, from
http://www.who.int/healthinfo/global_burden_disease/global_health_risks/en/Wilson et al. (2015). Chapter 20: Comparing Cookstove Usage Measured with Sensors Versus Cell Phone-based Surveys in Dafur, Sudan, E. Hostettler et al. (eds.), Technologies for Development, Springer International Publishing Switzerland 2015. DOI 10.1007/978-3-319-16247-8_20
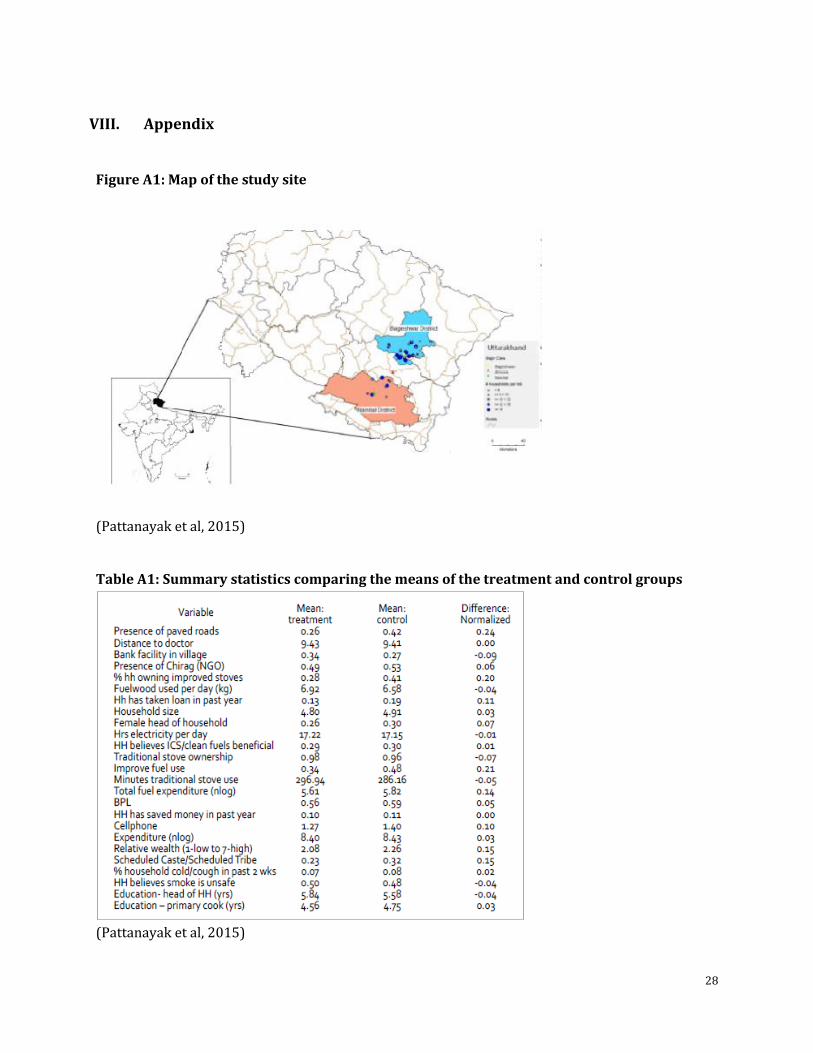
28
VIII. Appendix
Figure A1: Map of the study site
(Pattanayak et al, 2015)
Table A1: Summary statistics comparing the means of the treatment and control groups
(Pattanayak et al, 2015)
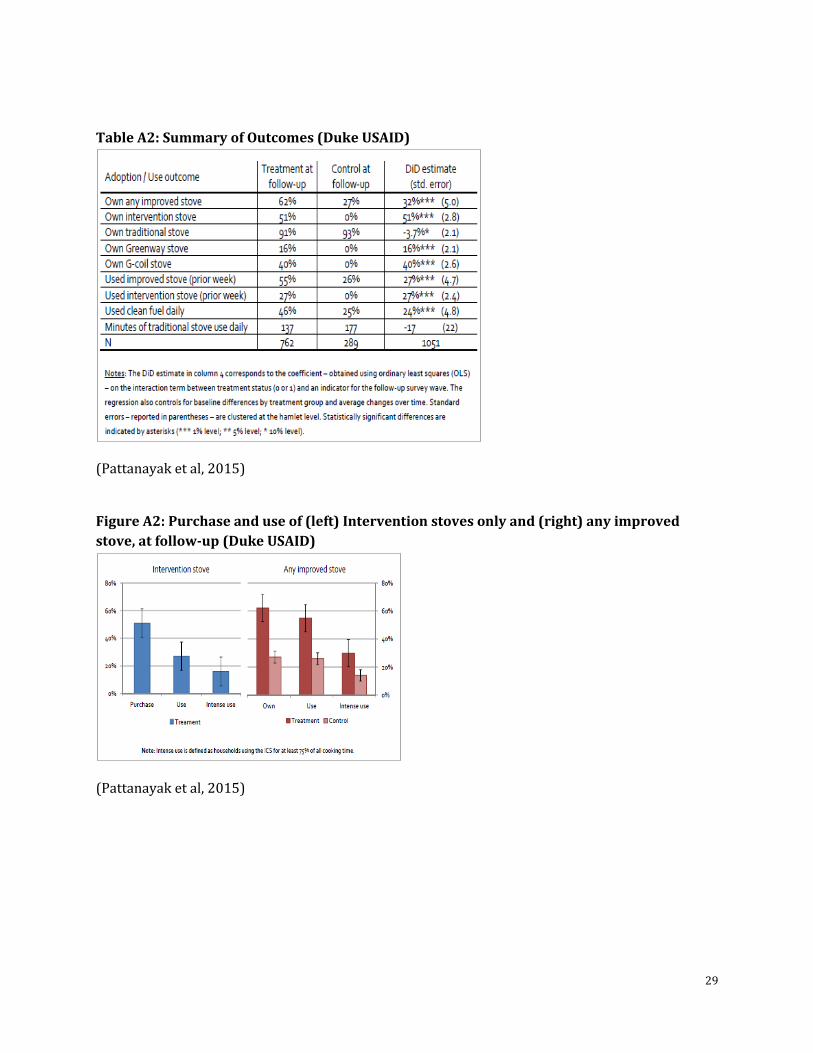
29
Table A2: Summary of Outcomes (Duke USAID)
(Pattanayak et al, 2015)
Figure A2: Purchase and use of (left) Intervention stoves only and (right) any improved
stove, at follow-up (Duke USAID)
(Pattanayak et al, 2015)
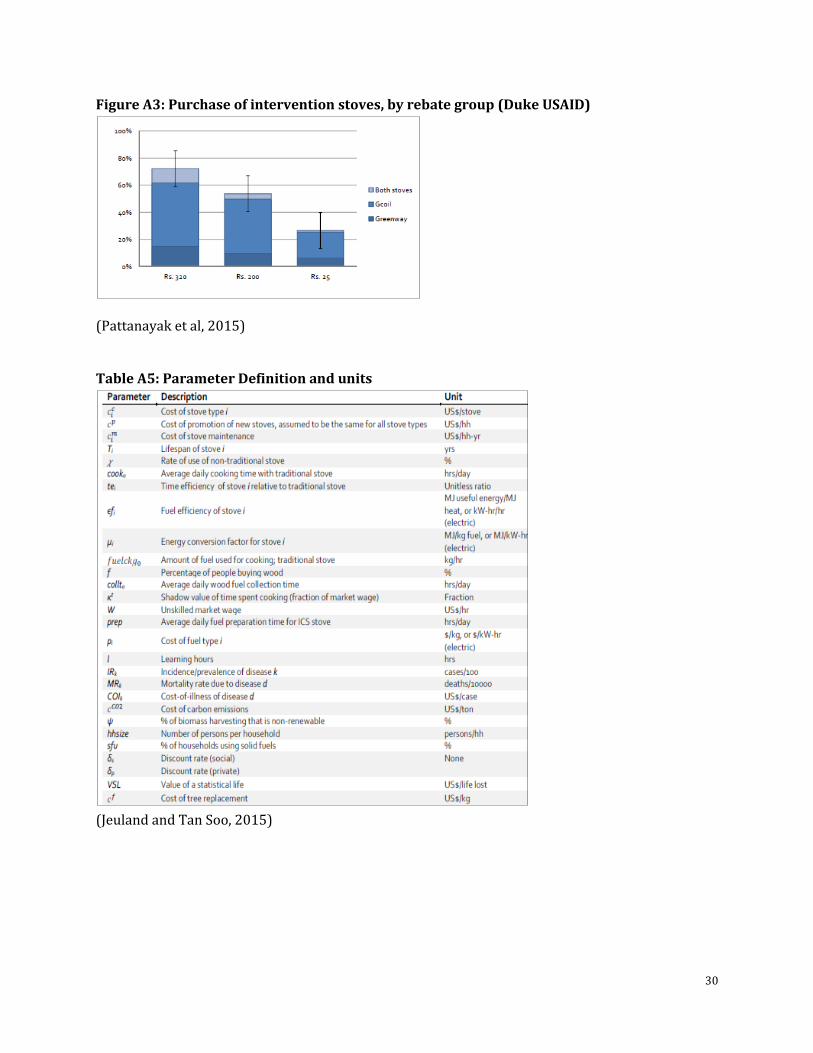
30
Figure A3: Purchase of intervention stoves, by rebate group (Duke USAID)
(Pattanayak et al, 2015)
Table A5: Parameter Definition and units
(Jeuland and Tan Soo, 2015)
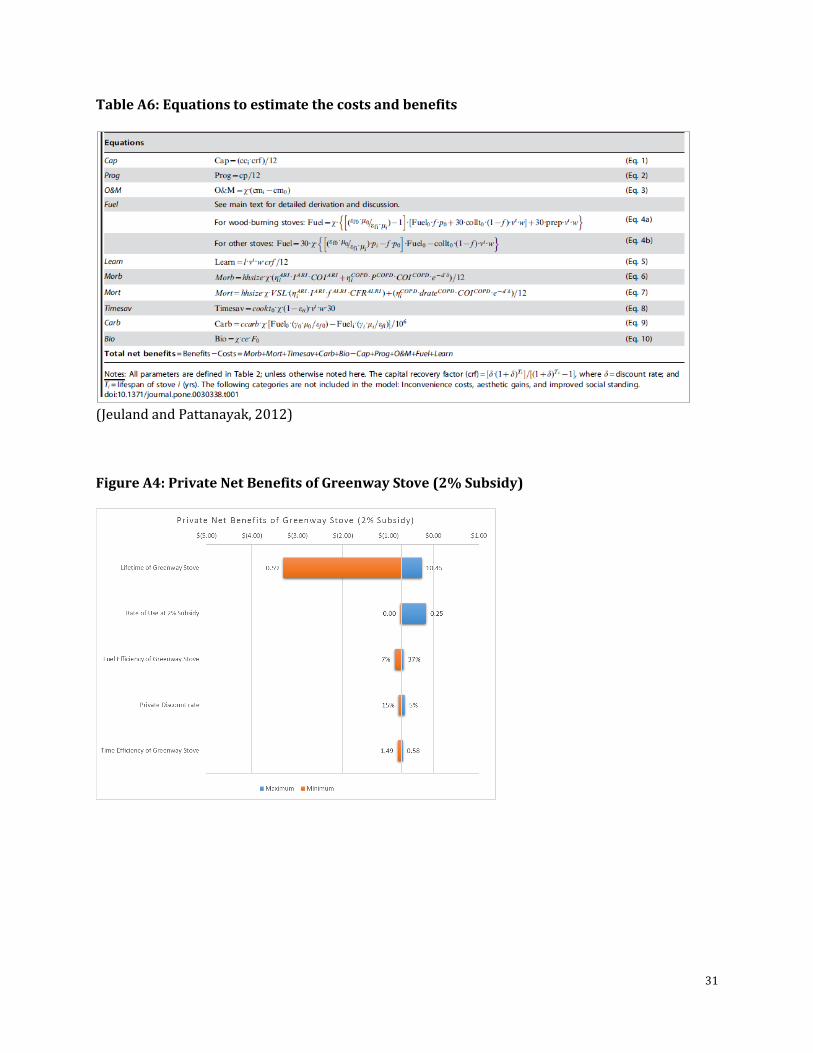
31
Table A6: Equations to estimate the costs and benefits
(Jeuland and Pattanayak, 2012)
Figure A4: Private Net Benefits of Greenway Stove (2% Subsidy)
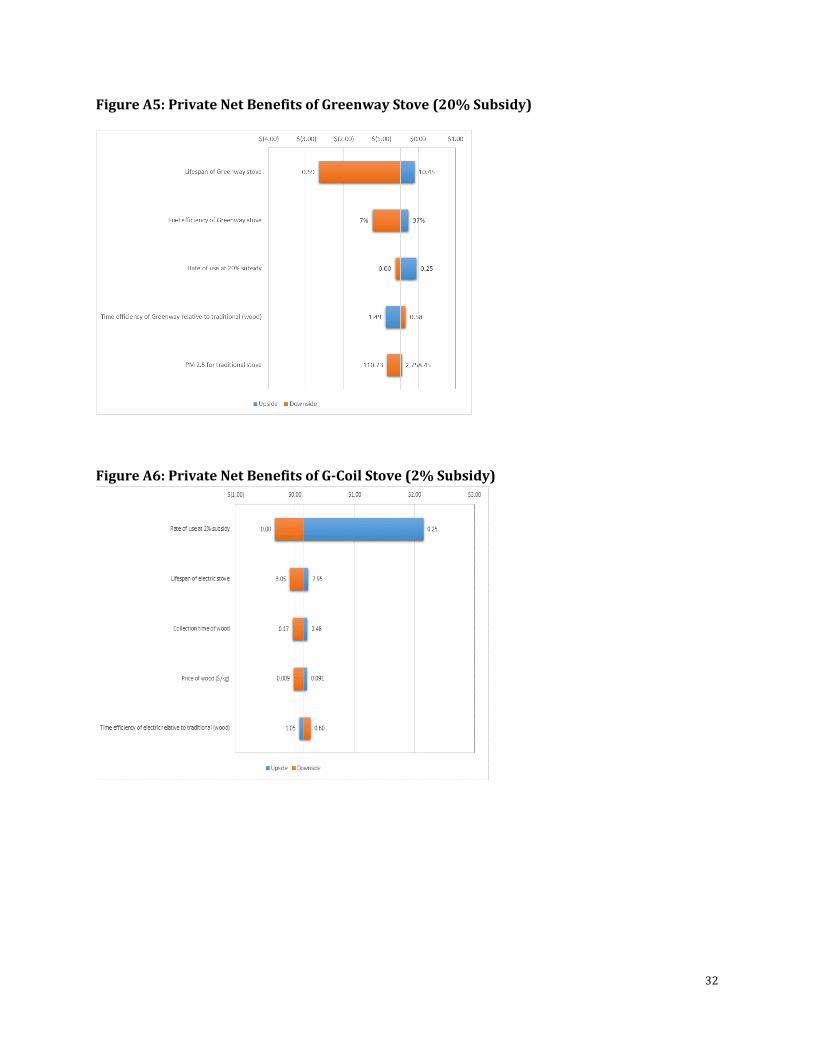
32
Figure A5: Private Net Benefits of Greenway Stove (20% Subsidy)
Figure A6: Private Net Benefits of G-Coil Stove (2% Subsidy)
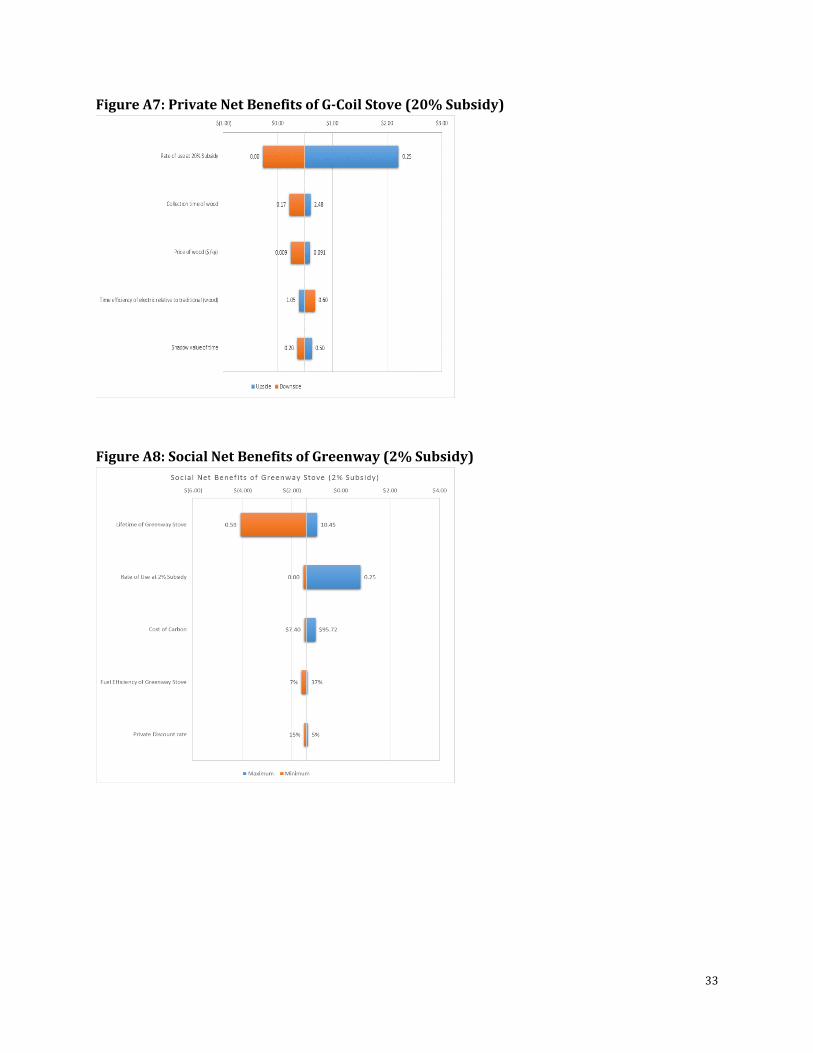
33
Figure A7: Private Net Benefits of G-Coil Stove (20% Subsidy)
Figure A8: Social Net Benefits of Greenway (2% Subsidy)
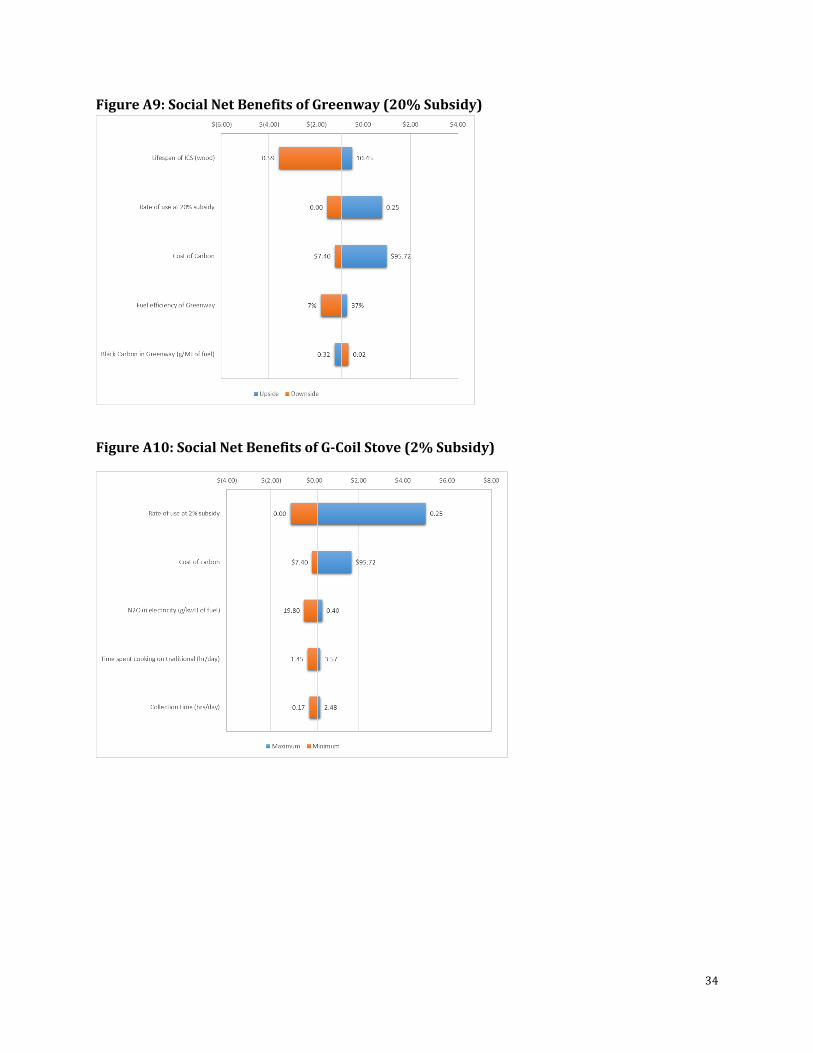
34
Figure A9: Social Net Benefits of Greenway (20% Subsidy)
Figure A10: Social Net Benefits of G-Coil Stove (2% Subsidy)
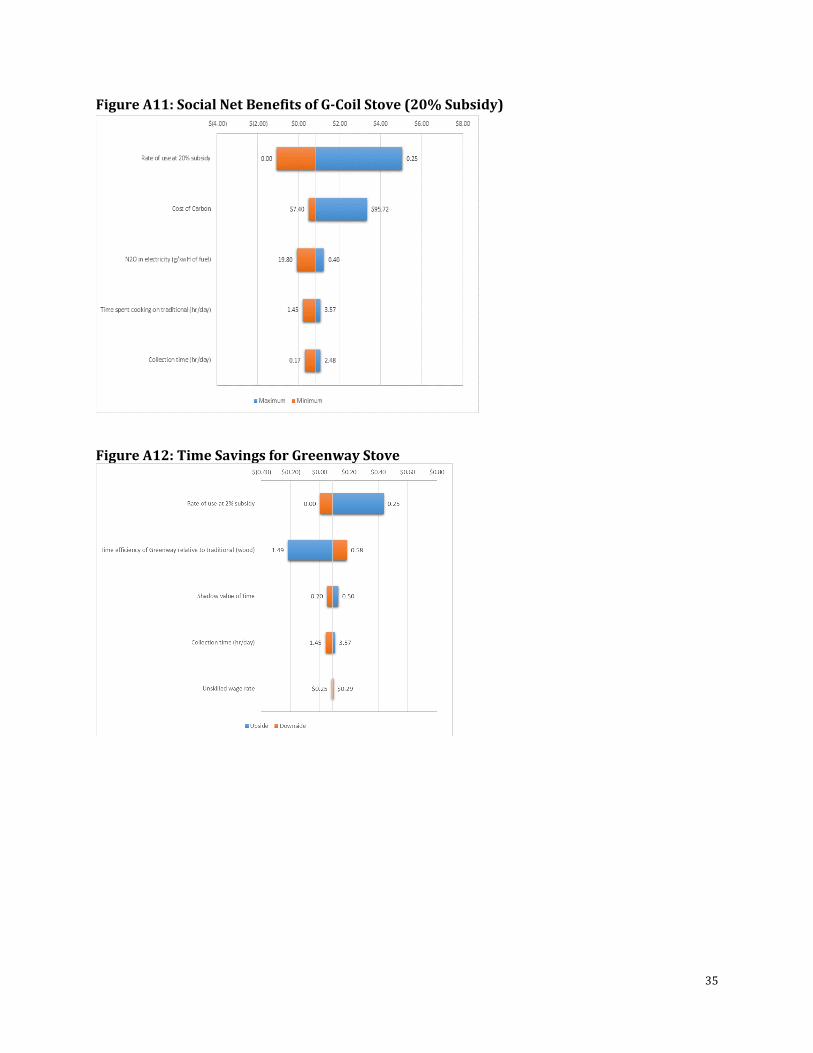
35
Figure A11: Social Net Benefits of G-Coil Stove (20% Subsidy)
Figure A12: Time Savings for Greenway Stove
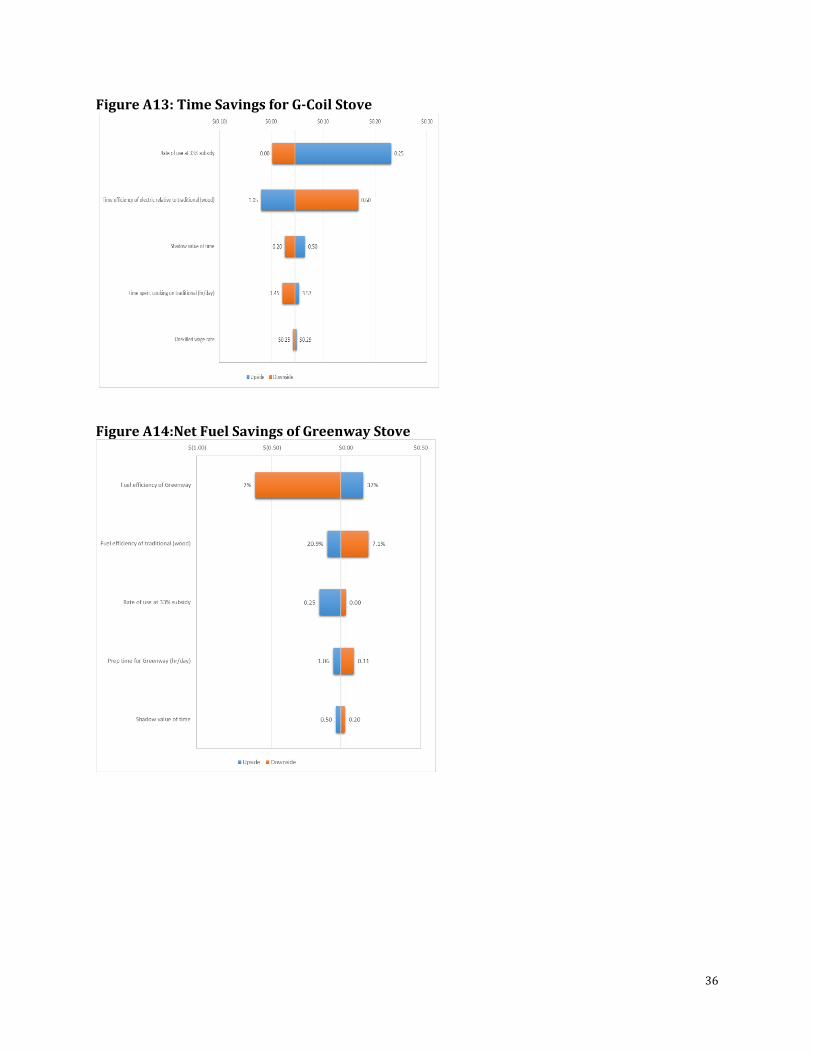
36
Figure A13: Time Savings for G-Coil Stove
Figure A14:Net Fuel Savings of Greenway Stove
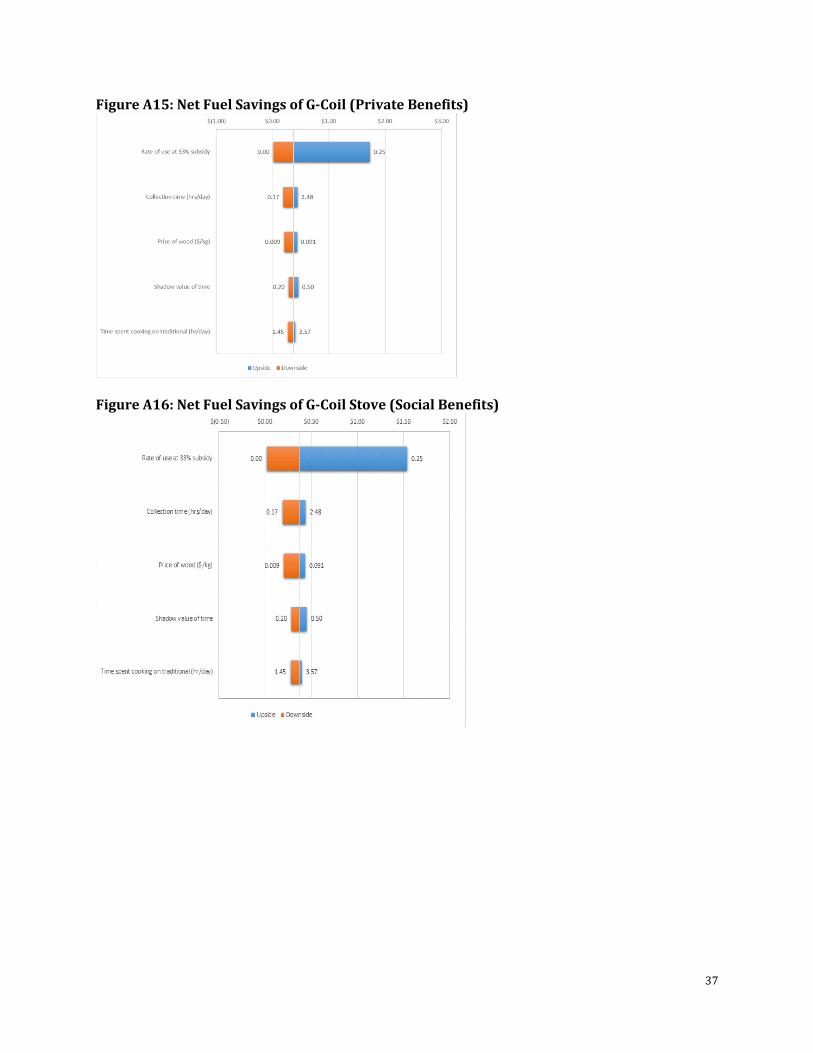
37
Figure A15: Net Fuel Savings of G-Coil (Private Benefits)
Figure A16: Net Fuel Savings of G-Coil Stove (Social Benefits)