Embed Size (px)
Citation preview
A Hierarchical Edge Cloud Architecture forMobile Computing
Liang Tong, Yong Li and Wei Gao
Department of Electrical Engineering and Computer Science
University of Tennessee at Knoxville
{ltong, yli118}@vols.utk.edu, [email protected]
Abstract—The performance of mobile computing would besignificantly improved by leveraging cloud computing and mi-grating mobile workloads for remote execution at the cloud.In this paper, to efficiently handle the peak load and satisfythe requirements of remote program execution, we propose todeploy cloud servers at the network edge and design the edgecloud as a tree hierarchy of geo-distributed servers, so as toefficiently utilize the cloud resources to serve the peak loadsfrom mobile users. The hierarchical architecture of edge cloudenables aggregation of the peak loads across different tiers ofcloud servers to maximize the amount of mobile workloads beingserved. To ensure efficient utilization of cloud resources, wefurther propose a workload placement algorithm that decideswhich edge cloud servers mobile programs are placed on andhow much computational capacity is provisioned to execute eachprogram. The performance of our proposed hierarchical edgecloud architecture on serving mobile workloads is evaluated byformal analysis, small-scale system experimentation, and large-scale trace-based simulations.
I. INTRODUCTION
One of the most important challenges in mobile computing
is to address the contradiction between the increasing com-
plexity of mobile applications and the limited local capabilities
of mobile devices. A viable solution to this challenge is to
leverage cloud computing and execute mobile applications
remotely. Such remote execution benefits a large varieties of
mobile applications, such as gesture recognition [8], voice
control, recognition assistance [2] and mobile gaming [6].
Modern cloud computing services, such as Amazon EC2
and Microsoft Azure, are solely hosted by data centers and
incapable of efficiently executing mobile applications due to
the following reasons. First, many mobile applications are
delay-sensitive and require immediate response [2]. Offloading
mobile workloads to remote data centers or computing clus-
ters, however, incurs long network transmission latency [7],
which seriously impairs the mobile application performance.
Second, current data centers mainly focus on serving enterprise
users with high volumes of workloads [11], by providing
virtualized cloud resources as Virtual Machines (VMs). These
data centers handle each mobile application using a separate
VM no matter how small its amount of workload is, but
incur significant overhead for global VM provisioning and
management due to the huge number of mobile applications
using the cloud. Such overhead may even exceed the expense
of mobile program execution itself and overload the data
centers during peak hours.
This work was supported in part by the National Science Foundation (NSF)under grants CNS-1526769 and CNS-1527612, and was supported by theArmy Research Office (ARO) under grant W911NF-15-1-0221.
Therefore, there are pressing needs to redesign the cloud
architecture to serve the mobile workloads with better ef-
ficiency and scalability. Recent research efforts propose to
deploy an intermediate cloud layer, so-called cloudlets, at the
network edge [7], [9]. Since the distance between mobile
devices and the cloud is shortened, the network latency access-
ing cloud computing services could be significantly reduced.
However, these existing designs inappropriately consider the
edge cloud as a black box and assumes unlimited cloud
computing resources at all times. Mobile users, hence, may
experience excessive cloud access latency when they are
served by local cloudlets with limited computing capabilities
and large amounts of peak load. Provisioning more capacities
on cloudlets would help reduce such cloud access latency, but
seriously impairs the efficiency of cloud resource utilization
during off-peak hours [12].
In this paper, we address the aforementioned challenge and
improve the efficiency of cloud resource utilization by orga-
nizing the edge cloud servers into a hierarchical architecture.
Instead of serving mobile users directly using a flat collection
of edge cloud servers, our basic idea is to opportunistically
aggregate and serve the peak loads that exceed the capacities
of lower tiers of edge cloud servers to other servers at higher
tiers in the edge cloud hierarchy. As a result, we are able to
serve larger amounts of peak loads with the same amount of
computational capacities being provisioned at the edge. We
developed analytical models to compare the performance and
resource utilization efficiency between flat and hierarchical
designs of the edge cloud, and provided theoretical results
showing the advantage of hierarchical edge cloud architecture.
Furthermore, we ensure efficient utilization of the comput-
ing resources at different tiers of edge cloud servers to better
serve the peak load, by developing optimization algorithms
that adaptively place the mobile workloads at different edge
cloud servers. The proposed workload placement algorithms
focus on deciding which the edge cloud servers mobile pro-
grams are placed on and how much computational capacity
is provisioned to execute each program. The major challenge
of such algorithm design, however, lies in the difficulty of
appropriately balancing between the computation and commu-
nication delays in the edge cloud. Placing mobile programs at
high-tier servers reduces contention on computing resources
and improves the program execution performance, but also
spends longer time on transmitting the program states over
the network. To address this challenge and find the optimal
solution of workload placement, we first consider a scenario
which has only one server at each tier of the edge cloud.
Afterwards, we aggregate the decisions of workload placement
IEEE INFOCOM 2016 - The 35th Annual IEEE International Conference on Computer Communications
978-1-4673-9953-1/16/$31.00 ©2016 IEEE
at different edge cloud servers together.To the best of our knowledge, our work is the first to design
the edge cloud and further improve its performance in such a
hierarchical manner. Our detailed contributions are as follows:
∙ We design a hierarchical edge cloud architecture which
enables aggregation of the peak loads across different
tiers of cloud servers. We propose an analytical model
to compare the efficiency of cloud resource utilization
between flat and hierarchical designs of edge cloud, and
show that the hierarchical edge cloud has better efficiency
serving the peak loads.
∙ We develop workload placement algorithms that adap-
tively place mobile workloads among different tiers of
servers and decide how much computational capacity is
provisioned to execute each program, so as to minimize
the average program execution delay in the edge cloud.
∙ We conduct performance evaluation over both small-
scale computing clusters and large-scale mobile work-
load traces. The results demonstrate that the proposed
hierarchical edge cloud architecture outperforms the flat
edge cloud architecture by more than 25% in terms of
the average delay of program execution.
The rest of this paper is organized as follows. Section
II reviews the related work. Section III provides a brief
overview of the proposed hierarchical edge cloud architecture.
Section IV describes the details of our analytical models.
Section V presents the proposed workload placement problem
in hierarchical edge cloud. Sections VI and VII evaluate our
proposed design. Section VIII concludes the paper.
II. RELATED WORK
Although extensive research studies have been done in the
area of mobile cloud computing, they are limited to reduce
the network latency accessing cloud services, by supporting
mobile code offload via live VM synthesis and migration.
On one hand, efficient VM allocation algorithms have been
developed for geo-distributed clouds with real-time request
arrivals [4], and also support parallel method executions with
multiple VM images [5]. On the other hand, transparent VM
migration allows processing threads to freely migrate between
different machines [1], and also ensures the delay requirement
of VM migration to be satisfied. However, all these schemes
inappropriately assume that the computing resources are un-
limited at cloud servers.Existing research also suggests to deploy small-scale cloud
servers at the edge to reduce the overhead of VM provi-
sioning and resource management. Ha et al. proposes rapid
and precise provisioning of edge clouds under the control of
associated mobile devices [3], so as to support delay-sensitive
applications. These edge cloud servers are also considered
as cloudlets to efficiently utilize the available resources in
a wireless LAN [9]. However, these edge cloud servers are
only organized in a flat architecture, which is incapable of
handling the peak load exceeding the capacity of individual
servers and significantly increases the cloud processing delay.
Comparatively, in this paper we propose a hierarchical edge
cloud architecture which is able to handle such peak loads
more efficiently and promptly.
Data Centers
Knoxville City
Mobile workloadCloud status
Shopping Plaza
University Campus
Mobile Devices
Hierarchical Edge cloud
Core
Edge
Wireless links
Internet backbone
California
Fig. 1: The hierarchical edge cloud architecture
The most related work to our proposed workload placement
algorithm is load balancing in cloud computing systems. Cur-
rent load balancing solutions suggest to distribute incoming
workloads among multiple servers, so as to prevent any server
from becoming a single point of failure or being overloaded.
Maguluri et al. [16] proposes a stochastic model for load
balancing and scheduling in cloud computing clusters, and
they also develop frame-based non-preemptive VM config-
uration policies which is proved to be nearly throughput-
optimal. Chen et al. [17] proposes a resource intensity aware
load balancing (RIAL) method in clouds that migrates VMs
from overloaded physical machines to lightly loaded physical
machines. Zhao et al. [19] proposes a heuristic clustering-
based task deployment approach for load balancing using the
Bayes Theorem. However, these load balancing schemes are
mainly designed for data centers and only aim to optimize
the computation delay of workload execution. In contrast, our
proposed architecture of the hierarchical edge cloud distributes
mobile workloads among different tiers of edge cloud servers,
hence imposing special challenges on the tradeoff between
the computation and communication delays that makes these
traditional schemes hard to be used.
III. OVERVIEW OF THE HIERARCHICAL EDGE CLOUD
The proposed architecture of hierarchical edge cloud is
shown in Figure 1. The servers at the first tier of the hi-
erarchy, which could usually be geo-distributed desktops or
workstations, directly receive workloads from mobile devices
via wireless links. These tier-1 servers, then, are connected
to higher tiers of edge cloud servers and remote data centers
through the Internet backbone.
As a result, servers on different tiers can share run-time in-
formation of mobile workloads with each other, so as to work
in a cooperative manner. If the mobile workloads received by
an edge cloud server exceed its computational capacity, the
excessive amount of workloads will then be further offloaded
to the server at the higher tier. In this way, we can serve
larger amounts of peak loads by provisioning the same amount
of computational capacity in the edge cloud. For example, if
the provisioned capacity 𝐶 is evenly distributed to two tier-1
servers, each server is only able to serve the peak load of 𝐶2 . In
contrast, if we reduce the provisioned capacity of each tier-1
server to 𝐶4 and use the remaining 𝐶
2 to provision another tier-
2 server, each tier-1 server will be able to serve the peak load
up to 34𝐶, as long as the peak loads at two tier-1 servers do not
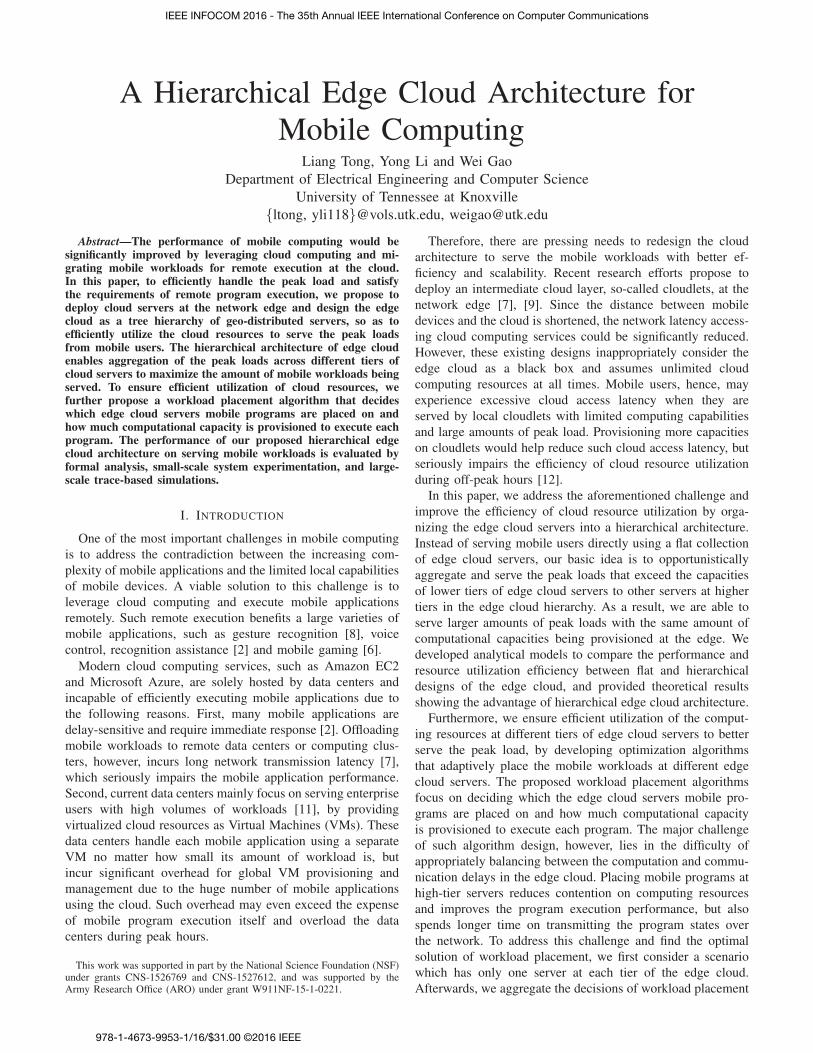
c1 c2 cm
C
. . .
w1 w2 wmMobile
workload
Tier-1 servers
Tier-2 server Peak load
m21
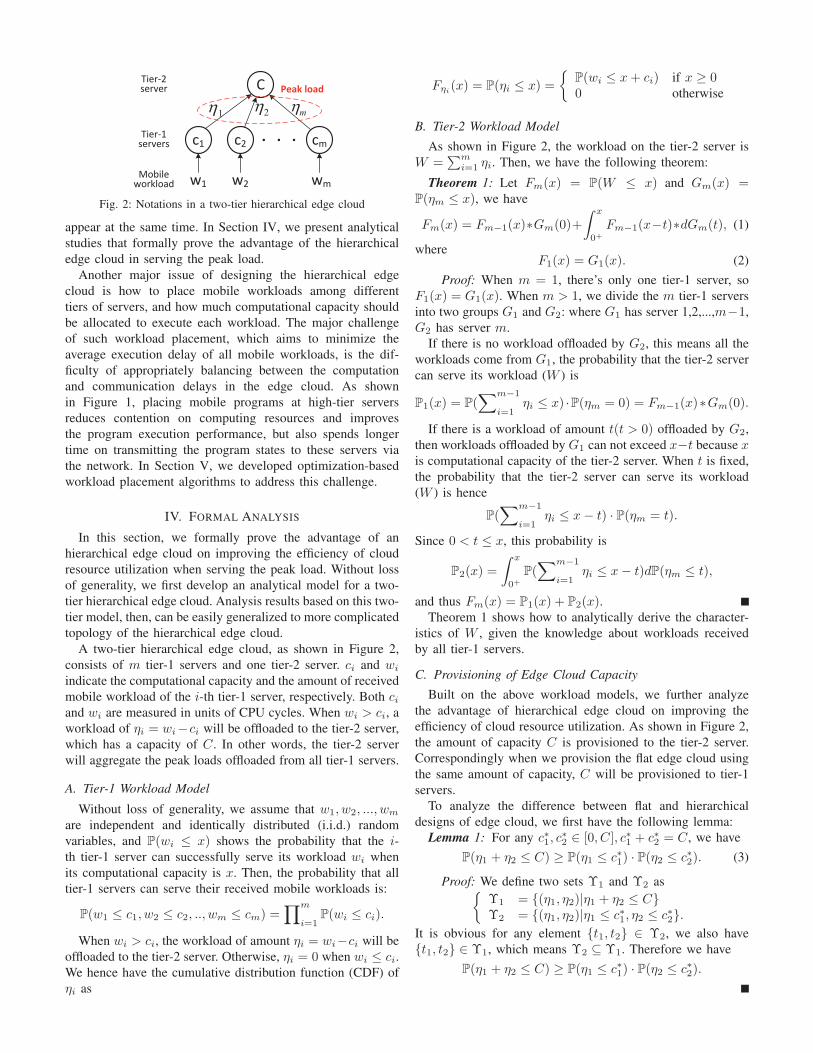
Fig. 2: Notations in a two-tier hierarchical edge cloud
appear at the same time. In Section IV, we present analytical
studies that formally prove the advantage of the hierarchical
edge cloud in serving the peak load.
Another major issue of designing the hierarchical edge
cloud is how to place mobile workloads among different
tiers of servers, and how much computational capacity should
be allocated to execute each workload. The major challenge
of such workload placement, which aims to minimize the
average execution delay of all mobile workloads, is the dif-
ficulty of appropriately balancing between the computation
and communication delays in the edge cloud. As shown
in Figure 1, placing mobile programs at high-tier servers
reduces contention on computing resources and improves
the program execution performance, but also spends longer
time on transmitting the program states to these servers via
the network. In Section V, we developed optimization-based
workload placement algorithms to address this challenge.
IV. FORMAL ANALYSIS
In this section, we formally prove the advantage of an
hierarchical edge cloud on improving the efficiency of cloud
resource utilization when serving the peak load. Without loss
of generality, we first develop an analytical model for a two-
tier hierarchical edge cloud. Analysis results based on this two-
tier model, then, can be easily generalized to more complicated
topology of the hierarchical edge cloud.
A two-tier hierarchical edge cloud, as shown in Figure 2,
consists of 𝑚 tier-1 servers and one tier-2 server. 𝑐𝑖 and 𝑤𝑖
indicate the computational capacity and the amount of received
mobile workload of the 𝑖-th tier-1 server, respectively. Both 𝑐𝑖and 𝑤𝑖 are measured in units of CPU cycles. When 𝑤𝑖 > 𝑐𝑖, a
workload of 𝜂𝑖 = 𝑤𝑖−𝑐𝑖 will be offloaded to the tier-2 server,
which has a capacity of 𝐶. In other words, the tier-2 server
will aggregate the peak loads offloaded from all tier-1 servers.
A. Tier-1 Workload Model
Without loss of generality, we assume that 𝑤1, 𝑤2, ..., 𝑤𝑚
are independent and identically distributed (i.i.d.) random
variables, and ℙ(𝑤𝑖 ≤ 𝑥) shows the probability that the 𝑖-th tier-1 server can successfully serve its workload 𝑤𝑖 when
its computational capacity is 𝑥. Then, the probability that all
tier-1 servers can serve their received mobile workloads is:
ℙ(𝑤1 ≤ 𝑐1, 𝑤2 ≤ 𝑐2, .., 𝑤𝑚 ≤ 𝑐𝑚) =∏𝑚
𝑖=1ℙ(𝑤𝑖 ≤ 𝑐𝑖).
When 𝑤𝑖 > 𝑐𝑖, the workload of amount 𝜂𝑖 = 𝑤𝑖−𝑐𝑖 will be
offloaded to the tier-2 server. Otherwise, 𝜂𝑖 = 0 when 𝑤𝑖 ≤ 𝑐𝑖.We hence have the cumulative distribution function (CDF) of
𝜂𝑖 as
𝐹𝜂𝑖(𝑥) = ℙ(𝜂𝑖 ≤ 𝑥) =
{ℙ(𝑤𝑖 ≤ 𝑥+ 𝑐𝑖) if 𝑥 ≥ 00 otherwise
B. Tier-2 Workload Model
As shown in Figure 2, the workload on the tier-2 server is
𝑊 =∑𝑚
𝑖=1 𝜂𝑖. Then, we have the following theorem:
Theorem 1: Let 𝐹𝑚(𝑥) = ℙ(𝑊 ≤ 𝑥) and 𝐺𝑚(𝑥) =ℙ(𝜂𝑚 ≤ 𝑥), we have
𝐹𝑚(𝑥) = 𝐹𝑚−1(𝑥)∗𝐺𝑚(0)+
∫ 𝑥
0+𝐹𝑚−1(𝑥−𝑡)∗𝑑𝐺𝑚(𝑡), (1)
where𝐹1(𝑥) = 𝐺1(𝑥). (2)
Proof: When 𝑚 = 1, there’s only one tier-1 server, so
𝐹1(𝑥) = 𝐺1(𝑥). When 𝑚 > 1, we divide the 𝑚 tier-1 servers
into two groups 𝐺1 and 𝐺2: where 𝐺1 has server 1,2,...,𝑚−1,
𝐺2 has server 𝑚.
If there is no workload offloaded by 𝐺2, this means all the
workloads come from 𝐺1, the probability that the tier-2 server
can serve its workload (𝑊 ) is
ℙ1(𝑥) = ℙ(∑𝑚−1
𝑖=1𝜂𝑖 ≤ 𝑥) ⋅ℙ(𝜂𝑚 = 0) = 𝐹𝑚−1(𝑥)∗𝐺𝑚(0).
If there is a workload of amount 𝑡(𝑡 > 0) offloaded by 𝐺2,
then workloads offloaded by 𝐺1 can not exceed 𝑥−𝑡 because 𝑥is computational capacity of the tier-2 server. When 𝑡 is fixed,
the probability that the tier-2 server can serve its workload
(𝑊 ) is hence
ℙ(∑𝑚−1
𝑖=1𝜂𝑖 ≤ 𝑥− 𝑡) ⋅ ℙ(𝜂𝑚 = 𝑡).
Since 0 < 𝑡 ≤ 𝑥, this probability is
ℙ2(𝑥) =
∫ 𝑥
0+ℙ(
∑𝑚−1
𝑖=1𝜂𝑖 ≤ 𝑥− 𝑡)𝑑ℙ(𝜂𝑚 ≤ 𝑡),
and thus 𝐹𝑚(𝑥) = ℙ1(𝑥) + ℙ2(𝑥).Theorem 1 shows how to analytically derive the character-
istics of 𝑊 , given the knowledge about workloads received
by all tier-1 servers.
C. Provisioning of Edge Cloud Capacity
Built on the above workload models, we further analyze
the advantage of hierarchical edge cloud on improving the
efficiency of cloud resource utilization. As shown in Figure 2,
the amount of capacity 𝐶 is provisioned to the tier-2 server.
Correspondingly when we provision the flat edge cloud using
the same amount of capacity, 𝐶 will be provisioned to tier-1
servers.
To analyze the difference between flat and hierarchical
designs of edge cloud, we first have the following lemma:
Lemma 1: For any 𝑐∗1, 𝑐∗2 ∈ [0, 𝐶], 𝑐∗1 + 𝑐∗2 = 𝐶, we have
ℙ(𝜂1 + 𝜂2 ≤ 𝐶) ≥ ℙ(𝜂1 ≤ 𝑐∗1) ⋅ ℙ(𝜂2 ≤ 𝑐∗2). (3)
Proof: We define two sets Υ1 and Υ2 as{Υ1 = {(𝜂1, 𝜂2)∣𝜂1 + 𝜂2 ≤ 𝐶}Υ2 = {(𝜂1, 𝜂2)∣𝜂1 ≤ 𝑐∗1, 𝜂2 ≤ 𝑐∗2}.
It is obvious for any element {𝑡1, 𝑡2} ∈ Υ2, we also have
{𝑡1, 𝑡2} ∈ Υ1, which means Υ2 ⊆ Υ1. Therefore we have
ℙ(𝜂1 + 𝜂2 ≤ 𝐶) ≥ ℙ(𝜂1 ≤ 𝑐∗1) ⋅ ℙ(𝜂2 ≤ 𝑐∗2).
Lemma 1 can be further extended to Lemma 2:
Lemma 2: For any 𝑐∗𝑖 ∈ [0, 𝐶](𝑖 = 1, 2, ...,𝑚) and∑𝑚𝑖=1 𝑐
∗𝑖 = 𝐶, we have
ℙ(∑𝑚
𝑖=1𝜂𝑖 ≤ 𝐶) ≥
∏𝑚
𝑖=1ℙ(𝜂𝑖 ≤ 𝑐∗𝑖 ). (4)
Proof: Lemma 2 can be proved by recursively using
Lemma 1:
ℙ(∑𝑚
𝑖=1𝜂𝑖 ≤ 𝐶) ≥ ℙ(
∑𝑚−1
𝑖=1𝜂𝑖 ≤
∑𝑚−1
𝑖=1𝑐∗𝑖 ) ⋅ ℙ(𝜂𝑚 ≤ 𝑐∗𝑚)
≥ ℙ(∑𝑚−2
𝑖=1𝜂𝑖 ≤
∑𝑚−2
𝑖=1𝑐∗𝑖 )
⋅ ℙ(𝜂𝑚−1 ≤ 𝑐∗𝑚−1) ⋅ ℙ(𝜂𝑚 ≤ 𝑐∗𝑚)
≥ ... ≥∏𝑚
𝑖=1ℙ(𝜂𝑖 ≤ 𝑐∗𝑖 ).
Lemma 2 immediately leads to the following theorem:
Theorem 2: For any 𝛼𝑖 ∈ [0, 1](𝑖 = 1, 2, ...𝑚) and∑𝑚𝑖 𝛼𝑖 = 1, we have
ℙ(∑𝑚
𝑖=1𝜂𝑖 ≤ 𝐶) ≥
∏𝑚
𝑖=1ℙ(𝑤𝑖 ≤ 𝑐𝑖 + 𝛼𝑖𝐶) (5)
Proof: Since 𝜂𝑖 = 𝑤𝑖 − 𝑐𝑖, Eq. (5) is a special case of
Eq. (4) by substituting 𝑐∗𝑖 in Eq. (4) with 𝛼𝑖𝐶.
Theorem 2 shows that, with a fixed amount of computational
capacity being provisioned, the hierarchical edge cloud always
has a higher chance to successfully serve the peak loads.
From Lemma 2 and Theorem 2, we further have the following
corollary:
Corollary 1: If we partition {𝜂𝑖}, (𝑖 = 1, 2, ...,𝑚) into
𝑛(𝑛 ≤ 𝑚) mutually exclusive groups {𝑆1, 𝑆2, ..., 𝑆𝑛}, for any
𝑐∗𝑗 ∈ [0, 𝐶] (𝑗 = 1, 2, ..., 𝑛) and∑𝑛
𝑗=1 𝑐∗𝑗 = 𝐶, we have
ℙ(∑𝑚
𝑖=1𝜂𝑖 ≤ 𝐶) ≥
∏𝑛
𝑗=1ℙ(
∑𝑘∈𝑆𝑗
𝜂𝑘 ≤ 𝑐∗𝑗 ) (6)
Corollary 1 indicates that, the efficiency of resource uti-
lization in the two-tier edge cloud will be maximized when
there is only one tier-2 server. When 𝑛 = 𝑚 in Eq. (6),
the number of tier-1 and tier-2 servers are the same, the flat
and hierarchical designs of edge cloud will be equivalent to
each other. Obviously, the above conclusions we obtained from
Theorem 2 and Corollary 1 will also hold for hierarchical edge
clouds with more than two tiers. For example, to construct a
three-tier edge cloud, we could simply use∑𝑚
𝑖=1 𝜂𝑖 as the
workload of a tier-2 server and repeat the above analysis
recursively.
V. OPTIMAL WORKLOAD PLACEMENT
The analytical model in Section IV demonstrates the ad-
vantage of hierarchical edge cloud, but cannot ensure efficient
execution of mobile programs in the cloud, because it greedily
consumes the resources of low-tier servers without appropri-
ately placing mobile workloads to other tiers of the edge cloud.
In this section, we focus on deciding which edge cloud servers
mobile programs are placed on and how much computation
capacity is provisioned to execute each program, so as to
optimize the performance of executing all mobile programs.
Our proposed algorithm builds on existing schemes [5], [18]
partitioning a mobile application. We consider each partition
as a separate computing task and hence enable execution of
a mobile application on multiple edge cloud servers. We first
consider a scenario which has only one server at each tier
of the edge cloud. Afterwards, we aggregate the decisions of
workload placement at different edge cloud servers together.
When there is only one server at each tier of the edge cloud,
we formulate the workload placement problem as a mixed
nonlinear integer programming (MNIP) problem, with integer
variables indicating the locations of workloads being placed
and non-integer variables indicating the amount of capacity
allocated to execute each workload. Then, we solve this MNIP
problem in two steps. First, we fixed the integer variables and
transform the MNIP problem to a convex optimization prob-
lem. Second, based on the non-integer variable being obtained
in the first step, we further solve a combinatorial optimization
problem which only contains the integer variables.
A. Problem Formulation
We first formulate the workload placement problem of edge
cloud which has only one server at each tier. Without loss
of generality, we assume there are 𝑚 computing tasks with
amounts of computations {𝑤1, 𝑤2, ..., 𝑤𝑚} and data sizes of
program states {𝑠1, 𝑠2, ..., 𝑠𝑚}, and 𝑛 servers at the edge cloud
with capacity {𝑐1, 𝑐2, ..., 𝑐𝑛} (i.e., CPU cycles per second). We
formulate the problem of workload placement to be a mixed
integer programming problem as
min𝑓 =∑𝑚
𝑖=1(
𝑤𝑖
𝜆𝛾𝑖
𝑖 𝑐𝛾𝑖
+ (𝛾𝑖 − 1)𝑠𝑖𝐵𝛾𝑖
),
s.t.∑
𝑖∈𝒪𝑗
𝜆𝑗𝑖 = 1, 𝑗 = 1, 2, ..., 𝑛,
(7)
Where 𝛾𝑖 indicates the server that task 𝑖 is placed on, 𝜆𝛾𝑖
𝑖
indicates the percentage of server 𝛾𝑖’s computational capacity
being allocated for task 𝑖, and 𝒪𝑗 denotes the set of comput-
ing tasks placed at server 𝑗. 𝑤𝑖/𝜆𝛾𝑖
𝑖 𝑐𝛾𝑖hence measures the
computation delay of task 𝑖’s execution. On the other hand,
(𝛾𝑖−1) 𝑠𝑖𝐵𝛾𝑖
measures the communication delay of transmitting
program 𝑖’s states to server 𝛾𝑖, which is determined by the
network bandwidth 𝐵𝛾𝑖allocated to 𝛾𝑖.
B. Problem Transformation
The major challenge of solving Eq. (7) is that the value of
𝜆𝛾𝑖
𝑖 depends on the corresponding 𝛾𝑖. Hence, we first study
the optimization problem in Eq. (7) when 𝛾𝑖 is known to each
task 𝑖. We then have the following lemma:
Lemma 3: When each 𝛾𝑖 is fixed, the optimization problem
in Eq. (7) is a convex optimization problem.
Proof: For simplicity we use 𝜆𝑖 to substitute 𝜆𝛾𝑖
𝑖 , then 𝑓in Eq. (7) is a function of variables {𝜆1, 𝜆2, ..., 𝜆𝑚}. For each
pair of (𝜆𝑖, 𝜆𝑗), we have
∂2𝑓
∂𝜆𝑖∂𝜆𝑗=
{12𝑤𝑖𝑐
−1𝛾𝑖
𝜆−3𝑖 , if 𝑖 = 𝑗
0, otherwise(8)
Hence the Hessian matrix H = ( ∂2𝑓∂𝜆𝑖∂𝜆𝑗
)𝑚×𝑚 of 𝑓 is a
symmetric and positive definite matrix. According to [22],
function 𝑓 is strictly convex if its Hessian matrix H is positive
definite for all the variables. Since the constraint in Eq. (7)
is linear, the optimization problem in Eq. (7) is a convex
optimization problem.
Lemma 3 can be further extended to Theorem 3:
Theorem 3: When each 𝛾𝑖 is fixed, the optimal value of 𝑓is as follows:
𝑓min =∑𝑛
𝑗=1
[ (∑𝑖∈𝒪𝑗
√𝑤𝑖)
2
𝑐𝑗+∑
𝑖∈𝒪𝑗
(𝑗 − 1)𝑠𝑖𝐵𝑗
], (9)
The corresponding optimal solution to Eq. (7) is
𝜆∗𝑖 =
√𝑤𝑖∑
𝑖∈𝒪𝛾𝑖
√𝑤𝑖
(10)
Proof: Based on the convexity of the optimization prob-
lem in Eq. (7), the corresponding Lagrangian of 𝑓 is:
𝐿(𝝀,𝝁) =∑𝑚
𝑖=1(
𝑤𝑖
𝜆𝛾𝑖
𝑖 𝑐𝛾𝑖
+ (𝛾𝑖 − 1)𝑠𝑖𝐵𝛾𝑖
)
−∑𝑛
𝑗=1𝜇𝑗(
∑𝑘∈𝒪𝛾𝑖
𝜆𝑘 − 1).(11)
By solving the KKT condition [22] of Eq. (11), we can
obtain the optimal solution 𝜆∗𝑖 (𝑖 = 1, 2...,𝑚) and the corre-
sponding optimal value 𝑓min.
Theorem 3 shows that, when the placement for each work-
load is fixed, the corresponding capacity provisioning problem
for these workloads is deterministic. Hence, we transform the
workload placement problem to be a combinatorial optimiza-
tion problem. For each possible workload placement, we can
solve the corresponding convex optimization problem based
on Theorem 3.
C. Design of Workload Placement Algorithm
Based on the above problem transformation, we then de-
velop workload placement algorithms to determine the optimal
values of {𝛾𝑖}. When there are 𝑚 computing tasks and
𝑛 servers, the time complexity to exhaustively search the
solution space is 𝑂(𝑛𝑚). To further decrease the searching
complexity and obtain the optimal solution, we propose to
adopt the branch-and-bound approach. The basic idea of the
branch-and-bound approach is to partition a given problem
into a number of subproblems. This process of partitioning
is usually called branching and its purpose is to establish
subproblems that are easier to solve than the original problem
because of their smaller size or more amenable structure. The
subproblems usually constitute a search tree, where the non-
leaf nodes represent subproblems, the leaves indicate the end
of a branch and the edges represent decisions we made in each
subproblem.
Without loss of generality, we assume that the workloads
{𝑤1, 𝑤2, ..., 𝑤𝑚} are sequentially determined to be placed.
Therefore, the subproblem of the workload placement problem
is: given the workload placement of {𝑤𝑖}(𝑖 < 𝑘), which server
should 𝑤𝑘 be placed on. Based on this subproblem definition,
we have the following lemma:
Lemma 4: Letting 𝑓𝑘 indicate the total amount of delays
for the 𝑘 tasks having been branched, the lower bound on the
total amount of delays for the remaining 𝑚− 𝑘 tasks is:
𝑢𝑘 = 𝑓𝑘 +∑𝑚
𝑖=𝑘+1
[min
1≤𝑗≤𝑛
{𝑤𝑖
𝑐𝑗+ (𝑗 − 1)
𝑠𝑖𝐵𝑗
}]. (12)
Proof: In Eq. (12) all the remaining 𝑚 − 𝑘 tasks are
provisioned with 100% capacity of a server, therefore 𝑢𝑘
provides a lower bound on the total amount of delays for the
remaining 𝑚− 𝑘 tasks.
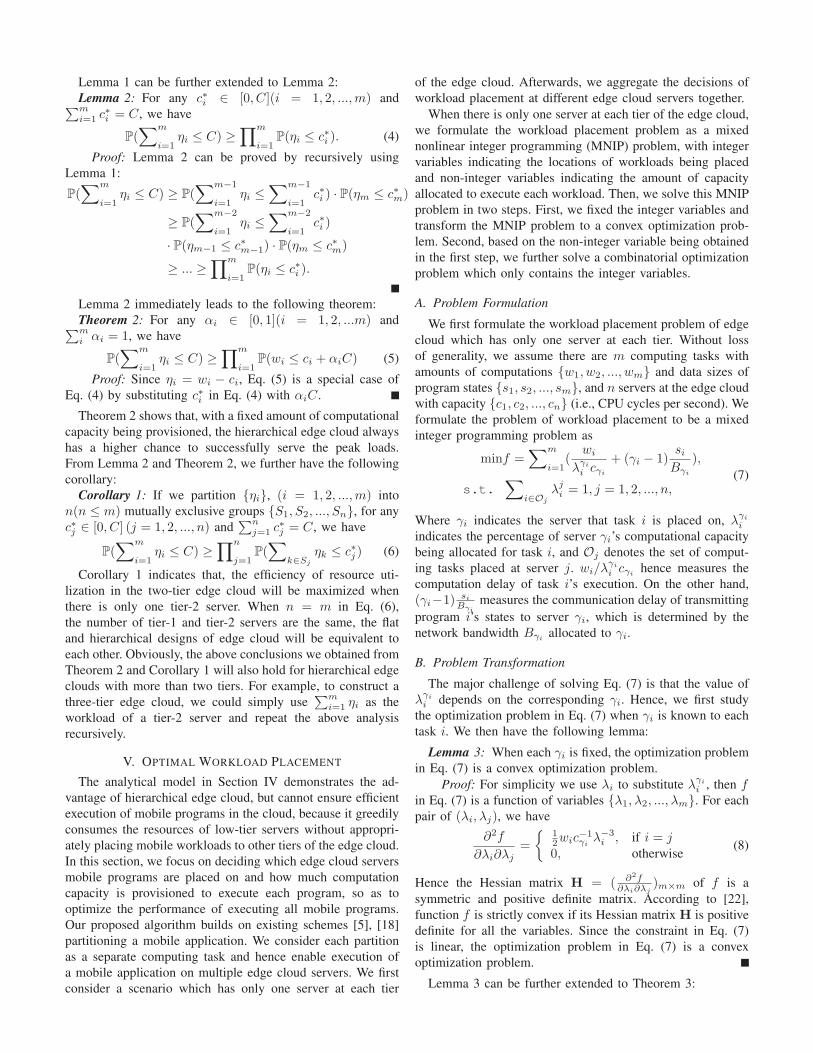
Fig. 3: The branch and boundmethod
F
E
DC
A B
Fig. 4: Aggregation of optimalresults
Based on Lemma 4, the branching process is a depth-first
search over subproblems placing subsets of workloads, with
the ones of the smallest lower bounds being searched first.
Each time when a leaf node in the search tree is reached, all
other branches with larger values of lower bounds are pruned.
The optimal solution will be found until all the leaf nodes
have been either searched or pruned.
We further illustrate this branching process using an exam-
ple in Figure 3 where 𝑚 = 3 and 𝑛 = 2. {𝑤1, 𝑤2, 𝑤3} ={3, 4, 5},{𝑐1, 𝑐2} = {1, 2}, and the communication delay
between tier-1 and tier-2 servers for the 3 tasks are {2, 3, 3}.
The number by the side of each node indicates the lower bound
of this subproblem computed from Eq. (12) and the number
on each edge indicates the decision of workload placement.
For example, when task 1 is placed on tier-1, the lower bound
of total delay on node 2 is 31 +
41 +
51 = 12, when it is placed
on tier-2, the lower bound on node 3 is 32 +2+ 4
1 +51 = 12.5,
since 12 < 12.5, we further branch the next subproblem until
we reach a leave node being labeled as red in Figure 3. Then,
the leftmost and rightmost branches are automatically pruned
because their lower bound is larger than 16.9. Therefore, the
optimal solution of this example is {2, 1, 2} with the total
delay 16.9.
Algorithm 1: The simulated annealing process
Randomly generate an initial solution x𝑜𝑙𝑑.1
𝑇 ← 𝑇𝑚𝑎𝑥2
while 𝑇 > 𝑇𝑚𝑖𝑛 do3
Generate a new solution x𝑛𝑒𝑤4
Δ𝑑 = 𝑓(x𝑛𝑒𝑤)− 𝑓(x𝑜𝑙𝑑)5
if Δ𝑑 < 0 then6
x𝑜𝑙𝑑 ← x𝑛𝑒𝑤7
end8
else if 𝑅𝑎𝑛𝑑(0, 1) < 𝑒𝑥𝑝(−Δ𝑑𝑇 ) then9
x𝑜𝑙𝑑 ← x𝑛𝑒𝑤10
end11
𝑇 ← 𝛼 ⋅ 𝑇12
end13
D. Aggregation of Optimization ResultsAs shown in Figure 4, multiple servers may be deployed at
each tier of the edge cloud. We will aggregate the solutions
to workload placement over different servers, to ensure the
global optimality of workload placement. Our basic idea is to
allocate the computational capacity of an edge cloud server
on demand, when it receives mobile workloads from multiple
low-tier servers. For example in Figure 4, server 𝐸 allocates
its capacity when it receives the workloads from servers 𝐶and 𝐷. Since there is one and only one optimal solution for
a branch-and-bound searching process, the optimal allocation
at a server that minimizes the cumulative delay of executing
mobile programs is also unique.
The key challenge of aggregating the optimization results is
how to allocate computational capacity of a higher-tier server
to each branch of the edge cloud. Let x denotes the capacity
allocation vector of a higher-tier server to its children in the
edge cloud hierarchy, a straightforward solution to find out the
optimal allocation is numerical iteration. However, traditional
methods such as the Newton’s method cannot ensure global
optimality due to non-monotonicity of delay variation. Instead,
we adopt the Simulated Annealing (SA) algorithm [23].
The SA process is described in Algorithm 1. In each
iteration, we generate a new iteration state x𝑛𝑒𝑤 from the
previous state x𝑜𝑙𝑑. The difference of total delay, denoted
as Δ𝑑, is computed by solving smaller-scale optimization
problems in Eq. (7) over different sets of low-tier servers.
x𝑛𝑒𝑤 will be immediately accepted if Δ𝑑 < 0. Otherwise,
we have a probability 𝑒𝑥𝑝(−Δ𝑑𝑇 ) to accept x𝑛𝑒𝑤 , where 𝑇
is the simulated temperature and decreases in each step of
the iteration by a cooling parameter 𝛼 (0 < 𝛼 < 1). The
length of the iterations in SA is determined by the initial
temperature 𝑇𝑚𝑎𝑥, the terminating temperature 𝑇𝑚𝑖𝑛 and the
cooling parameter 𝛼. At the beginning 𝑇 equals to 𝑇𝑚𝑎𝑥.
𝑇 then decreases in each iteration, when 𝑇 = 𝑇𝑚𝑖𝑛 the
SA iterations terminate. Consequently, the SA process has
no bounded time complexity. Instead, its time complexity is
determined by the cooling parameter 𝛼, whose impact will be
studied via extensive experiments in Section VII.
VI. SYSTEM EXPERIMENTATION
In this section, we implement the proposed hierarchical edge
cloud architecture over a small-scale computing cluster and
evaluate its performance, and compare the performance of
hierarchical edge cloud with that of the flat edge cloud in
the following settings. Without loss of generality, we measure
the cloud performance using the average completion time of
computing tasks. The smaller the completion time is, the larger
amount of workload can be served by the edge cloud in the unit
amount of time, indicating a larger amount of computational
capacity being provided by the edge cloud.
∙ Workload rate: Each tier-1 server receives a number of
new computing tasks every 5 seconds. The number of
tasks, which indicates the workload rate, is determined
every time following the same Poisson distribution.
∙ Provisioned capacity: The computational capacity provi-
sioned to an edge cloud server is measured by the number
of computing threads running concurrently on the server.
A. System Setup
We use multiple Dell OptiPlex 9010 desktop computers
as edge cloud servers, and each server has an Intel i5-
[email protected] CPU and 8GB RAM. We use scale-invariant
feature transform (SIFT) of images as computation tasks being
submitted to edge cloud servers. SIFT is an algorithm in
computer vision to detect and describe local features in images
[24]. To study the usage of computational capacity of running
this algorithm on servers, we create different numbers of
The number of concurrent SIFT threads0 2 4 6 8 10Th
e nu
mbe
r of i
mag
es p
roce
ssed
per
min
0
50
100
150
200
250
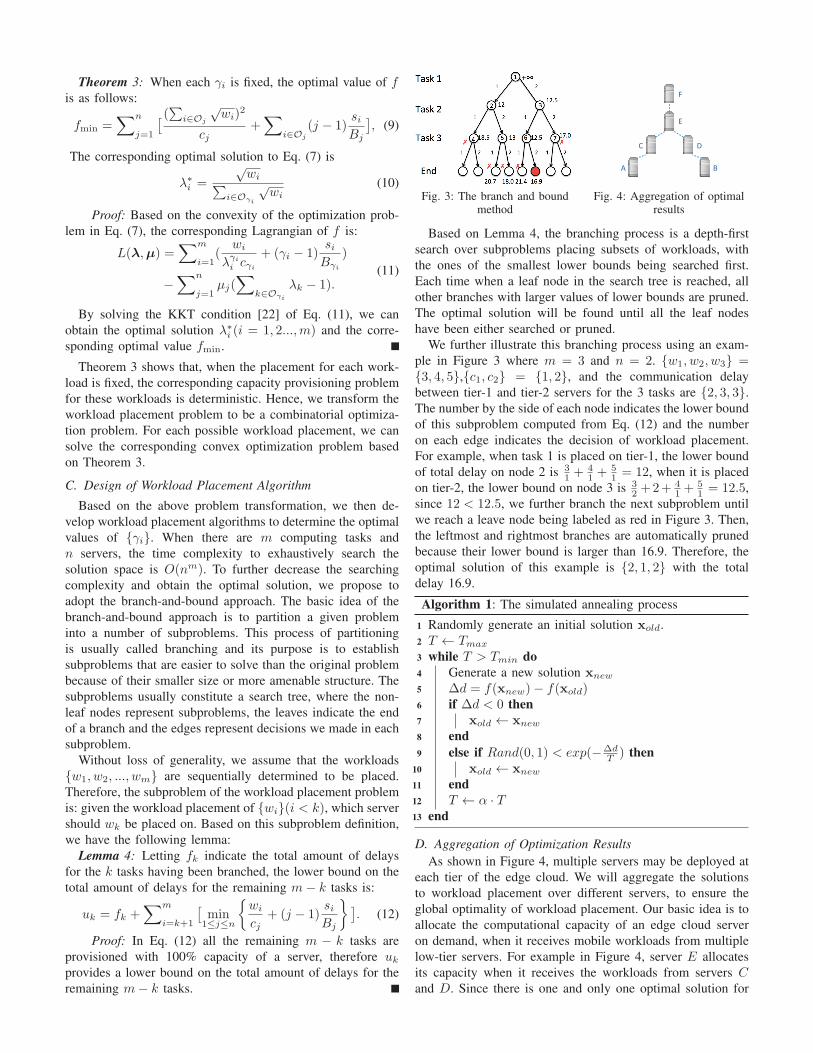
Fig. 5: Computational capacityof a server for SIFT
Fig. 6: Implementation ofhierarchical edge cloud
Workload rate (images per 5 seconds)1 2 3 4 5
Ave
. com
plet
ion
time
(s)
1
1.5
2
2.5Flat edge cloudHierarchical edge cloud
(a) Provisioned capacity = 2
Workload rate (images per 5 seconds)1 2 3 4 5
Ave
. com
plet
ion
time
(s)
1
1.2
1.4
1.6
1.8
2Flat edge cloudHierarchical edge cloud
(b) Provisioned capacity = 4
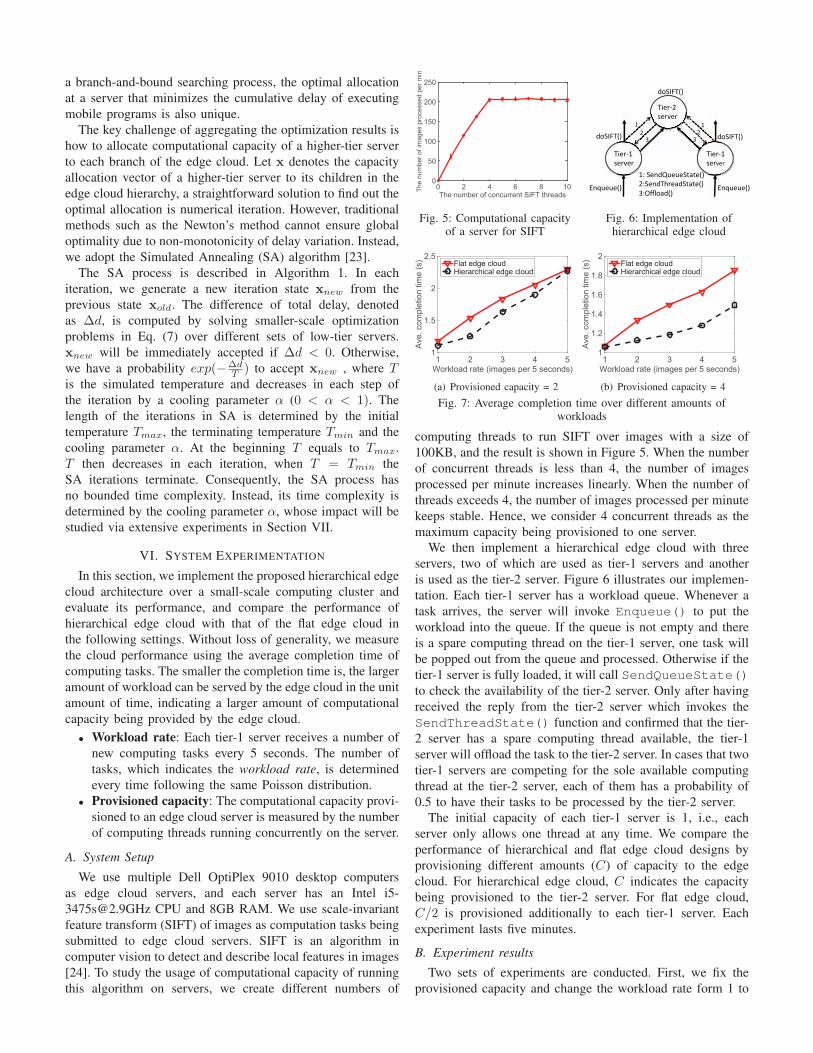
Fig. 7: Average completion time over different amounts ofworkloads
computing threads to run SIFT over images with a size of
100KB, and the result is shown in Figure 5. When the number
of concurrent threads is less than 4, the number of images
processed per minute increases linearly. When the number of
threads exceeds 4, the number of images processed per minute
keeps stable. Hence, we consider 4 concurrent threads as the
maximum capacity being provisioned to one server.
We then implement a hierarchical edge cloud with three
servers, two of which are used as tier-1 servers and another
is used as the tier-2 server. Figure 6 illustrates our implemen-
tation. Each tier-1 server has a workload queue. Whenever a
task arrives, the server will invoke Enqueue() to put the
workload into the queue. If the queue is not empty and there
is a spare computing thread on the tier-1 server, one task will
be popped out from the queue and processed. Otherwise if the
tier-1 server is fully loaded, it will call SendQueueState()to check the availability of the tier-2 server. Only after having
received the reply from the tier-2 server which invokes the
SendThreadState() function and confirmed that the tier-
2 server has a spare computing thread available, the tier-1
server will offload the task to the tier-2 server. In cases that two
tier-1 servers are competing for the sole available computing
thread at the tier-2 server, each of them has a probability of
0.5 to have their tasks to be processed by the tier-2 server.
The initial capacity of each tier-1 server is 1, i.e., each
server only allows one thread at any time. We compare the
performance of hierarchical and flat edge cloud designs by
provisioning different amounts (𝐶) of capacity to the edge
cloud. For hierarchical edge cloud, 𝐶 indicates the capacity
being provisioned to the tier-2 server. For flat edge cloud,
𝐶/2 is provisioned additionally to each tier-1 server. Each
experiment lasts five minutes.
B. Experiment results
Two sets of experiments are conducted. First, we fix the
provisioned capacity and change the workload rate form 1 to
Provisoned capacity (threads)2 3 4
Ave
. com
plet
ion
time
(s)
0
0.2
0.4
0.6
0.8
1
1.2
Hierarchical edge cloudFlat edge cloud
(a) Workload rate = 1
Provisioned cpacity (threads)2 3 4
Ave
. com
plet
ion
time
(s)
0
0.5
1
1.5
2
2.5
Hierarchical edge cloudFlat edge cloud
(b) Workload rate = 4
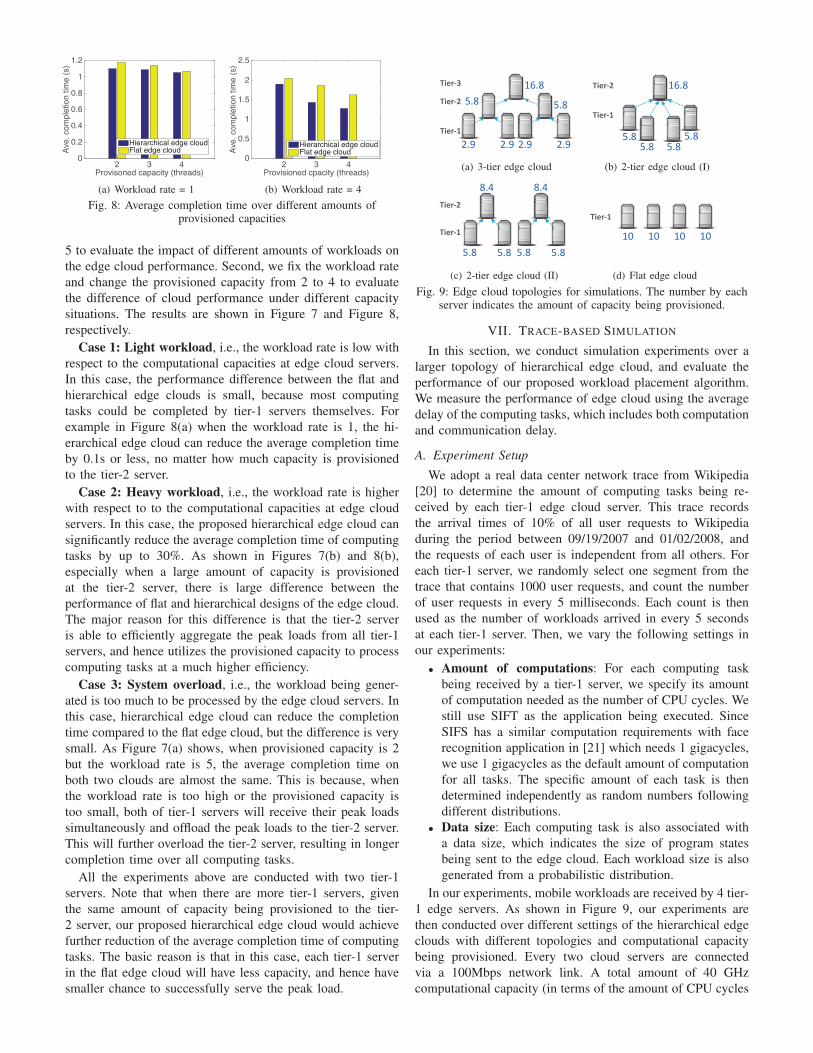
Fig. 8: Average completion time over different amounts ofprovisioned capacities
5 to evaluate the impact of different amounts of workloads on
the edge cloud performance. Second, we fix the workload rate
and change the provisioned capacity from 2 to 4 to evaluate
the difference of cloud performance under different capacity
situations. The results are shown in Figure 7 and Figure 8,
respectively.
Case 1: Light workload, i.e., the workload rate is low with
respect to the computational capacities at edge cloud servers.
In this case, the performance difference between the flat and
hierarchical edge clouds is small, because most computing
tasks could be completed by tier-1 servers themselves. For
example in Figure 8(a) when the workload rate is 1, the hi-
erarchical edge cloud can reduce the average completion time
by 0.1s or less, no matter how much capacity is provisioned
to the tier-2 server.
Case 2: Heavy workload, i.e., the workload rate is higher
with respect to to the computational capacities at edge cloud
servers. In this case, the proposed hierarchical edge cloud can
significantly reduce the average completion time of computing
tasks by up to 30%. As shown in Figures 7(b) and 8(b),
especially when a large amount of capacity is provisioned
at the tier-2 server, there is large difference between the
performance of flat and hierarchical designs of the edge cloud.
The major reason for this difference is that the tier-2 server
is able to efficiently aggregate the peak loads from all tier-1
servers, and hence utilizes the provisioned capacity to process
computing tasks at a much higher efficiency.
Case 3: System overload, i.e., the workload being gener-
ated is too much to be processed by the edge cloud servers. In
this case, hierarchical edge cloud can reduce the completion
time compared to the flat edge cloud, but the difference is very
small. As Figure 7(a) shows, when provisioned capacity is 2
but the workload rate is 5, the average completion time on
both two clouds are almost the same. This is because, when
the workload rate is too high or the provisioned capacity is
too small, both of tier-1 servers will receive their peak loads
simultaneously and offload the peak loads to the tier-2 server.
This will further overload the tier-2 server, resulting in longer
completion time over all computing tasks.
All the experiments above are conducted with two tier-1
servers. Note that when there are more tier-1 servers, given
the same amount of capacity being provisioned to the tier-
2 server, our proposed hierarchical edge cloud would achieve
further reduction of the average completion time of computing
tasks. The basic reason is that in this case, each tier-1 server
in the flat edge cloud will have less capacity, and hence have
smaller chance to successfully serve the peak load.
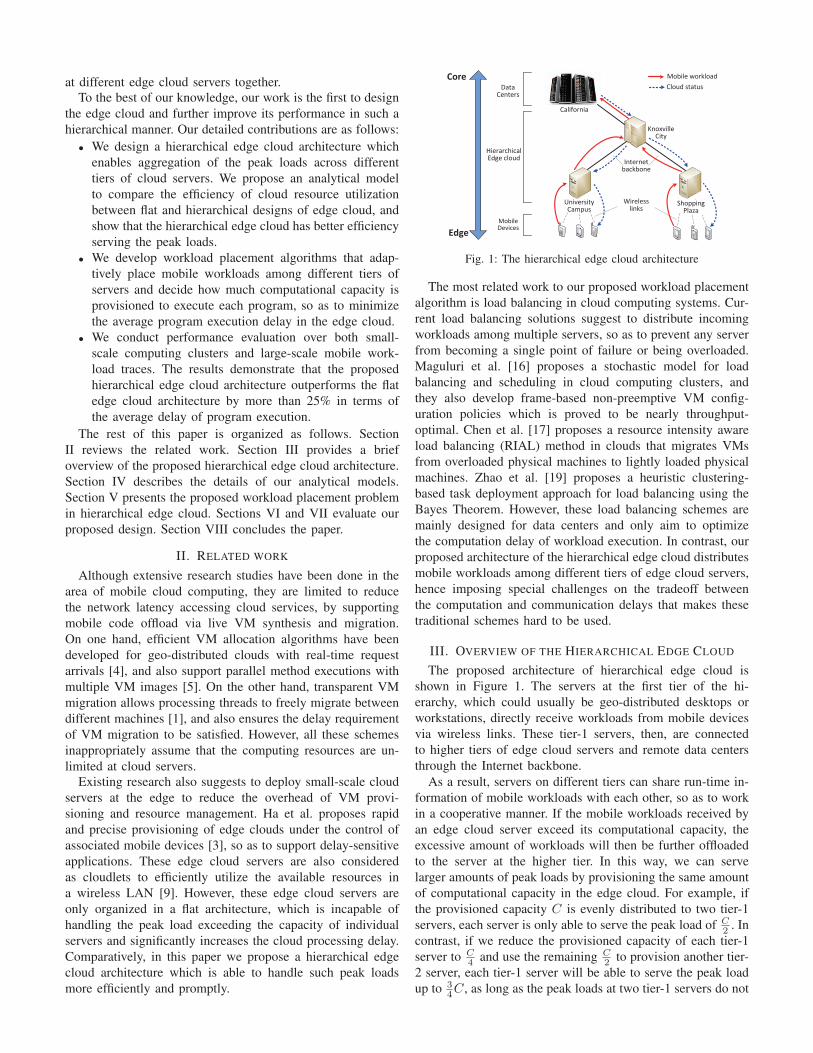
Tier-2
Tier-3
Tier-1
16.8
5.85.8
2.9 2.9 2.9 2.9
(a) 3-tier edge cloud
Tier-2
Tier-1
16.8
5.85.85.8 5.8
(b) 2-tier edge cloud (I)
Tier-2
Tier-1
5.8 5.8
8.4
5.8 5.8
8.4
(c) 2-tier edge cloud (II)
Tier-1
10 10 10 10
(d) Flat edge cloud
Fig. 9: Edge cloud topologies for simulations. The number by eachserver indicates the amount of capacity being provisioned.
VII. TRACE-BASED SIMULATION
In this section, we conduct simulation experiments over a
larger topology of hierarchical edge cloud, and evaluate the
performance of our proposed workload placement algorithm.
We measure the performance of edge cloud using the average
delay of the computing tasks, which includes both computation
and communication delay.
A. Experiment Setup
We adopt a real data center network trace from Wikipedia
[20] to determine the amount of computing tasks being re-
ceived by each tier-1 edge cloud server. This trace records
the arrival times of 10% of all user requests to Wikipedia
during the period between 09/19/2007 and 01/02/2008, and
the requests of each user is independent from all others. For
each tier-1 server, we randomly select one segment from the
trace that contains 1000 user requests, and count the number
of user requests in every 5 milliseconds. Each count is then
used as the number of workloads arrived in every 5 seconds
at each tier-1 server. Then, we vary the following settings in
our experiments:
∙ Amount of computations: For each computing task
being received by a tier-1 server, we specify its amount
of computation needed as the number of CPU cycles. We
still use SIFT as the application being executed. Since
SIFS has a similar computation requirements with face
recognition application in [21] which needs 1 gigacycles,
we use 1 gigacycles as the default amount of computation
for all tasks. The specific amount of each task is then
determined independently as random numbers following
different distributions.
∙ Data size: Each computing task is also associated with
a data size, which indicates the size of program states
being sent to the edge cloud. Each workload size is also
generated from a probabilistic distribution.
In our experiments, mobile workloads are received by 4 tier-
1 edge servers. As shown in Figure 9, our experiments are
then conducted over different settings of the hierarchical edge
clouds with different topologies and computational capacity
being provisioned. Every two cloud servers are connected
via a 100Mbps network link. A total amount of 40 GHz
computational capacity (in terms of the amount of CPU cycles
Average computations per task (gigacycles)0.5 1 1.5 2
Ave
rage
del
ay (
seco
nds)
0
0.5
1
1.5
2
2.5
33-tier Edge Cloud2-tier Edge Cloud(I)2-tier Edge Cloud(II)Flat edge cloud
(a) Uniform distribution (variance = 0.08)
Average computations per task (gigacycles)0.5 1 1.5 2
Ave
rage
del
ay (
seco
nds)
0
0.5
1
1.5
2
2.5
3
3.53-tier Edge Cloud2-tier Edge Cloud(I)2-tier Edge Cloud(II)Flat edge cloud
(b) Normal distribution (variance = 0.1)
Scale parameter (gigacycles)0.5 1 1.5 2
Ave
rage
del
ay (
seco
nds)
0
1
2
3
4
53-tier Edge Cloud2-tier Edge Cloud(I)2-tier Edge Cloud(II)Flat edge cloud
(c) Pareto distribution (shape parameter = 3)
Fig. 10: Average delay over different amounts of computations in workloads
Average data size (MB)2.5 5 7.5 10
Ave
rage
del
ay (
seco
nds)
0
0.5
1
1.5
3-tier Edge Cloud2-tier Edge Cloud(I)2-tier Edge Cloud(II)Flat edge cloud
(a) Uniform distribution (variance = 0.33)
Average data size (MB)2.5 5 7.5 10
Ave
rage
del
ay (
seco
nds)
0
0.5
1
1.5
3-tier Edge Cloud2-tier Edge Cloud(I)2-tier Edge Cloud(II)Flat edge cloud
(b) Normal distribution (variance = 1)
Parameter scale (MB)2.5 5 7.5 10
Ave
rage
del
ay (
seco
nds)
0
0.5
1
1.5
3-tier Edge Cloud2-tier Edge Cloud(I)2-tier Edge Cloud(II)Flat edge cloud
(c) Pareto distribution (shape parameter = 3)
Fig. 11: Average delay over different data sizes of workloads
per second) is provisioned. Particularly, in the 3-tier edge
cloud, each tier-1 server is provisioned with 2.9 GHz capacity,
which is the same with the CPU frequency of servers we
use in hardware experiments. Thus, if a computing task with
1 gigacycles is offloaded to a tier-1 server, its execution
time will be 1/2.9 seconds. In other topologies with less
numbers of cloud tiers, we enlarge the capacity of tier-1
servers accordingly.
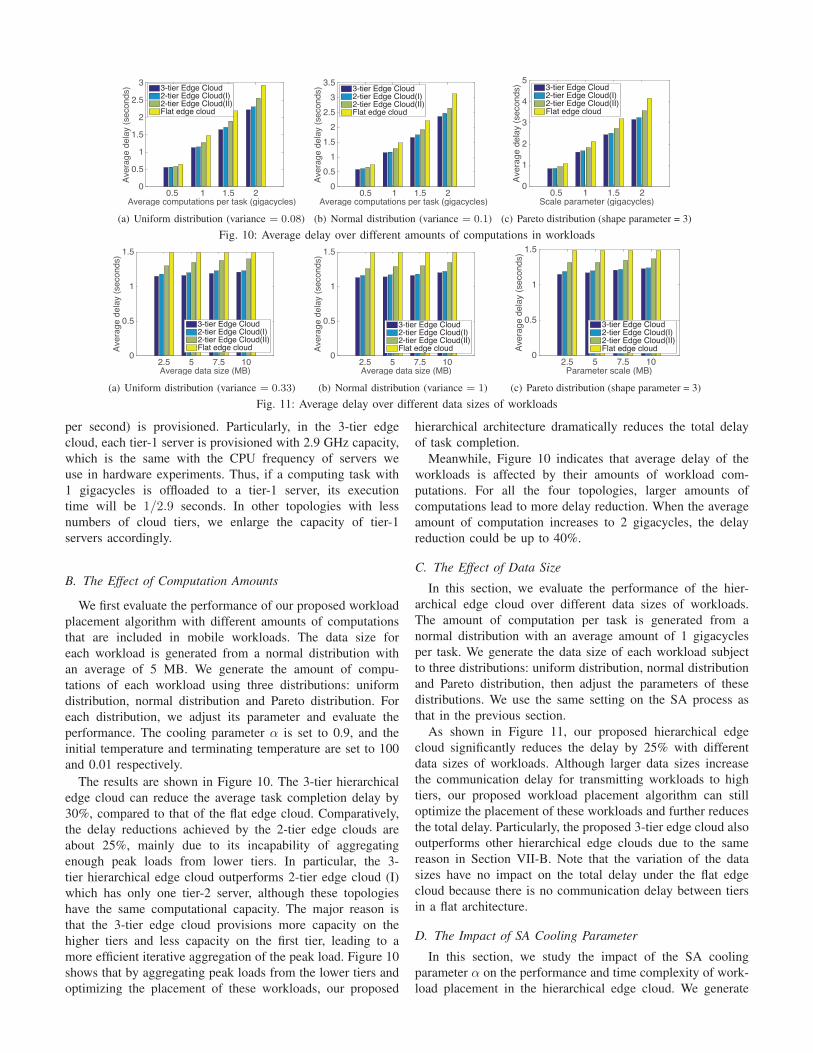
B. The Effect of Computation Amounts
We first evaluate the performance of our proposed workload
placement algorithm with different amounts of computations
that are included in mobile workloads. The data size for
each workload is generated from a normal distribution with
an average of 5 MB. We generate the amount of compu-
tations of each workload using three distributions: uniform
distribution, normal distribution and Pareto distribution. For
each distribution, we adjust its parameter and evaluate the
performance. The cooling parameter 𝛼 is set to 0.9, and the
initial temperature and terminating temperature are set to 100
and 0.01 respectively.
The results are shown in Figure 10. The 3-tier hierarchical
edge cloud can reduce the average task completion delay by
30%, compared to that of the flat edge cloud. Comparatively,
the delay reductions achieved by the 2-tier edge clouds are
about 25%, mainly due to its incapability of aggregating
enough peak loads from lower tiers. In particular, the 3-
tier hierarchical edge cloud outperforms 2-tier edge cloud (I)
which has only one tier-2 server, although these topologies
have the same computational capacity. The major reason is
that the 3-tier edge cloud provisions more capacity on the
higher tiers and less capacity on the first tier, leading to a
more efficient iterative aggregation of the peak load. Figure 10
shows that by aggregating peak loads from the lower tiers and
optimizing the placement of these workloads, our proposed
hierarchical architecture dramatically reduces the total delay
of task completion.
Meanwhile, Figure 10 indicates that average delay of the
workloads is affected by their amounts of workload com-
putations. For all the four topologies, larger amounts of
computations lead to more delay reduction. When the average
amount of computation increases to 2 gigacycles, the delay
reduction could be up to 40%.
C. The Effect of Data Size
In this section, we evaluate the performance of the hier-
archical edge cloud over different data sizes of workloads.
The amount of computation per task is generated from a
normal distribution with an average amount of 1 gigacycles
per task. We generate the data size of each workload subject
to three distributions: uniform distribution, normal distribution
and Pareto distribution, then adjust the parameters of these
distributions. We use the same setting on the SA process as
that in the previous section.
As shown in Figure 11, our proposed hierarchical edge
cloud significantly reduces the delay by 25% with different
data sizes of workloads. Although larger data sizes increase
the communication delay for transmitting workloads to high
tiers, our proposed workload placement algorithm can still
optimize the placement of these workloads and further reduces
the total delay. Particularly, the proposed 3-tier edge cloud also
outperforms other hierarchical edge clouds due to the same
reason in Section VII-B. Note that the variation of the data
sizes have no impact on the total delay under the flat edge
cloud because there is no communication delay between tiers
in a flat architecture.
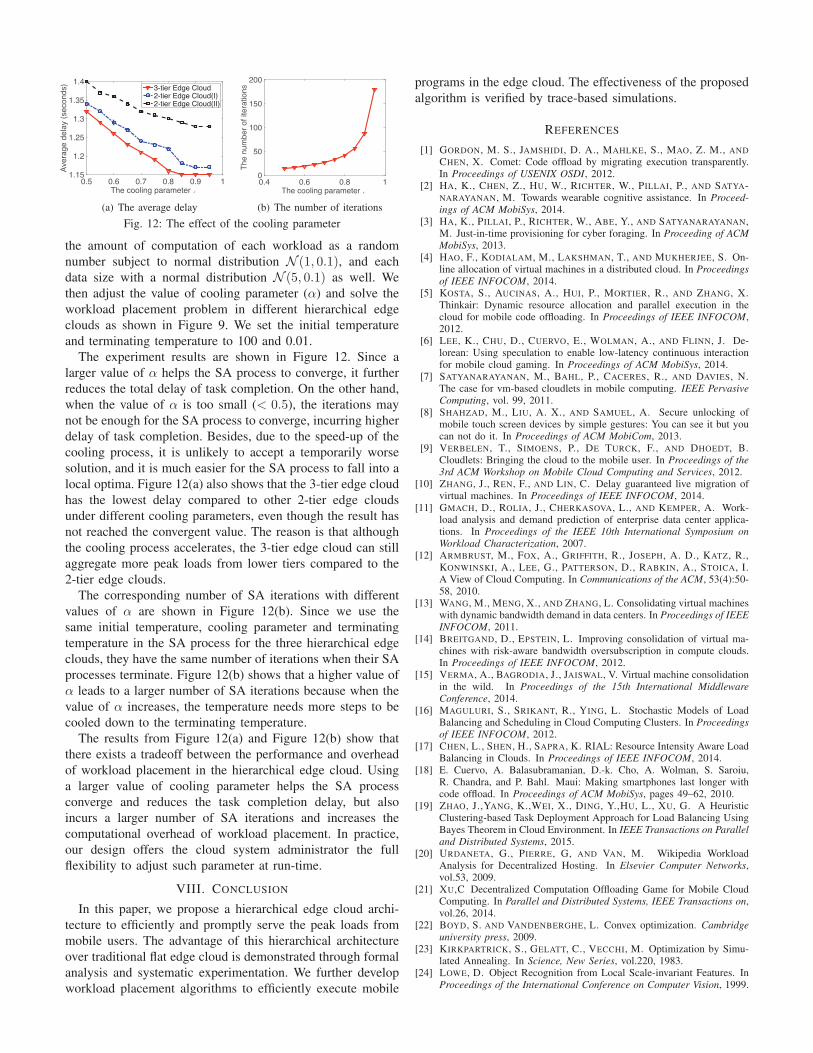
D. The Impact of SA Cooling Parameter
In this section, we study the impact of the SA cooling
parameter 𝛼 on the performance and time complexity of work-
load placement in the hierarchical edge cloud. We generate
The cooling parameter 0.5 0.6 0.7 0.8 0.9 1
Ave
rage
del
ay (
seco
nds)
1.15
1.2
1.25
1.3
1.35
1.43-tier Edge Cloud2-tier Edge Cloud(I)2-tier Edge Cloud(II)
(a) The average delay
The cooling parameter 0.4 0.6 0.8 1
The
num
ber
of it
erat
ions
0
50
100
150
200
(b) The number of iterations
Fig. 12: The effect of the cooling parameter
the amount of computation of each workload as a random
number subject to normal distribution 𝒩 (1, 0.1), and each
data size with a normal distribution 𝒩 (5, 0.1) as well. We
then adjust the value of cooling parameter (𝛼) and solve the
workload placement problem in different hierarchical edge
clouds as shown in Figure 9. We set the initial temperature
and terminating temperature to 100 and 0.01.
The experiment results are shown in Figure 12. Since a
larger value of 𝛼 helps the SA process to converge, it further
reduces the total delay of task completion. On the other hand,
when the value of 𝛼 is too small (< 0.5), the iterations may
not be enough for the SA process to converge, incurring higher
delay of task completion. Besides, due to the speed-up of the
cooling process, it is unlikely to accept a temporarily worse
solution, and it is much easier for the SA process to fall into a
local optima. Figure 12(a) also shows that the 3-tier edge cloud
has the lowest delay compared to other 2-tier edge clouds
under different cooling parameters, even though the result has
not reached the convergent value. The reason is that although
the cooling process accelerates, the 3-tier edge cloud can still
aggregate more peak loads from lower tiers compared to the
2-tier edge clouds.
The corresponding number of SA iterations with different
values of 𝛼 are shown in Figure 12(b). Since we use the
same initial temperature, cooling parameter and terminating
temperature in the SA process for the three hierarchical edge
clouds, they have the same number of iterations when their SA
processes terminate. Figure 12(b) shows that a higher value of
𝛼 leads to a larger number of SA iterations because when the
value of 𝛼 increases, the temperature needs more steps to be
cooled down to the terminating temperature.
The results from Figure 12(a) and Figure 12(b) show that
there exists a tradeoff between the performance and overhead
of workload placement in the hierarchical edge cloud. Using
a larger value of cooling parameter helps the SA process
converge and reduces the task completion delay, but also
incurs a larger number of SA iterations and increases the
computational overhead of workload placement. In practice,
our design offers the cloud system administrator the full
flexibility to adjust such parameter at run-time.
VIII. CONCLUSION
In this paper, we propose a hierarchical edge cloud archi-
tecture to efficiently and promptly serve the peak loads from
mobile users. The advantage of this hierarchical architecture
over traditional flat edge cloud is demonstrated through formal
analysis and systematic experimentation. We further develop
workload placement algorithms to efficiently execute mobile
programs in the edge cloud. The effectiveness of the proposed
algorithm is verified by trace-based simulations.
REFERENCES
[1] GORDON, M. S., JAMSHIDI, D. A., MAHLKE, S., MAO, Z. M., AND
CHEN, X. Comet: Code offload by migrating execution transparently.In Proceedings of USENIX OSDI, 2012.
[2] HA, K., CHEN, Z., HU, W., RICHTER, W., PILLAI, P., AND SATYA-NARAYANAN, M. Towards wearable cognitive assistance. In Proceed-ings of ACM MobiSys, 2014.
[3] HA, K., PILLAI, P., RICHTER, W., ABE, Y., AND SATYANARAYANAN,M. Just-in-time provisioning for cyber foraging. In Proceeding of ACMMobiSys, 2013.
[4] HAO, F., KODIALAM, M., LAKSHMAN, T., AND MUKHERJEE, S. On-line allocation of virtual machines in a distributed cloud. In Proceedingsof IEEE INFOCOM, 2014.
[5] KOSTA, S., AUCINAS, A., HUI, P., MORTIER, R., AND ZHANG, X.Thinkair: Dynamic resource allocation and parallel execution in thecloud for mobile code offloading. In Proceedings of IEEE INFOCOM,2012.
[6] LEE, K., CHU, D., CUERVO, E., WOLMAN, A., AND FLINN, J. De-lorean: Using speculation to enable low-latency continuous interactionfor mobile cloud gaming. In Proceedings of ACM MobiSys, 2014.
[7] SATYANARAYANAN, M., BAHL, P., CACERES, R., AND DAVIES, N.The case for vm-based cloudlets in mobile computing. IEEE PervasiveComputing, vol. 99, 2011.
[8] SHAHZAD, M., LIU, A. X., AND SAMUEL, A. Secure unlocking ofmobile touch screen devices by simple gestures: You can see it but youcan not do it. In Proceedings of ACM MobiCom, 2013.
[9] VERBELEN, T., SIMOENS, P., DE TURCK, F., AND DHOEDT, B.Cloudlets: Bringing the cloud to the mobile user. In Proceedings of the3rd ACM Workshop on Mobile Cloud Computing and Services, 2012.
[10] ZHANG, J., REN, F., AND LIN, C. Delay guaranteed live migration ofvirtual machines. In Proceedings of IEEE INFOCOM, 2014.
[11] GMACH, D., ROLIA, J., CHERKASOVA, L., AND KEMPER, A. Work-load analysis and demand prediction of enterprise data center applica-tions. In Proceedings of the IEEE 10th International Symposium onWorkload Characterization, 2007.
[12] ARMBRUST, M., FOX, A., GRIFFITH, R., JOSEPH, A. D., KATZ, R.,KONWINSKI, A., LEE, G., PATTERSON, D., RABKIN, A., STOICA, I.A View of Cloud Computing. In Communications of the ACM, 53(4):50-58, 2010.
[13] WANG, M., MENG, X., AND ZHANG, L. Consolidating virtual machineswith dynamic bandwidth demand in data centers. In Proceedings of IEEEINFOCOM, 2011.
[14] BREITGAND, D., EPSTEIN, L. Improving consolidation of virtual ma-chines with risk-aware bandwidth oversubscription in compute clouds.In Proceedings of IEEE INFOCOM, 2012.
[15] VERMA, A., BAGRODIA, J., JAISWAL, V. Virtual machine consolidationin the wild. In Proceedings of the 15th International MiddlewareConference, 2014.
[16] MAGULURI, S., SRIKANT, R., YING, L. Stochastic Models of LoadBalancing and Scheduling in Cloud Computing Clusters. In Proceedingsof IEEE INFOCOM, 2012.
[17] CHEN, L., SHEN, H., SAPRA, K. RIAL: Resource Intensity Aware LoadBalancing in Clouds. In Proceedings of IEEE INFOCOM, 2014.
[18] E. Cuervo, A. Balasubramanian, D.-k. Cho, A. Wolman, S. Saroiu,R. Chandra, and P. Bahl. Maui: Making smartphones last longer withcode offload. In Proceedings of ACM MobiSys, pages 49–62, 2010.
[19] ZHAO, J.,YANG, K.,WEI, X., DING, Y.,HU, L., XU, G. A HeuristicClustering-based Task Deployment Approach for Load Balancing UsingBayes Theorem in Cloud Environment. In IEEE Transactions on Paralleland Distributed Systems, 2015.
[20] URDANETA, G., PIERRE, G, AND VAN, M. Wikipedia WorkloadAnalysis for Decentralized Hosting. In Elsevier Computer Networks,vol.53, 2009.
[21] XU,C Decentralized Computation Offloading Game for Mobile CloudComputing. In Parallel and Distributed Systems, IEEE Transactions on,vol.26, 2014.
[22] BOYD, S. AND VANDENBERGHE, L. Convex optimization. Cambridgeuniversity press, 2009.
[23] KIRKPARTRICK, S., GELATT, C., VECCHI, M. Optimization by Simu-lated Annealing. In Science, New Series, vol.220, 1983.
[24] LOWE, D. Object Recognition from Local Scale-invariant Features. InProceedings of the International Conference on Computer Vision, 1999.