Embed Size (px)
Citation preview

A HIGH-THROUGHPUT, MULTIPLEXED MICROFLUIDIC METHOD
UTILIZING AN OPTICALLY BARCODED DROP LIBRARY
by
Geoffrey Kane Zath
A thesis submitted in partial fulfillment
of the requirements for the degree
of
Master of Science
in
Chemical Engineering
MONTANA STATE UNIVERSITY
Bozeman, Montana
April 2016

©COPYRIGHT
by
Geoffrey Kane Zath
2016
All Rights Reserved

ii
ACKNOWLEDGEMENTS
This work was funded by the Montana State University Office of the Provost. I
would like to thank the Montana Microfabrication Facility for the use of the
photolithography equipment. I would also like to thank the Center for Biofilm
Engineering for the imaging facilities and Betsey Pitts for her assistance with the
confocal microscope. I appreciate all the help Chris Arrasmith gave while showing me
the ropes of the clean room. I could not have finished this thesis without Reha Abbasi’s
help in the lab. I am grateful for the help and support of my fellow lab and office mate,
Robert Schaefer, as none of my work would have been possible without him. I am
thankful for my senior lab instructor at Oregon State University, Dr. Phil Harding, who
taught me a great deal about being a professional engineer. Finally, I am thankful for the
support and guidance from my advisor Dr. Connie Chang who always had an open door,
my parents who always said it would get ‘harder’ (well it finally did), and my friends on
the Montana State Ultimate Frisbee team who kept me sane throughout this process
(booyah!).

iii
TABLE OF CONTENTS
1. INTRODUCTION ...........................................................................................................1
Drop-Based Microfluidics ...............................................................................................1
Droplet Formation ............................................................................................................4
Microfluidic Device Fabrication ......................................................................................6
Antibiotic Susceptibility Test (AST) ...............................................................................7
Droplet Barcoding ............................................................................................................8
2. MICROFLUIDIC PLATFORM DESIGN .....................................................................12
Microfluidic Platform Introduction ................................................................................12
Design and Fabrication of Microfluidic Chip System ...................................................13
Design of Multilayered Microfluidic Chip ............................................................13
Droplet Barcoding Design .....................................................................................16
Microfluidic Device Fabrication ............................................................................18
SU-8 Master Mold Fabrication ..................................................................18
PDMS Layer 1-3 Preparation.....................................................................19
Bonding of Multilayer PDMS Microfluidic Chip ..................................... 20
Microfluidic Chip with PMMA Layer 2 ...................................................21
Construction of Pressure Chamber System for
Microfluidic Device ...............................................................................................22
Fluorescent Detection Platform .....................................................................................23
Fluorescent Detection Process ...............................................................................23
Expanded Functionality of Fluorescent Microscope .............................................24
Microfluidic Fluorescent Detection Chip ..............................................................26
Fluorescent Signal Analysis ...................................................................................27
3. EXPERIMENTAL PROCEDURES ..............................................................................30
Microfluidic Device Two-Phase Flow Characterization ...............................................30
Fluorescent Barcode Characterization ...........................................................................31
Single Color Barcodes with Single Drop Maker ...................................................31
Two Color Barcoded Drops from Well Plate ........................................................32
Barcode Verification ......................................................................................................34
Confocal Imaging of Microbeads and Drops .................................................................34
4. RESULTS & DISCUSSION..........................................................................................36
Microfluidic Device Two-Phase Flow Characterization ...............................................36
Single Color Fluorescent Barcode Characterization ......................................................38
Two Color Fluorescent Barcode Characterization .........................................................46

iv
TABLE OF CONTENTS - CONTINUED
Barcode Verification ......................................................................................................53
Confocal Imaging of Microbeads and Drops .................................................................62
5. CONCLUSION ..............................................................................................................65
REFERENCES CITED ......................................................................................................67

v
LIST OF TABLES
Table Page
3.1 Microbead barcode concentration within a drop .............................................33
3.2 Barcode combination scheme for adding green and red
microbeads to a well plate quadrant .................................................................33
4.1 Population of drops per barcode combination in a 24 green
and red microbead barcoded drop mixture ......................................................53
4.2 Population of drops per barcode combination in a 24 green
and red microbead barcoded drop mixture with blue microbeads
as a simulated assay signal ...............................................................................60
4.3 Calculated blue microbead assay concentrations from a
24 green and red microbead barcoded drop mixture .......................................61

vi
LIST OF FIGURES
Figure Page
1.1 On-chip oligonucleotide barcoding....................................................................2
1.2 Process flow of an enzyme inhibition study on β-galactosidase .......................3
1.3 Dose-response curves of a screen of 704 compounds against
protein tyrosine phosphate 1B using drop-based microfluidics .........................3
1.4 Various flow regimes at a flow focusing junction .............................................4
1.5 State diagram of the dripping-to-jetting transition.............................................6
1.6 Assembly line formation of drops with spatial barcoding ...............................10
1.7 Fluorescent gradient generation using a fluorescently
barcoded substrate for an enzyme kinetics study .............................................11
1.8 Single cell encapsulation with unique oligonucleotide
barcoded microbeads in drops for single cell RNA sequencing ......................11
2.1 Process flow of drop making and fluorescent detection ..................................13
2.2 AutoCAD design of photolithography masks of:
(a) Mask A (b) Mask B (c) Mask C (d) Mask D ..............................................14
2.3 Expanded view of a drop maker from Mask A ................................................15
2.4 Exploded view of the multilayered chip when
interfaced with a well plate ..............................................................................15
2.5 Process flow diagram of pressure system ........................................................16
2.6 Modification of original barcoding design ......................................................18
2.7 Modification of Layer 3 to include four outlets for each
drop making quadrant ......................................................................................18
2.8 Completed multilayered microfluidic chip with
capillaries inserted ...........................................................................................21

vii
LIST OF FIGURES – CONTINUED
Figure Page
2.9 Multilayered microfluidic chip with a PMMA Layer 2 ...................................22
2.10 Pressure chamber system as seen in the lab ...................................................23
2.11 Detection of a barcoded droplet library using a
custom fluorescent microscope ......................................................................24
2.12 Optical filter placement within the PMT cube stack .....................................25
2.13 Dual laser alignment into PMT cube stack ....................................................25
2.14 Detection chip with drops entering ................................................................27
2.15 Fluorescent signal of green and red fluorescently barcoded
drops as displayed by LabVIEW ...................................................................28
2.16 WEKA output of 2 red and 2 green barcoded drops ......................................29
4.1 State diagram of jetting-to-dripping transitions using the
average experimental Wein and Caout for the microfluidic device ...................37
4.2 Re-injection of drops from microfluidic device into detection chip ................38
4.3 Increased variance in fluorescent signal at low
microbead concentrations ................................................................................39
4.4 Increase of peak signal CV at low microbead concentrations .........................40
4.5 Histogram of time inside measurements of a large mixture
of barcoded drops .............................................................................................42
4.6 Green microbead barcoded drops individually detected ..................................43
4.7 Histogram of peak signals from 5 green microbead
barcoded drops mixture....................................................................................43
4.8 Red microbead barcoded drops individually detected .....................................44

viii
LIST OF FIGURES – CONTINUED
Figure Page
4.9 Histogram of peak signals from 5 red microbead
barcoded drops mixture....................................................................................44
4.10 PMT peak signal data of a mixture of four green
and red barcoded drops ..................................................................................45
4.11 Excitation/emission spectra of green Fluoro-Max
microbeads provide by Thermo Scientific .....................................................46
4.12 Raw peak PMT signal data of a 24 green and
red microbead barcoded drop mixture ...........................................................47
4.13 Effect of red and green fluorescent tails.
(a) Green microbeads (b) Red microbeads ....................................................48
4.14 First-pass filtering of peak PMT signal data of a
24 green and red microbead barcoded drop mixture .....................................49
4.15 Red PMT peak signal data of a 24 green and red
microbead barcoded mixture. (a) Raw data (b) First-pass filter
(c) Second-pass filter .....................................................................................51
4.16 Second-pass filtering of peak PMT signal data of a 24
green and red microbead barcoded drop mixture ..........................................52
4.17 Blue microbead barcoded drops individually detected ..................................54
4.18 Raw peak PMT signal data of a 24 green and red microbead
barcoded drop mixture with blue microbeads ................................................55
4.19 Re-injection of barcoded drops from microfluidic
device into detection chip ..............................................................................55
4.20 Effect of blue, green, and red fluorescent tails ..............................................56
4.21 Blue PMT peak signal data from a 24 green and red
microbead barcoded mixture with blue microbeads as
a simulated assay signal. a.) Raw data b.) First-pass filter ............................58

ix
LIST OF FIGURES – CONTINUED
Figure Page
4.22 DBSCAN identification of barcoded data clusters from
a 24 green and red microbead barcoded drop mixture ...................................59
4.23 Confocal images of: a.) green microbeads b.) red microbeads
c.) blue microbeads d.) 50 µm drops containing blue microbeads ................63
4.24 Confocal overlay images of green/red barcoded drop mixture with
blue microbeads added as a simulated assay signal a.) green overlay
b.) red overlay c.) blue overlay d.) combination overlay ...............................64

x
ABSTRACT
The power of drop-based microfluidics promises reduced biological assaying
times and greater sample throughput; however, current drop-based microfluidic methods
focus on single-input single-output techniques to provide these benefits. In order to
achieve truly high-throughput analysis of biological assays, a multiple-input approach
must be taken. This thesis is focused on developing and validating a drop-based
microfluidic method that is capable of encapsulating, in parallel, 96 assay samples in
drops and optically tracking them in a barcoded drop library. The advantage of the
method presented here is its ability to be integrated with current biological assays
performed on a 384-well plate. The first step was to fabricate a three-dimensional
microfluidic device capable of accepting 96 sample inputs. Second, formation of drops
within the device was characterized by creating a state diagram using Capillary and
Weber numbers of the two phase flow. Finally, the use of fluorescent microbeads was
investigated for the purpose of optically barcoding drops. A barcoding scheme was
developed to allow for fluorescent and spatial labeling of 96 wells of a 384-well plate.
The three-dimensional microfluidic device was successfully used to encapsulate 50 µm
diameter drops from 24 wells barcoded with fluorescent microbeads at a drop formation
rate of 3 kHz per well. Fluorescent detection of the barcoded drop mixture was performed
at a rate of 200 Hz and density-based clustering algorithm DBSCAN was used to identify
barcoded drop clusters from the fluorescent signal data. Validation of this method was
achieved by adding known concentrations of fluorescent blue microbeads to barcoded
wells and detecting for their presence in barcoded drop clusters. The barcoding method
can be expanded to fully incorporate the 96 inputs of the microfluidic device by adding a
spatial barcoding component to each quadrant of 24 optically barcoded wells. The results
presented here show the microfluidic platform has the potential to be a useful tool in
biological assays involved with tracking a large number of samples in a well plate format.

1
CHAPTER 1
INTRODUCTION
Drop-Based Microfluidics
Biological assays require many steps that include: compartmentalization,
manipulation, and measurement. Implementing these steps using drop-based
microfluidics can maximize the throughput of the assay. Microfluidic devices can be used
to encapsulate small aqueous volumes of liquid (0.05 pL to 1 nL) in droplets by using a
carrier oil [1]. Drops can be used for many applications such as single cell RNA
sequencing (Figure 1.1) [2], enzyme inhibition kinetics (Figure 1.2) [3], or drug dose-
response screening (Figure 1.3) [4]. Furthermore, drop-based microfluidics has
advantages that include: rapid mixing within drops, minimized cross-contamination
between drops, reproducibility of drop size, and minimizing the volume of reagent
required for a reaction [1, 5, 6].
The benefit of drop-based microfluidics is the ability to apply it to many common
microtiter well plate assays in order to enhance the assay. A typical screen of a 384-well
plate using robotics will use reagent volumes in the order of milliliters; whereas by using
encapsulated volumes of ~1 pL using microfluidics, reagent volume can be reduced by up
to 7 orders of magnitude [1]. Reagent volume is primarily the limiting factor due to cost.
By decreasing the amount of reagent required per reaction volume, a greater number of
reactions can be screened per reagent volume. High speeds reduce the time of each assay
and allow for screening of even larger target libraries. The encapsulation of the sample
2
volume provides the ability to trap a single molecule or cell from a 1 µL volume where
the concentration is very low into a smaller 1 pL volume where the concentration of the
single drop that captured the molecule or cell is increased a million-fold. This reduction
in volume can decrease reaction times from hours in bulk to minutes or seconds in drops
[7]. In addition, detection rates observed in our lab have reached up to ~1000 drops per
second. The suspension of the aqueous samples in an oil phase provides an isolated
droplet environment stabilized by a surfactant which prevents drops from coalescing or
transporting liquid across the interface.
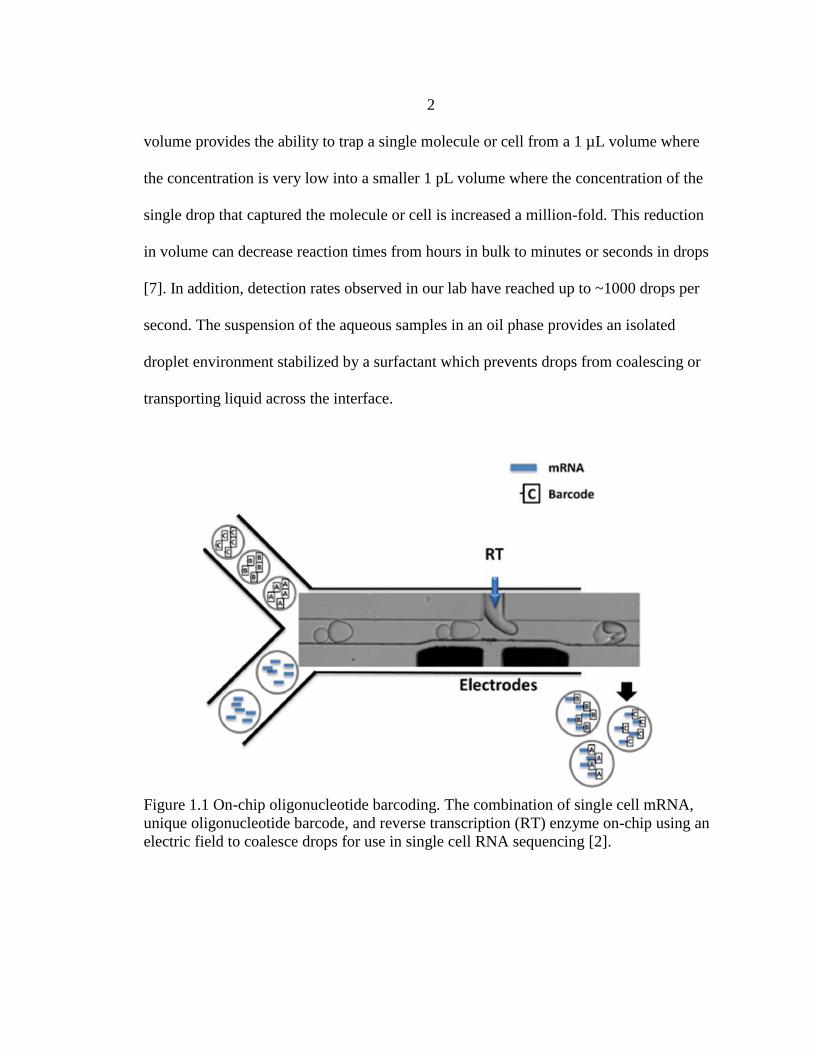
Figure 1.1 On-chip oligonucleotide barcoding. The combination of single cell mRNA,
unique oligonucleotide barcode, and reverse transcription (RT) enzyme on-chip using an
electric field to coalesce drops for use in single cell RNA sequencing [2].

3
Figure 1.2 Process flow of an enzyme inhibition study on β-galactosidase. A microfluidic
chip with incubation channels that allow multiple reaction time points to be measured [3].
Figure 1.3 Dose-response curves of a screen of 704 compounds against protein tyrosine
phosphate 1B using drop-based microfluidics [4].
4
Droplet Formation
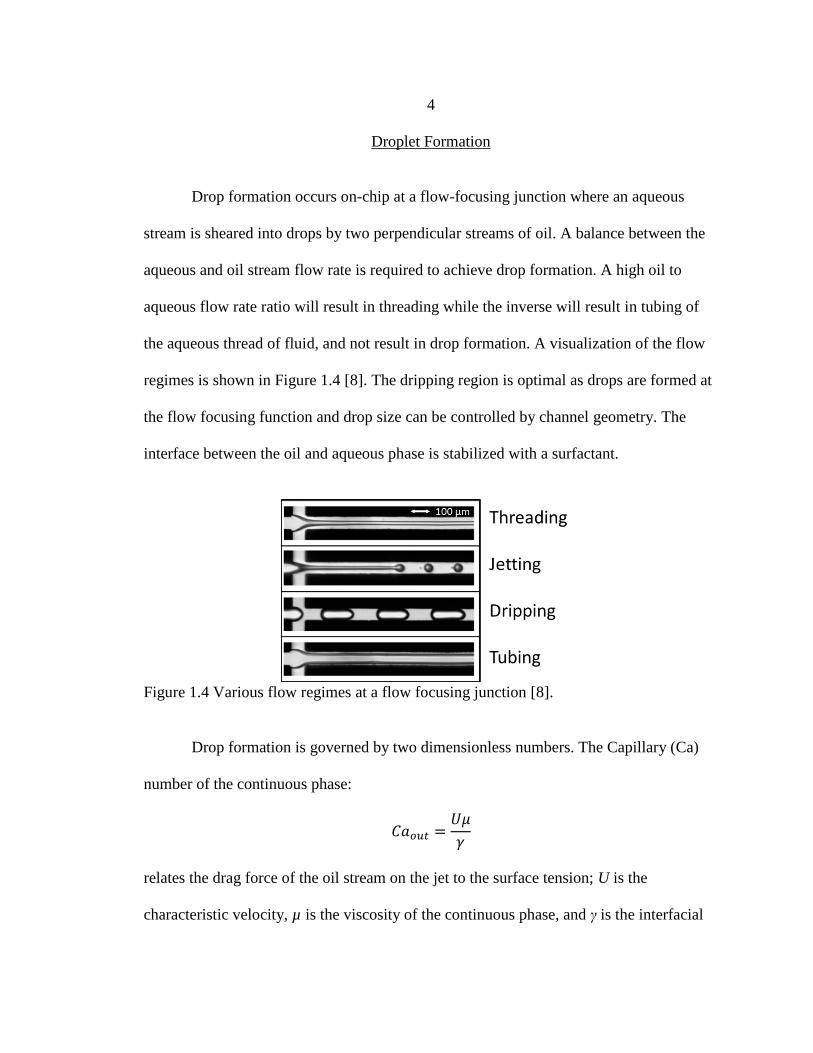
Drop formation occurs on-chip at a flow-focusing junction where an aqueous
stream is sheared into drops by two perpendicular streams of oil. A balance between the
aqueous and oil stream flow rate is required to achieve drop formation. A high oil to
aqueous flow rate ratio will result in threading while the inverse will result in tubing of
the aqueous thread of fluid, and not result in drop formation. A visualization of the flow
regimes is shown in Figure 1.4 [8]. The dripping region is optimal as drops are formed at
the flow focusing function and drop size can be controlled by channel geometry. The
interface between the oil and aqueous phase is stabilized with a surfactant.
Figure 1.4 Various flow regimes at a flow focusing junction [8].
Drop formation is governed by two dimensionless numbers. The Capillary (Ca)
number of the continuous phase:
relates the drag force of the oil stream on the jet to the surface tension; U is the
characteristic velocity, µ is the viscosity of the continuous phase, and γ is the interfacial
𝐶𝑎𝑜𝑢𝑡 =𝑈𝜇
𝛾
5
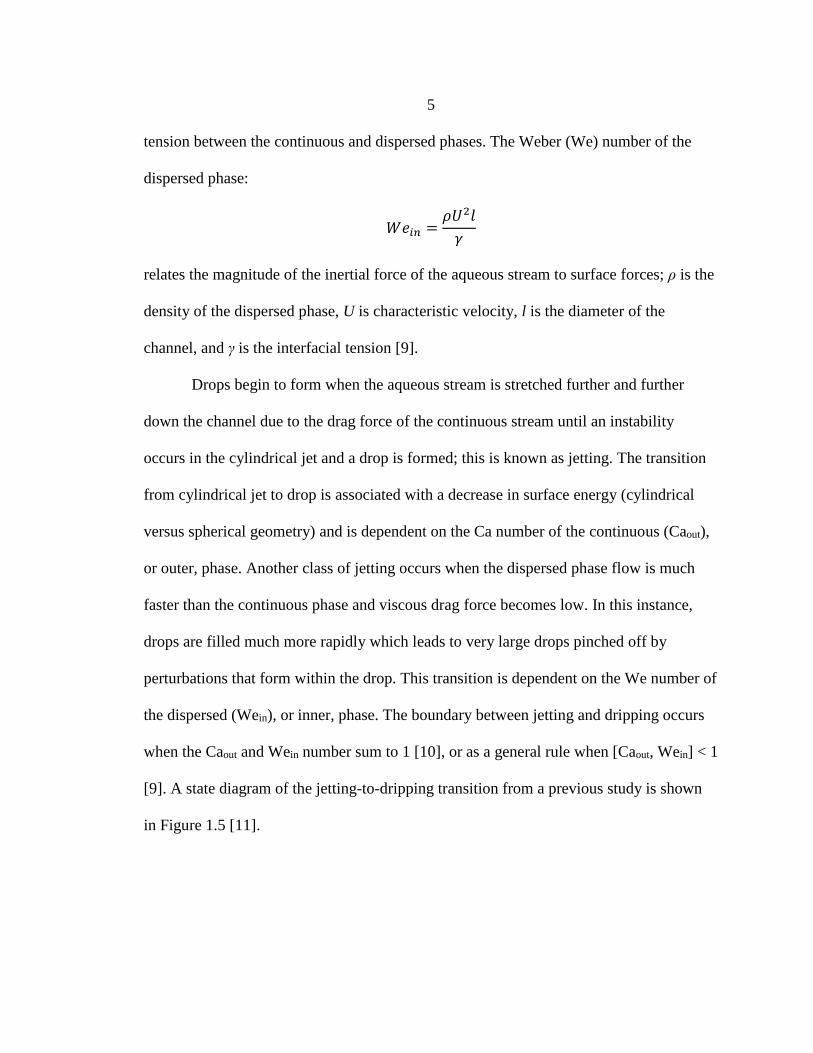
tension between the continuous and dispersed phases. The Weber (We) number of the
dispersed phase:
relates the magnitude of the inertial force of the aqueous stream to surface forces; ρ is the
density of the dispersed phase, U is characteristic velocity, l is the diameter of the
channel, and γ is the interfacial tension [9].
Drops begin to form when the aqueous stream is stretched further and further
down the channel due to the drag force of the continuous stream until an instability
occurs in the cylindrical jet and a drop is formed; this is known as jetting. The transition
from cylindrical jet to drop is associated with a decrease in surface energy (cylindrical
versus spherical geometry) and is dependent on the Ca number of the continuous (Caout),
or outer, phase. Another class of jetting occurs when the dispersed phase flow is much
faster than the continuous phase and viscous drag force becomes low. In this instance,
drops are filled much more rapidly which leads to very large drops pinched off by
perturbations that form within the drop. This transition is dependent on the We number of
the dispersed (Wein), or inner, phase. The boundary between jetting and dripping occurs
when the Caout and Wein number sum to 1 [10], or as a general rule when [Caout, Wein] < 1
[9]. A state diagram of the jetting-to-dripping transition from a previous study is shown
in Figure 1.5 [11].
𝑊𝑒𝑖𝑛 =𝜌𝑈2𝑙
𝛾

6
Figure 1.5 State diagram of the dripping-to-jetting transition [11].
Microfluidic Device Fabrication
A microfluidic device consists of an elastomeric material with a patterned
network of microchannels that is permanently bonded to a substrate [12]. Rapid
prototyping of such devices is possible within 24 hr from design to sealed device.
Microfluidic channels are designed on a CAD program and printed as a transparency to
be used as a photolithography mask. The mask is then used to create a master in positive
relief photoresist. Poly(dimethylsiloxane) (PDMS) is cast in the master thereby patterning
the microfluidic channels on the elastomer. Oxidization of the PDMS surface by oxygen
plasma exposes silanol groups that allow for permanent bonding to other substrates such
as glass, PDMS [13-16], or PMMA (acrylic) [17-19] and can achieve bond strengths
from 200 to 600 kPa.

7
Antibiotic Susceptibility Test (AST)
The overuse of broad spectrum antibiotics and delay of standard procedures to
identify antibiotic treatments has contributed to the rise of antibiotic resistant bacteria
[20, 21]. It has been found that phenotypic detection of antibiotic resistance is superior to
genotypic detection [22]. The clinical gold standard AST methods in microbiology
laboratories are growth-based phenotyping. Conventional AST methods include disk
diffusion and broth dilution [23, 24] and are used to determine the minimum inhibitory
concentration (MIC). The MIC is the minimum antibiotic concentration that visibly
inhibits microbial growth after overnight incubation. Disk diffusion involves isolating
bacteria on an agar plate while disk-shaped filter paper saturated with antibiotic is placed
on the surface. After 18-24 hours, a zone of inhibition forms around the antibiotic soaked
disks. The size of the inhibition zone is inversely proportional to the MIC. Broth dilution
combines nutrient media, bacteria, and antibiotics in well plates. After 24 hours the
optical density (OD) of each well can be measured to determine bacteria growth and the
MIC of the drug.
Drop-based microfluidic techniques can facilitate rapid bacterial growth and
reduce the time required to detect bacteria compared to conventional microbial
techniques [25, 26]. A recent study using MilliDrop technology, a drop-based millifluidic
system, was able to match the MIC results of a broth dilution in a well plate using 800
nano-liter sized droplets within 2 hours [27]. There have been many applications of
microfluidics in an attempt to improve upon current antibiotic resistance testing
techniques [25-33]; however, the major drawback of these studies is the slow production
8
of the reaction volumes for bacteria and antibiotic combinations. The drop-based
microfluidic system presented in this thesis was designed to overcome slow drop
production by including 96 drop makers in parallel on-chip that can simultaneously create
drops from samples in 96 wells of a 384-well plate. This high-throughput drop making
chip will further reduce the time required to perform an AST by vastly improving
reaction volume production rate. For example, within 10 minutes of processing time the
system can create over 2 million pico-liter sized drops (50 µm diameter) from each of the
96 wells (150 µL well volume, 3.3 kHz drop production frequency). In comparison, a
recent high-throughput enzyme kinetics analysis using micro droplets created pico-liter
sized drops at a rate of only 150 Hz [34] while a multiplexed enzymatic study produced
drops at 840 Hz [3].
The power of the method presented here comes from the sheer volume of drops
that are produced and the ease of integration with current well plate assays. For instance,
a well plate can be prepared for a standard broth dilution and then interfaced with the
microfluidic chip system to create millions of drops per well. Drops can then be
incubated and extracted over time to provide thousands of cell growth data points per
well as opposed to a single data point after 24 hours. Drops are labeled to the well they
originated from and therefore location information is not lost. The limiting factor of this
system is the detection rate we have achieved in our lab which at the time of this writing
is ~300 Hz; however, due to the time scale of AST (2-24 hr) the rate is sufficient to
gather growth data.

9
Droplet Barcoding
The formation of large libraries of drops requires a method for barcoding, or
labeling, in order to keep track of the contents of the drops when screening multiple
factors at one time. The prominent types of drop barcoding are spatial [26, 27, 31, 33, 35-
39], fluorescent [3, 4, 34, 40-42], and DNA marker [2, 43, 44].
Spatial barcoding, or indexing, involves the encapsulation and storage of drops in
single file within a microfluidic channel. Since the drops are in single file, their location
provides a label of when they were formed and the contents of the drop. Spatial
barcoding systems are usually slow (<10 Hz drop formation) as drop formation must be
precisely controlled to ensure the correct reagent volume is added; however, the use of
spatial barcodes provides very accurate reading of the barcodes since the drops are
confined to a single channel. An example of an assembly line formation of spatially
barcoded drops is shown in Figure 1.6 [38].
Fluorescent barcoding is the method of adding a unique fluorescent marker to
drops in order to distinguish between them during detection. As many microfluidic assays
include fluorescent detection of cell growth or enzymatic activity, adding a fluorescent
barcode can be convenient. Spatial information does not need to be conserved when using
fluorescent barcodes and therefore fluorescent barcoding methods are only limited by the
speed at which the drops are formed. Limitations of fluorescent barcodes can come from
the dynamic range of the detection platform [1] or spectral overlap [45] which limit the
total number of fluorescent color combinations. For instance, Yang, et al. were able to
produce 100 barcodes using two color Luminex fluorescent dyed beads [46] and Abate, et

10
al. produced 16 barcodes using two color Alexafluor fluorescent dyes [40]. A common
method for fluorescent barcoding is called gradient generation and is shown in Figure 1.7
[34]. A fluorescent marker input stream is combined with a buffer stream, and while the
combined flow rate is kept constant, the ratio of the two streams is varied to create a
gradient of the fluorescent marker between populations of drops.
The use of DNA oligonucleotides provides almost unlimited barcoding potential.
A recent study by Macosko, et al. created over 16 million unique oligonucleotide
barcodes which they attached to microbeads for combining with cells [43]. An image of
this process is shown in Figure 1.8. As with fluorescent barcoding, barcoding with
oligonucleotides is as fast as drop formation. Cells must first be lysed within a drop in
order for the oligonucleotides to prime cDNA synthesis and create barcoded cDNA. This
allows for single cell mRNA expression data to be labeled when drops are run through
RNA sequencing. The lysing of cells eliminates the possibility of collecting cell growth
or activity measurements, unlike fluorescent barcoding which does not require interaction
with cells within a drop.
Figure 1.6 Assembly line formation of drops with spatial barcoding. A valve system
allows a fraction of an incoming sample plug to enter while reagents are injected [38].

11
Figure 1.7 Fluorescent gradient generation using a fluorescently barcoded substrate for an
enzyme kinetics study [34].
Figure 1.8 Single cell encapsulation with unique oligonucleotide barcoded microbeads in
drops for single cell RNA sequencing [43].
The remainder of thesis will be organized into four chapters: Chapter 2:
Microfluidic Platform Design, will cover the design and fabrication of the microfluidic
chip system and fluorescent detection capabilities; Chapter 3: Experimental Procedures,
flow rate tests of the microfluidic chip and barcoded drop preparation and detection
methods will be covered; Chapter 4: Results & Discussion, collected data will be
presented and discussed; and Chapter 5: Conclusions, findings will be summarized and
future directions will be discussed. Data is available upon request from the Center for
Biofilm Engineering (CBE) at Montana State University (MSU) [51].

12
CHAPTER 2
MICROFLUIDIC PLATFORM DESIGN
Microfluidic Platform Introduction
A microfluidic platform has been designed and constructed for the purpose of
integrating with current microtiter well plate assay techniques in order to gain the
benefits of drop-based microfluidics. As previously discussed in Chapter 1, drop-based
microfluidics has the ability to reduce incubation times, detection times, and reagent
volume used per sample collected. The power of the device discussed here has the added
ability to create drops uniquely barcoded, or labeled, from 96 wells of a 384 well-plate
and store them in a droplet library. When combined with an antibiotic susceptibility test
(AST), this provides the ability to test up to 96 drug combinations against a target
bacterium and incubate the droplet library to gather growth data over time to find a
minimum inhibitory concentration (MIC).
Barcoding of drops is accomplished with the use of fluorescent microbeads while
cell growth can be determined with either the production of a fluorescent protein or
enzymatic product. Drop barcodes are ‘read’ using a custom fluorescent microscope
along with the cell growth signal. This is a two-step process: first, a microfluidic chip
creates drops from 96 wells of a 384 well plate and stores them in a droplet library for
incubation; and second, drops from the droplet library are extracted and injected on a
secondary microfluidic chip for fluorescent detection. A diagram of the drop making and
detection process is shown in Figure 2.1.

13
Figure 2.1 Process flow of drop making and fluorescent detection.
Design and Fabrication of Microfluidic Chip System
Design of Multilayered
Microfluidic Chip
The design of the microfluidic chip has been used previously [40] and the
AutoCAD files were provided for our use with the author’s permission. The microfluidic
chip consists of three layers: the first consists of 96 droplet makers and distribution
channels for oil input and droplet output, the second adds height to the distribution
channels of the first layer to decrease resistance to flow, and the third
includes distribution channels that are perpendicular to those in the second layer and is
the interface for the oil inlet and droplet output tubing. AutoCAD images of each layer
design can be seen in Figure 2.2 with an expanded view of a single drop maker in Figure
2.3. The concept behind this chip is to integrate it with 96 wells of a 384 well plate by
inserting metal capillaries into each of the inlets of the 96 drop makers. The chip is

14
designed to perfectly align with the 96 wells and ‘sit’ on the well plate; the microfluidic
chip is limited to a quarter of a 384-well plate due to the use of 3” silicon wafers used
during master mold fabrication. When an external pressure is applied to the liquid
samples (e.g. when placed in a pressure chamber), they are forced through the capillaries
and into the chip where drops are formed. Oil combined with a surfactant is supplied
from an external pressurized source. An exploded view of the chip is shown in Figure 2.4
and process flow diagram of the pressure system is shown in Figure 2.5.
Figure 2.2 AutoCAD design of photolithography masks of: a.) Mask A, drop makers for
Layer 1 b.) Mask B, added depth of distribution channels for Layer 1 c.) Mask C, oil and
droplet distribution channels for Layer 2 d.) Mask D, perpendicular distribution channels
for oil inlet and droplet outlet.

15
Figure 2.3 Expanded view of a drop maker from Mask A.
Figure 2.4 Exploded view of the multilayered chip when interfaced with a well plate.

16
Figure 2.5 Process flow diagram of pressure system. Fluid is pumped from a well plate
into the multilayered microfluidic chip. The chip and well plate are housed within the
pressure chamber.
Droplet Barcoding Design
The complexity of using 96 samples from a well plate requires a method of
barcoding, or labeling, the drops that are produced. The study that originally used this
chip design used barcoded oligomers to uniquely label the RNA of cells that were in
drops in order to perform single cell sequencing [40]. Labeling the RNA in such a
manner requires lysing of cells. For the purpose of this thesis, the ability to track cell
growth was of interest which requires a labeling method that does not damage the cells in
drops. Fluorescent microbeads (Fluoro-Max, Thermo Scientific Inc.) were chosen to be
used as color based barcodes. The polystyrene beads (0.91 µm diameter) have fluorescent
dye incorporated into the polymer matrix which limits dye leakage within and between
drops [47]. Furthermore, since the beads are dyed and not the solution within the drop,
there will be no dye interaction with cells that may be in the drops. This means the
barcode is independent of cells in the drop and cells are free to grow independently of the
barcode. Growth of cells in drops can be monitored by either modifying a cell to produce

17
a green fluorescing protein (GFP) [31] or by enzymatic activity [27, 33, 47]. The use of a
live/dead cell stain may also be employed to track growth by measuring the live cell
population size.
Barcoding consists of a two color combination of blue (412/447 nm), green
(468/508 nm), or red beads (542/612 nm) depending on the fluorescent signal used to
determine cell growth. The initial design of the microfluidic chip produces drops from 96
wells and collects them in a single outlet. As mentioned in Chapter 1, fluorescent
detection has a limited range of detectable concentrations in addition to the issue of
separation between signals, which will be seen in Chapter 4. Instead of requiring an 8 by
12 matrix of color combinations, a modification of the microfluidic chip design was made
to reduce the matrix to 5 by 5 in order to combat the fluorescent detection limits. This
simply required the change from one droplet outlet into four separate droplet outlets. The
drop makers and distribution channels are arranged in a way where 24 drop makers share
a common droplet outlet that is separate from the other drop makers. This creates
quadrants of drop makers that when isolated create an additional spatial barcoding
dimension. A diagram of the quadrant separation and modified barcoding design is
shown in Figure 2.6 with an image of a completed microfluidic chip with four droplet
outlets in Figure 2.7.

18
Figure 2.6 Modification of original barcoding design.
Figure 2.7 Modification of Layer 3 to include four outlets for each drop making quadrant.
Microfluidic Device Fabrication
SU-8 Master Mold Fabrication. Fabrication of master molds was performed in the
Montana Microfabrication Facility (MMF) at Montana State University (MSU).
Microfluidic channels were designed on AutoCAD (Autodesk, Inc., San Rafael, CA) and
printed on high resolution transparencies (CAD/Art Services, Bandon, OR) to be used as
masks in photolithography. Negative photoresist (SU-8, MicroChem Corp, Westborough,

19
MA) was spin-coated onto 3” silicon wafers (University Wafer, Boston, MA). Guidelines
provided by MicroChem were followed for spin coating, exposure, baking, and
development times to create desired SU-8 feature sizes on the silicon wafer. The Layer 1
mold required the pattering of drop making structures from Mask A and adding height to
the distribution channels with Mask B by using a mask aligner (ABM, Scotts Valley,
CA). Masks C and D were used for Layers 2 and 3. SU-8 3050 was used to create 50 µm
features for Mask A and SU-8 2075 was used to create 300 µm features for Mask B and
C and 500 µm features for Mask D.
PDMS Layer 1-3 Preparation. PDMS was prepared by mixing prepolymer and
curing agent (SYLGARD 184, Dow Corning, Midland, MI) at a 10:1 (w/w) ratio [12].
The PDMS mixture was placed in a vacuum desiccator for 1 hr to degas the mixture. The
SU-8 device master was blown clean with nitrogen gas and then the PDMS mixture was
promptly poured over the mold surface. To achieve a constant PDMS thickness across
devices, a total of 22 g of PDMS was added to each mold. The mold with PDMS was
placed in an oven at 65 °C for 2 hr to complete crosslinking of the polymer. The PDMS
may be kept in the oven overnight for a better quality slab [48]. The cured PDMS was cut
with a razor blade around device features on the SU8 master and slowly peeled off the
surface. Inlet holes for the 96 drop makers sample inlets on Layer 1 and through holes on
Layer 2 were made using a 0.75 mm biopsy punch (Robbins Instruments, Chatham, NJ).
Oil inlet and droplet output holes were punched in Layer 3 using 1.0 mm biopsy punches.
Layer 3 was modified to incorporate the quadrant barcoding design by punching four
droplet outlet holes that aligned with the droplet through holes of Layer 2.

20
Bonding of Multilayer PDMS Microfluidic Chip. The bonding process for the
multilayered PDMS microfluidic chip was adapted from previous work [13-16]. PDMS
surfaces were cleaned with 99% isopropyl alcohol and blown dry with nitrogen gas.
Layers 1 and 2 were placed channel side up into a plasma cleaner (PDC-001, Harrick
Plasma, Ithaca, NY). Vacuum was applied to the sealed chamber to reach a vacuum
pressure of 100 mTorr. Oxygen gas (10 psi) was then pumped into the chamber to reach a
vacuum pressure of 700 mTorr. The plasma cleaner was set to Medium power (20 W) for
30 s of visible plasma (faint blue light). The PDMS slabs were removed and visually
aligned and brought into contact with each other. Hand pressure was applied for 30 s
followed by a 0.5 kg weight for 1 min to create a permanent bond. The bonded device
was placed in the oven overnight at 65 °C to further assist with bonding. The combined
PDMS layer 1 and 2 were removed from the oven and bonded with layer 3 using the
procedure described previously. The overnight bake now included two large glass plates
to ensure all surfaces were in contact. Stainless steel capillaries (22 AWG, Vita Needle,
Needham, MA) were inserted into each of the 96 input holes previously punched out. An
image of a completed device is shown in Figure 2.8.

21
Figure 2.8 Completed multilayered microfluidic chip with capillaries inserted. A 384-
well plate is shown in the background. The device fits within one 96 well quarter of the
384-well plate.
Microfluidic Chip with PMMA Layer 2. A secondary multilayer microfluidic chip
was made using PMMA (acrylic) for Layer 2 in order to increase the rigidity of the
device. Through holes (700 µm diameter) were machined using a Dremel tool and
Dremel press. Surface modification of the PMMA was required before bonding of the
PDMS layers could occur. The bonding process was modified from previous work [17-
19]. The surface modification involved silanation of the PMMA with the addition of
aminopropyltriethoxysilane (APTES). The PMMA layer was first treated with oxygen
plasma on high (30 W) for 1 min and then submerged in a 5% APTES solution (v/v) for
20 min at 80 °C. The PDMS layers were first plasma treated on high (30 W) for 48 s and
then the silanized PMMA layer was added to the chamber for an additional 12 s of
plasma treatment. Both layers were removed from the plasma cleaner chamber and
brought into conformal contact, aligning through holes as needed. A 0.5 kg weight was

22
put on top of the bonded layers and placed in the oven at 65 °C for 1 hr. This created an
initial permanent bond but over time the PDMS peeled off the PMMA layer. The
secondary chip was not used for subsequent experiments. An image of the competed
device is shown in Figure 2.9.
Figure 2.9 Multilayered microfluidic chip with a PMMA Layer 2.
Construction of Pressure Chamber
System for Microfluidic Device
The pressure chamber which housed the multilayered microfluidic device was
constructed from a household pressure cooker with holes machined for oil inlet, droplet
outlets, and pressurization of the system. The oil reservoir was made from a HPLC media
bottle with holes drilled in the cap for oil outlet and pressurization. Air regulators (25 psi,
McMaster-Carr, Santa Fe Springs, CA) were used to adjust the pressure of the pressure
cooker and oil reservoir using filtered lab air (80 psi). Droplet outputs used PE/5 tubing

23
(0.008” ID) and the oil inlet used FEP tubing (1/32” ID). An image of the pressure
system as seen in the lab is shown in Figure 2.10.
Figure 2.10 Pressure chamber system as seen in the lab.
Fluorescent Detection Platform
Fluorescent Detection Process
A custom inverted microscope built in-lab was used to detect and measure the
fluorescent intensity of the fluorescent microbeads used as barcodes within the drops
produced from each well. The intensity and color of the signal is used to trace individual
drops in a mixture back to the well they were sourced from. Fluorescent signals are
measured using photomultiplier tubes (PMT) which detect photons of light and produce a
measurable voltage signal. Drops that have been made from the microfluidic chip system
are stored in a barcoded library which must be reintroduced into a detection microfluidic
chip. The detection chip corrals drops into a single 50 µm channel that passes across a
laser beam which excites a fluorescent signal from the drops. The signal from each drop

24
is collected with a data acquisition card (DAQ) and sent to a PC with a custom LabVIEW
program (National Instruments, Austin, TX) that records the signal data for analysis. An
overview of this process is shown in Figure 2.11.
Figure 2.11 Detection of a barcoded droplet library using a custom fluorescent
microscope.
Expanded Functionality of
Fluorescent Microscope
The fluorescent detection system required an expansion from its original two
color detection capabilities to three color detection. A third PMT (Hamamatsu Photonics,
Hamamatsu City, Japan), 405 nm laser diode (Dragon Lasers, Hong Kong, China), and
optical filters (Semrock, Rochester, NY) were installed to the fluorescent microscope to
add blue (425-465 nm) fluorescent detection; this is in addition the current green (500-
550 nm) and red (>561 nm) fluorescent detection capabilities using a 473 laser diode
(Ultra Lasers, Newmarket, ON, Canada). Diagrams of the optical filter placement and
laser alignment are shown in Figure 2.12 and 2.13 respectively.

25
Figure 2.12 Optical filter placement within the PMT cube stack (PMT – Photomultiplier
Tube, D – Dichroic Filter, BP – Bandpass Filter, LP – Longpass Filter).
Figure 2.13 Dual laser alignment into PMT cube stack.

26
Laser light is aligned outside the PMT stack with dichroic 4 (D4) which reflects
the 405 nm laser and allows the 473 nm light to pass through, effectively combining the
beams. The combined laser beam enters the PMT stack and is reflected off dichroic 1
(D1) which passes the laser light through the microscope objective (40x) and onto the
detection chip where a fluorescent emission is created from a drop. The fluorescent
emission then passes back through the objective where it is filtered at dichroic 1 (D1) into
blue, green, and red wavelengths. Dichroic 2 (D2) reflects blue light (425-465 nm) into
bandpass 1 (BP1) which adds an additional filtering step and then passes onto detection
in PMT 1. The path is similar for the green (500-550 nm) and red signal (>561 nm). For a
more detailed description of the optics, the Semrock parts list is provided in Figure 2.12.
Microfluidic Fluorescent Detection Chip
Drop detection requires that a single drop pass through the laser at a time with
sufficient space between drops so as not to overlap the fluorescent signal. A drop
detection microfluidic chip is used to focus an injected drop mixture down to a single 50
µm by 50 µm channel where they form a single file line for detection The barcoded drop
mixture is injected into the detection chip along with spacer oil; drops stored in solution
will rise to the top as the oil is denser than water (Novec 7500, 1.61 g/mL). When the
drops are injected into a chip, they will be too densely packed and thus require a spacer
oil. A laser beam is aligned to fit within the detection channel and brought slightly out of
the plane of focus (using a 40x objective) so the beam encompasses to the entire channel,
ensuring each drop is fully detected. An image of the detection chip with drops entering
is shown in Figure 2.14. The detection chip has an additional sorting capability by using

27
an electric field to pull drops into a secondary output using electrodes on chip (seen as
black lines in Figure 2.14), however this was not used for this project.
Figure 2.14 Detection chip with drops entering. A simulated laser dot is shown where the
laser would be aligned.
Fluorescent Signal Analysis
A custom LabVIEW program was used to record the fluorescent signal detected
by the PMT modules sent to the DAQ card. The program can display in real time the
voltage signal from up to four PMT signals and record max signal peak height (V),
average signal peak height (V), summed signal peak height (V), and width of the signal
(ms) for drops passing the laser beam. Detection parameters for minimum peak height
(V) and width (ms) are set by the user to filter out noise (low peak height) or small drops
(narrow width) formed from the breakup of drops during injection into the detection chip.
A sample of the detection of green and red fluorescently labeled drops is shown in Figure
2.15.

28
Figure 2.15 Fluorescent signal of green and red fluorescently barcoded drops as displayed
by LabVIEW. Green fluorescence is represented by the white signal while red
fluorescence is represented by the red signal.
An open source machine learning software program named WEKA [49] was used
to analyze the output from the LabVIEW software. Clustering methods included in the
software package were used to identify individual barcode data clusters when all barcode
signal data was plotted together. Expectation-Maximization (EM) and Density-Based
Spatial Clustering of Applications with Noise (DBSCAN) were the two clustering
methods used. The EM algorithm assigns a probability distribution to each instance of
data to determine the probability of it belonging to a specific cluster. This method
provided the mean and standard deviation of each barcoded signal cluster to be used for
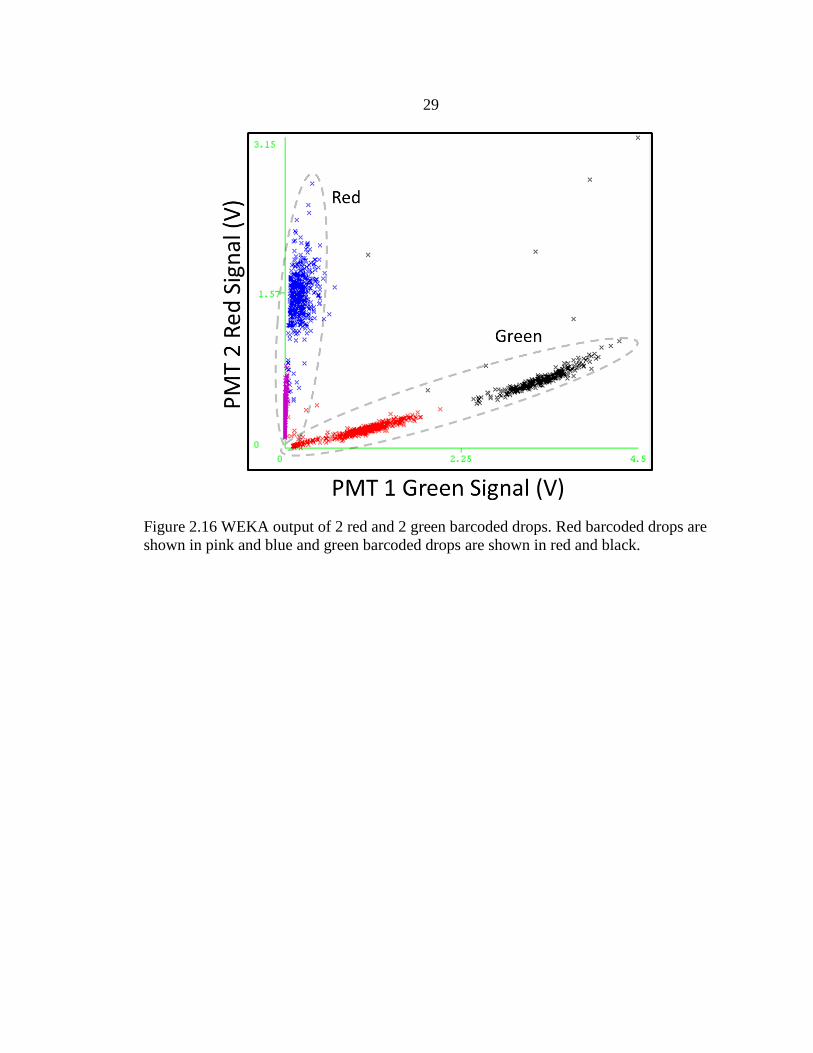
filtering data. A sample WEKA output of 2 red and 2 green barcoded drop populations in
a mixture with clusters identified using the EM method is shown in Figure 2.16.
DBSCAN is a density-based clustering method that groups together closely packed data
points (close near neighbors) and marks outliers which lie in low-density regions (nearest
neighbors far away).
29
Figure 2.16 WEKA output of 2 red and 2 green barcoded drops. Red barcoded drops are
shown in pink and blue and green barcoded drops are shown in red and black.

30
CHAPTER 3
EXPERIMENTAL PROCEDURES
Microfluidic Device Two-Phase Flow Characterization
The use of a pressure chamber to push liquid into the microfluidic device restricts
the ability to observe drop formation via a microscope and high-speed camera. To ensure
the device was operating in the drop formation regime, a state diagram similar to Figure
1.5 was created. A combination of a range of pressures from the oil inlet (3-12 psi) and
water inlet (2-8 psi) were used to gather flow rate values for the oil and water phases (16
total measurements).
The microfluidic device was placed in a petri dish filled with 10 mL of filtered DI
water within the pressure chamber. The oil reservoir was filled with fluorocarbon oil
(Novec 7500, 3M, Maplewood, MN). The two-phase output was collected in a 15 mL
centrifuge vial while measuring the time required to fill the vial. The two phases were
allowed to separate and the individual volumes were recorded. The device was cleaned
by flushing with filtered DI water and then air to expel all the liquid from the channels.
Volumetric flow rates of each phase were calculated from the separated volume
and time measurements. It was assumed the flow rates calculated could be split across the
96 drop makers on the device providing an average flow rate for the oil and water phases
at each drop maker. Surface tension between the two phases was estimated to be 2.5
mN/m [9]. The averaged flow rates were then converted to fluid velocities seen in the
drop maker with 50 µm by 50 µm square channel dimensions. Average continuous phase

31
Caout and dispersed phase Wein numbers were calculated and plotted against each other on
a log-log plot. The results of this state diagram can be seen in Figure 4.1.
Fluorescent Barcode Characterization
Single Color Barcodes with Single Drop Maker
Green (ex. 468/em. 508 nm) and red (ex. 542/em. 612 nm) barcoded drops (single
color) were made using a single 50 µm drop maker initially to determine the range of
concentrations of fluorescent microbeads (Fluoro-Max, Thermo Scientific Inc.) that
would provide 5 distinguishable signals when combined in a mixture. A range of nominal
concentrations were used from 1 microbead per drop up to 330 microbeads per drop.
Microbead solutions were diluted from the stock solution (8.5e12 microbeads/mL) and
placed in syringes to be injected in a single drop maker. Each single color microbead
solution was injected at 235 µL/hr with fluorocarbon oil (combined with a
fluorosurfactant) injected at 945 µL/hr for a drop formation rate of 100 Hz for 50 µm
diameter drops. The fluorosurfactant is synthesized by coupling oligomeric perfluorinated
polyethers (PFPE) with polyethylene glycol (PEG) [50]. A single color fluorescent signal
was collected on the drop making chip during drop formation to determine the maximum
signal gain (in order to maintain the signal below 4 V and not damage the PMTs) and
minimum peak voltage cut-off values (too low a cut-off and noise is introduced). A
mixture of single color drops was made by collecting the output of each microbead
solution for 10 min to ensure an equal mix of each population.

32
The mixture of the single color barcoded drops was re-injected into a detection
chip with drops at 235 µL/hr and spacer oil at 945 µL/hr for a detection rate of 200-300
Hz. The peak gain and cut-off values from the single color detection were used during
detection. Detection data was collected for 1 min which provided ~12,000-18,000 data
points.
Two Color Barcoded Drops from Well Plate
Combinations of green and red microbeads were combined in solution on a well
plate to test the viability of creating a fluorescently barcoded library. 96 wells of a 384-
well plate were split into 4 quadrants with 24 wells each. Quadrant 1 was filled with 24
unique microbead barcodes. Quadrant 2 and 3 had five wells filled with the single color
green and red barcode variant respectively; the rest of the wells were filled with DI water.
Quadrant 4 acted as the control and was filled with DI water only.
The fluorescent barcoding system used a combination of 5 green and 5 red
microbead concentrations (33 to 330 beads/drop) to create a total of 25 barcodes with the
maximum concentration combination excluded, giving 24 barcodes. Barcode
concentrations and combinations on the well plate are shown in Table 3.1 and 3.2
respectively. The stock solution of single color microbeads had a concentration of 8.5e12
microbeads/mL and was diluted accordingly to match the concentrations shown in Table
3.1 for 50 µm diameter drops. A total volume of 100 µL was used per well.
33
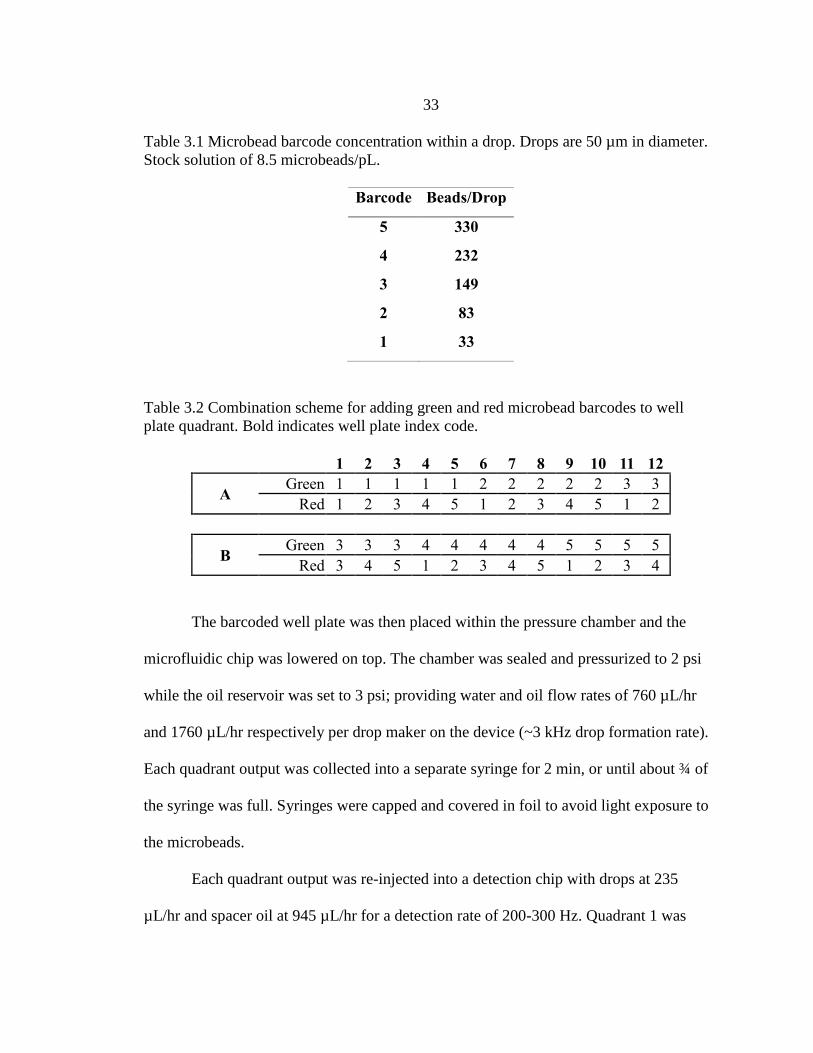
Table 3.1 Microbead barcode concentration within a drop. Drops are 50 µm in diameter.
Stock solution of 8.5 microbeads/pL.
Barcode Beads/Drop
5 330
4 232
3 149
2 83
1 33
Table 3.2 Combination scheme for adding green and red microbead barcodes to well
plate quadrant. Bold indicates well plate index code.
1 2 3 4 5 6 7 8 9 10 11 12
A Green 1 1 1 1 1 2 2 2 2 2 3 3
Red 1 2 3 4 5 1 2 3 4 5 1 2
B Green 3 3 3 4 4 4 4 4 5 5 5 5
Red 3 4 5 1 2 3 4 5 1 2 3 4
The barcoded well plate was then placed within the pressure chamber and the
microfluidic chip was lowered on top. The chamber was sealed and pressurized to 2 psi
while the oil reservoir was set to 3 psi; providing water and oil flow rates of 760 µL/hr
and 1760 µL/hr respectively per drop maker on the device (~3 kHz drop formation rate).
Each quadrant output was collected into a separate syringe for 2 min, or until about ¾ of
the syringe was full. Syringes were capped and covered in foil to avoid light exposure to
the microbeads.
Each quadrant output was re-injected into a detection chip with drops at 235
µL/hr and spacer oil at 945 µL/hr for a detection rate of 200-300 Hz. Quadrant 1 was

34
detected first to determine the green and red signal gain values. Quadrant 2 and 3 output
was then detected using the same green and red values as quadrant 1. Due to spectral
overlap of the beads, single color barcode detection was performed in order to investigate
the emission of red light from green microbeads and the emission of green light from red
microbeads. Quadrant 4 output was measured to look at the presence of fluorescent noise
in blank drops.
Barcode Verification
Blue microbeads (ex. 412/em. 447 nm) were added to the green/red drop
barcoding method previously described to act as a simulated assay signal. This was done
to verify that groups of wells containing equal amounts of blue microbeads would
provide the same fluorescent signal when detected in drops. Concentrations of blue
microbeads equivalent to barcodes 1-4 (see Table 3.1) were randomly added to the wells
of quadrant 1. A well of each blue microbead concentration was randomly chosen to act
as a control to compare against after detection. Quadrant 4 was filled with 5 blue
microbead concentrations (following Table 3.1), with the rest of the wells filled with DI
water to provide a baseline blue signal.
Confocal Imaging of Microbeads and Drops
Confocal images of blue, green, and red microbeads along with drops containing
various microbeads were captured using an inverted Leica confocal microscope (Leica
Microsystems Inc., Buffalo Grove, IL) with 405 nm and 476 nm lasers active. Microbead

35
solutions were prepared at concentrations equivalent to barcode number 5 as seen in
Table 3.1 (330 beads/drop) for 50 µm diameter drops. A solution of 50 µm diameter
drops containing blue microbeads was prepared with a nominal concentration of 330
beads per drop. Additionally, a mixture of 24 green/red barcoded drops (see Table 3.2 for
barcode combinations) containing a range of blue microbeads (barcodes 1-4 as seen in
Table 3.1) was also prepared for imaging on a drop-spot device which holds drops within
a chamber on the device.

36
CHAPTER 4
RESULTS & DISCUSSION
Microfluidic Device Two-Phase Flow Characterization
The pressure chamber restricted the ability to visually inspect the formation of
drops at each drop maker. It was then necessary to determine an average Caout and Wein
number for each of the 96 drop makers on the microfluidic device to ensure it was
operating in the dripping regime of drop formation. A range of oil (3-12 psi) and water
(2-8 psi) inlet pressure combinations (total 16) were tested to determine the volumetric
flow rate of each phase, and subsequently the flow velocity of each phase for Caout and
Wein number calculations. The data collected only provided a single volumetric flow rate
for the device; therefore, it was assumed the volumetric flow rate could be split evenly
among each of the 96 drop making structures, providing an average Caout and Wein
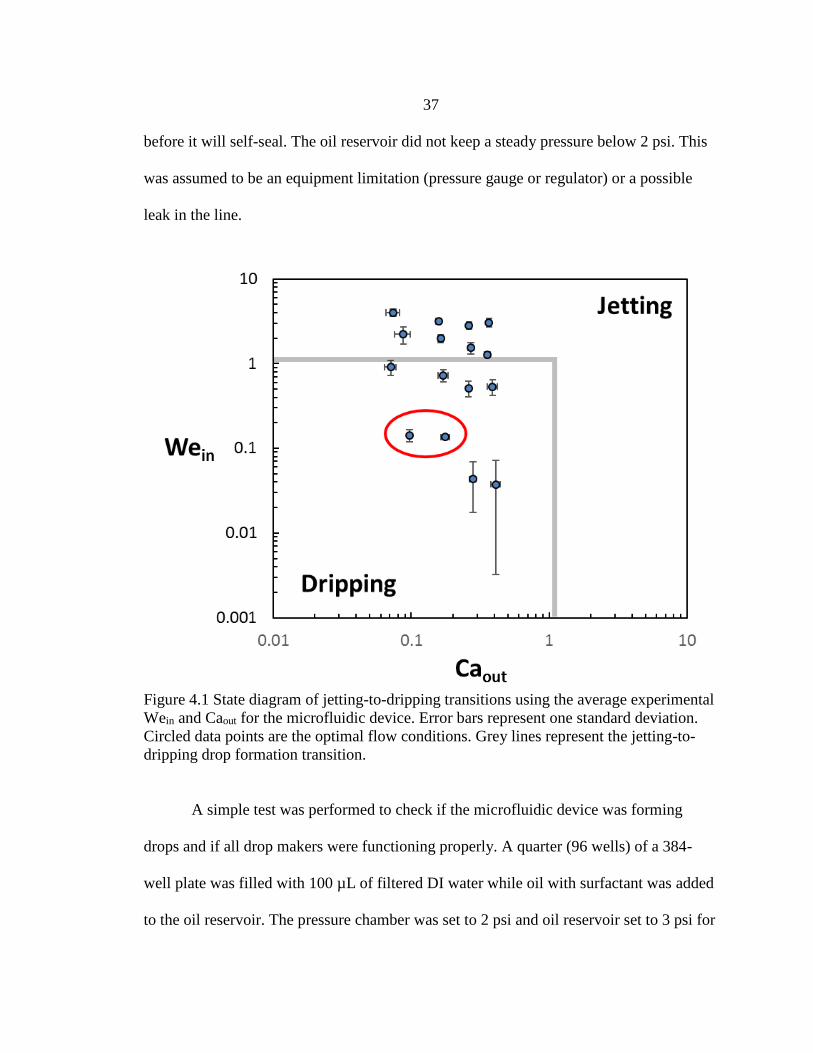
number per drop maker on the device. The Caout and Wein numbers are plotted on a state
diagram in Figure 4.1.
The jetting-to-dripping transition is assumed to be when Caout < 1 and Wein < 1.
The optimal conditions chosen are circled on Figure 4.1 and correspond to a pressure
chamber pressure of 2 psi and oil reservoir pressure between 3-6 psi resulting in drop
formation at ~3 kHz per drop maker (~300 kHz drop formation for entire device). It was
observed that pressure chamber pressures below 1 psi did not provide enough pressure to
push liquid through the microfluidic device. This may have also been caused by the
pressure safety mechanism of the pressure cooker that requires a minimum pressure
37
before it will self-seal. The oil reservoir did not keep a steady pressure below 2 psi. This
was assumed to be an equipment limitation (pressure gauge or regulator) or a possible
leak in the line.
Figure 4.1 State diagram of jetting-to-dripping transitions using the average experimental
Wein and Caout for the microfluidic device. Error bars represent one standard deviation.
Circled data points are the optimal flow conditions. Grey lines represent the jetting-to-
dripping drop formation transition.
A simple test was performed to check if the microfluidic device was forming
drops and if all drop makers were functioning properly. A quarter (96 wells) of a 384-
well plate was filled with 100 µL of filtered DI water while oil with surfactant was added
to the oil reservoir. The pressure chamber was set to 2 psi and oil reservoir set to 3 psi for
38
5 min. Checking the well plate after showed all the wells had been emptied. The drops
collected were then re-injected into a detection chip for visual inspection. Without
barcoded wells this was only a qualitative check as it was not possible to trace drops back
to their respective drop maker. From this check it was confirmed drops were being
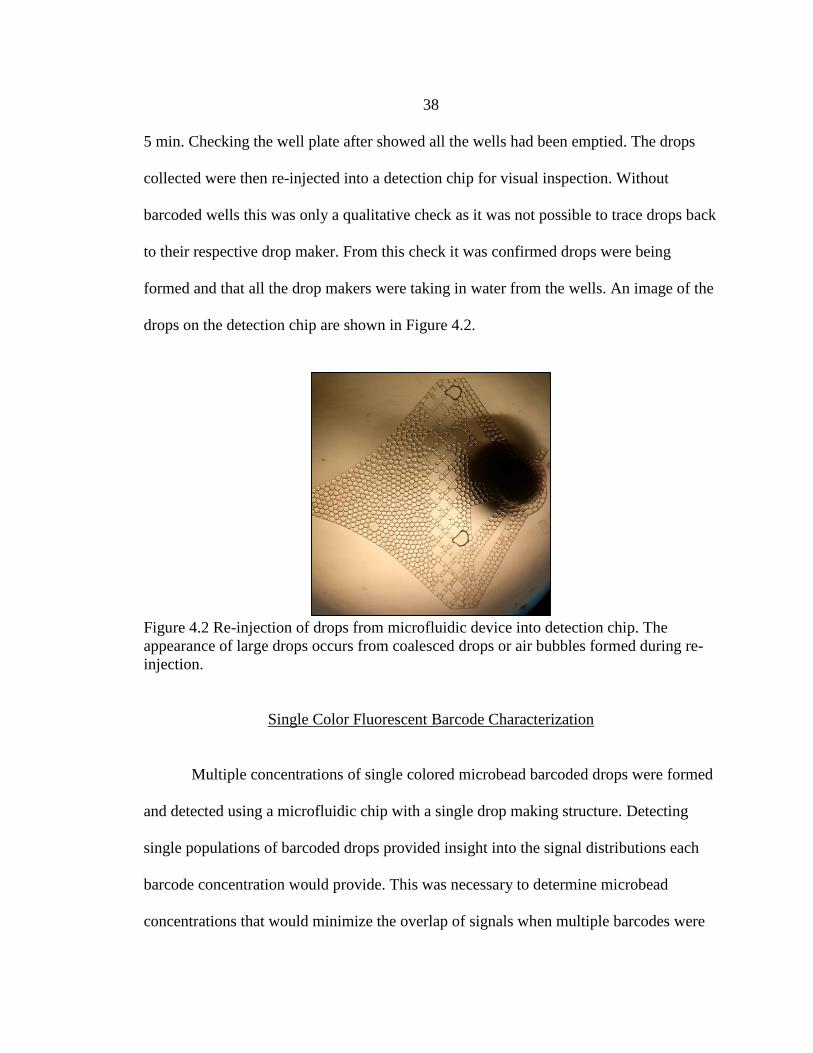
formed and that all the drop makers were taking in water from the wells. An image of the
drops on the detection chip are shown in Figure 4.2.
Figure 4.2 Re-injection of drops from microfluidic device into detection chip. The
appearance of large drops occurs from coalesced drops or air bubbles formed during re-
injection.
Single Color Fluorescent Barcode Characterization
Multiple concentrations of single colored microbead barcoded drops were formed
and detected using a microfluidic chip with a single drop making structure. Detecting
single populations of barcoded drops provided insight into the signal distributions each
barcode concentration would provide. This was necessary to determine microbead
concentrations that would minimize the overlap of signals when multiple barcodes were

39
detected in a mixture. The data collected in these tests further provided minimum peak
cutoff (V) and minimum peak width (ms) parameters.
It was found that as microbead concentrations decreased within drops, the peak
signal coefficient of variation (CV) greatly increased. This put a minimum microbead
concentration of ~30 beads per drop before the CV greatly increased. The increased
variance at low microbead concentration is shown in Figure 4.3 while Figure 4.4 shows
how the peak signal CV increased as microbead concentration decreased. The data
presented in Figure 4.3 and 4.4 are from single barcode detections and include ~4000
data points per microbead concentration.
Figure 4.3 Increased variance in fluorescent signal at low microbead concentrations.
Error bars represent one standard deviation. Log plot used to highlight magnitude of
signal variance at low concentrations. Dotted line indicates the expected linear
relationship.
40
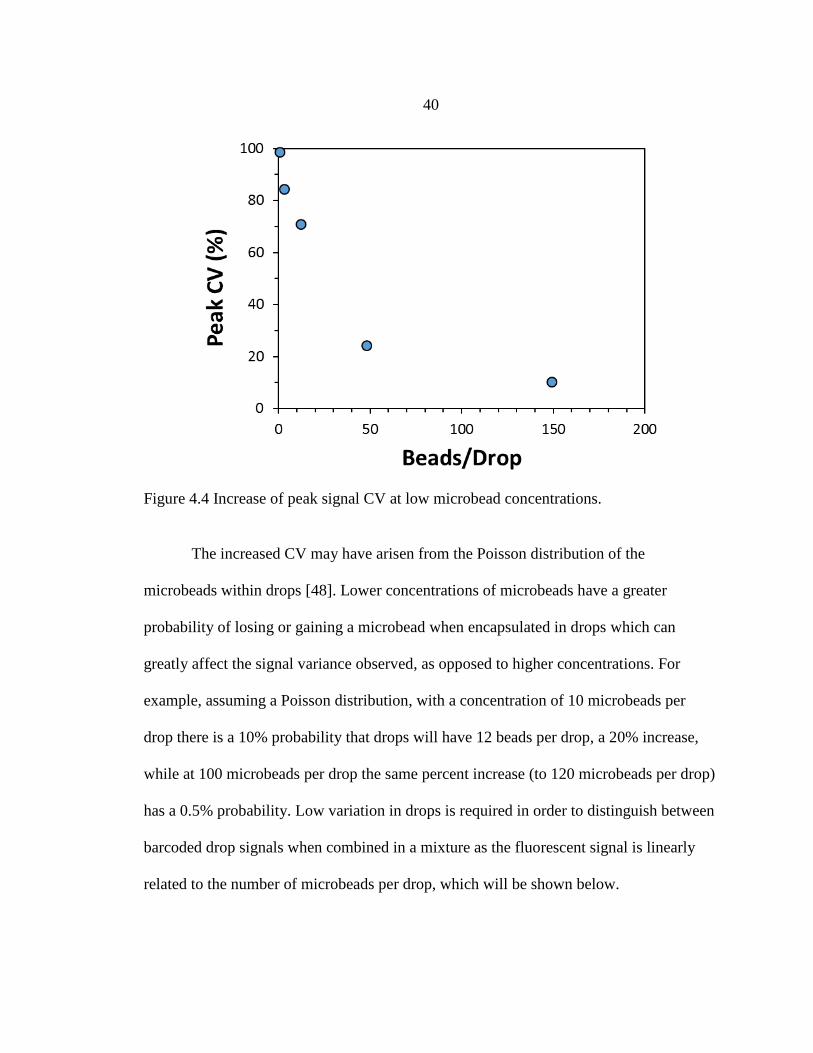
Figure 4.4 Increase of peak signal CV at low microbead concentrations.
The increased CV may have arisen from the Poisson distribution of the
microbeads within drops [48]. Lower concentrations of microbeads have a greater
probability of losing or gaining a microbead when encapsulated in drops which can
greatly affect the signal variance observed, as opposed to higher concentrations. For
example, assuming a Poisson distribution, with a concentration of 10 microbeads per
drop there is a 10% probability that drops will have 12 beads per drop, a 20% increase,
while at 100 microbeads per drop the same percent increase (to 120 microbeads per drop)
has a 0.5% probability. Low variation in drops is required in order to distinguish between
barcoded drop signals when combined in a mixture as the fluorescent signal is linearly
related to the number of microbeads per drop, which will be shown below.

41
Figure 4.3 was used to determine a minimum peak cutoff value of 0.01 V which
assumes signals below have one or less beads or are background noise. A minimum
signal width of 0.70 ms was determined by looking at the distribution of times each drop
was inside the laser beam. This value is directly related to the size of the drop as it is
assumed each drop is moving at the same speed. A low time inside value would indicate
a drop has been damaged and split into smaller drops, while a large time inside value
would indicate drops that have coalesced together to form a much larger drop. A
histogram of time inside values from a large mixture of 15,000 barcoded drops is shown
in Figure 4.5. The leading tail of the drop time inside population distribution is thought to
be an effect of the internal mixing and positioning of microbeads within each drop. In this
case, the maximum time inside value is related to microbeads which are fully dispersed to
the edges of the drop during detection while the leading tail incorporates microbeads
which have positioned themselves in a way that does not encompass the entire drop.
Another cause of the leading tail may come from smaller drops formed by defective drop
makers on the chip.

42
Figure 4.5 Histogram of time inside measurements of a large mixture of barcoded drops.
Time inside the laser beam directly relates to the size of drops.
The maximum concentration of microbeads within a drop (330) was limited by
the stock solution and dilution scheme when combined on the well plate. Using the
minimum barcode concertation found from Figure 4.3, a set of 5 green barcodes were
individually made from 33 beads per drop to 330 bead per drop (10x dilution range) and
detected with a single drop maker. The results of the individual barcode detection can be
seen in Figure 4.6 with a linear relationship between peak signal and barcode
concentration. The 5 green barcoded drops were then collected in a mixture and detected
as shown in Figure 4.7. The signal overlap between barcodes was found to be minimal
which lead to running the same tests on red microbead barcoded drops using the same
concentrations. Individual and mixture detection signal graphs of red microbead barcodes
can be seen in Figure 4.8 and 4.9 respectively. The variation in signal is believed to be an
effect of the Poisson distribution of microbeads in drops as well as positioning of
microbeads within drops at the time of detection as mentioned previously.

43
Figure 4.6 Green microbead barcoded drops individually detected. Error bars represent
one standard deviation.
Figure 4.7 Histogram of peak signals from 5 green microbead barcoded drops mixture.
Reference Table 3.1 for barcode concentrations.

44
Figure 4.8 Red microbead barcoded drops individually detected. Error bars represent one
standard deviation.
Figure 4.9 Histogram of peak signals from 5 red microbead barcoded drops mixture.
Reference Table 3.1 for barcode concentrations.
A mixture of single color green and red microbead barcoded drops was prepared
from drops made on a single drop maker and detected to verify the detection platform had
the ability to distinguish between the two colors. The barcode concentrations used for the

45
red and green drops were 33 and 149 beads per drop corresponding to barcode number 1
and 3 from Table 3.1. Detection data was collected for 1 min for a total of ~2000 data
points. The peak signals from the green and red PMTs are plotted against each other in
Figure 4.10.
Figure 4.10 PMT peak signal data of a mixture of four green and red barcoded drops.
Each cluster represents a barcoded drop. Red barcoded drops are on the y-axis while
green barcoded drops are on the x-axis. WEKA cluster identification of this data can be
seen in Figure 2.15.
It can be seen in Figure 4.10 that four distinct populations emerge related to the
four barcoded drops in the mixture. The data clusters along the y-axis refer to the red
microbead barcoded drops while the data clusters along the x-axis refer to the green
microbead barcoded drops. The rising linear trend of the green barcoded drop data is
most likely caused by a fluorescent red tail from the green microbeads. The green
microbeads have a low emission in the red spectra (600-650 nm) that is picked up by the
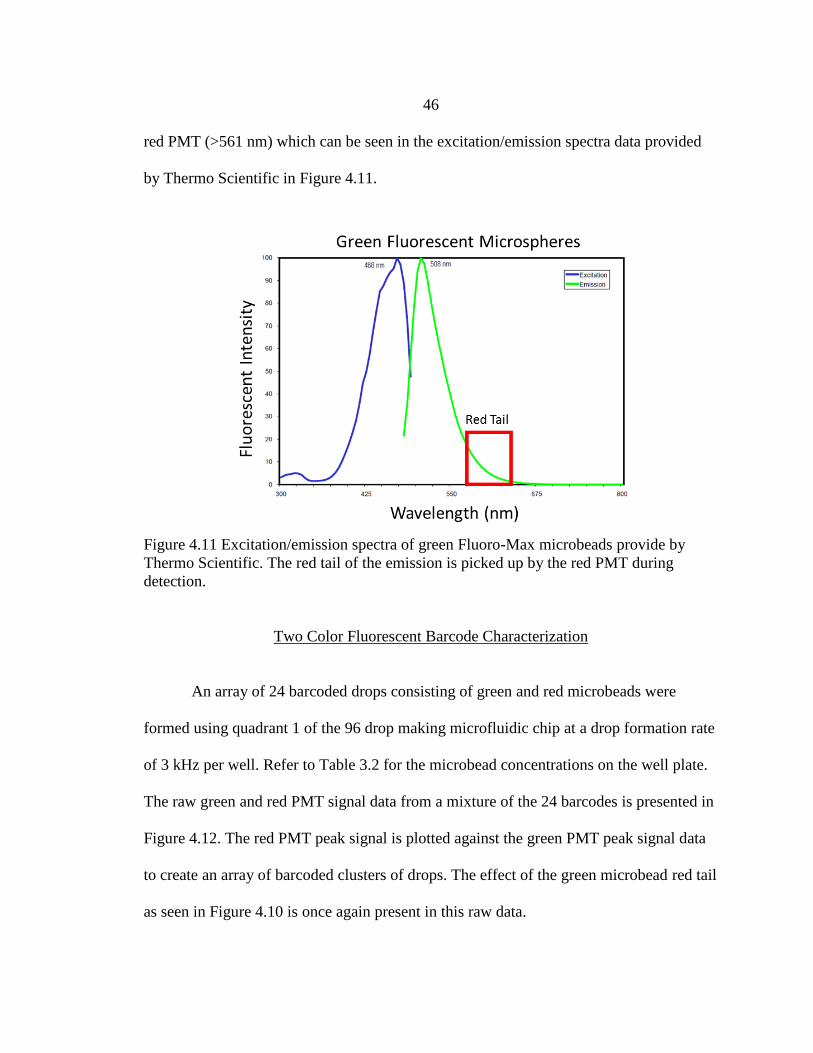
46
red PMT (>561 nm) which can be seen in the excitation/emission spectra data provided
by Thermo Scientific in Figure 4.11.
Figure 4.11 Excitation/emission spectra of green Fluoro-Max microbeads provide by
Thermo Scientific. The red tail of the emission is picked up by the red PMT during
detection.
Two Color Fluorescent Barcode Characterization
An array of 24 barcoded drops consisting of green and red microbeads were
formed using quadrant 1 of the 96 drop making microfluidic chip at a drop formation rate
of 3 kHz per well. Refer to Table 3.2 for the microbead concentrations on the well plate.
The raw green and red PMT signal data from a mixture of the 24 barcodes is presented in
Figure 4.12. The red PMT peak signal is plotted against the green PMT peak signal data
to create an array of barcoded clusters of drops. The effect of the green microbead red tail
as seen in Figure 4.10 is once again present in this raw data.

47
Figure 4.12 Raw peak PMT signal data of a 24 green and red microbead barcoded drop
mixture.
A signal filtering method was proposed to correct for, and eliminate the red tail
signal of the green microbeads. In order to do this, we must first understand the
interactions of the fluorescent signals we are measuring. The system provides a green
PMT signal (G’) and a red PMT signal (R’) which are the sums of the respective
microbead fluorescent color signal and fluorescent signal overlap from other sources. If
we assume the only other source of fluorescent signal is from other microbeads in the
drop, then the sum of each signal becomes
where G and R are the green and red bead signals respectively, g(R) is the green
fluorescent signal of red micro beads as a function of R, and r(G) is the red signal of
𝐺′ = 𝐺 + 𝑔(𝑅)
𝑅′ = 𝑅 + 𝑟(𝐺)

48
green microbeads as a function of G. Finding these values required the measurement of
single color green and red barcoded mixtures from quadrant 2 and 3, respectively, in
parallel with the detection of the 24 barcoded mixture from quadrant 1. The results of
these measurements are presented in Figure 4.13 below. It should be noted that quadrant
4 was prepared without microbeads and when detected there was no measureable
fluorescent signal from water in drops alone.
Figure 4.13 Effect of red and green fluorescent tails. a.) Peak PMT signal data of green
microbead barcoded drops displaying a strong fluorescent red tail signal. b.) Peak PMT
signal data of red microbead barcoded drops displaying a negligible fluorescent green tail
signal when compared to the magnitude of the green microbead peak signals in the 24
barcoded drop mixture.
The results presented in Figure 4.13 indicate that while both green and red
microbeads fluoresce in the opposing color space, green microbeads have a much greater
impact. It is assumed from this data that any green signal from red microbeads (g(R)) is
negligible. The previous equations now become
𝑔(𝑅) ≈ 0
𝐺′ = 𝐺
𝑅′ = 𝑅 + 𝑟(𝐺′)

49
where the red signal from green microbeads (r(G’)) is now a function of G’ and is equal
to the linear trendline found in Figure 4.13(a). The r(G’) function was then used on the
raw 24 barcode data to find R from R’. The results of this first-pass filtering is presented
in Figure 4.14; notice how the removal of the red tail signal now provides a more
rectangular shaped array.
Figure 4.14 First-pass filtering of peak PMT signal data of a 24 green and red microbead
barcoded drop mixture. The red tail signal from the green microbeads has been removed.
We can now more clearly see the emergence of clusters of individual barcodes.
To clearly identify the barcodes from this first-pass filtered data, a second-pass of
filtering is applied to remove the overlap of the clustered barcodes. This is done by using
WEKA machine learning software to identify the mean and standard deviation of each
green and red barcode population using the EM method [49]. Microbead signal data was
assumed to follow a Gaussian curve [42] and signal data outside a standard deviation

50
from the mean could be removed, similar to the filtering performed by Sjostrom et al. [3].
Second-pass filtering of the red PMT signal is compared to raw and first-pass data in
Figure 4.15.
The green and red PMT signals are filtered according to the data provided by
WEKA and then sorted in Excel to identify sorted barcode populations. The filtered data
set of the 24 barcode signals from Figure 4.15 is presented in Figure 4.16 showing an
array of 24 barcoded drop populations. The current method filters based on the green and
red signals provided by the PMTs which leads to incorrectly removing data from a cluster
if it does not fall within the filtering parameters. This is partly due to WEKA being
unable to individually identify the 24 barcodes due to close overlapping of the
populations. This restricts the WEKA analysis to sorting based only on the 5 green or red
barcode populations collected from the respective PMT peak signals as seen in Figure
4.15(c). It is thought that the overlap of populations was caused by poor pipetting volume
control when preparing barcodes 1-3 on the well plate. Further optimization of the well
plate preparation for barcodes will be required to limit the overlap of barcoded clusters in
order for more precise filtering through WEKA using the EM method.

51
Figure 4.15 Red PMT peak signal data of a 24 green and red microbead barcoded
mixture. a.) Raw data b.) First-pass filter to remove red tail signal of green microbeads.
c.) Second-pass filter to remove overlapping barcode signals outside a standard deviation
from the mean of each signal population. Numbers above peaks refer to the barcode, refer
to Table 3.1 for microbead concentrations.

52
Figure 4.16 Second-pass filtering of peak PMT signal data of a 24 green and red
microbead barcoded drop mixture. Signal overlap of each barcoded cluster has been
removed providing an array of 24 clusters of barcoded drops. The vertical and horizontal
numbers on the graph represent the red and green barcodes used respectively.
The detection of the 24 barcode populations seen in Figure 4.16 involved 1 min of
data collection at a rate of 330 Hz, which resulted in 20k data points. The second-pass
filter lowered the usable drop data to 10k data points (50% retention) with an average of
400 drops per barcode and a coefficient of variation (CV) of 35%. The high CV value
was most likely due to the pipette volume issue described previously and is largely
affected by only a fraction of the barcodes. A breakdown of the number of drops per
barcode is shown in Table 4.1.

53
Table 4.1 Population of drops per barcode combination in a 24 green and red microbead
barcoded drop mixture. Refer to Table 3.1 for barcode microbead concentration.
Barcode Verification
A range of blue microbeads were randomly added to quadrant 1 wells (equivalent
to barcode 1-4 concentrations) in order to simulate an assay signal. This was done to
verify the barcoded populations found using the microbead labeling method were
indicating the correct wells the barcodes originated from. The viability of using blue
microbeads for this purpose was first checked in the same manner as the green and red
variants. Blue microbeads were encapsulated into 50 µm diameter drops at concentrations
following Table 3.1 (barcode 1-5) for fluorescent detection to determine if the blue
microbeads followed the same trend as the green and red microbeads as seen in Figure
4.6 and 4.8. The results of this test is shown in Figure 4.17. The various blue microbead
concentrations appear to be distinguishable from each other and follow a linear trend
similar to the green and red microbeads.

54
Figure 4.17 Blue microbead barcoded drops individually detected. Error bars represent
one standard deviation.
In addition to adding blue microbeads to the 24 green and red microbead
barcoded wells of quadrant 1, the pipetting and dilution steps for preparing the well plate
were optimized to eliminate errors. The result of this can be seen in the raw signal data of
quadrant 1 drops in Figure 4.18 with an image of the drops entering the detection chip in
Figure 4.19. The comparison to the raw data of the first attempt in Figure 4.12 shows a
uniform distribution of clusters with distinguishable borders. As before, the effect of the
red tail from the green microbeads can be seen; however, with the addition of blue
microbeads and a third blue channel of detection, the effect of fluorescent tails for each
microbead color was required to be re-investigated. Quadrant 2, 3, and 4 each had 5 wells
that were filled with green, red and blue microbeads, respectively, equivalent to barcode
1-5 concentrations following Table 3.1. The fluorescent detection data of these drops are
shown in Figure 4.20. The green microbeads show significant blue and red tails with a

55
linear relationship that will be used for first-pass filtering of the raw barcode signal data.
The blue and red microbeads have either insignificant tails or random noise present.
Figure 4.18 Raw peak PMT signal data of a 24 green and red microbead barcoded drop
mixture with blue microbeads.
Figure 4.19 Re-injection of barcoded drops from microfluidic device into detection chip.
Shading of drops comes from the various microbeads encapsulated in the drops.

56
Figure 4.20 Effect of blue, green, and red fluorescent tails. a.) Peak PMT signal data of
green microbead barcoded drops displaying a strong fluorescent blue tail signal. b.) Peak
PMT signal data of green microbead barcoded drops displaying a strong fluorescent red
tail signal. c.) Peak PMT signal data of red microbead barcoded drops displaying
negligible random blue signal noise. d.) Peak PMT signal data of red microbead barcoded
drops displaying a negligible fluorescent green tail signal. e.) Peak PMT signal data of
blue microbead barcoded drops displaying negligible red signal noise. f.) Peak PMT
signal data of blue microbead barcoded drops displaying a negligible fluorescent green
tail signal.

57
A first-pass filtering of the blue and red tail fluorescent signals from the green
microbeads was removed from the blue and red PMT peak signal data respectively. The
first-pass filtering of the blue PMT peak signal is shown in Figure 4.21. Without the
removal of the blue tail of the green microbeads, the two intermediate blue microbead
signals would be indistinguishable from each other. Barcoded clusters were then
identified from the green and red PMT peak signal data to match the blue microbead
assay signal to a specific barcode, and therefore the well it originated from. The
DBSCAN package on WEKA was used to identify clusters based on data point density
and the output can be found in Figure 4.22. A limitation of DBSCAN is that it cannot
take into account increasing variance throughput the data as is seen here with increasing
fluorescence signals. This increased nearest neighbor spacing at greater fluorescent
signals results in smaller identified clusters due to the decreasing density of the clusters.
This is evident in Figure 4.22 as the PMT peak signal increases, the size of the identified
clusters decreases. An iterative approach of using DBSCAN to identify a subset of
clusters at a time while moving from high to low density areas may alleviate the cluster
size distribution issue; this will be added to the planned future work of the project.
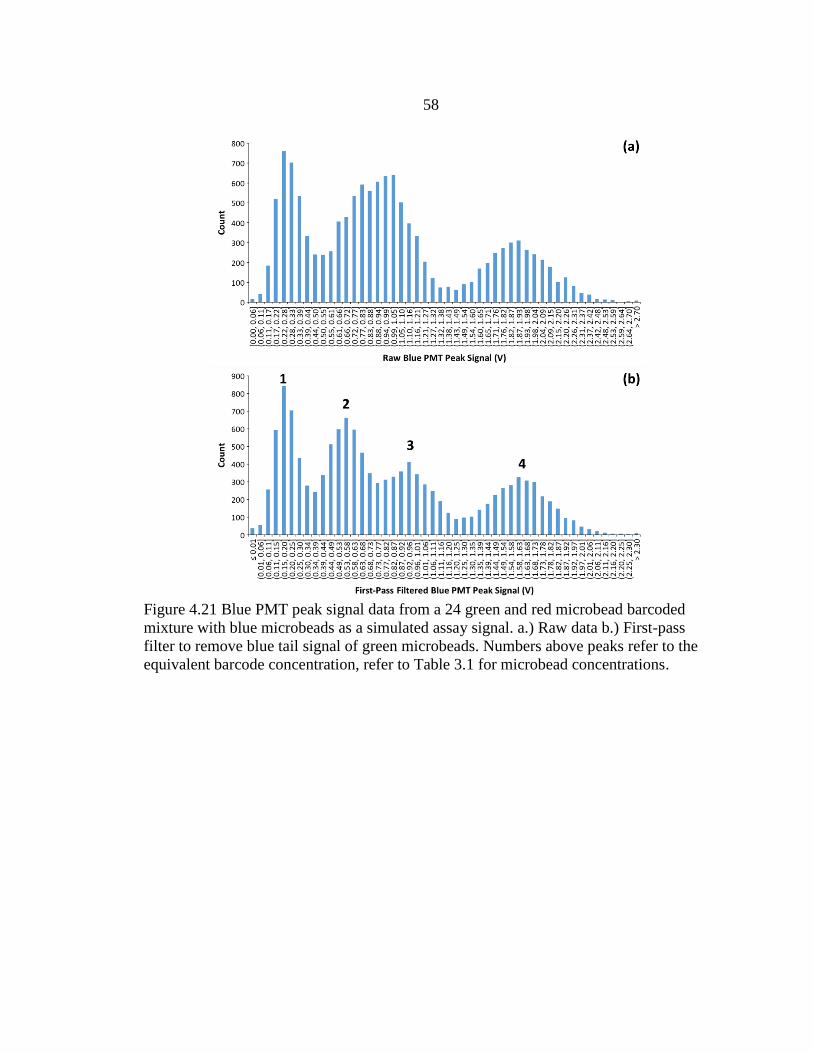
58
Figure 4.21 Blue PMT peak signal data from a 24 green and red microbead barcoded
mixture with blue microbeads as a simulated assay signal. a.) Raw data b.) First-pass
filter to remove blue tail signal of green microbeads. Numbers above peaks refer to the
equivalent barcode concentration, refer to Table 3.1 for microbead concentrations.

59
Figure 4.22 DBSCAN identification of barcoded data clusters from a 24 green and red
microbead barcoded drop mixture. First-pass filtering of the red PMT peak signal data
has been applied to remove the red tail of the green microbeads. The vertical and
horizontal numbers on the graph represent the red and green barcodes used respectively.
The detection of the 24 barcode populations seen in Figure 4.22 involved 1 min of
data collection at a rate of 200 Hz, which resulted in 13k data points. The DBSCAN filter
lowered the usable drop data to 9k data points (70% retention) with an average of 389
drops per barcode and a coefficient of variation (CV) of 34%. The high CV value in this
case is due to the inability of DBSCAN to account for changing cluster density
throughout a data set. As mentioned previously, an iterative approach to applying
DBSCAN to filter the data may lower the CV value. A breakdown of the number of
drops per barcode is shown in Table 4.2.

60
Table 4.2 Population of drops per barcode combination in a 24 green and red microbead
barcoded drop mixture with blue microbeads as a simulated assay signal. Refer to Table
3.1 for barcode microbead concentration.
The next step was to verify the contents of the barcoded wells which had blue
microbeads added. This was done by first randomly selecting four barcoded drop
populations to be used as controls. These populations included one of each of the four
blue microbead barcoded concentrations. The blue PMT peak signal data gathered from
the barcoded drop population controls was then used to create a standard curve relating
PMT signal data to blue microbead concentration within the drops. The standard curve
was then used to convert blue PMT peak signal data from barcoded drop clusters into
blue microbead concentrations. As expected, 4 groups of 6 similar blue microbead
concentration values emerged. The averaged results are shown in Table 4.3. A single
factor ANOVA was performed on each group to verify if the blue microbead
concentrations calculated from the barcoded clusters were not significantly different
(confirm the null hypothesis); however, a p-value of ~0 was obtained for each group.
This indicates that while the same amount of blue microbeads was added to the wells of
each group, it does not necessarily mean that when encapsulated they will provide the

61
same signal. Differences in the mean signal from each population may be due to the
varying amount green and red microbeads used for barcoding purposes in the drops. It is
possible that either color of microbead may affect the blue signal. An attempt to
minimize this effect was done by filtering out the blue tail seen from the green
microbeads using a linear model. It is possible that a more complex non-linear model is
needed to account for the effect of other fluorescing microbeads within the drop.
Furthermore, the current method fit a linear line to a large spread of data, and it is
possible that during filtering of the blue tail there was either too much or too little of
signal removed. Another solution to the overlapping signal problem is to use quantum
dots in the future. Quantum dots (QD) are unique in that their emission spectra is
narrower compared to the microbeads presented here and can excite from most common
light sources. QDs would be beneficial in eliminating the unwanted mix of barcode and
assay fluorescent signals.
Table 4.3 Calculated blue microbead assay concentrations from a 24 green and red
microbead barcoded drop mixture.
It should be noted that while an ANOVA test proved the calculated blue
microbead assay concentrations within their respective grouping are significantly

62
different, the values found were still rather precise with CV values ranging from 4.8% to
8.7%. At the time of this writing, it is suggested that an assay be run with only 24 active
wells and use each quadrant as a replicate to increase the accuracy of the assay until the
method is improved to be used with 96 active wells. This is not to say that 96 unique
samples cannot be used in an assay with this method, but accuracy and repeatability will
be reduced when compared to using replicate quadrants. Furthermore, correctly
identifying the blue microbead simulated assay signals demonstrates each drop maker on
the device is functioning properly.
Confocal Imaging of Microbead Barcoded Drops
Confocal images of blue, green, and red microbeads and drops containing blue
microbeads with concentrations equivalent to 330 beads per drop are shown in Figure
4.23. It was observed that green beads emitted a blue and red fluorescent signal on the
confocal microscope (not shown), similar to the trend seen on the fluorescent detection
platform. Furthermore, all colors of microbeads imaged were visible when using the 405
nm laser only, suggesting a single UV laser is all that is needed for detection.
Images of a 24 green/red barcoded mixture with blue microbeads added as a
simulated assay signal are shown in Figure 4.24. These drops have been captured in a
drop-spot device which traps drops within a chamber on the device. It appears that the
beads within the drops occupy a large percentage of the drop volume; however, a
calculation of the maximum concentration used, including blue, green, and red

63
microbeads (892 beads/drop), reveals the microbeads occupy only 0.5% of the drop
volume (assuming a microbead diameter of 0.91 µm and drop diameter of 50 µm).
Figure 4.23 Confocal images of: a.) green microbeads b.) red microbeads c.) blue
microbeads d.) 50 µm drops containing blue microbeads. Microbeads are 0.91 µm in
diameter. 405 nm and 476 nm lasers were used for imaging.
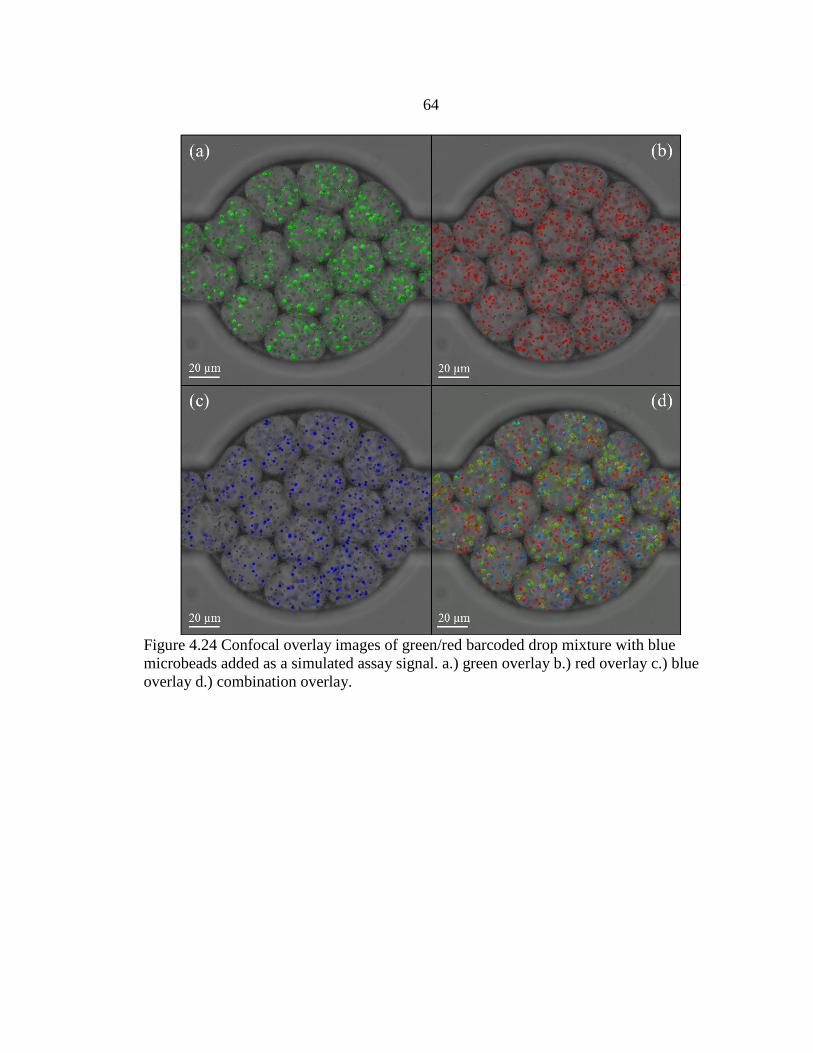
64
Figure 4.24 Confocal overlay images of green/red barcoded drop mixture with blue
microbeads added as a simulated assay signal. a.) green overlay b.) red overlay c.) blue
overlay d.) combination overlay.

65
CHAPTER 5
CONCLUSION
A microfluidic platform for encapsulating and detecting up to 96 sample inputs by
way of fluorescently and spatially barcoded drops has been designed and fabricated. Flow
characterization of the microfluidic chip of this system provided a state diagram for the
jetting-to-dripping region based on the Wein and Caout number. The state diagram helped
optimize flow rate selection to ensure proper drop formation in the dripping regime was
occurring. Single color barcoded drops were studied to determine optimal detection
parameters and microbead concentrations for two color barcoding. A method to barcode
drops with a combination of green and red fluorescent microbeads (33 to 330 microbeads
per drop) using a single quadrant of the microfluidic chip, for a total of 24, was presented
and shown to provide 24 distinguishable signal populations when measured with the
fluorescent detection platform. A verification assay using blue fluorescent microbeads
(33 to 232 microbeads per drop) as a simulated assay signal was performed to prove the
viability of three color fluorescent detection. A peak fluorescent signal filtering method
was developed to remove the blue and red tail signal emitted by the green microbeads.
WEKA machine learning software was used to identify barcoded clusters and remove
overlapping signals between the clusters using the DBSCAN density-based clustering
algorithm. An average of 389 drops per barcode (after filtering) of a total of 24 barcodes
were detected in 1 min (200 Hz detection rate) on the detection platform with a CV of
34% and a data retention rate of 70% after filtering. An iterative approach to clustering

66
using DBSCAN to minimize density changes in the data set may improve the CV value
of barcoded drop clusters by correctly identifying a greater fraction of each cluster. The
method can then be expanded across the other three quadrants of the microfluidic chip to
provide a total of 96 barcoded drop populations.
Future work with this platform should include replicating a broth dilution of E.
coli and select growth inhibitors (e.g. antibiotics) and comparing the minimum inhibitory
concentrations (MIC) found to published work. Further optimization of barcode creation
and detection is also suggested to reduce signal overlap and increase the accuracy of
detecting barcode signal clusters to reduce the loss of data during filtering. The use of
quantum dots as barcodes is suggested due to their narrower emission peaks and small
size. An Excel template or MATLAB program for automatically analyzing and sorting
data would increase the ease of use for other users and further decrease the time from
sample preparation to data presentation.
The results presented and discussed in this thesis show the microfluidic platform
has the potential to be a useful tool in biological assays involved with tracking a large
number of microbial growth populations in a well plate format. The microfluidic chip can
be easily integrated into current protocols to improve efficiency by reducing required cell
growth times and increase resolution by turning a single well into millions of isolated
drops. The power of microfluidics is promising for high-throughput combinatorial testing
of microbial growth, yet many challenges still exist and further research and development
are needed.

67
REFERENCES CITED
1. Guo, M.T., et al., Droplet microfluidics for high-throughput biological assays.
Lab Chip, 2012. 12(12): p. 2146-55.
2. Rotem, A., et al., High-Throughput Single-Cell Labeling (Hi-SCL) for RNA-Seq
Using Drop-Based Microfluidics. PLoS One, 2015. 10(5): p. e0116328.
3. Sjostrom, S.L., H.N. Joensson, and H.A. Svahn, Multiplex analysis of enzyme
kinetics and inhibition by droplet microfluidics using picoinjectors. Lab Chip,
2013. 13(9): p. 1754-61.
4. Miller, O.J., et al., High-resolution dose-response screening using droplet-based
microfluidics. Proc Natl Acad Sci U S A, 2012. 109(2): p. 378-83.
5. Schaerli, Y. and F. Hollfelder, The potential of microfluidic water-in-oil droplets
in experimental biology. Molecular Biosystems, 2009. 5(12): p. 1392-1404.
6. Theberge, A.B., et al., Microdroplets in microfluidics: an evolving platform for
discoveries in chemistry and biology. Angewandte Chemie International Edition,
2010. 49(34): p. 5846-5868.
7. Love, J.C., et al., A microengraving method for rapid selection of single cells
producing antigen-specific antibodies. Nat Biotech, 2006. 24(6): p. 703-707.
8. Cubaud, T. and T.G. Mason, Capillary threads and viscous droplets in square
microchannels. Physics of Fluids, 2008. 20(5): p. 053302.
9. Abate, A.R., J. Thiele, and D.A. Weitz, One-step formation of multiple emulsions
in microfluidics. Lab Chip, 2011. 11(2): p. 253-8.
10. Utada, A.S., et al., Dripping, Jetting, Drops, and Wetting: The Magic of
Microfluidics. MRS Bulletin, 2007. 32(09): p. 702-708.
11. Utada, A.S., et al., Dripping to jetting transitions in coflowing liquid streams.
Physical review letters, 2007. 99(9): p. 094502.
12. Duffy, D.C., et al., Rapid prototyping of microfluidic systems in poly
(dimethylsiloxane). Analytical chemistry, 1998. 70(23): p. 4974-4984.
13. Bhattacharya, S., et al., Studies on surface wettability of poly(dimethyl) siloxane
(PDMS) and glass under oxygen-plasma treatment and correlation with bond
strength. Microelectromechanical Systems, Journal of, 2005. 14(3): p. 590-597.

68
14. Eddings, M.A., M.A. Johnson, and B.K. Gale, Determining the optimal PDMS–
PDMS bonding technique for microfluidic devices. Journal of Micromechanics
and Microengineering, 2008. 18(6): p. 067001.
15. Jo, B.H., et al., Three-dimensional micro-channel fabrication in
polydimethylsiloxane (PDMS) elastomer. Microelectromechanical Systems,
Journal of, 2000. 9(1): p. 76-81.
16. Mosadegh, B., et al., Simultaneous fabrication of PDMS through-holes for three-
dimensional microfluidic applications. Lab Chip, 2010. 10(15): p. 1983-6.
17. Cortese, B., M.C. Mowlem, and H. Morgan, Characterisation of an irreversible
bonding process for COC–COC and COC–PDMS–COC sandwich structures and
application to microvalves. Sensors and Actuators B: Chemical, 2011. 160(1): p.
1473-1480.
18. Sunkara, V., et al., Simple room temperature bonding of thermoplastics and
poly(dimethylsiloxane). Lab Chip, 2011. 11(5): p. 962-5.
19. Vlachopoulou, M.E., et al., A low temperature surface modification assisted
method for bonding plastic substrates. Journal of Micromechanics and
Microengineering, 2009. 19(1): p. 015007.
20. Kardas, P., et al., A systematic review and meta-analysis of misuse of antibiotic
therapies in the community. International journal of antimicrobial agents, 2005.
26(2): p. 106-113.
21. Spellberg, B., et al., The epidemic of antibiotic-resistant infections: a call to
action for the medical community from the Infectious Diseases Society of
America. Clinical Infectious Diseases, 2008. 46(2): p. 155-164.
22. Sommer, M.O., G. Dantas, and G.M. Church, Functional characterization of the
antibiotic resistance reservoir in the human microflora. science, 2009. 325(5944):
p. 1128-1131.
23. Wilkins, T.D., et al., Standardized Single-Disc Method for Antibiotic
Susceptibility Testing of Anaerobic Bacteria. Antimicrobial Agents and
Chemotherapy, 1972. 1(6): p. 451-459.
24. Stalons, D.R. and C. Thornsberry, Broth-dilution method for determining the
antibiotic susceptibility of anaerobic bacteria. Antimicrobial agents and
chemotherapy, 1975. 7(1): p. 15-21.

69
25. Chen, C.H., et al., Antimicrobial Susceptibility Testing Using High Surface-to-
Volume Ratio Microchannels. Analytical Chemistry, 2010. 82(3): p. 1012-1019.
26. Boedicker, J.Q., et al., Detecting bacteria and determining their susceptibility to
antibiotics by stochastic confinement in nanoliter droplets using plug-based
microfluidics. Lab Chip, 2008. 8(8): p. 1265-72.
27. Jiang, L., et al., Digital antimicrobial susceptibility testing using the MilliDrop
technology. European Journal of Clinical Microbiology & Infectious Diseases,
2016: p. 1-8.
28. Du, G.S., et al., Cell-based drug combination screening with a microfluidic
droplet array system. Anal Chem, 2013. 85(14): p. 6740-7.
29. Clausell-Tormos, J., et al., Droplet-based microfluidic platforms for the
encapsulation and screening of Mammalian cells and multicellular organisms.
Chem Biol, 2008. 15(5): p. 427-37.
30. Kalashnikov, M., et al., A microfluidic platform for rapid, stress-induced
antibiotic susceptibility testing of Staphylococcus aureus. Lab Chip, 2012. 12(21):
p. 4523-32.
31. Mohan, R., et al., A multiplexed microfluidic platform for rapid antibiotic
susceptibility testing. Biosens Bioelectron, 2013. 49: p. 118-25.
32. Besant, J.D., E.H. Sargent, and S.O. Kelley, Rapid electrochemical phenotypic
profiling of antibiotic-resistant bacteria. Lab Chip, 2015. 15(13): p. 2799-807.
33. Churski, K., et al., Rapid screening of antibiotic toxicity in an automated
microdroplet system. Lab Chip, 2012. 12(9): p. 1629-37.
34. Hess, D., et al., High-throughput, quantitative enzyme kinetic analysis in
microdroplets using stroboscopic epifluorescence imaging. Anal Chem, 2015.
87(9): p. 4965-72.
35. Chen, J., et al., Assembly-line manipulation of droplets in microfluidic platform
for fluorescence encoding and simultaneous multiplexed DNA detection. Talanta,
2015. 134: p. 271-7.
36. Han, S.W., E. Jang, and W.-G. Koh, Microfluidic-based multiplex immunoassay
system integrated with an array of QD-encoded microbeads. Sensors and
Actuators B: Chemical, 2015. 209: p. 242-251.

70
37. Kaminski, T.S., et al., Automated generation of libraries of nL droplets. Lab Chip,
2012. 12(20): p. 3995-4002.
38. Zec, H., T.D. Rane, and T.H. Wang, Microfluidic platform for on-demand
generation of spatially indexed combinatorial droplets. Lab Chip, 2012. 12(17):
p. 3055-62.
39. Gielen, F., et al., A fully unsupervised compartment-on-demand platform for
precise nanoliter assays of time-dependent steady-state enzyme kinetics and
inhibition. Anal Chem, 2013. 85(9): p. 4761-9.
40. Abate, A.R., et al., DNA sequence analysis with droplet-based microfluidics. Lab
Chip, 2013. 13(24): p. 4864-9.
41. Klostranec, J.M., et al., Convergence of quantum dot barcodes with microfluidics
and signal processing for multiplexed high-throughput infectious disease
diagnostics. Nano Lett, 2007. 7(9): p. 2812-8.
42. Lin, G., et al., Magnetofluidic platform for multidimensional magnetic and optical
barcoding of droplets. Lab Chip, 2015. 15(1): p. 216-24.
43. Macosko, E.Z., et al., Highly Parallel Genome-wide Expression Profiling of
Individual Cells Using Nanoliter Droplets. Cell, 2015. 161(5): p. 1202-14.
44. Klein, A.M., et al., Droplet barcoding for single-cell transcriptomics applied to
embryonic stem cells. Cell, 2015. 161(5): p. 1187-201.
45. Wang, Z., et al., SERS-fluorescence joint spectral encoding using organic–metal–
QD hybrid nanoparticles with a huge encoding capacity for high-throughput
biodetection: putting theory into practice. Journal of the American Chemical
Society, 2012. 134(6): p. 2993-3000.
46. Yang, C.-G., et al., A microfluidic concentration-gradient droplet array generator
for the production of multi-color nanoparticles. Lab on a Chip, 2013. 13(14): p.
2815-2820.
47. Chen, Y., A.W. Gani, and S.K. Tang, Characterization of sensitivity and
specificity in leaky droplet-based assays. Lab on a Chip, 2012. 12(23): p. 5093-
5103.
48. Mazutis, L., et al., Single-cell analysis and sorting using droplet-based
microfluidics. Nat Protoc, 2013. 8(5): p. 870-91.

71
49. Hall, M., et al., The WEKA data mining software: an update. ACM SIGKDD
explorations newsletter, 2009. 11(1): p. 10-18.
50. Holtze, C., et al., Biocompatible surfactants for water-in-fluorocarbon emulsions.
Lab on a Chip, 2008. 8(10): p. 1632-1639.
51. CHANG-LAB drive on Center for Biofilm server at Montana State University.
Contact Connie Chang at [email protected]