Embed Size (px)
Citation preview

JULY/AUGUST 2006 PHARMACEUTICAL ENGINEERING 1
Supply Chain Techniques
©Copyright ISPE 2006
This articleevaluates thepost-discoverysupply chain todeterminewhether it canbe evaluated byconventionalanalyticalmethods andimproved by theapplication ofsupply chaintechniques. Itconsiders theimpact offactors,includingchanges inlegislation anddrug deliverymethods.
A Holistic Analysis of PharmaceuticalManufacturing and Distribution: AreConventional Supply Chain TechniquesAppropriate?
by Christopher J. Savage, Kevin J. Roberts, andXue Z. Wang
Introduction
The pharmaceutical industry operatesglobally, generates a massive amountof revenue (Table A) and affects almosteveryone in the developed world. Drug
treatment is the most common form ofhealthcare intervention and represents thehighest non-staff revenue cost in the UK’sNational Health Service (NHS) with estimatessuggesting that 70% of the UK population aretaking medication on any given day.11 Theindustry traditionally enjoys high profits withfinished product margins as high as 30%, no-tionally justified by the high R&D, drug devel-opment, and marketing costs estimated at US$800 million to US $1 billion per marketedStock Keeping Unit (SKU).10
Recently, these profits have come underincreasing scrutiny as a result of government
policies, genericcompet i t ion ,and wholesalerobjectives. Lo-gistics costs, asa percentage ofsales revenue,tend to be lowerthan in otherindustries dueto the highvalue of thegoods.2 Never-theless, phar-m a c e u t i c a lcompanies arebecoming more
interested in optimizing their supply chains tosave costs and perhaps, more significantly,gain competitive advantage. This article fo-cuses on adopting a holistic approach in orderto try to identify problems that hinder optimi-zation of the supply chain through a collabora-tive project involving the Institute of ParticleScience and Engineering of the University ofLeeds and the Division of Transport and Logis-tics of the University of Huddersfield. Data wascollected through discussions and workshopsessions with a number of key UK pharmaceu-tical production companies as well as pharma-cists from the UK, New Zealand, and the USA.The work summarized in this article providesthe foundation for a larger project by examin-ing the basic premise and potential future ap-proaches.
Pharmaceutical Supply Chains:A Divided Structure
Overall, the pharmaceutical industry can bebroadly divided into two market segments; ethi-cal (prescription) and “over the counter” prod-ucts. This work focused on the ethical segment,where two distinct supply chain components canbe clearly identified, i.e., the pre-production(Discovery) chain and the post-development (Pro-duction) chain. Both components, while clearlydifferent in their content and magnitude, formsignificant parts of the overall process respon-sible for converting an initial idea from discov-ery into a usable drug and delivering it to thepatient (or rather to the retailer or dispensingpharmacist). These two components intertwineto form a lengthy and complex supply chain that
Table A. Retailpharmacy sales, 12months to March 2005.4
Country US$ billions
United States 177.40
Canada 10.43
Germany 25.70
Italy 14.50
France 21.70
United Kingdom 15.70
Spain 10.60
Japan 59.00
Mexico 6.60
Brazil 5.30
Argentina 1.80
Total 348.73
Reprinted from
PHARMACEUTICAL ENGINEERING®
The Official Magazine of ISPE
July/August 2006, Vol. 26 No. 4

2 PHARMACEUTICAL ENGINEERING JULY/AUGUST 2006
Supply Chain Techniques
©Copyright ISPE 2006
is difficult to consider holistically and can lead to a protracted“time to market” for the resultant product. In addition, theoverall process could offer significant scope for improved effi-ciency and enhanced product profitability.
In the pre-production (Discovery) chain, the process ofdiscovering and developing a compound to produce an ethicaldrug in an approved format to be used by the patient (Figure1), can take as long as 15 years although a seven yeardevelopment/approval time has been achieved for some mar-kets. As product filing usually takes place five years into thedevelopment cycle, this leaves only 10 years from the 20 yearpatent protection limit for the company responsible for theresearch to enjoy “unshared” benefit of their discovery.
As the diagram shows, for each drug successfully ap-proved, millions of potential compounds may be screened.Then typically, of those that enter the clinical stage, only onein 10 is eventually marketed. Further failures can occur aftera product is launched, e.g., when longer term side effectsbecome apparent. This can incur major expense or delay forreformulation/approval or in the worst case the abandon-ment of many years’ work/cost. All of these trial productshave high R&D costs that must be borne by those that are
brought successfully to market. Drug development also ismade more difficult by the ever-increasing complexity ofmolecules required in drug compound formulation, whichworks against the need for a quicker route to market. In thepost-development (production) chain, the more conventionalprocurement, production, delivery supply chain can rangefrom nine to 24 months depending on the drug product formand the associated manufacturing complexity.
Overall, there may be scope for time reduction in both ofthese supply chain components with the concomitant poten-tial for significant cost savings and possibly earlier relieffrom sickness or even prevention of death. Although both areimportant, this article will concentrate on the more conven-tional, post-development supply chain. As this project devel-ops, a parallel article will address the drug discovery chainitself leading to integration of the two components with theaim to examine their design interdependence and give anholistic view.
MethodologyInitial work has concentrated on gathering data on specific aswell as generalized pharmaceutical supply chains in order to
Figure 1. Schematic representation of the timescale for drug development to the marketplace with drug filing after five years into a 15 yeardrug development cycle.3
JULY/AUGUST 2006 PHARMACEUTICAL ENGINEERING 3
Supply Chain Techniques
©Copyright ISPE 2006
determine whether conventional logistics analysis techniquesand tools can be used to evaluate them and by doing so,identify the critical points for further, more detailed investi-gation. In addition, an evaluation has been made as towhether manufacturers of similar products structure theirsupply chains and respond to challenges in a similar manner.The method adopted was to gather data from a series of faceto face interviews and brainstorming workshop sessions, andby telephone and e-mail with a sample population of manu-facturers, intermediaries, and dispensing pharmacists. Theoutput from these11 was then combined, compared, and ana-lyzed.
Results and DiscussionAn Examination of the Post-DevelopmentSupply ChainThe first task was to try to determine whether pharmaceuti-cal supply chains are “different” to such an extent thatconventional techniques cannot be used. The initial responsefrom the group of interviewees was usually that “pharmaceu-ticals are different; they cannot be treated as normal com-modities.” The most frequently stated reasons for this werethe high cost and long duration for the R&D process and thepossible impact on life should a drug not be available on time.
There was also a commonly held belief that the productioncycle time is very short and highly reactive, a view that wouldbe contested by many supply chain professionals from otherfields. When challenged over these statements, their promul-gators were unable to substantiate them convincingly. Thissuggests that they are perceptions rather than facts and thatpharmaceutical supply chains could be modelled and opti-mized like any other. If one concludes that a pharmaceuticalsupply chain may be treated in a conventional manner, it isnevertheless important to acknowledge some factors that domake it more difficult to change existing methods or at leastto do so “quickly.” These include:
• a high degree of regulation at all stages of manufactureand distribution, this is arguably greater than any otherindustrial sector (including the aeronautical industry)
• In the case of ethical (prescribed) medicines, one must beaware that in most cases, the end user (patient) does notchoose the product, and that although the patient makesa contribution (e.g., prescription charge), it is the govern-ment of the country concerned that is the main financialcustomer.14
• complexity of regulatory environment where for example,changing any manufacturing facility, even something asapparently simple as a packaging site, will require mul-tiple approvals for each SKU for each sales territory. Thiscan take different lengths of time for the same product,e.g., Europe three months, Middle East three years
• the complex extended supply chain with its simultaneous,interwoven discovery, and production components
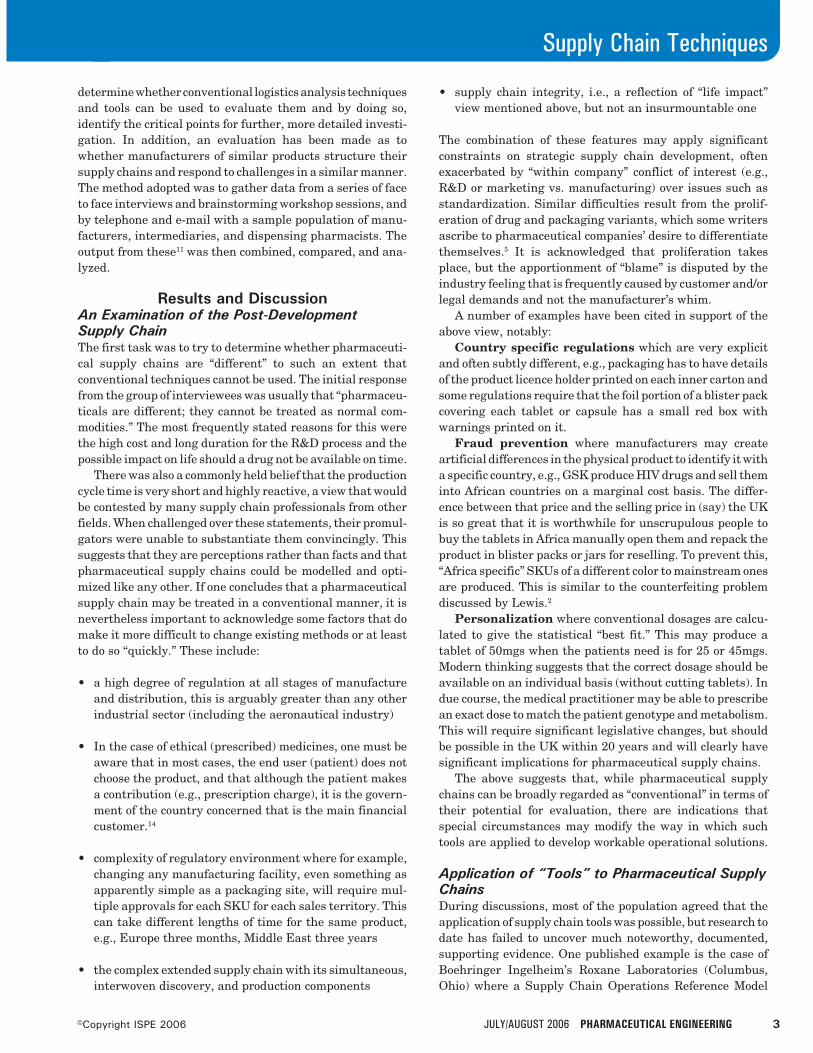
• supply chain integrity, i.e., a reflection of “life impact”view mentioned above, but not an insurmountable one
The combination of these features may apply significantconstraints on strategic supply chain development, oftenexacerbated by “within company” conflict of interest (e.g.,R&D or marketing vs. manufacturing) over issues such asstandardization. Similar difficulties result from the prolif-eration of drug and packaging variants, which some writersascribe to pharmaceutical companies’ desire to differentiatethemselves.5 It is acknowledged that proliferation takesplace, but the apportionment of “blame” is disputed by theindustry feeling that is frequently caused by customer and/orlegal demands and not the manufacturer’s whim.
A number of examples have been cited in support of theabove view, notably:
Country specific regulations which are very explicitand often subtly different, e.g., packaging has to have detailsof the product licence holder printed on each inner carton andsome regulations require that the foil portion of a blister packcovering each tablet or capsule has a small red box withwarnings printed on it.
Fraud prevention where manufacturers may createartificial differences in the physical product to identify it witha specific country, e.g., GSK produce HIV drugs and sell theminto African countries on a marginal cost basis. The differ-ence between that price and the selling price in (say) the UKis so great that it is worthwhile for unscrupulous people tobuy the tablets in Africa manually open them and repack theproduct in blister packs or jars for reselling. To prevent this,“Africa specific” SKUs of a different color to mainstream onesare produced. This is similar to the counterfeiting problemdiscussed by Lewis.2
Personalization where conventional dosages are calcu-lated to give the statistical “best fit.” This may produce atablet of 50mgs when the patients need is for 25 or 45mgs.Modern thinking suggests that the correct dosage should beavailable on an individual basis (without cutting tablets). Indue course, the medical practitioner may be able to prescribean exact dose to match the patient genotype and metabolism.This will require significant legislative changes, but shouldbe possible in the UK within 20 years and will clearly havesignificant implications for pharmaceutical supply chains.
The above suggests that, while pharmaceutical supplychains can be broadly regarded as “conventional” in terms oftheir potential for evaluation, there are indications thatspecial circumstances may modify the way in which suchtools are applied to develop workable operational solutions.
Application of “Tools” to Pharmaceutical SupplyChainsDuring discussions, most of the population agreed that theapplication of supply chain tools was possible, but research todate has failed to uncover much noteworthy, documented,supporting evidence. One published example is the case ofBoehringer Ingelheim’s Roxane Laboratories (Columbus,Ohio) where a Supply Chain Operations Reference Model

4 PHARMACEUTICAL ENGINEERING JULY/AUGUST 2006
Supply Chain Techniques
©Copyright ISPE 2006
Figure 2. Schematic representation of a generic ethical pharmaceutical manufacturing network.
(SCOR) was said to be used in conjunction with a system ofbenchmarks to improve customer service level and improveinventory turn by 44%.8
The apparent lack of evidence may not be significant assuch work is regarded as highly commercially sensitive, oftenkept “in house” and not published. Therefore, as the contribu-tors were not able to provide conclusive confirmation, it wasdecided to seek corroboration by treating the use of a particu-lar logistics technique within the supply chains of contribu-tors’ companies as an “indicator.” In order to decide whichindicator might be appropriate, it is necessary to understandthe nature of modern pharmaceutical supply chains, theirstructure, and what drives them. There are many variantseven within a given company; therefore to make a selectionand illustrate the reasons for the choice, the artificial “ge-neric” shown in Figure 2 has been derived from discussions/correspondence with members of the sample group.
Examination of the typical network structure used by ageneric ethical manufacturer, e.g., for the production oftablets and capsules, reveals that three major “stages” or“levels” in the production process or network are clearlyrecognized.
Primary StageThis concerns the manufacture of the Active PharmaceuticalIngredient (API). It is technology driven, usually taking placein “focused factories” that tend to operate globally, producingmaterial for many countries and is often outsourced ~ fre-quently dual sourced. The processes are multi-staged, usu-ally with stages occurring on different sites depending on theAPIs concerned. Process control is often weak, which com-
bined with scheduling issues, leads to proliferation of safetystock, poor asset utilization, and high levels of Work InProgress (WIP) capital.
Secondary StageThis is where the intermediate formulation processes such asblending, granulation, drying, compaction, and coating lead-ing up to and including the production of the “tablet” takeplace. These factories also may be considered as focused inthat they tend to specialize by physical product type, e.g.,sterile, topical, tablet, or capsule. The preferred locationwould be physically near to the market to serve regionsconsisting of one or more countries that are close to oneanother, but this may be overridden by political and/or eco-nomic factors. Units tend to be global, where the technology isdifficult, but regional where the technology is less critical orwell established. Products may be moved from global to re-gional factories as they mature (i.e., later in their life cycle) orwhen some specific “local formulation variants” can be pro-duced. Localized secondary manufacture may tend to increaseshould personalized prescribing become a reality.
Tertiary StageThis is where packaging takes place and is divided into threesignificant component types each of which may entail differ-ent manufacturing sub-stages, including:
• Drug product environment, i.e., packaging closest to thetablet (the blister pack or bottle) which is often critical asit provides immediate protection for the product and helpsmaintain its stability.

JULY/AUGUST 2006 PHARMACEUTICAL ENGINEERING 5
Supply Chain Techniques
©Copyright ISPE 2006
• Drug packaging, i.e., the carton that holds the blisterpacks or bottle together with the associated leaflet.
• Product identification, i.e., printing or labeling of a cartonwith specific information such as date, price, and licenseholder. It is also where customer (retailer) specific addi-tions are made, e.g., the addition of Radio FrequencyIdentification (RFID) tags to packs.
In general terms, the shape of the bigger companies’ net-works are influenced by the principle of continuous improve-ment and a continual tension between the desire to havecommon global supply and the need to satisfy specific localneeds. Networks are evolving and simplifying by reducingthe number of nodes, e.g., GSK reduced from 120 manufactur-ing sites worldwide four years ago to current 80 (as of May2005).
The traditional manufacturing approach has been that ofa “push” of production against forecast. This is changing andcompanies are moving towards more “leagile” networks wherelean and agile paradigms are combined within a total supplychain strategy to respond to volatile demand downstreamwhile providing level scheduling upstream.9 This is usuallyaccomplished by means of a de-coupling point so that thelater (secondary and tertiary manufacturing stages) aremade to order (pull) while the primary (API) manufacture iseffected via a controlled push to meet forecast. This pushprocess is often managed using Kanban. The latter is aJapanese term used to signal a cycle of replenishment forproduction and materials to maintain an orderly and efficientflow of materials throughout the manufacturing process withlow inventory and work in process. The key to successful“leagility” may be said to be “decoupling” the supply chain bymaking use of postponement where possible.13 Althoughpostponement has been proposed as a logistics and manufac-turing concept for a long time,1 and its use has led to improvedsupply chain performance,15 its use in the ethical pharmaceu-tical area is less and documented. Therefore, the use ofpostponement was selected as a specific indicator of theapplication of a conventional logistics tool to pharmaceuticalsupply chains.
Current Application of Postponement in CurrentPharmaceutical Supply ChainsWhen asked about the concept of postponement (or late stagecustomization as it is sometimes referred to in the industry),the response was often positive but varied. The degree towhich it has been adopted or is perceived to be able to be useddiffered greatly across countries and companies as well aswithin them. The restriction often cited was legislation, butit appears that the degrees of inventiveness and/or risk-taking that management were prepared to utilize were alsomajor factors.
The following responses to the question “Do you usepostponement?” give an indication of the range of reaction:
• Very positive: we are trying to make as much use ofpostponement as possible to decouple the supply chain,reduce stock holding/costs, while maintaining/improvingcustomer service.
• Positive (conditional): the simple answer is yes, wewould like to meet specific customer needs as late in thesupply chain as possible because we would consider thatthere is more mileage in demand driven supply. It is easilydismissed and while patient specific supplies, personal-ized medicines or ‘lot size 1’ are often discussed as con-cepts, the traditional methods of manufacture (big, pushdriven, batch sizes) are often used to block changes.
• Neutral (or confused?): there are two basic inventorymanagement approaches more pharmaceutical compa-nies are moving toward to demand forecasting.
• Negative: “this might happen somewhere in industry, butI doubt it.”
To seek clarification, more positive respondents were askedto give some examples of postponement as used in theircompany. The following is a sample of the responses:
• Common cartons: facilitated by attaching the leaflet tothe outside of the carton rather than inserting it.
• White box printing technology: by using high quality,limited color printing, “vanilla” cartons can be used for anumber of lower demand countries.
• Blister pack customization: is possible using “on-line”foil printing, but is much more difficult due to technicalissues, country specific variations, and the associated cost.It is probable that pre-printed foils will continue to bepreferred, and that manufacturers will concentrate ondeveloping packaging lines with faster changeover times.Thus, trading-off line-operating speed (less important asbatch sizes reduce) against set up/changeover time (be-coming more important as batch sizes become smaller andchangeovers more frequent)
• Two stage packing: one factory would pack bulk blisterstrips or bottles of tablets/capsules. These would be printedonly with common data, such as the brand, generic name,strength, batch number, expiry date. This factory couldutilize efficient high speed packaging equipment as it wouldbe packing for several markets. At a later date, the samefactory (or a different one) would complete the packaging byprinting any market specific data onto the pack using online printing equipment and would add a market specificleaflet to the pack. Typically, these packaging runs would besmaller and utilize semi-automated equipment – again thisis “under development.”

6 PHARMACEUTICAL ENGINEERING JULY/AUGUST 2006
Supply Chain Techniques
©Copyright ISPE 2006
Future Scope for Application of Postponementin Pharmaceutical Supply ChainsIt must be noted that most examples given above are ofpossibilities or developments rather than “current practice.”Therefore, respondents were asked what their views of thefuture scope for postponement were and whether they wereaware of any likely constraints.
Technology DevelopmentsThere are a number of technology developments that will havea significant impact on the supply chain and could lead to aneed for decoupling much closer to the end-user. For example,the possibility of remote prescribing by medical or nursingpractitioners via internet or sophisticated computer enabledtelephones. In addition, developments in knowledge basedsystems combined with the availability of genotype and com-plimentary information will enable greater tailoring of drugs,and combined with the above technology, will permit remotediagnosis and prescribing. Note, currently, all new UK-issuedprescriptions (excluding repeat prescriptions) should be issued“face to face.” Although not yet legal in the UK, the use of suchapproaches would enable patient specific prescriptions to besent directly to the dispensing pharmacists who are alreadyassuming a greater role in the management of drug treatment.This would have a significant impact on the supply chain andcould even lead to in-pharmacy formulation. In general largercompanies will listen to customer requirements and try tomeet them where appropriate. Specific requirements mayincrease supply chain complexity so they need to be evaluated(usually against a two-year development/approval horizon) todecide if they add sufficient value.
Inventory PolicyThis factor may be seen to override postponement benefits forwhich a number of key reasons emerged. First, medicalcriticality, i.e., the failure of drug availability, could causepatient harm and damage to the company’s image. Second,the balance of business financial risk reflecting the fact thatthe cost of the API is frequently much less than 25% of thefinal price and so the risk of revenue loss through failure tosupply, a “stock out” situation, is perceived as outweighingthe cost of stockholding. Finally, there is a clear need tomaintain safety stocks:
• Normal: to cover minor “blips” and irregularities in pro-duction or the supply chain
• Strategic: to cover a major disaster such as a factory fire orraw material supplier failure
Parallel Importing IssuesCommon pricing across Europe does not apply to pharmaceu-tical products; which means that customers may import atlower prices from non-manufacturing countries, which, inturn, frustrates the manufacturer’s inventory stock holding,production, and packaging plans making postponement moredifficult.
Drug Delivery Change ConstraintsMost companies are aware of the possibility (probability) ofchanges in methods of drug delivery (i.e., moving away fromtablets); therefore, current supply chains could become obso-lete in time. This means that any significant change to thesupply chain has to be assessed for potential advantagesagainst a possible relatively short time-frame (say 10 years?).Active companies are conducting research into methods tosuit alternatives. This is ongoing, but confidential.
Conclusions and Forward LookThe observations discussed in this article are from a small,sample population intended as a pilot for the extendedproject. Any findings based on them will require confirma-tion, but they do suggest that conventional supply chainanalysis methods can be used to evaluate ethical pharma-ceutical chains with a view to moving them toward optimumperformance, despite perceptions of “difference.” There arefactors that may restrict developments based on such evalu-ations and there are also valid differences between coun-tries due to legislative and valid cultural issues. Addition-ally, there seems to be a general move from the traditional“push” operations to more of a demand-led market-pullresponse model often leading to attempts to decouple thesupply chain to create “leagility.” Some companies are awareof shortcomings in their supply chains and are activelytrying to improve them, and of these, some understand andalready try to use techniques such as postponement. Thereis a clear awareness of possible developments in alternativemethods of prescription and of drug administration thatboth stimulate and restrict willingness to invest in supplychain development. However, the innate conservatism ofthe drug companies causes apparently unnecessary prolif-eration of inventory to avoid stocking out and being “beatento a market” even though such stock can and does degradeover time. Overall, differences between the manufacturingcompanies suggest that analysis to date requires develop-ment. Further, conclusions on the feasibility of the “holisticapproach” can only be safely drawn when the above findingson the “Post-Development” supply chain are combined withthe output from similar and related studies on the “Discov-ery Chain” component.
For the future, it will be important to investigate thescope for applying supply chain strategic philosophy in anintegrated manner covering both up and down stream pro-cess sectors to bring efficiency to the whole discovery andproduction supply chain. It also may be useful to comparepharmaceutical supply chains with those of commercialproducts with a high Intellectual Property Rights (IPR)product such as the semi-conductor industry. The first stepsin this process should be to map in detail a significantnumber of supply chains for similar products in differentcompanies. These can then be used as a basis for moredetailed analysis and comparison including determining amethod of measuring the effectiveness of these chains, aswell as the impact of any changes that might be suggested.The present work looked at ethical products that are in

JULY/AUGUST 2006 PHARMACEUTICAL ENGINEERING 7
Supply Chain Techniques
©Copyright ISPE 2006
patent. In the future, once a viable methodology has beenestablished, it would be interesting and useful to look atother aspects such as:
• ethical products in different stages of their life cycle (e.g.,after patent expires)
• generic ethical products• non-prescription pharmaceutical products (e.g., aspirin).
Interestingly, these are often subject to more frequentchanges in pack style, etc., than ethical products. They aresubject to less stringent regulations, but all changes stillneed approval.
• the downstream part of the delivery chain, including therole of wholesalers, hospitals, and governments
• what impact alternative drug delivery methods (e.g.,patches, inhalation, parenteral) would have on supplychain design
• the potential for remote and “personalized” prescribing,especially following individual genomic profiling
• how the design of individual supply chains could be influ-enced by and/or influence the drug development process
References1. Alderson, W., Marketing Efficiency and the Principle of
Postponement, Cost and Profit Outlook, 3. (1950).2. Data Monitor, Pharmaceutical Market Overview: Phar-
maceutical Logistics. Published 04/2002.3. Roberts, K. J., Undergraduate lecture notes for the MEng
degree in Pharmaceutical Engineering, developed in col-laboration with AstraZeneca, GSK, and Pfizer at theUniversity of Leeds, UK. (2004).
4. IMS, from http://open.imshealth.com/webshop2/dept.asp?dept_id=3 accessed 06/06/2005.
5. Lewes, C., “A Bitter Pill,” Logistics Europe, October 1999.6. Lewes, C., “Countering Counterfeiting,” Logistics Eu-
rope, January/February 2005.7. McCann, C., An investigation into postponement at the
packaging stage of pharmaceutical manufacture and theeffects on inventory levels and customer service, Finalyear research project: Division of Transport and Logis-tics, Huddersfield. (2005).
8. Mellody, J.P., Pharmaceutical Giant SCORs with Win-ning Supply Chain Initiative. In IOMA’s Report on Inven-tory Reduction. (1999).
9. Naylor, J.B., M.M. Naim, and D. Berry, “Leagility: Inte-grating the Lean and Agile Manufacturing Paradigm inthe Total Supply Chain,” MASTS working paper No. 47.(1997).
10. Samanya, J., Optimisation of the Pharmaceutical SupplyChain by Investigating the Drug Pre-Production (DrugDevelopment) Process, Final year research project: Insti-tute of Particle Science and Engineering, Leeds. (2005).
11. Savage, C. J., C. McCann, K.J. Roberts, X.Z. Wang, and J.Samanya, Proceedings of the Logistics Research NetworkAnnual Conference: International Logistics and SupplyChain Management, Plymouth, UK, ISBN number 1-9004564-13-5, pp. 415-422. (2005).
12. Shah, N., “Pharmaceutical Supply Chains: Key Issues
and Strategies for Optimisation,” In Proceedings of fourthinternational conference on foundations of computer-aided process operations. (2003).
13. Van Hoek, R., “The Thesis of Leagility Revisited,” Inter-national Journal of Agile Management Systems. (2000).
14. Whewell, R., Quoted in Analysis: Pharmaceuticals, Vol.2, No. 3, p. 196. (1999).
15. Yang, B. and N. Burns, “Implications of Postponement forthe Supply Chain,” International Journal of Prod. Res.,Vol. 41, No. 9, p. 2075. (2003).
AcknowledgmentsThe work outlined in the article was originally stimulated viaan industrial secondment of Kevin Roberts to AstraZeneca aspart of the Royal Academy of Engineering’s Industrial Fel-lowship Scheme whose support is gratefully acknowledged.We also would like to gratefully acknowledge Drs. MarkHindley (AstraZeneca), Paul Wregglesworth (AstraZeneca),Mark Philips (GSK), David Pavey, Pharmacist/Consultant(New Zealand), and Barbara Kelly (RBI) - for helpful discus-sions and Claire McCann and Jennifer Samaya for the helpin data collection.
About the AuthorsChristopher J. Savage is the Course Leaderfor the undergraduate suite of pathways of-fered in Transport and Logistics by the Schoolof Applied Sciences at the University ofHuddersfield, which he joined after 30 yearsin industry. Current research interests in-clude; investigating the potential of AIDCdevices in supply chain development, the
synergy obtained by the integration of low cost informationtechnologies within third party logistics providers togetherwith the development of global supply chains, and theirimpact on the countries and players within them.
Transport & Logistics Research Unit, University ofHuddersfield, Queensgate, Huddersfield, West YorkshireHD1 3DH
Kevin J. Roberts is Brotherton Professor ofChemical Engineering in the Institute ofParticle Science and Engineering, School ofProcess Environmental and Materials Engi-neering at the University of Leeds. He wasrecently seconded to AstraZeneca as a RoyalAcademy of Engineering Industrial Fellowand has been working with AstraZeneca,
GSK, and Pfizer on the development of a new degree inPharmaceutical Engineering at Leeds. His research work isin the area of crystal science and engineering directed to meetthe needs of the pharmaceuticals, specialities, fine chemi-cals, and nutritional products sectors. A particular focus is onthe use of Process Analytical Technology (PAT), and molecu-lar and systems modelling techniques for reactor monitoringand control associated with the optimization and scale-up ofpharmaceutical manufacturing processes.

8 PHARMACEUTICAL ENGINEERING JULY/AUGUST 2006
Supply Chain Techniques
©Copyright ISPE 2006
Dr. Xue Z. Wang is the Malvern Reader inIntelligent Measurement and Control in theInstitute of Particle Science and Engineer-ing, School of Process Environmental andMaterials Engineering at the University ofLeeds. His research focuses on investigationof advanced mathematical, knowledge-basedas well as data-driven techniques in order to
exploit the potential for improved process performance of-fered by the integration of on-line measurement, control andinformation systems. The most recent research projects canbe grouped into the three areas: process sensor and PAT datamining; on-line PAT measurement and control for particu-late products at micron, sub-micron, and nano-scale; and eco-toxicity prediction of mixtures of chemicals using quantita-tive structure – activity relationships and data mining.
Institute of Particle Science and Engineering, School ofProcess, Environmental and Materials Engineering, Univer-sity of Leeds, Leeds LS2 9JT, UK.

JULY/AUGUST 2006 PHARMACEUTICAL ENGINEERING 1
Temperature Controlled Packaging
©Copyright ISPE 2006
This articlediscusses theneed for specialproceduresstarting atreceipt ofsensitivecomponents/ingredients,throughoperations anddistribution,includingrequirementsand newpackagingsupplies fortemperaturesensitivemedicalproducts.
Operational Considerations ofThermally Sensitive HealthcareProducts
by Sanford L. Cook
Figure 1. Criticaltemperature eventperiods.
Introduction
The rapid pace at which new medicalproducts are being tested and comingto market has become a challenge thatproduct managers, logistics and engi-
neering professionals are confronted with at anaccelerated rate. Technologies that protect theseprecious materials from potential environmen-tal assault should be understood in their re-spective portfolios. A growing awareness of thedegrading effects to products resulting fromexposure to temperature and humidity hascaused special considerations throughout allphases of operations. There are some basic andsalient points that the plan leader should bearin mind - Figure 1.
This article describes the special consider-ations operations personnel and clinical projectmanagers are tasked with when designing acost efficient strategy to facilitate the safeacquisition of raw materials, formulation pro-
cesses, manufacture, packaging, storage, anddistribution of temperature/humidity sensitivematerials. Discussions will include understand-ing the physical forces products are exposed to,transportation, manufacturing equipmentqualifications, and monitoring, as well as stra-tegic planning from the receiving dock to theshipping dock.
The Influence of WeatherWeather reports predict the results of physicalforces in the atmosphere. The dynamics cre-ated as a result of rapid temperature differ-ences may produce ancillary products such asmoisture (rain) and negative or positive pres-sures (winds). Through technical means (dis-cussed later in this article), a potential forstormy weather is produced inside an insulatedcontainer.
This example of weather may be illustratedin packaging as follows: temperature sensitive
products are placed into insu-lated containers to protect themfrom ambient conditions. If theproducts must be kept at refrig-erated or freezing temperatures,refrigerants, such as dry ice (CO2)or Phase Change Materials(PCM), are used to drop the tem-peratures inside the protectivebox. The package is sealed. Asthe cold dry air is expunged fromthe refrigerant, it will collidewith the warmer air trappedwhen the box was closed. As thetemperature drops around theproduct, the moist air surround-ing the product releases anymoisture that it can’t hold. The
Reprinted from
PHARMACEUTICAL ENGINEERING®
The Official Magazine of ISPE
July/August 2006, Vol. 26 No. 4

2 PHARMACEUTICAL ENGINEERING JULY/AUGUST 2006
Temperature Controlled Packaging
©Copyright ISPE 2006
condensation may be controlled by proper design. All factorsmust be considered when designing a complete system toprotect sensitive products. However, a system or “protectivetunnel” should start long before the finished product ispacked into insulated shipping containers and all aspects ofthe product’s processes and journey should be considered.
Incoming ComponentsEach step should be analyzed as a detail to a complete system.The system must be continuous and not allow any part to fallbetween the cracks. For example, how do the basic ingredi-ents arrive at the processing facility? If at least one compo-nent is temperature sensitive, there should be a process tocheck to see if that component has been exposed to dangeroustemperatures or over excursion time durations during theshipping event. Single exposures may not be as important asthe cumulative time the product has been exposed. Normally,there will be labeling depicting the temperature tolerances;however, a device should be included that will indicate anytime/temperature variances. Responsibility should be as-signed to specific personnel to ensure the materials arrive asspecified on the label or accompanying documents.
Of course these steps should be detailed in StandardOperating Procedures (SOPs) as part of an overall protocol.The next step is not always accounted for when the materialarrives. Specific procedures and responsibilities should beassigned to material handling in terms of exposure timedocumentation from the dock to the temperature-controlledenvironment.
FacilitiesMost storage facilities today are adequately temperaturecontrolled and monitored. However, when the products aretaken from these areas on their way to an operation process,the exposure time from storage facility to the operations roomis not always accounted for. Environmental gaps may existthat start the cumulative exposure time to degrading tem-peratures. Of course, the exceptions are when the entireoperations facility is environmentally controlled to labeltemperatures, but that is pretty rare.
There should be a document and responsibility record thattracks the time/temperature during these material handlingevents added to the overall SOP.
Assuming that the operations room where the actualformulating or manufacturing process is being done is tem-perature controlled, the equipment that is used in the processshould be validated to operate at the specific operationaltemperatures. Equipment that generates heat is often over-looked. Therefore, products may be exposed to machinegenerated temperatures during the process, even though themachines may be validated to be operational at given tem-peratures. The Installation, Operation, and Qualification(IOQ) of equipment should have provided certification of thevalidation. Included in the documentation should be datathat depicts the time and the rise in temperature of theproduct during equipment normal running time as well asstoppages. Often, the characteristics may change and cumu-latively affect the product.
In many cases, primary containers or the containers that
Figure 2. Clinical product distribution chain.

JULY/AUGUST 2006 PHARMACEUTICAL ENGINEERING 3
Temperature Controlled Packaging
©Copyright ISPE 2006
the pharmaceutical product is actually touching such as avial, blister pack, card packet, etc. and the secondary contain-ers used to group and hold the primary containers in a“package” have been filled as part of the manufacturingprocess. After they are filled, these containers must now betransported to holding/storage facilities. Again, the trans-porting operation must be accounted for in terms of time/temperature as well as the validation certifications for theactual operations (manufacturing and filling), holding/stor-age facility, and the associated equipment as described above.
In the case of clinical supply groups, although the manu-facturing process may not be relevant, the material handlingprocedures are very highly significant as to the products finalefficacy - Figure 2.
Packaging andPackaging Material Considerations
Secondary containers (as described above) that are normallychipboard (cardboard) or thin corrugated boxes are thentaken out of the storage facility and readied for tertiary,insulated, and protective packaging for shipping. There aremany types of protective shipping systems that are availablefrom specialty suppliers. However, any system used must bevalidated to ensure the protection of the product from envi-ronmental damage. Depicted in Figure 4 is a shipping system
that contains insulated boxes, Phase Change Materials(PCMs) sometimes referred to as “gel packs and describedbelow”), data loggers, heat sink materials, and in some cases,shock absorbing components. The configuration of the pack-aging components and total system is crucial to keep theproducts safe during shipping - Figure 5. If you do not have aqualified thermal packaging specialist in house, there arehighly experienced independent consultants available thatare not obligated to specific suppliers products and offerobjective advice since they are actually working for you. (Asource for independent consultants may be found at theConsultant’s Council listed on the Institute of PackagingProfessionals (IOPP) Web site. www.packagingconsultants.org.)
An empirical validation test by an approved, independentlaboratory, experienced in temperature controlled packagingand regulatory requirements, should be conducted - Figure 6.(Some suppliers provide these services. However, validationtests should be conducted at arms length by independentlaboratories. The use of “pre-validated containers” is notrecommended, but if used, be sure the supplier will certifythat your specific shipping depiction for each packout meetstheir certification in a written and signed statement.
Insulation materials are a function of shipping duration
Figure 3. Pharmaceutical distribution chain.
Figure 4. Shipping system. Figure 5. Configuration of packaging components.
4 PHARMACEUTICAL ENGINEERING JULY/AUGUST 2006
Temperature Controlled Packaging
©Copyright ISPE 2006
Figure 8. Phase change material comparison.
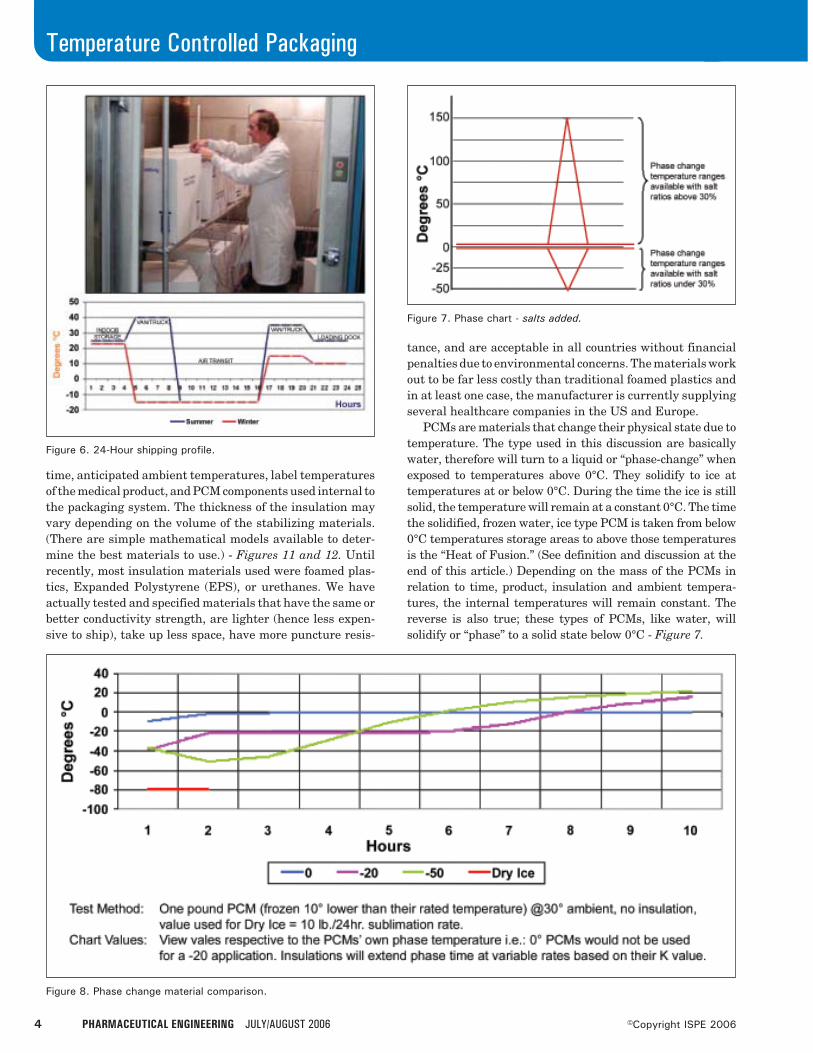
time, anticipated ambient temperatures, label temperaturesof the medical product, and PCM components used internal tothe packaging system. The thickness of the insulation mayvary depending on the volume of the stabilizing materials.(There are simple mathematical models available to deter-mine the best materials to use.) - Figures 11 and 12. Untilrecently, most insulation materials used were foamed plas-tics, Expanded Polystyrene (EPS), or urethanes. We haveactually tested and specified materials that have the same orbetter conductivity strength, are lighter (hence less expen-sive to ship), take up less space, have more puncture resis-
tance, and are acceptable in all countries without financialpenalties due to environmental concerns. The materials workout to be far less costly than traditional foamed plastics andin at least one case, the manufacturer is currently supplyingseveral healthcare companies in the US and Europe.
PCMs are materials that change their physical state due totemperature. The type used in this discussion are basicallywater, therefore will turn to a liquid or “phase-change” whenexposed to temperatures above 0°C. They solidify to ice attemperatures at or below 0°C. During the time the ice is stillsolid, the temperature will remain at a constant 0°C. The timethe solidified, frozen water, ice type PCM is taken from below0°C temperatures storage areas to above those temperaturesis the “Heat of Fusion.” (See definition and discussion at theend of this article.) Depending on the mass of the PCMs inrelation to time, product, insulation and ambient tempera-tures, the internal temperatures will remain constant. Thereverse is also true; these types of PCMs, like water, willsolidify or “phase” to a solid state below 0°C - Figure 7.
Figure 6. 24-Hour shipping profile.
Figure 7. Phase chart - salts added.

JULY/AUGUST 2006 PHARMACEUTICAL ENGINEERING 5
Temperature Controlled Packaging
©Copyright ISPE 2006
Table A. Phase change materials.
Type Temperature Range Note Usage
Sponge/Water 0°C Retains its shape when frozen, leaks easily Used for <0°C, 2°C to
Phenol Foam/Water 0°C Retains its shape when frozen8°C, and above 8°C
Hydroscopic Polymers (Gel) -10OC to 0OC Widely used industry standard available in various outertemperature ranged products
wrap configurations
Hydroscopic Polymers/added salts -45OC to +26OC COLD - Could replace some dry ice applicationsWARM - Help maintain room temperatures
Paraffin 26OC to 60OC Maintain room temperatures
There are specialty PCM products available that willactually stay solid at various specifically controlled tempera-tures - Table A. For example: PCM formulae may remain at+4, +30°C or even above. Others remain constant at -10,-20,or lower. Products labeled temperatures from 2-8°C mayutilize these PCMs. Products that are to be kept below -10 or-20°C can use the low temperature versions. (Dry ice is stillrequired below -30°C.) There are pluses and minuses associ-ated with using common type or specialty PCMs. In Figure 8,there is a comparison in the time it takes one pound (.45kilograms) of various temperature PCMs and dry ice to phasefrom a solid to a liquid. Using mass multiplied by time, thechart should give a good indication of the expiration rate foreach type. The phase time in this example assumes roomtemperatures approximately 65°F (18°C.) and does not takeinsulation values when placed in a closed container intoconsideration. A thermal packaging expert should be con-sulted for the most efficient solution as to which type to use.
Whether or not a validation test is performed, a tempera-ture monitor/data logger should be used as a safety factor.There are various types of indicators and monitors. Chemicalindicators are one time, line of sight devices with no memory.What you see is what you get. The upside is that they areinexpensive. The downside is that they trip at a fairly widetolerance of temperatures and may not be depended upon toindicate when the critical failure temperature was reached.These indicators should not be used for archival purposes,particularly for tight temperature tolerance, sensitive, andvaluable medical products. Electronic devices vary as to costquite broadly. The benefits are that they are very accurate,normally within +/- .5° C; provide a precise record of tempera-tures, humidity when required; may be archived and en-crypted in accordance with 21 CFR Part11; and make avail-able many types of alert signals-digitally and line of sight -Figure 9. Technology is changing rapidly in the electronicdevices. There are products available that provide all of theinformation listed above in addition to a reduced size (ap-proximately the size of half dollar coin), may be down-loaded into a computer individually or added to other UPClogistic and anti-diversionary information, and monitoredfrom a wireless remote location at any time during shippingor storage. In addition, the device has ranges down to andincluding -80°C and is less costly than most temperature dataloggers presently offered. It is recommended that electronicdata loggers be used even when the packaging has beenvalidated for the assumed ambient weather exposures. Sim-
ply said, we believe all protective packaging should be empiri-cally endurance tested for actual anticipated applications;however, on the rare occasion that the package is exposed toextraordinary conditions, the product may still be acceptable.The monitor will be the only evidence to save the shipment orhave to reject it decisively at these latter unexpected events.Electronic devices may now monitor temperatures and loca-tions even when diverted. Other inexpensive devices areavailable that provide end user verification.
Risk management should be employed when consideringto either validate by laboratory testing a protective packag-ing system or to merely monitor each shipment. We believethat a properly tested system will give reasonable assurancesthat the product will remain within label temperaturesthroughout the shipping event and all subsequent shipmentsof similar materials and products. The endurance test is
Figure 9. 21 CFR Part 11 compliant.

6 PHARMACEUTICAL ENGINEERING JULY/AUGUST 2006
Temperature Controlled Packaging
©Copyright ISPE 2006
Figure 10. Certified test report.
performed with the proposed packaging design in a tempera-ture controlled test chamber at programmed predeterminedtemperatures to which the package will likely be exposed.Smaller or medium size packages are also tested in variousphysical attitudes, such as on their side and upside down, ifappropriate, during the test to simulate material handling ontrucks or aircraft. The certified test report that is publishedis an archived document that will serve as evidence that theprotective packaging is appropriate for the applications in-vestigated. The report should include a detailed descriptionof the validated test equipment, packout depiction, and testresults - Figure 10. Monitors by themselves, provide a “snap-shot” of that particular shipment and do not provide assur-ances until after the event that the products will arrive safelyat their destination. (Too late if out of tolerance.) Therefore,the laboratory validation test to predict a successful shippingevent for valuable and high occurrence shipments in terms ofweather environments and handling in addition to repeat-ability of such success is recommended. Shipments that areof low occurrence and low value may be considered formonitors exclusively.
Packaging Test Protocol and SOPDocuments must be generated to precisely depict the purposeand scope in addition to all of the shipping, handling, andambient environment events that are expected to occur tomeasure the endurance to protect products during shippingand storage. Precise identification and traceability of packag-ing materials and medical products must be included. Thetext should include all supporting documents that are neededsuch as temperature profiles, packaging configurations, qual-ity standards (company and appropriate regulatory), relevantpolicies, and specific assignment of responsibilities by step,segment, and in total.
DistributionCommercial products and clinical studies vary in actualoperations and distribution - Figures 2 and 3. However, interms of temperature control, the two delivery systems haveidentical requirements. The protective packaging design willbe the same. Whether packaged internally or at a contractpackager, the responsibility and protocol/SOP documenta-tion must be controlled by the owner of the project. Forexample, even if the packaging and distribution is actuallydone at a contract packaging company, the responsibility forclear and precise protocols, SOPs, material lists, and any otherrequired documents is still the project manager’s. The ProjectManager may designate others such as the logistics managerto generate protocol/SOPs and manage their segments.
Quality and Regulatory GuidanceWhether products are manufactured in the US or the Euro-pean Union (EU), all processes, personnel training, andequipment qualification must be followed in accordance withcurrent Good Manufacturing Practice (cGMP). The guide forUS regulations is found in the Code for Federal Regulations(CFR). Chapters 21 CFR Parts 210 and 211 include regula-tions for processing, packing, or holding of drugs and finishedpharmaceuticals. Medical devices are covered in 21 CFR Part820. Qualify testing methodology is covered in 21 CFR 211.60.The US Food and Drug Administration (FDA) is responsiblefor ensuring that products consumed in the US are producedand marketed to approved standards, regardless of the originof manufacture. The federal government Agency audits thephases of biopharmaceutical development through all stagesof manufacturing, testing, and initial distribution. Theremust be sufficient evidence that drugs and other relatedpharmaceutical products have been adequately tested toperform as purported and have a relative degree of safetyduring human usage. www.fda.gov.
The United States Pharmacopoeia (USP) is a quasi-government organization that is composed of regulatoryagency personnel, academia, and industry groups inter-ested in pharmaceutical standards. USP journals and peri-odic discussion groups generate proposals and guidelines.USP Resolution 10 is a guide for storage and shipment.When marketing in Europe, standards are produced by EU,European Economic Commission (EEC) Council Directivesfor products consumed within the European Community. Asan example, 75/319/EEC is a standard that relates to ana-lytical, pharmacological/clinical standards, personnel, pre-mises, equipment, documentation, production, quality con-trol, complaints, product recall, self-inspection, and testing.There are several amendments to the basic document andall are listed on the EC Web site. An interesting Web site tovisit is at: http://ts.nist.gov/ts/htdocs/210/gsig/eu-guides/sp951/sp951.htm, “NIST Special Publication 951 - A Guideto EU Standards and Conformity Assessment.” In the tableof contents, there is a link to “Standardization in the EU andthe United States: A Comparison.” Most notably is a generalstatement that in Europe standards are developed centrallyand in the US by sector.

JULY/AUGUST 2006 PHARMACEUTICAL ENGINEERING 7
Temperature Controlled Packaging
©Copyright ISPE 2006
Heat Test (30°C) with 500 ml water (5°C) and 1 x 32 oz. Frozen Gel Bottle (-18°C)
Container Insulation k wall R Hours Hours Weight Est. Mat. Costs (500 qty) $thickness Value <10°C <20°C ACT/Dm Cost Gel Total
Corregated Only none --- C Flute --- 2.5 17 4/4 lbs. $0.75 $1.00 $1.75
Fabric Tote Thinsulate 0.25 3/4" 3 8 23 4/4 lbs. $9.40 $1.00 $10.40Style
Molded Cooler Rigid 0.14 1/2" 3.5 3 24 6/6 lbs. $15.40 $1.00 $16.40Poly-
urethane
Corrugated w/Bubble Astrofoil 0.19 5/6" 3.3 6 27 4/4 lbs. $6.00 $1.00 $7.00doublebubble
foil
EPS KD EPS 0.25 2" 8 13 32 5/11 lbs. $5.00 $1.00 $6.001.5 lb.Cu. ft.
EPS Molded EPS 0.25 2" 8 12 30 5/11 lbs. $5.50 $1.00 $6.501.5 lb.Cu. ft.
Polyurethane KD Rigid 0.14 2" 14.3 26 48 7/11 lbs. $12.00 $1.00 $13.00Poly-
urethane
Polyurethane Mid. Rigid 0.14 2" 14.3 26 48 7/11 lbs. $16.00 $1.00 $17.00Poly-
urethane
Vacuum KD Vacuum 0.04 2" 50 54 80 10/11 lbs. $44.00 $1.00 $45.00Panels
Figure 11. Thermal comparison profile-insulation materials.
The Plan1. Gather product stability data
1.1 Ensure documentation exists1.2 Ensure documentation is defendable
2. Define manufacturing, storage, and distribution environ-ment
3. Map current or proposed product stream3.1 Collect all relevant protocols and SOPs applicable to
processes, personnel, facilities, and equipment.3.2 Ensure there are complete SOPs for each step in the
product stream
4. Define vulnerabilities of current documentation and sys-tems, including gaps in material handling, movement,and processes.4.1 Evaluate effectiveness of current procedures SOPs.4.2 Develop new and/revise appropriate SOPs to ad-
equately describe all procedures and methods re-quired to achieve successful cGMPs.
5. Collect/develop all validation reports and documentationrequired for materials and equipment.

8 PHARMACEUTICAL ENGINEERING JULY/AUGUST 2006
Temperature Controlled Packaging
©Copyright ISPE 2006
Figure 12. Performance data for conventional and advanced insulations.
ConclusionRelevant to the history of the biopharmaceutical industry inthe US and Europe in terms of time, the recognition thatmedical products may change their efficacy of their productsfor the worse due to temperature has been very short. Storageand packaging studies have evolved recently to generatehighly effective procedures and materials. Each segment ofthe manufacturing and clinical test distribution process hasrecently been highly visible. Appropriate training, materialfamiliarization, and validation studies have moved higher inpriority by industry and regulatory agencies. However, theremay be unprotected gaps in the procedures that commence atthe actual receipt of ingredients and between each phase ofthe product cycle.
Material handling and movement between processes shouldbe accounted for to guarantee that temperature excursions donot exceed acceptable accumulated exposure levels beforeand in addition to storage and packaging.
We need to ensure that product evaluations and effective-ness are not compromised at any point from receipt of compo-nents, manufacturing operations, clinical studies, and throughall segments of distribution.
Heat of Fusion: Definition and Discussion The standard enthalpy change of fusion, also known asthe heat of fusion, is the amount of heat energy which mustbe absorbed or lost for 1 gram of a substance to change statesfrom a solid to a liquid or vice versa. It is also called the latentheat of fusion or the enthalpy of fusion, and the temperatureat which it occurs is called the melting point.
When you withdraw thermal energy from a liquid or solid,the temperature falls. When you add heat energy, the tem-
perature rises. However, at the transition point between solidand liquid (the melting point), extra energy is required (theheat of fusion). To go from liquid to solid, the molecules of asubstance must become more ordered. For them to maintainthe order of a solid, extra heat must be withdrawn. In theother direction, to create the disorder from the solid crystal toliquid, extra heat must be added.
The heat of fusion can be observed if you measure thetemperature of water as it freezes. If you plunge a closedcontainer of room temperature water into a very cold environ-ment (say -20°C), you will see the temperature fall steadilyuntil it drops just below the freezing point (0°C). The tem-perature then rebounds and holds steady while the watercrystallizes. Once completely frozen, the temperature willfall steadily again.
The temperature stops falling at (or just below) the freez-ing point due to the heat of fusion. The energy of the heat offusion must be withdrawn (the liquid must turn to solid)before the temperature can continue to fall.
The units of heat of fusion are usually expressed as joulesper mole (the SI units).
About the AuthorSanford Cook is a consulting and productdevelopment resource to the biopharma-ceutical packaging industries and is Presi-dent of Thermal Packaging Solutions, LLC.He has been the chief executive officer, chiefengineer and chief marketing executive forglobal, public, and private companies en-gaged in the design, documentation, valida-
tion, testing, and manufacturing of economical, packaging,

JULY/AUGUST 2006 PHARMACEUTICAL ENGINEERING 9
Temperature Controlled Packaging
©Copyright ISPE 2006
devices, refrigerants, monitors, and operations processesthat protect sensitive products against weather and handlingvulnerabilities, as well as anti-diversion systems duringshipping and storage for more than 25 years. An engineer anda graduate of Business Management, Rutgers University, heholds many patents in the fields of thermal dynamics anddevices mentioned above. He has written and publishedmany articles and papers, given numerous speeches, beenfeatured in various national and local media events includingthe Discovery Channel’s Medical Series, Bloomberg Televi-sion, ABC News, News Channel 12, the cover page of theHealth Section of the Newark Sunday Star Ledger, the WallStreet Journal, and led many seminars to industry andgovernment groups interested in these subjects, primarily inthe biopharmaceutical, appliance, and medical device seg-ments. Cook is serving as an officer in the IOPP, ConsultantsCouncil.
Thermal Packaging Solutions, LLC, 31 Delta Dr., Ocean,New Jersey 07712, Web site: www.thermalpackagingsolutions.com.

JULY/AUGUST 2006 PHARMACEUTICAL ENGINEERING 1
Risk Assessment
©Copyright ISPE 2006
This articlepresents a riskassessmenttechnique usedto quantify theimpact ofuncertainty andvariability in themanufacturingof bulkpharmaceuticals.
Quantifying the Impact of UncertainParameters in the BatchManufacturing of ActivePharmaceutical Ingredients
by Evdokia C. Achilleos, John C. Calandranis, andDemetri P. Petrides
Introduction
A ctive Pharmaceutical Ingredients(APIs) are usually produced in batchmulti-product facilities. A typical pro-cess involves several stages, includ-
ing intermediate filtration, centrifugation, anddrying. Processes for new products are devel-oped in the lab and later transferred to pilotplant for scale-up. The role of pharmaceuticalpilot plants is to optimize new processes andsupply materials for safety and clinical studies
for drug development.1 The pharmaceuticalindustry is under pressure to make new com-pounds available to patients as soon as it issafely possible. As a result, there may be re-maining uncertainty in the operational andmarket parameters of the scaled-up process.2-6
This uncertainty may lead to uncertainty inplant throughput, manufacturing cost, envi-ronmental impact, etc. Risk assessment tech-niques that quantify the impact of uncertainparameters on the final decision variables can
Figure 1. Processflowsheet for theproduction of an activepharmaceuticalingredient.
Reprinted from
PHARMACEUTICAL ENGINEERING®
The Official Magazine of ISPE
July/August 2006, Vol. 26 No. 4

2 PHARMACEUTICAL ENGINEERING JULY/AUGUST 2006
Risk Assessment
©Copyright ISPE 2006
prove to be a valuable tool to management.Typical process simulation tools used for batch process
design, debottlenecking, and cost estimation employ deter-ministic models. These models do not account for randomvariation in the input variables and provide fixed and repro-ducible results for the outputs. In other words, they predicthow the process will act in a given situation. If there isvariability in the process inputs, the scenario modeled with adeterministic tool is taken to be the “average” or “expected”situation commonly referred to as the base case or most likelyscenario. Modeling cases where key input parameters as-sume extreme values can help determine the range of perfor-mance with respect to key process parameters. However,such an approach does not account for the relative likelihoodof the various scenarios. Monte Carlo simulation is a collec-tion of a large number of simulated results (runs) and consti-tutes a practical means of quantifying the risk associatedwith uncertainty in process parameters. Uncertain inputvariables are assigned probability distributions. For eachrun, a set of values of the statistically varied input param-eters is selected (with frequency based on their assigneddistribution) and the outcome is recorded. The statisticaldistributions of the results are used to quantify risk. If the
model of a process has been developed using a deterministicsimulator, Monte Carlo simulation can be performed bycombining the deterministic simulator with a tool that sup-ports probabilistic and stochastic modeling.
Methodology and ToolsProcesses for new products may be analyzed by developingcomputer models using spreadsheets or specialized processsimulators. Such models serve a variety of purposes through-out the life-cycle of product development and commercializa-tion in the pharmaceutical industries. During process devel-opment, computer models are used to evaluate alternativetechnologies (e.g., synthesis routes, purification technolo-gies, etc.) that have the potential of reducing cost, shorteningcycle times, and minimizing environmental impact. As aprocess moves from development to manufacturing, suchtools are used to design new manufacturing plants andfacilitate technology transfer (from R&D to manufacturing).Finally, in large-scale manufacturing, process modeling isused for capacity analysis, debottlenecking, and productionplanning and scheduling.
SuperPro Designer®, a comprehensive process simulatorthat focuses on pharmaceutical, specialty chemical, and bio-chemical processes, was employed in this study first as astandalone tool for modeling the process using the base casevalues for all input variables. The process simulator wassubsequently integrated with a stochastic risk analysis toolin order to conduct the uncertainty analysis.
Crystal Ball®, an Excel® add-in application, was used tofacilitate Monte Carlo simulation. It enabled the user todesignate the uncertain input variables, specify their prob-ability distributions, and select the output (decision) vari-ables whose values are recorded during the simulation. Foreach simulation trial (scenario), the application generated
Figure 2. Equipment occupancy chart (three consecutive batchesare represented by different colors).
Figure 3. Manufacturing cost breakdown.
Bulk Raw Unit Annual Annual CostMaterial Cost Amount
($/kg) (kg) ($) %
Chlorine 3.300 19,075 63,000 2.72
Na2CO3 6.500 22,387 146,000 6.30
Water 0.100 631,933 63,000 2.73
HCl (20% w/w) 0.150 76,168 11,000 0.49
NaOH (50% w/w) 0.150 43,581 7,000 0.28
Methanol 0.240 117,895 28,000 1.22
Hydroquinone 4.000 36,534 146,000 6.32
Carb. TetraCh 0.800 105,973 85,000 3.67
Quinaldine 32.000 31,673 1,014,000 43.85
Sodium Hydroxide 2.000 15,803 32,000 1.37
Isopropanol 1.100 423,008 465,000 20.13
Charcoal 2.200 3,378 7,000 0.32
HCl (37% w/w) 0.170 46,363 8,000 0.34
Nitrogen 1.000 236,635 237,000 10.24
TOTAL 1,810,406 2,311,000 100.00
Table A. Raw material requirements and costs.

JULY/AUGUST 2006 PHARMACEUTICAL ENGINEERING 3
Risk Assessment
©Copyright ISPE 2006
random values for the uncertain input variables selected infrequency dictated by their probability distributions usingthe Monte Carlo method. All input variables are perturbedsimultaneously and their interactions are captured throughthe model as fluctuations of the output. The application alsocalculated the uncertainty involved in the outputs in terms oftheir statistical properties, mean, median, mode, variance,standard deviation, and frequency distribution.
In this study, the process simulator was combined with theadd-in application to perform a Monte Carlo simulation of abulk pharmaceutical process. The integration of the two toolswas made possible by taking advantage of the ComponentObject Module (COM) technology built in the process simula-tor and the add-in application’s inherent integration withExcel. The probability distributions of the uncertain inputvariables were defined in the application. Macros were usedto link the uncertain parameters with their correspondinginput variables in the process simulator. For each set ofvalues of input variables, the process simulator performedmaterial and energy balances, scheduling, and cost analysiscalculations. The calculated outputs of the process simulatorwere transferred back to the Excel add-in application usingadditional macros.
Bulk Pharmaceutical Illustrative ExampleThe methodology developed for integrating the two tools isillustrated here using an example involving a pharmaceuti-cal process for the manufacture of an active compound forskin care. This example is based on a study made in aprevious publication.7 This example is not intended to be anexhaustive examination of risk-assessment accounting forall possible variations under “real-world” conditions. It israther intended to demonstrate how one can use this method-ology to assess the impact of variability in key-process pa-rameters on the decision variables.
Base Case AnalysisThe process has been developed at pilot plant level and it isready to be moved to large-scale manufacturing. Based oninput from the marketing department, the objective is toproduce at least 36,000 kg of active ingredient per year at acost of no more than $250/kg.
The entire process model, is shown in Figure 1. The iconsin Figure 1 represent unit procedures (processing steps) andnot unique equipment. Multiple unit procedures may utilizethe same equipment at different times. Each unit procedurecontains a set of operations that are performed sequentiallyin the equipment. The following equipment items are avail-able for the large-scale manufacturing of this compound:
• three 1,000 gal reactors (R-101, R-102, R-103)• two 4 m2 Nutsche filters (NFD-101, NFD-102)• a tray dryer with a capacity of 1 kg/h removed solvent
(TDR-101)
The process is divided into four sections identified by differ-ent colors on the flowsheet. The first section is the “Product
Synthesis” section. Procedure P-1 (in R-101) involves thechlorination of quinaldine. Procedure P-3 (in R-102) involvesthe formation of the product through the condensation ofchloro-quinaldine and hydroquinone. A side reaction leads tothe formation of an impurity. The product and the impurityformed in P-3 precipitate out of solution. The second sectionof the process deals with product “Isolation and Purification.”The precipitate of the product and the impurity formed inprocedure P-3 is removed in procedure P-4 using a filter. Theproduct is subsequently converted into a soluble form inprocedure P-5 while the impurity remains in solid form andis removed in procedure P-6. The third section is the “FinalPurification” section. The product precipitates in procedureP-7 and the precipitate is recovered using a filter (procedureP-8, NFD-101). The product is then dissolved in isopropanol(in P-9) and charcoal is added to remove certain impurities.The charcoal used for the treatment is removed by Filtrationin P-10. Finally, the last section is the “Crystallization andDrying” section. The product solution is concentrated in P-11(isopropanol is vaporized) and the product is crystallized (inthe same vessel, R-103). The crystallized product is recoveredusing a filter (P-12) and dried using a tray drier (P-13/TDR-101). A more detailed description of the process can be foundin the literature.7
Figure 2 displays the equipment occupancy chart for threeconsecutive batches. Each color represents a different batch.Multiple rectangles for the same equipment (e.g. for R-101, R-102, NFD-101, and R-103) within a batch represent reuse ofthat equipment by multiple unit procedures. The flow ofmaterial through the equipment is shown with the red arrowsfor the first batch. Reactor R-102 has the longest cycle time(from the start of P3 to the end of P9) and is by definition, thecurrent time bottleneck that determines the maximum num-ber of batches per year.
Considering the size of the available equipment, the pro-cess simulator calculates that each batch generates 246 kg ofactive ingredient. The minimum cycle time of the process iscalculated as 52.3 h and it is determined by R-102. If the plantoperates at its minimum cycle time of 52.3 h, it can process150 batches per year. To meet the target production of 36,000kg/year, a minimum of 147 successful batches are requiredper year.
The process simulator also was used to perform the costanalysis calculations for this process. The estimated manu-
Variable Base Case Distribution VariationValue and Range
Quinaldine Cost 32 ($/kg) Normal S.D. =6[10 – 110]
Chlorination Reaction Time 6 hr Triangular [4-8](in P-1)
Condensation Reaction Time 6 hr Triangular [4-8] (in P-3)
Cloth Filtration Flux (in P4, P6, 200 (L/m2-h) Triangular [150-250]P8, P10) (Equipment NFD-101)
Table B. The input parameters used for the Monte Carlosimulation and their variation.

4 PHARMACEUTICAL ENGINEERING JULY/AUGUST 2006
Risk Assessment
©Copyright ISPE 2006
facturing cost is $237/kg, which is below the upper limit of$250/kg. Detailed cost analysis for this process is available inthe literature.7 Figure 3 shows the distribution of the manu-facturing cost. The facility-dependent cost (plant overhead)accounts for 39%, followed by raw material costs at 26%, andlabor for 21%. The cost distribution of the raw materials canbe seen in Table A. Quinaldine is the most expensive rawmaterial accounting for around 44% of the raw materials costwhich translates to about 11.4% of the overall cost.
Uncertainty AnalysisThis exercise focuses on parameters that exhibit uncertaintyor variability and can have a direct impact on the decisionvariables of this project: the manufacturing cost and theannual throughput. Table B shows the input parameterschosen for the Monte Carlo simulation and their assumedprobability distributions. These are indicative parameterschosen for the purpose of the illustration and they do notrepresent all possible input process parameters that mayexhibit variability. A normal distribution was assumed forthe price of quinaldine, which is the most expensive rawmaterial with a mean value equal to that of the base case($32/kg).
The annual throughput (or number of batches per year) isdetermined by the process cycle time. Any process changes
that increase the cycle time of R-102 (the time bottleneck) willresult in fewer batches per year and lower annual through-put. Since procedure P-9 that utilizes vessel R-102 is the timebottleneck, any variability in the completion of P-9 leads touncertainty in the annual throughput.
Please note that such changes are not limited to theoperations of P-9. Variability in the completion of P-9 can becaused by variability in the operations of P-9 as well as byvariability in the operations of the procedures upstream of P-9 (such as P-1, P-3, P-4, P-5, P-6, P-7, and P-8). Commonsources of process time variability in chemical manufactur-ing include:
1. fouling of heat transfer areas that affect duration ofheating and reaction operations
2. fouling of filters that affect duration of filtration opera-tions
3. presence of impurities in raw materials that affect reac-tion rates
4. off-spec materials that require rework5. random power outages and equipment failures6. differences in skills of operators that affect setup and
operation of equipment7. availability of operators
Figure 7. Contribution of uncertain parameters to the variance ofthe unit production cost.
Figure 6. Contribution of uncertain parameters to the variance ofthe annual number of batches.
Figure 5. Probability distribution of the annual number of batches(10,000 trials) (mean = median = mode =150, S.D. =3, Range= 139-160.
Figure 4. Probability distribution of the unit production cost(10,000 trials). Mean = 241.53, Median =241.49, S.D. = 5.78,Range =219.6 – 263.2.

JULY/AUGUST 2006 PHARMACEUTICAL ENGINEERING 5
Risk Assessment
©Copyright ISPE 2006
Triangular distributions were assumed for the two mainreaction operations and the filtration steps that precede P-9.Triangular distributions are typically used when limiteddata is available and when one has knowledge of the smallest,largest, and most likely value of the variable. Even thoughvariability distributions were assigned to specific operations,it may be deemed more accurate to assume that they accountfor the composite variability of their procedures. If this typeof analysis is done for an existing facility, historical datashould be used to derive the probability distributions. TheExcel add-in application has the capability to fit experimen-tal data.
The two decision variables considered in this study are thenumber of batches that can be processed per year and the unitproduction cost. These are key performance indicators impor-tant for production planning and project economics. Theoutput variables of the combined simulation are quantified interms of their mean, median, mode, variance, and standarddeviation. These results are shown in Figures 4 and 5 for the“Unit Production Cost” and the “Number of Batches” respec-tively. Based on our assumptions for the variation of theinput variables, we note that average values (mean/median/mode) calculated for the decision variables satisfy the objec-tive. The certainty analysis reveals that we can meet the unitproduction cost goal with a certainty of 93% (blue area ofFigure 4). However, the certainty of meeting our productionvolume goal (of 36,000 kg or 147 batches) is only 83% (bluearea of Figure 5). Such findings constitute a quantification ofthe risk associated with a process and can assist the manage-ment of a company in making decisions on whether to proceedor not with a project idea.
The dynamic sensitivity charts provide useful insight forunderstanding the variation of the process. They illustratethe impact of the input parameters on the variance (withrespect to the base case) of the final process output, whenthese parameters are perturbed simultaneously. This allowsus to identify which process parameters have the greatestcontribution to the variance of the process; and thus, focus theeffort for process improvement on them. The sensitivityanalysis for the Annual Number of Batches and Unit Produc-tion Cost is demonstrated in Figures 6 and 7 respectively. Theduration of the condensation reaction has the greatest impacton the number of batches and consequently the annualthroughput. This is expected, as this operation is part ofprocedure P-3 that takes place in the time bottleneck equip-ment. Any increase in this operation time increases the cycletime of R-102; hence, increases the batch time and reducesthe annual number of batches. If the management of thecompany is seriously committed to the annual productiontarget, it would be wise to allocate R&D resources to theoptimization of the condensation reaction. In addition, wecan see that the purchasing price of quinaldine has thegreatest impact on the manufacturing cost of the final prod-uct. Focusing the market research on lower cost suppliers forquinaldine would be advisable.
ConclusionsDeterministic process simulators facilitate modeling of com-plex systems in the chemical and pharmaceutical industriesand provide reliable correlations between input and outputprocess variables. Monte Carlo simulation tools estimateuncertainty of output variables from the uncertainty of inputvariables of a system. The combination of the two can be usedto quantify risk and facilitate the decision-making process forcomplex systems. A simple process from the pharmaceuticalindustry was used to demonstrate the approach and illus-trate how quantification of the risk involved in key decisionvariables can help management accept or reject a projectidea. The same approach can be applied to considerably morecomplex systems.
References1. Hourston, R.B. and P.K. Basu, Properly Plan Production
in a Pharmaceutical Pilot Plant, CEP, February 2000.
2. Ransohof, T.C., R.E. Mittendorff, II, and H.L. Levine,“Advances In Large Scale BioManufacturing and Scale-Up Production,” Chapter 10, ASM Press and Institute forScience and Technology Management, Washington, DC,October 2004.
3. Farid, S.S., J. Washbrook, and N.J. Tichener-Hooker,Biotechnol. Prog. 2005, 21,486.
4. Mollah, H. A., Bioprocess International, 22(9):28, 2004.
5. Noferi, J.F., R.L. Dillon, and A. Kubicka, Bioprocess Inter-national, 22(9):24, 2004.
6. Biwer, A., S. Griffith, and C. Cooney, Biothenol. Bioeng inpress 2005.
7. Petrides, D.P, A. Koulouris, and P.T. Lagonikos, “The Roleof Process Simulation in Pharmaceutical Process Develop-ment and Product Commercialization,” PharmaceuticalEngineering, January/February 2002, Vol. 22, No. 1, pp.56-65.
About the AuthorsEvdokia C. Achilleos is a Senior SoftwareDevelopment Engineer in Intelligen Europe.She has extensive experience in computa-tional process modeling of pharmaceuticaland biotechnology processes, scientific com-puting for transport phenomena, polymerand particle technology, and mathematicalmodeling for optimization of industrial pro-
cesses. She holds a BS from Pennsylvania State Universityand MS and PhD degrees from Princeton University, all inchemical engineering. Achilleos can be contacted at: tel: +302310 498 293 or e-mail: [email protected].
Intelligen Europe, PO Box 328, 57001 Thermi Thessaloniki,Greece.
6 PHARMACEUTICAL ENGINEERING JULY/AUGUST 2006
Risk Assessment
©Copyright ISPE 2006
John C. Calandranis is the Vice Presidentof Product Development of Intelligen, Inc. Hehas a long tenure in building large softwaresystems for engineering applications in pro-cess design and simulation; he is the princi-pal architect and technical product managerof SuperPro Designer. He completed his un-dergraduate studies at Patras University
(Greece) and earned a PhD from MIT, both in chemicalengineering. Calandranis can be contacted at: tel: (262) 367-7043 or e-mail: [email protected].
Intelligen, Inc., N27 W30636 Golf Hills Dr., Pewaukee, WI53072.
Demetri P. Petrides is the President ofIntelligen, Inc. He has extensive experiencein applying simulation tools to model, ana-lyze, and optimize integrated biochemical,pharmaceutical, and specialty chemical pro-cesses. He holds a BS from National Techni-cal University of Athens (Greece) and a PhDfrom MIT, both in chemical engineering. He
is a member of ISPE, AIChE, and ACS. Petrides can becontacted at: tel: (908) 654-0088 or e-mail: [email protected].
Intelligen, Inc., 2226 Morse Avenue, Scotch Plains, NJ07076.

JULY/AUGUST 2006 PHARMACEUTICAL ENGINEERING 1
Containment Performance
©Copyright ISPE 2006
This articlepresents aresearch projectconducted byHitachi andElveco on adocking stationpatented byElveco andlicensed toHitachi PlantTechnologies forEast Asia. Itdescribes howthe ISPE GoodPractice Guide:Assessing theParticulatePerformance ofPharmaceuticalEquipment wasused throughoutthe project.
Containment Performance of a NewDocking Station
by Hiroto Masuda, Yukio Fukushima, Satoru Hasegawa,Tadatoshi Iwabuchi, and Willy J. Lhoest
Introduction
As early as in the 19th century, CharlesDarwin stated that : “The species thatwill survive are not the strongest, northe most intelligent, but the ones most
responsive to change.” Already at that time, itwas recognized that the ability to adapt to newsituations is a vital condition to survive.
This is even more true today. This ability toadapt, that we now call “flexibility,” remains aprime requirement in the pharmaceutical in-dustry. Fully flexible and low-cost productionsystems are very much in demand.
At the same time, additional essential re-quirements need to be met. Modern pharma-ceuticals are becoming increasingly more po-tent; therefore, a high level of protection mustbe guaranteed. Robust and perfectly tight pro-duction systems, fully reliable with respect topotential dust release and capable of prevent-ing any cross-contamination, are needed.
Last but not least, production facilities mustadhere to increasingly strict international regu-lations.
Purpose of the StudyIn 2001, a Japanese engineering company en-tered into a technical agreement to implementthe “Lhoest Concepts” in an Oral Solid DosageForms (OSD) manufacturing plant.
In closed, dust tight manufacturing lines, itis necessary to quantitatively measure the con-tainment performance of the equipment. Dock-ing stations are a vital element in plants builtaccording to the “Lhoest Concepts,” therefore,it appeared necessary to evaluate such dockingstations and to report the results in terms ofexposure risk and quality assurance in thedesign and engineering of a plant.
The description of the stations under inves-tigation and the details of their functioninghave been the subject of an earlier article.1
The present study was conducted using in-formation developed by the Standardized Mea-surement for Equipment Particulate AirborneConcentration (SMEPAC).2 This ISPE GoodPractice Guide was established specifically forthe evaluation of the containment performanceof pharmaceutical manufacturing equipment.3
Figure 1. Schematics ofa pharmaceuticalmanufacturing plantbased on the LhoestConcepts.
Reprinted from
PHARMACEUTICAL ENGINEERING®
The Official Magazine of ISPE
July/August 2006, Vol. 26 No. 4

2 PHARMACEUTICAL ENGINEERING JULY/AUGUST 2006
Containment Performance
©Copyright ISPE 2006
Since the reproducibility of the containment performanceresults of the docking station were confirmed by multipledata and repeated measurements, it was decided that theresults should be reported, which is the purpose of thisarticle.
The Docking StationThe schematics of a pharmaceutical plant based on theLhoest Concepts appear in Figure 1. Machines, correspond-ing to every individual manufacturing process, are located intight, independent production rooms called “Islands.” Thestorage and transportation of ingredients, powders, gran-ules, tablets, to and from basic manufacturing pieces ofequipment, is achieved by means of closed containers anddocking stations installed on separate floors, above andbelow the main manufacturing floor. Products are trans-ferred strictly on basis of gravity flow.
Advantages are numerous and important:
• Since it is no longer required to bring the closed container(s)inside the production rooms, the surface area and theheight of these production rooms can be reduced to theminimum. Their construction and maintenance costs, forexample HVAC, drop significantly.
• The elimination of the back and forth movements of thecontainers, including their heavy transportation equip-ment, to and from each production room, simplifies the
operations, reduces the size of clean corridors, and greatlyenhances the overall cleanliness.
• Since production rooms are totally independent, includingtheir ventilation systems, the risk of cross-contaminationis mitigated.
The docking station is a vital component of the LhoestConcepts. The outside view of the docking station is shown inFigure 2, and its outline configuration appears in Figure 3.Upon discharge of ingredients into the manufacturing equip-ment, maximum reduction in dust exposure risk is achieveddue to its high containment performance and contaminationis prevented by fully hermetic airlock mechanism.1
The upper docking stations, also called “Feeding Sta-tions,” operate as follows:
1. As the container, delivered by an Automatic Guided Ve-hicle (AGV), a fork-lift, or an equivalent engine, comesdown to a level of two or three inches above the station, theupper stainless steel cover of its air box slides open.
2. The container is gently lowered and the sliding gate at thelower part of the container mates with a similar slidinggate at the top of the vertical chute connected to themanufacturing equipment.
3. Simultaneously, the inflatable gasket at the top of the airbox is activated. It comes in close contact with a matchingplate of the container and tightly seals the air box.
Figure 2. Outside view of docking station.
Figure 3. Outline configuration of docking station.

JULY/AUGUST 2006 PHARMACEUTICAL ENGINEERING 3
Containment Performance
©Copyright ISPE 2006
4. After the air box is thoroughly cleaned with jets of air, bothsliding gates are pulled open, allowing the container andthe chute to achieve a tight connection.
5. Upon command, the butterfly valve of the container isopened allowing the contained ingredients to drop into themanufacturing equipment. (Indeed, during the dockingoperation, the tail of the bin valve did engage into arotating mechanism that can be commanded remotely bythe operator in the clean production room.)
For the undocking, the same sequence is applied in thereverse order.
With this mechanism, ingredients can be discharged intothe manufacturing equipment or from the manufacturingequipment into a receiving container without coming incontact with outside air, eliminating dust dispersion in corre-sponding rooms. During phases of cleaning and transfer ofingredients, the automatic opening of an exhaust valve al-lows the extraction of any potential dust particle and main-tains a favorable negative pressure inside the air box.
Testing Method for Assessing theContainment Performance
of the Docking Station The methodology followed for the experimental part of thisstudy is described in the ISPE Good Practice Guide: Assess-ing the Particulate Containment Performance of Pharmaceu-tical Equipment.3
Cleaning and Measurement of DustConcentration in the Areas to be Tested The experiments were conducted under realistic industrialconditions in a new solid dosage forms manufacturing plantbuilt in Japan.4,5 The rooms and concerned pieces of equip-ment have been carefully cleaned. Additionally, the dustconcentration in the concerned rooms has been measuredusing a particle counter. This particle count has been checkedbefore starting any other measurement, i.e., lactose, to en-sure that the working conditions would be comparable at alltimes.
CleaningA thorough cleaning of the rooms and the equipment used fortesting has been conducted and monitored by measurementof the dust dispersion rate (particle count). These areasincluded the tablet feed room where containment perfor-mance was measured, a production room used for storage ofinstruments, air filters, etc., a room used for cleaning theouter surface of the closed container after filling it withlactose, and the corridor as the AGV route from storage roomto tablet feed room.
The cleaning was performed by wiping with a clean nonfiber-releasing cloth, wetting with purified water, and in thefollowing sequence: ceilings, walls, windows, and floors. Thesame methodology has been applied to the cleaning of equip-ment, the docking station, closed container, AGV, and lifter.
Figure 4. Installation layout of docking station and sampling points.
Figure 5. Installed condition of air sampler.
Particle Count MonitoringAn instrument (suction rate: 2.83 l/min.; simultaneous count-ing error: 5% or less) was used to monitor the dust concentra-tion after cleaning as well as the variations in particle countcaused by operators entering or exiting the premises. Like-wise, it has been used to monitor the recovery time of theconsidered room prior to any other measurement, for ex-ample, lactose concentration in air.
In parallel with the measurement of the lactose dispersionrate of the docking station, the particle count has beendetermined in order to confirm its correlation with the dustcontainment performance.
Verification Method for ContainmentPerformanceMeasuring PointsThe layout of the docking station installation and correspond-ing sampling points according to the ISPE Good PracticeGuide are shown in Figures 4 and 5. The specifications for the

4 PHARMACEUTICAL ENGINEERING JULY/AUGUST 2006
Containment Performance
©Copyright ISPE 2006
Figure 6. Particle count in the room after cleaning.
air samplers are given in Table A. Air samplers were fixed atpositions Nos. 1 to 4 as shown in the horizontal view of Figure4, centering them on the butterfly valve used to drop ingredi-ents through the docking station into the manufacturingequipment.
The confirmation by particle count of the environmentsituation has been obtained with the particle counter locatednear the center of the room while the particle count of theDocking station has been performed with the counter in-stalled close to air sampler 4.
Test SampleAs recommended by the ISPE Good Practice Guide, a testsample of lactose, mass 25 kg, type 450M, has been used.Particles of diameter 63 micrometers or less accounted for98%, and those of diameter 150 micrometers or less ac-counted for 100%.
Sequence of Operations During the TestingProcedureThe following sequence has been applied:
a. Clean the rooms and equipment.b. Start the particle counter.c. Confirm the increase in room recovery time.
d. Transfer the closed container into the tablet feed roomusing the AGV.
e. Start the pump of air samplers and at the same time, openthe cover cap of the station (subsequently, the AGV leavesthe room).
f. Feed the sample into the tabletting room by opening thevalve of the container docked on the station.
g. After completion of the transfer, the AGV comes back inthe tablet feed room to take away the closed container.
h. Stop the pump of the air samplers 15 minutes after closingthe station’s cover cap.
i. Collect the filters (test samples kept in cold storage andtransported by refrigerated van)
j. analysis
Analytical MethodThe quantification of the lactose dispersion rate has beenobtained by HPLC using an electrochemical detector. Thelowest Limit of Quantification (LOQ) was set at 4 ng/filter,and calibration was made from 0.004 to 20 mcg/filter.
Using a suction rate of 2 l/min. and a sampling time of 30minutes, the detection limit of dispersion will be 67ng/ m³. Inthe case of a LOQ of 4 ng/filter or less, the value of 4 ng/filterwas used for calculation of the dispersion rate. The resultsobtained are shown in the graphs.
Testing ConditionsTests were performed under three different conditions:
A. docking/undocking operations performed with a closedempty container (Blank 1)
Table A. Specifications for air sampler.
Item Description
Type IOM Sampler, 225-70A
Sampling Rate 2 l/min
Sample Media 25 mm filter, Whatman, GF/F

JULY/AUGUST 2006 PHARMACEUTICAL ENGINEERING 5
Containment Performance
©Copyright ISPE 2006
B. lactose loaded into the closed container, container regu-larly docked and undocked on the station, but lactose nottransferred to manufacturing equipment (Blank 2)
C. normal operating conditions; lactose loaded into the con-tainer and transferred to the manufacturing equipment
Testing EnvironmentTemperature: 23.2 to 25.4°C; Relative Humidity: 19 to 54%.The dust dispersion rate of the docking station has beenmeasured three times in total, all under identical workingconditions.
ResultsDust Concentration After CleaningThe results of dust concentration measurements made in thetablet feed room after cleaning are shown in Figure 6. Thegraph refers to particles of 0.5 microns or more counted aftercleaning of the tablet feed room and equipment.
The particle concentration falls below the level of Class 6(ISO Standard, equivalent to Class 1,000 USA Federal Stan-dard) and stabilizes around 20,000 particles/m³ within 30minutes after cleaning operations, or after the entrance orexit of operators in the room, etc. For this reason, it wasdecided to start the measurement of dust dispersion rate ofthe docking station at least 30 minutes after the operatorscompleted their preparatory work and after cleaning opera-tions, the aim being to achieve particle concentrations of20,000 particles/m³ or less.
Measurement of Dust Concentrations at theDocking StationThe value of lactose concentration under Condition A (Blank1), where the docking operation is made with a closed emptycontainer, appeared at an undetectable level in all threemeasurements.
The results of the first series of measurements of lactosedust concentration during docking operations under Condi-tion B and Condition C appear in Figure 7. The concentra-tions of lactose corresponding to the four sampling positionsare within the range defined by the vertical red bars on thediagram.
The lactose concentration under Conditions B (Blank 2)where samples were not transferred to the manufacturingequipment runs between 70 and 180 ng/m³, while the particu-late concentration under these same conditions remainsbetween to 10,000 and 20,000 particles/m³. Since there isphysically no possible release of lactose particles coming fromthe transfer operations, (since no transfer was performed andthe container remained perfectly closed), this lactose concen-tration can only correspond to the background contaminationof the premises. It is, in any case, below the category 4 Levelof Merck’s Chemical Hazard Standard.6
The lactose concentration under Normal Operating Con-ditions C, where samples were transferred into the manufac-turing equipment, ranges between 50 and 130 ng/m³, whilethe particle concentrations under these same conditions runsbetween 5,000 and 15,000 particles/m³.
Figure 7. Dust concentration at the docking station.

6 PHARMACEUTICAL ENGINEERING JULY/AUGUST 2006
Containment Performance
©Copyright ISPE 2006
The experiments described above have been repeated asecond time and a third time under identical conditions andprovided similar results, leading to identical conclusions.This is shown in Table B.
Comments and DiscussionIn all cases, it appears that there was no measurable increasein lactose concentration during docking, undocking, or lac-tose transfer operations on the new docking station. Thisundoubtedly proves the tightness and good working condi-tions of the equipment.
Also, in all experiments, it appeared that the measuredconcentrations under Conditions C, when there is a transferof lactose are lower than under Conditions B, when there isno transfer. In the authors opinion, this is only an appear-ance. Indeed, as can be seen in Figure 7, the sampling time islonger in the case of effective transfer and consequently thequantity of sampled air is also greater. The greater dilutionmay explain this lower concentration.
Under Conditions A (no lactose in the container), theconcentration of lactose was below detectable limit. UnderConditions B and C; however, this concentration is 100 ng/m³.This is explained by the fact that a minute quantity of lactosehas probably deposited on the closed container during fillingand has been dispersed in the room by the HVAC systemduring transfer by the AGV. In other words, what wasmeasured in these cases is a background concentration oflactose in the room.
The experience gained through these trials also has leadus to the following considerations. The selection of Lactose asa reference tracer for the trials performed by the workinggroup in charge of developing the ISPE Good Practice Guidewas based on the following: availability of this materialworldwide, ease of standardization, relative ease of assay,etc. However, one may wonder since lactose is used exten-sively in industrial quantities, practically in all Oral SolidDosage (OSD) Forms facilities, if it will not present inconve-niences in some situations where there may exist traces ormicro-traces of lactose in the room air. Making a blank on theroom air is not always the best way, especially if the lactosecontamination in air is relatively high and if the equipmentis tested for micro-leaks. In such cases, the use of anothertracer would resolve the issue and one might think of usinga product like micro-pulverized sodium chloride, that is less
in use in OSD facilities, easily available worldwide, and veryeasy to assay in trace amounts by flame photometry.
Summary and ConclusionsThe application of the methodology presented in the ISPEGood Practice Guide for evaluation of the containment per-formance of industrial equipment, under strict experimentalconditions, and in an industrial environment, resulted in thefollowing:
1. No increase in lactose dust concentration between theblank where the lactose is not transferred and the real testwith lactose transfer could ever be evidenced.
2. In all cases, the lactose dust concentration averaged 100nanograms/m³, but this is also the background concentra-tion measured with the lactose blank without transfer.
3. In the worst case, that is even if one would not take inaccount the lactose background concentration (blank) inthe transfer room, the absolute maximum dispersion ratevalue obtained would be 130 ng/m³.
4. In no case has the dust dispersion rate ever reached 200ng/m³; which demonstrates that the station is capable offully meeting the Exposure Control Limit (ECL) level of 1mcg/m³ or less, corresponding to Category 4 (high toxicity)of Merck’s Chemical Hazard Standard.6
5. These results do position the station at the level or betterthan isolators in terms of containment of pharmaceuticalequipment.
References1. Lhoest, Willy J., “Twenty Years of Experience in Powder
Transfer Technology: Docking Stations, Vital Componentsin Bin Technology and Modern Plant Automation,” Phar-maceutical Engineering, March/April 2002, Vol. 22, No. 2,pp. 8-25.
2. Gurney-Read, Paul, and Martin Koch, “Guidelines forAssessing the Particulate Containment Performance ofPharmaceutical Equipment,” Pharmaceutical Engineer-ing, May/June 2002, Vol. 22, No. 3, pp. 55-59.
3. ISPE Good Practice Guide: Assessing the Particulate Con-tainment Performance of Pharmaceutical Equipment, In-ternational Society for Pharmaceutical Engineering (ISPE),First Edition, January 2005, www.ispe.org.
4. Kowa Company, Ltd., “2005 Facility of the Year Finalist:Nagoya Factory Building H,” Pharmaceutical Engineer-ing, March/April Special Edition, 2005, p. 12.
5. Masuda, Hiroto, Yukio Fukushima, Satoru Hasegawa,and Tadatoshi Iwabuchi, “Containment Performance Veri-fication of the newest Docking Station according toSMEPAC Evaluation Technique and applied to LatestPharmaceutical Plant for Oral Solid Dosage Forms,” PharmTech Japan, Vol. 20, No. 1, 2004, pp. 77-84.
6. Naumann, Bruce D., Edward V. Sargent, Barry S.Starkman, William J. Fraser, Gail T. Becker, and G. DavidKirk, “Performance-Based Exposure Control Limits forPharmaceutical Active Ingredients,” AIHA Journal, Vol.57, 1996, pp. 33-42.
Range of concentrations measuredduring the three series of experiments
In absence of With transfertransfer through through
the station the station
First series of experiments 70 to 180 ng/m³ 50 to 130 ng/m³
Second series of experiments 70 to 170 ng/m³ 50 to 70 ng/m³
Third series of experiments 80 to 90 ng/m³ 60 to 70 ng/m³
Table B. Lactose concentrations measured according to the ISPEGood Practice Guide indicate that the transfer of lactose is performedwithout any release of particles in the room environment.

JULY/AUGUST 2006 PHARMACEUTICAL ENGINEERING 7
Containment Performance
©Copyright ISPE 2006
About the AuthorsHiroto Masuda is a Researcher and Engi-neer in Matsudo Research Laboratory,Hitachi Plant Technologies, Ltd., Japan. Hehas been involved with many projects in thepharmaceutical, bulk solids handling, andpower plant industries where a material han-dling system is used. He graduated fromYamagata University with a bachelor of me-
chanical engineering in 1992. He holds a construction man-agement engineer of national qualification and is a memberof the Japan Society of Mechanical Engineers, the JapanSociety of Chemical Engineers. He can be contacted by e-mail: hiroto.masuda. [email protected].
Yukio Fukushima is a General Manager ofMatsudo Research Laboratory, Hitachi PlantTechnologies, Ltd. He earned a BS from OsakaUniversity, Japan. He is responsible for thefood manufacturing plant, pharmaceuticalmanufacturing plant, and the air condition-ing system. He is a member of ISPE, JapanSociety of Chemical Engineers, Japan Soci-
ety for Food Engineering, and Japan Society for Antibacterialand Antifungal Agents. He belongs to the working group ofthe Standardized Measurement of Equipment ParticulateAirborne Concentration (SMEPAC) Committee. He can becontacted by e-mail: yukio.fukushima.pd@ hitachi-pt.com.
Hitachi Plant Technologies, Ltd., 537 Kami-Hongo,Matsudo-shi, Chiba, 271-0064 Japan.
Satoru Hasegawa is a General Manager ofIndustrial Plant Div., Hitachi Plant Tech-nologies, Ltd. He graduated from SaitamaUniversity with a bachelor of mechanicalengineering in 1983. He has been involvedwith many projects in pharmaceutical manu-facturing plant, mainly for Oral Solid DosageForms. He was a project manager of Nagoya
Factory Building H, Kowa Company, 2005 Facility of theYear Finalist. He is a member of ISPE, OSD Working Groupin the ISPE Japan Affiliate. He can be contacted by e-mail:satoru. [email protected].
Hitachi Plant Technologies, Ltd., 13-2 Kita-Otsuka 1-Chome, Toshima-ku, Tokyo, 170-8466 Japan.
Tadatoshi Iwabuchi is a Chief Engineer ofthe pharmaceutical plant at Hitachi PlantTechnologies, Ltd. He holds a MS in me-chanical engineering from Hosei University,Japan. He has 11 years of experience in OralSolid Dosage (OSD) plant engineering. Hewas a member of the Facility Design Team ofNagoya Factory Building H, Kowa Company,
2005 Facility of the Year Finalist. He can be contacted via e-mail at [email protected].
Willy Lhoest is Professor Emeritus in phar-maceutical engineering, formulation andtechnology at the University of Louvain, Bel-gium, where he founded the studies andMaster degree in pharmaceutical engineer-ing. He is also co-founder and President ofthe pharmaceutical engineering companyElveco SA in Brussels, Belgium. Professor
Lhoest is well known for having introduced and implementednew concepts in pharmaceutical plant design, including the“Lhoest Concepts” recognized and used in many pharmaceu-tical OSD facilities worldwide. He is a pharmacist, holds aPhD in pharmacy from the University of Louvain, Belgium,and a Masters degree from the University of Wisconsin. Hedevoted more than 50 years to the pharmaceutical industryof which 27 was in engineering/manufacturing services atGlaxo SmithKline Beecham as director of European manu-facturing services. He has been sitting on the European andBelgian Pharmacopoeia Committees. He was elected Engi-neer of the Year 1987 by ISPE (USA) and has been grantedthe 1994 International Pharmaceutical Federation (IPF)award for outstanding contributions to the pharmaceuticalindustry. He is the author of more than 40 papers and ownerof 15 patents, all related to industrial pharmacy.
1, Rue H. Krains, 4260 Fallais, Belgium, tel: 32-19-69 9807, e-mail: [email protected].

JULY/AUGUST 2006 PHARMACEUTICAL ENGINEERING 1
Industry Interview
©Copyright ISPE 2006
Drs. Ben Machielsewas appointed Se-nior Vice President,Operations, in Janu-ary 2005. Namedsenior vice presi-dent, quality, in Sep-tember 2003, hismost recent promo-tion expanded hisarea of responsibil-
ity to include all manufacturing and supplychain operations in addition to the company’squality operations. Since joining MedImmunein May 1999, Drs. Machielse has led the growthof the quality department from 80 to more than300 people, including the incorporation of thequality-related activities from the U.S. Bio-science and Aviron acquisitions. Prior to join-ing MedImmune, Drs. Machielse was vice presi-dent of quality control and quality assurancefor Xoma Corporation of Berkeley, CA. He alsospent several years in various manufacturingand quality positions at Centocor BV of theNetherlands. Drs. Machielse holds a BS inmedical biology and an MS in biochemistryfrom the University of Utrecht, The Nether-lands.
Q MedImmune is implementing an Opera-tional Excellence (OE) program. What is
the purpose of the program?
A MedImmune has created a culture of con-tinuous improvement among its employ-
ees. Our goal is to better address customerneeds by meeting all production requirementsand providing a faster response time for cus-tomers. An OE program also provides a frame-work for the organization’s quality improve-
ments. It is imperative to integrate the pro-gram into all aspects of operations, includingmanufacturing, quality, compliance, facilities,and the supply chain. Continuous Improve-ment (CI) is not the driving factor; it is theconsequence of a flawless operation.
Q Has the FDA’s Critical Path Initiative orthe Pharmaceutical Quality Initiative in-
fluenced the structure or focus of your pro-gram?
A While the OE program is tied to theFDA’s Critical Path Initiative, the imple-
mentation of the OE program is one ofMedImmune’s key business initiatives. A goodOE program consists of active management ofthe process based on a strategic plan that de-fines long-term objectives. The program willactively measure improvements and gainedefficiencies. Three elements are the essentialbasics of a successful OE program:
• a general understanding and acceptance ofthe program by all employees
• support by senior management• ongoing employee training, such as Six
Sigma, to provide employees with the skillsand tools to support OE projects to the bestof their abilities
Q What are the long-term goals and per-ceived benefits of this program?
A There are several goals and perceivedbenefits. We will benefit from a better
process definition and less variability. The pro-gram will allow us to reduce production timeand get our products into the clinic or to thecommercial side of the business faster.
PHARMACEUTICAL ENGINEERING InterviewsDrs. Bernardus (Ben) N.M. Machielse,Senior Vice President, Operations,MedImmune, Inc.
This interviewpresents acandid look atMedImmune'sOperationalExcellenceProgram,including howthey areimplementingleanmanufacturing(Six Sigma) inall aspects oftheir operationsas a frameworkfor continuousimprovement.
It wasconducted byCathyMiddelberg,Wyeth Biotech,and member ofthe ISPEEditorialCommittee.
Reprinted from
PHARMACEUTICAL ENGINEERING®
The Official Magazine of ISPE
July/August 2006, Vol. 26 No. 4

2 PHARMACEUTICAL ENGINEERING JULY/AUGUST 2006
Industry Interview
©Copyright ISPE 2006
We [MedImmune] will utilize leanmanufacturing (Six Sigma) techniquesto optimize our processes and valuestreams, resulting in:
• reduced production time• improved quality• reduced cost• faster response time• reduced time to market
Q Will you apply this program tomanufacturing, R&D and/or vali-
dation? Any other areas?
A Yes. We are looking forward to abroad implementation of the OE
program. We expect the program toreduce production time, make processesmore efficient, and improve processanalysis. As MedImmune continues togrow, the company also has outgrownsome of its manufacturing processes.The OE program will help us adjustour manufacturing process so that itremains efficient as the company grows.
Q What tools is MedImmune goingto utilize in this program?
A There are tremendous opportuni-ties to make our manufacturing
operations more efficient. The plan isnot to reinvent the wheel, but to applythe OE program to improve existingprocesses. Training our employees isthe foundation of our program. Ourmanufacturing employees must receivetechnical and quality training. We mustdevelop the skills of our middle man-agement personnel. Since change oc-curs constantly, we are committed toreviewing and assessing the effective-ness of our training program on anannual basis.
Q How will MedImmune measurethe success of the program? What
metrics will they apply?
A We are developing the methodolo-gies of the program, and will be-
gin looking at measures for success as
a next step. We will define simplemetrics so that people understand theimpact and benefit of the program.
It is important to have a firm graspof the OE program to ensure a success-ful implementation. And, as a generalrule of thumb, the OE program shouldbe supported by senior management,but driven by all employees across theorganization.
Q Can you provide an example ofwhere you have, or will, apply
this program?
A The program correlates withquality improvements and inte-
grated excellence in all aspects of op-erations such as manufacturing, qual-ity, compliance, facilities, and the sup-ply chain. With the growth ofMedImmune’s business, our numberof suppliers for raw materials and con-tract services have increased. Manag-ing our supply chain has become in-creasingly complex and critical to oursuccess.
Q What can professional organiza-tions like ISPE do to support the
development of OE programs?
A Professional organizations suchas ISPE can help communicate
the benefits of an OE program by host-ing guest speakers, discussion groups,and workshops. The industry wouldbenefit from the analyses of case stud-ies and the development of best prac-tices through collaboration of industryleaders. ISPE could facilitate the de-velopment of industry standards andbenchmark databases.
Q What suggestions do you havefor firms who are interested in
starting their own OE program?
A Start slowly, identify the “low-hanging fruit” to prove the con-
cept. Manage the flow of projects intothe OE program so that the systemisn’t overloaded. As stated above, de-fine simple metrics so that people cansee and understand the impact theprogram has. From the beginning, de-sign an OE program that provides real-time input so that operations can beassessed immediately.
About MedImmune Inc.With approximately 2,300 employees worldwide, MedImmune is headquar-tered in Maryland with facilities in Pennsylvania, California, Kentucky, theUnited Kingdom, and the Netherlands. The company relocated its corporateheadquarters to a new state-of-the-art facility in March 2004, designed toplace research functions at the core and enhance the collaborative potentialof researchers and developers.
The company is focused on the areas of infectious diseases, cancer, andinflammatory diseases. The company has four marketed products and anadvancing pipeline of promising candidates, all designed to treat or prevent anumber of debilitating or life-threatening diseases.
MedImmune’s state-of-the-art R&D facility and worldwide corporate headquarters islocated in Gaithersburg, Maryland.

JULY/AUGUST 2006 PHARMACEUTICAL ENGINEERING 1
Water System Design
©Copyright ISPE 2006
This articledescribes a waterpurificationsystem for aGMP pilot plantthat usesmodular, off-the-shelf purificationcomponentschosen to controlcost, maximizevalidationefficiency, andmeet USPrequirements forpurified water.
Design, Qualification, andPerformance of a Cost-Effective WaterPurification System for a GMP PilotPlant
by Joseph Tunner, George Katsoulis, JeffreyDenoncourt, and Sean Murphy
Introduction
One of the most critical utility systemsin a plant operating in compliancewith Good Manufacturing Practices(GMPs) is the purified water system.
The United States Pharmacopeia (USP), whichsets standards for different water qualities,states that “Water for Injection (WFI) is in-tended for use in the preparation of parenteralsolutions”.1 However, for other pharmaceuticalapplications, the guidance is more general andintended to ensure that the user designs awater system fit for the intended purpose. Inmany applications, a suitable water system
can be defined as providing water meeting thecurrent USP monograph for purified water.This definition allows the system designer toconsider alternatives to the typical stainlesssteel WFI system, while achieving the desiredwater quality in a more affordable and manage-able manner.
A water purification system was constructedusing modular, off-the-shelf purification compo-nents chosen not only to control cost and maxi-mize validation efficiency, but also to meet theUSP requirements for purified water. Accordingto the ISPE Baseline® Guide on Water andSteam Systems, “Pharmaceutical equipment and
Figure 1. Water systemschematic.
Reprinted from
PHARMACEUTICAL ENGINEERING®
The Official Magazine of ISPE
July/August 2006, Vol. 26 No. 4

2 PHARMACEUTICAL ENGINEERING JULY/AUGUST 2006
Water System Design
©Copyright ISPE 2006
piping systems rely extensively on stain-less steels to provide the non reactive,corrosion resistant construction neededin manufacturing and heat steriliza-tion. However, thermoplastics are avail-able that may offer improved qualitiesand/or lower cost.”3 The installed sys-tem utilized polypropylene piping ratherthan the traditional stainless steel dis-tribution system to further control thesystem installation cost and ongoingmaintenance.
This article describes a unique GMPpilot plant water system installed in asmall solid dose pilot plant operatingin compliance with GMPs for use in themanufacture of clinical supplies forhuman trials. Details of the designconsiderations and selection, systemdescription, and system validation arepresented. Water test results from thesystem performance qualification aredetailed, followed by a complete dataset for a year of operation. Systemexcursions for TOC and microbial moni-toring are noted and the actions takento resolve them are presented.
Water Purification SystemDesign Considerations
and SelectionThe project began with an assessmentof an existing reverse osmosis/deion-ization (RO/DI) water system for ex-
pansion and validation. The existingsystem fed 10,000 square feet of labo-ratories with 20 Points Of Use (POU)and required expansion to feed a new3,000 square foot GMP solid dose pilotfacility (the main project) with five newPOU. The user’s requirement was for150 gallons per day of purified waterappropriate for equipment (productcontact) and facility washing as well asfor direct product addition.
Adopting a risk-based approach, theexisting system was surveyed andfound to be unacceptable for this pur-pose. Primarily a general laboratorysystem, it had evolved over time andincorporated many undesirable fea-tures, such as check valves on deadlegs and some very long pipe runs. Themost significant challenge, apart fromthe cost of remediation, was to gaincontrol over a multi-user/departmentsystem where, for example, it was notuncommon to find flexible hose connec-tions from laboratory faucets thatdangled into the drains.
The option of creating a secondaryloop from the storage tank of the exist-ing system to the new facility was re-jected quickly due to the distances andphysical obstacles involved. In addi-tion, the generation system was notcontrolled from a GMP perspective andrequired significant remediation effort.
Another option was to expand theexisting RO/DI system and add asupplementary purification system ata single POU in the new facility, suchas a water purification system. Thisoption was rejected for four reasons.First, the required usage rate of 150gallons per day was too high for such asystem to be practical. Second, distrib-uting water to the various suites wouldhave involved transporting containerssome distance and through multipledoorways. The nature of the potentdrug substances in use would havenecessitated decontamination of thesecontainers before removal from thesuites and the risk of contaminatingthe water was unacceptably high.Third, some applications would haverequired additional equipment to pres-surize the water. Again, this was a costand contamination risk. Finally, froma qualification perspective, the lack ofcontrol over the feed water quality tothe terminal system would, by defini-tion, translate to a lack of control overthe supplied water from it.
A stand-alone system was justifiedand approved with issues related tothe unanticipated incremental cost ofthe larger project. The water qualityspecification was set as described inUSP 25 and a location for the systemwas identified, adding the constraintof a space 10 feet long, nine feet high,and three feet deep.
All except one of the vendors offeredcustomized skid-based stainless steelsystems centered on domestic RO mem-branes. These vendors would not guar-antee the water quality output fromtheir proposals and suggested a “buildit and see” approach due to the uniquenature of their systems. They werecomparatively expensive due to thestainless steel design and incorporatedunsophisticated controls. The skid de-signs were large and difficult to keepclean and accessible for maintenance.
The selected vendor offered a modu-lar design with a number of ‘off theshelf’ components, each of which hadan established history of use and per-formance as well as an attractive price.Each major component incorporated ahigh level of instrumentation includ-ing diagnostics, alarming, and I/O forFigure 2. Purified water system: major components.

JULY/AUGUST 2006 PHARMACEUTICAL ENGINEERING 3
Water System Design
©Copyright ISPE 2006
remote monitoring of pertinent statusand performance data. Quotations in-dicated a 50% lower total cost, a fasterdelivery time, and the advantage ofpre-written qualification protocols of-fered by the selected vendor for themajor components.
A final design consideration wasthe selection of materials for the waterdistribution loop. A simple purifiedwater loop does not require regularheat sanitization. Therefore, both stain-less steel and all thermoplastic pipingsystems were possible options. The ad-vantages of plastic systems are re-viewed in detail elsewhere.4 In short, aplastic system was selected based oncost, reduced maintenance, and ease ofinstallation. Polypropylene (PP) wasselected over Polyvinylidene Fluoride(PVDF) because it provided a morecost- effective system with high puritycomponents.
The major components of the se-lected system are described below. Thepurification process is illustrated sche-matically in Figure 1. The actual sys-tem and a point of use are shown inFigures 2 and 3, respectively.
• A reverse osmosis water purifica-tion system (reverse osmosis sys-tem) with pretreatment as the start-ing point and initial purification ofthe total system.
• A 350 liter (90 gallon) storage reser-voir system (storage reservoir) meetspeak daily demands and includesan in-tank UV and vent filtration toprevent contamination at this point.
• A high purity polishing purificationsystem (polishing system) utilizesion exchange, organic removal, andmembrane cartridges to polish wa-ter to higher purity levels. In thissystem, this device is used to bothpolish the reverse osmosis waterand maintain quality of the storedand distribution loop water.
• Distribution equipment includingpump, loop UV unit (254 nm), and0.22 micron filtration deliver waterto distribution piping and ensurewater quality. A resistivity meter
continuously monitors resistivityof the distributed water. Purifiedwater is recirculated continuouslythrough 343 linear feet of 32 mm/1.02 inch ID (DN-32) polypropy-lene piping with 33 elbows andfive tees (the POU).
System control, monitoring, andalarm inputs and outputs were in-cluded with each major component(listed above). The key alarms fromeach major component were consoli-dated to a single alarm input of avalidated electronic data recorder.An analog output from the resistiv-ity meter also was fed to a channel ofthis unit, which was configured withhigh, low, and low-low alarms as wellas data logging and historical trend-ing.
Feed water from the city supplyfirst passes through pretreatmentincluding a five micron prefilter andcarbon filter cartridges before enter-ing the Reverse Osmosis (RO) sys-tem. The RO system includes an ad-ditional integrated pretreatment car-tridge pack with activated carbon, a0.5 micron prefilter, and a calciumhardness sequestering compound.This combination of pretreatmentprotects the reverse osmosis mem-brane from damage due to foulingfrom particulates, chlorine oxidation,and formation of mineral scale on themembrane surface. The sequester-ing agent is a solid, long chainpolyphosphate that weakly bindscalcium ions and minimizes calciumcarbonate precipitation (scale). Theuse of the sequestering agent withinthe system pretreatment cartridgepack was particularly important inthe system design as this eliminatedthe need to use softening for remov-ing calcium hardness from the feedwater supply; therefore, saving con-siderable space.
Pretreated water continuesthrough a high pressure pump thatboosts water pressure before enter-ing the reverse osmosis membranecartridge. The high pressure forceswater through the reverse osmosismembrane with contaminants beingrejected by the membrane between
Figure 3. Point of use.
95 and 99%. Water is rinsed continu-ally along the upstream side to con-tinually flush contaminants to drain.Approximately 35% of the feed waterentering the system is processedthrough the membrane as productwater at a rate of 30 liters per hour,providing the required 150 gallons perday. Reverse osmosis system perfor-mance is monitored including feed andproduct water conductivity and thecalculated % ionic rejection.
The water leaving the reverse os-mosis system requires additional puri-fication to meet the USP purified wa-ter quality requirements. Therefore,the reverse osmosis system productwater enters the polishing system,which includes mixed-bed ion-ex-change, organic removal, and 0.22 mi-cron membrane filter cartridges to re-move ions, organics, and bacteria effec-tively. A resistivity meter monitors thewater quality exiting the polishing sys-tem as the last step before delivery tothe 350 liter storage reservoir.
The primary purpose of the 350 literconical bottom storage reservoir is tobuffer the fluctuating demands of up to350 liters (~90 gallons). In addition,the storage reservoir includes a built-in UV light to prevent bacteria growthand vent filtration. Vent filtration in-

4 PHARMACEUTICAL ENGINEERING JULY/AUGUST 2006
Water System Design
©Copyright ISPE 2006
Figure 4. TOC readings during the PQ.
cluded a 0.5 µm nominal filtration anda solid granular soda lime integratedinto a single cartridge to prevent in-gress of airborne contamination. A tanklevel sensor interfaces with the reverseosmosis system to refill the storagereservoir automatically and provide alow storage reservoir water level sig-nal that protects the distribution pump.
The distribution pump delivers wa-ter through the loop 254 nm UV unitthat serves to disinfect the purifiedwater followed by a 0.22 micron abso-lute membrane filter for additionalbacteria control. The purified water isdistributed at 15 gallons per minute tothe five use points before returning tothe 350 liter storage reservoir. A backpressure regulating valve at the returnassures a minimum pressure is main-tained at all POU.
Points of use in the manufacturingsites were recessed in the wall - Figure3. This protected the ports from dam-age as the pilot plant utilized portablepowder processing equipment, whichwas large and cumbersome to move.However, the recess was difficult toaccess and as a design feature couldpromote the practice of leaving flexiblehoses in place. This did not occur be-cause the area operators also were re-sponsible for system sampling and fullyunderstood the importance of avoidingthis practice.
The distribution pump and distri-bution piping were selected together to
meet target flow rates and pressurerequirements and to assure that a mini-mum flow velocity of five feet per sec-ond was sustained. Maintaining mini-mum flow velocity, continuous recircu-lation, and reducing dead legs are con-sidered industry “good design practices”to minimize risk of bacteria prolifera-tion. A 15 Gallons Per Minute (GPM)flow rate though 32 mm (1.02 inch ID)polypropylene distribution piping re-sults in a flow velocity of ~5.9 ft/s.
An important design feature of thesystem includes the use of the polish-ing system to both process the reverseosmosis system product water and pro-cess approximately three gallons perminute of distribution flow from theloop UV unit before recirculating di-rectly back to the 350 liter storagereservoir. In summary, 18 gallons perminute from the distribution pumppasses through the UV unit, 15 GPMcontinues through the 0.22 micron fil-ter and facility distribution loop pip-ing, while three GPM is processedthrough the polishing system back tothe storage reservoir. Pressure selec-tion at key points during the designallows both the reverse osmosis prod-uct water and three gallons per minuteof the distribution flow to be processedthrough the polishing system. This dualuse of the polishing system maintainedthe distribution loop resistivity aboveUSP Purified Water requirements, con-sistently greater than 16 megohm•cm
in the main loop.During start up, the system ini-
tially was filled with RO water andsanitized utilizing bleach at approxi-mately 200 ppm concentration anddrained. The polishing loop cartridgesand loop filter were installed and thesystem refilled and polished until therequired water quality based on TOCand conductivity measurements wasmet. The periodic system maintenanceprocedure required the same sanitiza-tion and cartridge change out processannually.
Water System QualificationThe typical three-stage qualificationapproach was followed, starting withthe Installation Qualification (IQ),transitioning to an Operational Quali-fication (OQ), and finishing with thePerformance Qualification (PQ). Forthe IQ and OQ, full advantage wastaken of the vendor-supplied valida-tion protocols for each major systemcomponent, which were supplementedwith an internally generated protocoltying the system together as a whole.
As USP 25 specifies, the IQ stageshould consist of “instrument calibra-tions, inspections to verify that the draw-ings accurately depict the as-built con-figuration of the water system, andwhere necessary, special tests to verifythat the installation meets the designrequirements.”6 The vendor-provided IQprotocol package for each of the indi-vidual primary components (reverseosmosis, polishing system, and storagereservoir systems) was used to provideverification of the hydraulic and electri-cal connections as well as the systemdrawings. An internally generated IQprotocol collected the details of all refer-ence documentation, instrument andutilities verifications, spare parts veri-fication, and drawing verification forthe entire system as a whole.
The vendor supplied OQ protocoland a vendor technician were used totest the primary components to provethat they were operating according tothe vendor’s specifications. Accordingto USP general chapter 1231, “A vali-dation master plan for a water systemtypically includes... an OQ stage con-sisting of tests and inspections to verify

JULY/AUGUST 2006 PHARMACEUTICAL ENGINEERING 5
Water System Design
©Copyright ISPE 2006
that the equipment, system alerts, andcontrols are operating reliably...”6 Thisincluded testing of the equipment’scontrols and operation with both liquidpath hydraulic and electronic tests.Specific testing of the system operat-ing alerts was performed by simulat-ing values on the system and exceed-ing the system limits using a calibratedinstrument from the manufacturer. Theinternally generated OQ protocol pro-vided the overall system OQ, whichverified system operation including thedistribution loop (point of use pres-sures, temperatures, and flow rates),water system generation, storage sys-tem operation, and alarms.
The purpose of the PerformanceQualification was to demonstrate thatthe system produced and maintainedre-circulating water that meets thecompendial requirements of USP puri-fied water over a suitable time period.The qualification period was chosen tostrike a balance between time and test-ing burden (cost), the need to demon-strate a robust system (reliability), aswell as the knowledge that the systemwas intended for an oral dose facilityand would continue to be monitoredindefinitely following completion of thequalification testing (risk mitigation).After considering these requirements,a six-week qualification period wasapproved.
A test schedule was prepared withsamples drawn from every room PointOf Use (POU1 through POU5) and TestPort 1 at the outlet of the polishingsystem on Mondays, Wednesdays, andFridays. Test Port 1 was of particularnote as it immediately follows the pol-ishing system without the UV light orfinal loop filter that precedes all loopports. Hence, Test Port 1 provides themicrobial performance of the purifica-tion system independent of the loopbioburden control elements. Allsamples were tested for Total OrganicCarbon (TOC), conductivity, andbioburden. The city feed water to thesystem also was tested for bioburdenand coliform bacteria.
Acceptance criteria for the systemwere based on USP 25. All ports in thesystem required a TOC result < 500ppb. Conductivity specifications are
temperature dependent, with a rangeof < 1.0 and < 1.1 µS/cm correspondingto a “normal” room temperature rangeof 15 to 20°C.5 The USP bioburdenrequirement of <100 CFU/mL wasused.6
The city feed water was monitoredfor bioburden For Information Only(FIO). The feed water was required tohave no detectable coliform bacteria.
Samples were collected using a hoseattached to the port via a tri-clampfitting with an initial 3 L purge prior tocollection. If the area had been used forpowder processing, the port was cleanedprior to either sampling or use withwater and alcohol and the purge vol-ume was doubled to ensure removal ofthe alcohol. Samples for chemical analy-sis were collected in a 50 mL glass vialwith an untreated Teflon-faced stop-per, which had been prepared by triplerinsing, 3% hydrogen peroxide rinsing,and then final rinsing again prior tosample collection. Microbial sampleswere collected in sterile 125 mL polypro-pylene bottles.
Chemical analysis was performedin-house using an Anatel CorporationTOC Analyzer, Model Access 643P,which reported both TOC and conduc-tivity. All microbial testing was per-formed by Quandrants Scientific.Bioburden was determined by the Het-erotrophic Plate Count procedure2
where 1 mL of water was mixed withmolten R2A agar (agar below 46°C),
plated, and incubated at 30-35ºC forthree to five days. Samples were testedin duplicate, and the average of the twoplates was reported. Total coliform wastested using the Standard TotalColiform Membrane Filtration proce-dure7 where 100 mL of water was fil-tered through a sterile 0.45 micronfilter, the filter was placed on LES m-Endo Agar, and incubated at 34.5-35.5°C for 24 hours.
Performance Qualification testingwas performed during February andMarch of 2003. Conductivity at allpoints in the system behaved similarlywith values ranging from 0.10 µS/cm to0.70 µS/cm with most values well be-low 0.50 µS/cm (data not shown). Allresults met the process qualificationconductivity requirements.
TOC testing during this period dem-onstrated two days during the secondweek with unacceptably high TOC read-ings above the 500 ppb acceptance cri-teria in three samples - Figure 4. Ana-lytical Laboratory Investigations didnot identify a testing error, and aninvestigation was performed. Reviewof the sampling indicated that a newtechnician had collected the highsamples. Considering that other portsin the system demonstrated accept-able results on the test days in ques-tion and that the primary technicianhad likewise consistently collectedpassing samples, the deviation wasattributed to operator technique. As is
Figure 5. Regular weekly monitoring TOC results.

6 PHARMACEUTICAL ENGINEERING JULY/AUGUST 2006
Water System Design
©Copyright ISPE 2006
typical, the technician in question un-derwent technique review with retrain-ing to correct issues observed. Follow-ing this, all samples for the remainingfour weeks of the qualification wereacceptable.
System bioburden during the testperiod was consistently very low. Morethan 100 samples were taken over thecourse of the qualification withbioburden results of zero for all but sixsamples, which yielded one CFU infive cases and two CFU in the lastcase. These isolates were identified tothe genus level FIO. Of the seven iso-lates, three proved non-viable andcould not be further propagated, onewas Staphylococcus hominis, one wasBacillus cereus, and two isolates werePseudomonas aeruginosa. Of theseisolates, P. aeruginosa is of specialconcern as it does have the capacity tocause disease and can thrive in nutri-ent poor environments. It is an aero-bic gram-negative bacteria found inwater, soil, and on the surfaces ofplants and animals. Both isolates werefrom the same sample, and were theonly sample from that port collectedthat yielded an isolate. As this isolatewas not obtained in any other sample,and was never isolated from this orany other location during the remain-ing weeks of the qualification, it wastreated as an isolated event and thesystem was accepted with continuingmonitoring. Over the course of thenext year, no further isolates of anynature were obtained from this loca-tion, which underscored this event asisolated.
Feed water monitoring results wereas expected for potable city water.Bioburden typically ranged from 1,000To Too Numerous To Count (TNTC).However, at no time were coliform bac-teria isolated in the feed water. Thebioburden results for the incomingwater when compared to results for there-circulating system demonstrated therobustness of the incoming water treat-ment system.
Final evaluation of the system dem-onstrated consistently low TOC, con-ductivity, and bioburden in the sys-tem. Following approval of the valida-tion report in June of 2003, the system
was considered acceptable for themanufacturing of solid dose (i.e., tab-lets) clinical supplies.
Water System PerformanceFollowing the process validation, on-going system monitoring and releaseof tested water is a standard require-ment for GMP water systems. Waterwas sampled and released on a weeklybasis. The two points considered to bemost critical, Test Port 1 at the genera-tor and POU3 in the primary GMPmanufacturing room, were alwaystested. The remaining four ports inrooms used for development and forequipment cleaning were sampled on arotating basis every month. The citywater also was tested on the monthlyschedule to verify the absence ofcoliform bacteria.
Test results for each week were com-piled by the analytical chemistry teamand submitted to the quality assurancegroup for weekly release. The releasecertificate for each week was attachedto the lot files for any GMP drug productbatches manufactured. As part of batchrelease, acceptable release results wererequired from the sampling date priorto and after the used date of the water inthe drug product batch. This systemtesting was performed from the close ofthe validation in March 2003 throughOctober of 2004 with the resulting dataset covering more than one year of sys-tem operation.
TOC results over the course of thisperiod are generally acceptable withmost values consistently below 50 ppb- Figure 5, which is consistent with arecent survey indicating more than 90%of pharmaceutical water systems areoperating with TOC levels below 70ppb.8 However, two excursions abovethe 500 ppb system limit and one spikeare noteworthy.
In April 2003, the TOC spiked abovethe action limit of 500 ppb with valueson the order of 3500 ppb. These resultswere consistent across all ports in thesystem. It was determined that theroot cause of the incident was an errorin the equipment operating procedure,EOP-000-075, which specified use ofan inappropriate refilling procedure ofthe storage tank acid overflow device.
This resulted in system contamina-tion, as was evidenced by the high TOCresults. The system was drained, sani-tized, deionization beds replaced,flushed, and restarted with testing inlate April. Following sanitization, theinitial TOC values were on the order of250 ppm, and within a week, the con-tinuous re-circulation of the waterthrough the deionization loop had re-stored the system back to 20 to 40 ppbby the following test date.
The timing of this sanitization wasadvantageous because it provided theopportunity to solve a system designproblem. As the system was utilizedover the first months of operation, theTeflon-faced diaphragms in the valveports had proven difficult to close andseveral locations had developed minorleaks and drips, which were difficult tocontrol and required a system shutdown to repair. While correcting thesystem contamination, the valve dia-phragms at the point of use dropsthroughout the system were changedfrom Teflon-faced to EPDM to preventfurther leakage. This replacement wasdocumented as part of the normal facil-ity change control process. No subse-quent issues were noted with the newdiaphragm material, which perma-nently solved the drip issue.
The second excursion was a TOCreading of 501 ppm. As this was greaterthan the 500 ppm limit, an investiga-tion was initiated and performed. Inthis case, however, the sample wasspecific to one location and not repro-duced at other drops in the system. Theinvestigation identified that when thesample was taken, significant powderprocessing was ongoing the same day.Subsequent follow-up samples were atthe normal level below 50 ppb. Thisexcursion was then closed as an iso-lated incident with an assignable cause.The corrective action was to restrictsampling to occur prior to any powderprocessing on the sampling day andproved effective at preventing recur-rence.
The final spike in TOC is notewor-thy as it demonstrates the effect ofannual maintenance performed in lateMarch 2004. Per procedure, the sys-tem was taken down for annual cali-
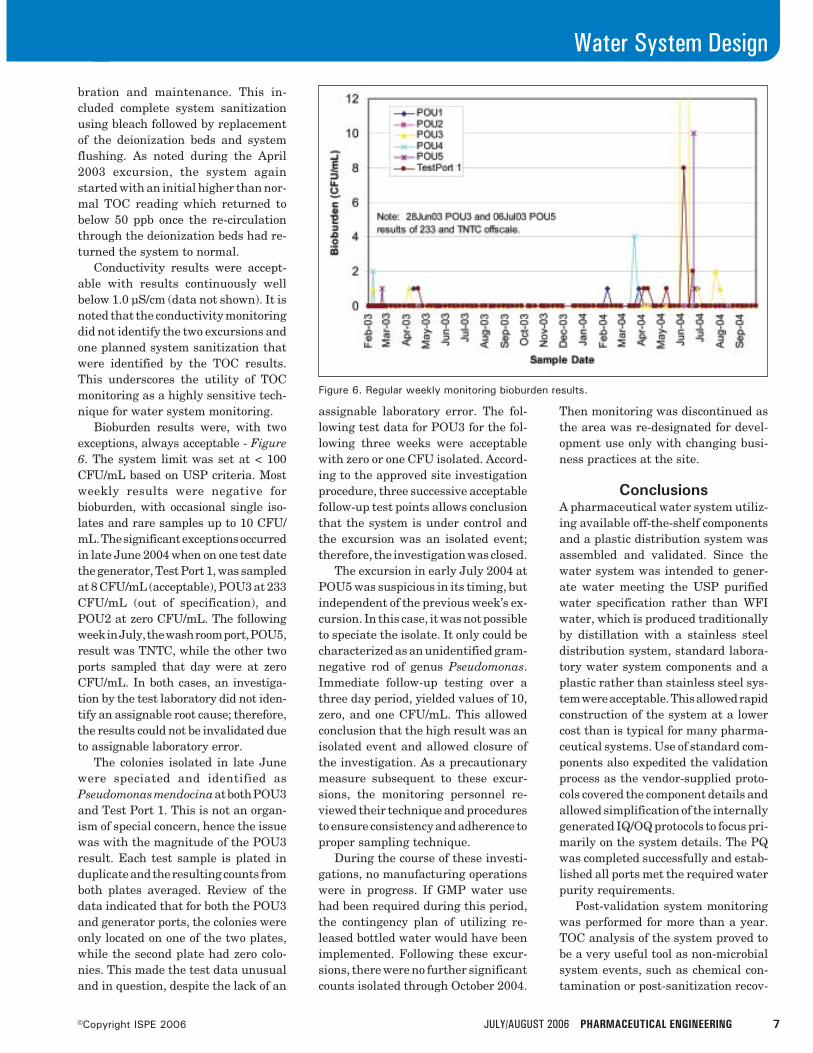
JULY/AUGUST 2006 PHARMACEUTICAL ENGINEERING 7
Water System Design
©Copyright ISPE 2006
bration and maintenance. This in-cluded complete system sanitizationusing bleach followed by replacementof the deionization beds and systemflushing. As noted during the April2003 excursion, the system againstarted with an initial higher than nor-mal TOC reading which returned tobelow 50 ppb once the re-circulationthrough the deionization beds had re-turned the system to normal.
Conductivity results were accept-able with results continuously wellbelow 1.0 µS/cm (data not shown). It isnoted that the conductivity monitoringdid not identify the two excursions andone planned system sanitization thatwere identified by the TOC results.This underscores the utility of TOCmonitoring as a highly sensitive tech-nique for water system monitoring.
Bioburden results were, with twoexceptions, always acceptable - Figure6. The system limit was set at < 100CFU/mL based on USP criteria. Mostweekly results were negative forbioburden, with occasional single iso-lates and rare samples up to 10 CFU/mL. The significant exceptions occurredin late June 2004 when on one test datethe generator, Test Port 1, was sampledat 8 CFU/mL (acceptable), POU3 at 233CFU/mL (out of specification), andPOU2 at zero CFU/mL. The followingweek in July, the wash room port, POU5,result was TNTC, while the other twoports sampled that day were at zeroCFU/mL. In both cases, an investiga-tion by the test laboratory did not iden-tify an assignable root cause; therefore,the results could not be invalidated dueto assignable laboratory error.
The colonies isolated in late Junewere speciated and identified asPseudomonas mendocina at both POU3and Test Port 1. This is not an organ-ism of special concern, hence the issuewas with the magnitude of the POU3result. Each test sample is plated induplicate and the resulting counts fromboth plates averaged. Review of thedata indicated that for both the POU3and generator ports, the colonies wereonly located on one of the two plates,while the second plate had zero colo-nies. This made the test data unusualand in question, despite the lack of an
assignable laboratory error. The fol-lowing test data for POU3 for the fol-lowing three weeks were acceptablewith zero or one CFU isolated. Accord-ing to the approved site investigationprocedure, three successive acceptablefollow-up test points allows conclusionthat the system is under control andthe excursion was an isolated event;therefore, the investigation was closed.
The excursion in early July 2004 atPOU5 was suspicious in its timing, butindependent of the previous week’s ex-cursion. In this case, it was not possibleto speciate the isolate. It only could becharacterized as an unidentified gram-negative rod of genus Pseudomonas.Immediate follow-up testing over athree day period, yielded values of 10,zero, and one CFU/mL. This allowedconclusion that the high result was anisolated event and allowed closure ofthe investigation. As a precautionarymeasure subsequent to these excur-sions, the monitoring personnel re-viewed their technique and proceduresto ensure consistency and adherence toproper sampling technique.
During the course of these investi-gations, no manufacturing operationswere in progress. If GMP water usehad been required during this period,the contingency plan of utilizing re-leased bottled water would have beenimplemented. Following these excur-sions, there were no further significantcounts isolated through October 2004.
Then monitoring was discontinued asthe area was re-designated for devel-opment use only with changing busi-ness practices at the site.
ConclusionsA pharmaceutical water system utiliz-ing available off-the-shelf componentsand a plastic distribution system wasassembled and validated. Since thewater system was intended to gener-ate water meeting the USP purifiedwater specification rather than WFIwater, which is produced traditionallyby distillation with a stainless steeldistribution system, standard labora-tory water system components and aplastic rather than stainless steel sys-tem were acceptable. This allowed rapidconstruction of the system at a lowercost than is typical for many pharma-ceutical systems. Use of standard com-ponents also expedited the validationprocess as the vendor-supplied proto-cols covered the component details andallowed simplification of the internallygenerated IQ/OQ protocols to focus pri-marily on the system details. The PQwas completed successfully and estab-lished all ports met the required waterpurity requirements.
Post-validation system monitoringwas performed for more than a year.TOC analysis of the system proved tobe a very useful tool as non-microbialsystem events, such as chemical con-tamination or post-sanitization recov-
Figure 6. Regular weekly monitoring bioburden results.

8 PHARMACEUTICAL ENGINEERING JULY/AUGUST 2006
Water System Design
©Copyright ISPE 2006
ery, could be identified immediatelyand followed. However, conductivitytesting was not sensitive enough toidentify the events captured by theTOC monitoring. Ongoing bioburdenmonitoring of the system yielded occa-sional counts and two investigations.At no time was there verified evidenceof microbial contamination in the sys-tem, which typically exhibited zerobioburden in the test samples pulledeach week. The results all support therobustness of the purified water gen-eration and plastic distribution sys-tem presented.
References1. USP 25; USP Monographs <Water
for Injection>. USP 25 was used asthe reference at the time of qualifi-cation.
2. Reference Part 9215.B, StandardMethods for the Examination ofWater and Wastewater, 20th Edi-tion, American Public Health Asso-ciation,1998.
3. ISPE Baseline® Pharmaceutical En-gineering Guide, Volume 4 - Waterand Steam Systems, Final Treat-ment Options Chapter in the Stor-age and Distributions Systems 8.4Section, International Society forPharmaceutical Engineering(ISPE), First Edition, January 2001,www.ispe.org.
4. Govaert, Roger, and Lueghamer,Albert, “Materials of Construction –Thermoplastic Piping Systems forPharmaceutical Water Applica-tions,” Ultrapure Water, Dec 2001.
5. USP 25; General Chapter 645 <Wa-ter Conductivity>.
6. USP 25; General Chapter 1231<Water for Pharmaceutical Pur-poses>. USP 25 was used as thereference at the time of qualifica-tion. USP 28 text varies only slightlywith the word “as-built” being re-placed by “final.”
7. Reference Part 9222.B, StandardMethods for the Examination ofWater and Wastewater, 20th Edi-tion, American Public Health Asso-ciation, 1998.
8. Godec, Richard, “Monitoring – Phar-maceutical Industry Strategies forReleasing Water to Production Us-ing Automated On-line TOC Instru-mentation,” Ultrapure Water, March2005.
AcknowledgementsThe authors would like to acknowledgethe Pfizer colleagues and contractorresponsible for the system maintenanceand testing (Paul Boldrey, MichaelPratt, David Vilett, and Jim Weese).
About the AuthorsJoseph Tunner,PhD, is the AssociateDirector of Manufac-turing Engineering forFavrille, Inc. In thisrole, he is project man-ager for the expansionof their cGMP manu-
facturing facility. Most recently,Tunner was a principal scientist forpharmaceutical research and develop-ment at Pfizer. He directed the start-up of the solid dose clinical manufac-turing cGMP pilot plant and subse-quently managed the solid dose manu-facturing, packaging and labelinggroups at this site. Previously, he heldmanufacturing engineering positionsat Matrix Pharmaceutical and servedin a variety of roles at Hybritech.Tunner holds a BS in chemical engi-neering from the University of Colo-rado. He also earned both a MS andPhD in chemical engineering fromStanford University.
Favrille Inc., 10421 Pacific CenterCt., San Diego, CA 92121.
George Katsoulis isan Associate Directorof Validation and Com-pliance for the GlobalOperations Division ofPfizer, Inc. He is re-sponsible for valida-tion and compliance of
site facilities and utilities. Katsoulishas held a variety of engineering de-sign and development roles in medical
device and products manufacturing andR&D, as well as project and mainte-nance management roles in the UKand US. Katsoulis holds a BSc (Hons)in electrical engineering from the OpenUniversity in the United Kingdom..
Pfizer, 10777 Science Center Dr.,San Diego, CA 92121.
Jeffrey Denoncourtis the North AmericanCustom Water Sys-tems Manager in theBioscience Division ofMillipore Corporation.In this position, hemanages the custom
water system and solutions business.Denoncourt has held a variety of prod-uct development and design positionsincluding R&D, marketing, and prod-uct management. Denoncourt holds aBS in environmental science from theUniversity of New Hampshire. He isthe author of numerous papers andfrequently speaks on water purifica-tion and system design.
Sean Murphy is theProduct Manager forvalidation productsand services in the Bio-science Division ofMillipore Corporation.In this role, he not onlydevelops validation
protocols and test equipment forMillipore’s laboratory water instru-ments, but also manages validationtraining. Murphy has held a variety ofpositions at Millipore, including ser-vice support engineer and custom sys-tems analyst. Murphy holds a BS inchemical engineering from theVillanova University in Pennsylvania.He also completed a hazardous materi-als handling course (OSHA approved).
Millipore Corporation, 290 ConcordRd., Billerica, MA 01821.

JULY/AUGUST 2006 PHARMACEUTICAL ENGINEERING 1
Batch Process Simulation
©Copyright ISPE 2006
This articledescribes theuse of a batchprocesssimulator in themodelling anddebottleneckingof an anti-allergic creamproduction lineat an existingpharmaceuticalfacility.
Debottlenecking of a BatchPharmaceutical Cream Production
by Jully Tan, Dominic Chwan Yee Foo,Sivakumar Kumaresan, and Ramlan Abdul Aziz
Figure 1. Base casesimulation flowsheet forthe production of anti-allergic cream.
Introduction
Computer Aided Process Design (CAPD)and simulation tools have been widelyused in the bulk and petrochemicalindustries since the early 1960s. It
involves the use of computers to perform steady-state heat and mass balancing as well as sizingand costing calculations for a process.1 How-ever, the use of these CAPD and simulationtools has only emerged in pharmaceuticalmanufacturing in the past decade.2-8 Comparedto the readily available process simulators inthe bulk and petrochemical industries, thereare only a limited number of simulators avail-able for pharmaceutical process modelling. Thissituation is mainly due to the uncommon unitoperations and the batch operation nature ofpharmaceutical processing. Due to its rela-tively new emergence, more work needs to bedone in this sector.
Due to the increasing customer demand ofthe anti-allergic cream product, the pharma-ceutical facility management team was lookingfor alternative expansion schemes to increase
the current production rate as the productioncapacity was limited by the current operatingcondition and equipment setup. Hence, adebottlenecking study is needed for an increasein production. In addition, the debottleneckingstudy will assist the management team in fu-ture expansion plans.
Background TheoryIn order to increase production throughput,process bottlenecks that limit the current pro-duction need to be identified. Bottlenecks areprocess limitations that are related to eitherequipment or resources (e.g., demand for vari-ous utilities, labor, and raw material). Hence,process debottlenecking can be defined as theidentification and removal of obstacles in theattempt to increase the plant throughput.5 Inbatch manufacturing, two types of processbottlenecks can be categorized. These are theequipment capacity-related size bottleneck (anequipment that is limited in size) as well as thescheduling bottleneck (due to the long occu-pancy of a piece of equipment during a process).
Reprinted from
PHARMACEUTICAL ENGINEERING®
The Official Magazine of ISPE
July/August 2006, Vol. 26 No. 4

2 PHARMACEUTICAL ENGINEERING JULY/AUGUST 2006
Batch Process Simulation
©Copyright ISPE 2006
Figure 2. Operation Gantt Chart for the base case simulation.
The ability to identify and remove process bottlenecks thatcreate obstacles in a manufacturing process will increaseplant throughput and fulfill customer needs.
A good tool to identify batch process bottleneck is via athroughput analysis study. Throughput analysis measuresthe equipment utilization in a batch process with two vari-ables, i.e., the capacity utilization and equipment uptime.5-6
Capacity utilization is defined as the percentage of thecurrent operating load of a piece of equipment (e.g., vesselvolume for a reactor or filtering area of a filter) relative to itsmaximum load. For instance, a vessel with 100% capacityutilization means that its current content has reached itsmaximum level.
Equipment uptime measures the effectiveness of a piece ofequipment that is utilized in time. It is given as the percent-age of the equipment utilization time over the plant cycletime. For example, a reactor that operates for five hourswithin a plant with a cycle time of 10 hours has an uptime of50%. The product of equipment capacity utilization and itsuptime defines the combined utilization of the respectiveequipment.5-6
In an ideal situation, a plant should have all equipmentrunning at 100% combined utilization to achieve maxi-
mum production. However, this is often not the case. Allprocess equipment will normally feature different utiliza-tion. The ability to raise utilization of the equipment willhelp in raising process throughput. The processing stepwith the highest combined utilization is normally identi-fied as the first candidate for process debottlenecking.Simulation tools that are capable of tracking capacityutilization and equipment uptime can facilitate the iden-tification of process bottlenecks and the development ofthe scenarios for process debottlenecking. By using the“what if” scenario, process alternatives can be simulatedvia the use of simulation tools to reveal potential candi-dates for the debottlenecking study.
The Cost Benefit Ratio (CBR) is among the criteria thatcan be used to evaluate the economic performance ofdebottlenecking alternatives. As the name suggests, CBR isa measure based on the ratio of benefits obtained for a givenexpansion cost.9 The first step in CBR analysis is to deter-mine the beneficial elements, disbenefits, and expansion costfor a project. For the case of pharmaceutical process debottle-necking, CBR formulation can be defined as shown in thefollowing equation:

JULY/AUGUST 2006 PHARMACEUTICAL ENGINEERING 3
Batch Process Simulation
©Copyright ISPE 2006
Revenue ofRevenue of – currentalternative operation
CBR = __________________________________________ (1)Investment Operating Operating
cost of + cost of – cost ofalternative alternative current
operations
Model Development –Antiallergic Cream Production
Figure 1 shows the base case simulation flowsheet for theproduction of anti-allergic cream modelled in a process simu-lator.10 The base case simulation model was developed toreflect the actual operating condition in the existing pharma-ceutical manufacturing facility that is operated in batchprocessing mode. This modelling environment, involves themodelling of a few operations that take place sequentially ina single unit procedure.10 For instance, the Jacketed Heaterprocedure P-1 in the Pre-Mixing section - Figure 1 was usedto model the sequential operations of raw material charges,material heating (for melting purpose), agitation processes,as well as product discharge. All these individual operationstook place in the single vessel of V-101. The modelling of thesesingle operations is described next.
In the base case process, there are nine major processingsteps in three different sub-sections. This includes rawmaterial melting in the Pre-Mixing Section, deionized (DI)water heating, and material blending in the Main BlendingSection, as well as filling, conveying, cartoning, shrink wrap-ping, and shipment packaging in the Packaging sections. Dueto the capacity limitation of the pre-mixing vessel, the rawmaterial is divided into two sub-mix batches in the Pre-Mixing Section. Two batches of Emulsifying Wax (ESW) andFoam Stabilizer (FS) are independently heated in the heatingprocedures P-1 (carried out in Jacketed Heater V-101) and P-2 (in Jacketed Heater V-102) to approximately 100ºC beforethe emulsifier (EMUL) and ointment (OIN) are added. Theemulsifier and ointment are originally in wax form and needto be melted for uniform mixing. All raw materials arecharged at room temperature.
DI water is heated in the electric heater EH-101 (proce-dure P-3) before being transferred into the Main BlendingTank, V-103 (P-4) in the Main Blending Section. An Antimi-crobial Agent (AM) is next added into the hot DI water,followed by agitation for 10 minutes. The mixture in thejacketed heater V-101 and V-102 is then transferred into V-103. The mixture of all ingredients in V-103 is blended oncemore for 15 minutes in order to produce a uniform composi-tion. The mixture is then left in an air-conditioned dispensingroom to be naturally cooled to room temperature. This coolingoperation took approximately 19 hours to accomplish due tothe slow rate of natural cooling. Upon the completion of thecooling operation, the Active Ingredient (AI) of the anti-allergic cream is finally added. The products are once againblended for 15 minutes to obtain uniform composition beforethe product mixture is sent to the Packaging Section.
Upon the completion of the Main Blending Procedure, the
blended product is next transferred to Filler P-5/FL-101 inthe Packaging Section where it is filled into the tubes of 15 geach. The existing filling machine is operated at a speed of 30tubes/min. The tubes are then sent to the cartoning packag-ing procedure P-7 (using a belt conveyer P-6/BC-101) wherethe anti-allergic cream in tubes are packed manually by twooperators into the tube cartons, each at a speed of 20 cartons/min. Next, 12 cartons of anti-allergic cream are packed intoone wrapper in the Shrink Wrapper (P-8/GBX-101) with aspeed of five wrappers/min. Finally, six wrappers are packedinto each of the pallet boxes in Packing Machine P-9/BX-102(equivalent to 72 tubes/pallet box) before they are sent to thewarehouse. Approximately six sealed pallet boxes are packedper minute by the operator manually.
As the manufacturing process is carried out in a batchoperation mode, efforts have been made to document thescheduling details of each processing step. The OperationGantt Chart for the complete recipe of a single batch opera-tion is shown in Figure 2. It also should be noted that theprocess time for certain operations are dependant upon otheroperations of other procedure (e.g., transfer-out operation inP-4 is set equal to the filling duration of P-5). Hence, theduration of this slave operation is set to follow to the durationof the master operation using the Master-Slave Relationshipfunction.10 The customer demand for this anti-allergic creamproduct is expected to rise another 150% of the currentproduction capacity in upcoming years. However, the processis currently running at its maximum capacity and any at-tempt to increase production is not possible due to the processbottleneck. This calls for a systematic procedure to analyzethe current production facilities and next to debottleneck theprocess. Apart from debottlenecking the current production,the debottlenecking study also will develop solutions forfuture expansion.
Bottleneck Identification StrategiesIn the current operation, the annual operating time for theanti-allergic cream manufacturing is taken as 2080 hours,which is based on 52 operation weeks, five days a week andeight hours operation per day. From the base case simulation,a complete batch of pharmaceutical cream production isfound to have a process batch time of 40.2 hrs and a minimum
Figure 3. Capacity, time and combined utilization for unitprocedures in base case simulation.
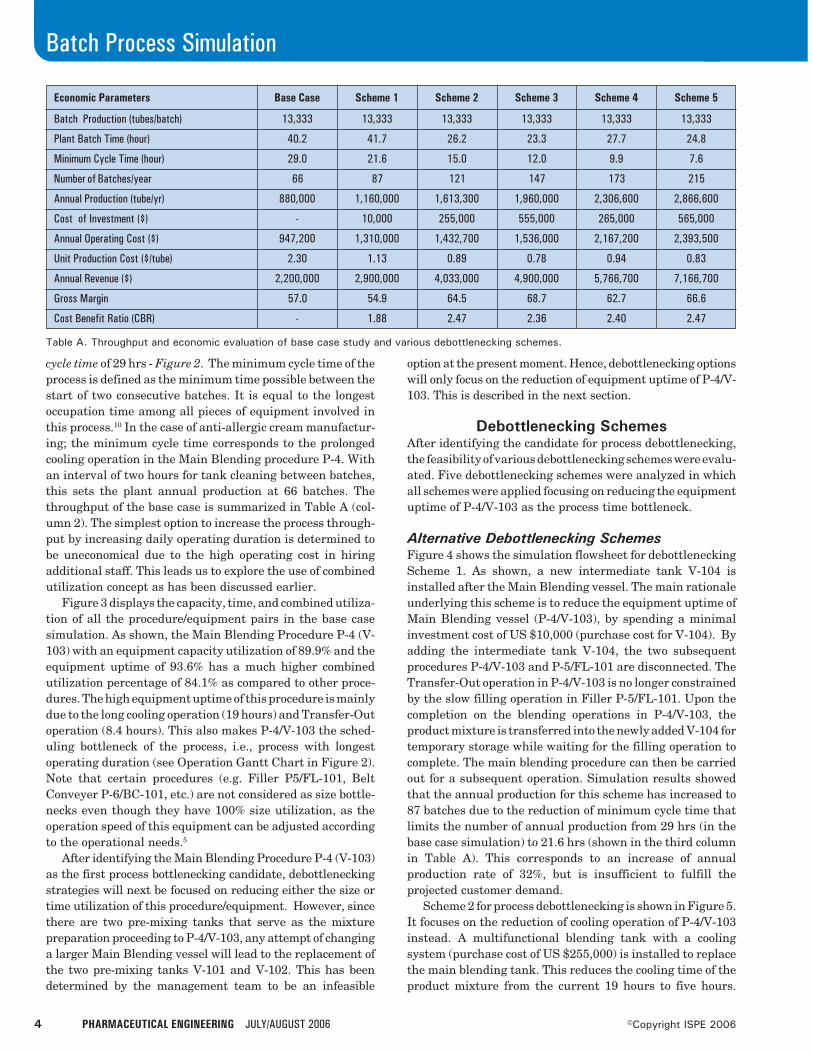
4 PHARMACEUTICAL ENGINEERING JULY/AUGUST 2006
Batch Process Simulation
©Copyright ISPE 2006
Economic Parameters Base Case Scheme 1 Scheme 2 Scheme 3 Scheme 4 Scheme 5
Batch Production (tubes/batch) 13,333 13,333 13,333 13,333 13,333 13,333
Plant Batch Time (hour) 40.2 41.7 26.2 23.3 27.7 24.8
Minimum Cycle Time (hour) 29.0 21.6 15.0 12.0 9.9 7.6
Number of Batches/year 66 87 121 147 173 215
Annual Production (tube/yr) 880,000 1,160,000 1,613,300 1,960,000 2,306,600 2,866,600
Cost of Investment ($) - 10,000 255,000 555,000 265,000 565,000
Annual Operating Cost ($) 947,200 1,310,000 1,432,700 1,536,000 2,167,200 2,393,500
Unit Production Cost ($/tube) 2.30 1.13 0.89 0.78 0.94 0.83
Annual Revenue ($) 2,200,000 2,900,000 4,033,000 4,900,000 5,766,700 7,166,700
Gross Margin 57.0 54.9 64.5 68.7 62.7 66.6
Cost Benefit Ratio (CBR) - 1.88 2.47 2.36 2.40 2.47
Table A. Throughput and economic evaluation of base case study and various debottlenecking schemes.
cycle time of 29 hrs - Figure 2. The minimum cycle time of theprocess is defined as the minimum time possible between thestart of two consecutive batches. It is equal to the longestoccupation time among all pieces of equipment involved inthis process.10 In the case of anti-allergic cream manufactur-ing; the minimum cycle time corresponds to the prolongedcooling operation in the Main Blending procedure P-4. Withan interval of two hours for tank cleaning between batches,this sets the plant annual production at 66 batches. Thethroughput of the base case is summarized in Table A (col-umn 2). The simplest option to increase the process through-put by increasing daily operating duration is determined tobe uneconomical due to the high operating cost in hiringadditional staff. This leads us to explore the use of combinedutilization concept as has been discussed earlier.
Figure 3 displays the capacity, time, and combined utiliza-tion of all the procedure/equipment pairs in the base casesimulation. As shown, the Main Blending Procedure P-4 (V-103) with an equipment capacity utilization of 89.9% and theequipment uptime of 93.6% has a much higher combinedutilization percentage of 84.1% as compared to other proce-dures. The high equipment uptime of this procedure is mainlydue to the long cooling operation (19 hours) and Transfer-Outoperation (8.4 hours). This also makes P-4/V-103 the sched-uling bottleneck of the process, i.e., process with longestoperating duration (see Operation Gantt Chart in Figure 2).Note that certain procedures (e.g. Filler P5/FL-101, BeltConveyer P-6/BC-101, etc.) are not considered as size bottle-necks even though they have 100% size utilization, as theoperation speed of this equipment can be adjusted accordingto the operational needs.5
After identifying the Main Blending Procedure P-4 (V-103)as the first process bottlenecking candidate, debottleneckingstrategies will next be focused on reducing either the size ortime utilization of this procedure/equipment. However, sincethere are two pre-mixing tanks that serve as the mixturepreparation proceeding to P-4/V-103, any attempt of changinga larger Main Blending vessel will lead to the replacement ofthe two pre-mixing tanks V-101 and V-102. This has beendetermined by the management team to be an infeasible
option at the present moment. Hence, debottlenecking optionswill only focus on the reduction of equipment uptime of P-4/V-103. This is described in the next section.
Debottlenecking SchemesAfter identifying the candidate for process debottlenecking,the feasibility of various debottlenecking schemes were evalu-ated. Five debottlenecking schemes were analyzed in whichall schemes were applied focusing on reducing the equipmentuptime of P-4/V-103 as the process time bottleneck.
Alternative Debottlenecking SchemesFigure 4 shows the simulation flowsheet for debottleneckingScheme 1. As shown, a new intermediate tank V-104 isinstalled after the Main Blending vessel. The main rationaleunderlying this scheme is to reduce the equipment uptime ofMain Blending vessel (P-4/V-103), by spending a minimalinvestment cost of US $10,000 (purchase cost for V-104). Byadding the intermediate tank V-104, the two subsequentprocedures P-4/V-103 and P-5/FL-101 are disconnected. TheTransfer-Out operation in P-4/V-103 is no longer constrainedby the slow filling operation in Filler P-5/FL-101. Upon thecompletion on the blending operations in P-4/V-103, theproduct mixture is transferred into the newly added V-104 fortemporary storage while waiting for the filling operation tocomplete. The main blending procedure can then be carriedout for a subsequent operation. Simulation results showedthat the annual production for this scheme has increased to87 batches due to the reduction of minimum cycle time thatlimits the number of annual production from 29 hrs (in thebase case simulation) to 21.6 hrs (shown in the third columnin Table A). This corresponds to an increase of annualproduction rate of 32%, but is insufficient to fulfill theprojected customer demand.
Scheme 2 for process debottlenecking is shown in Figure 5.It focuses on the reduction of cooling operation of P-4/V-103instead. A multifunctional blending tank with a coolingsystem (purchase cost of US $255,000) is installed to replacethe main blending tank. This reduces the cooling time of theproduct mixture from the current 19 hours to five hours.

JULY/AUGUST 2006 PHARMACEUTICAL ENGINEERING 5
Batch Process Simulation
©Copyright ISPE 2006
Table B. Combined utilization for different debottlenecking schemes.
Equipment Tag Procedure Name Base Case Scheme 1 Scheme 2 Scheme 3 Scheme 4 Scheme 5
V-102 P-2 Jacketed Heater 2 4.71 6.19 8.59 10.41 12.26 16.00
V-101 P-1 Jacketed Heater 1 8.04 10.56 14.66 17.76 20.92 27.30
V-103 P-4 Main Blending Tank 84.12 82.30 79.34 77.11 57.27 79.13
FL-101 P-5 Filler 27.13 35.65 49.48 38.81 70.61 56.81
BC-101 P-6 Belt Conveyor 23.90 31.41 43.60 31.68 62.21 46.38
BX-101 P-7 Manual Cartoning 17.93 23.56 32.70 39.60 46.66 57.97
GBX-101 P-8 Shrink Wrapping 11.95 15.70 21.80 26.40 31.10 38.65
BX-102 P-9 Manual Pallet Packaging 1.66 2.18 3.03 3.67 4.32 5.37
Figure 4. Debottlenecking Scheme 1 with the installation of an intermediate tank.
Chilled water is used as cooling agent to cool the mixture from85ºC to room temperature. This leads to the reduction ofminimum cycle time to 15 hrs. Hence, an increase of 83.3% isachieved for annual production as compared to the base case,i.e., from 66 to 121 batches (fourth column in Table C). FromTable B, it is shown that even although P-4/V-103 remains asthe overall process bottleneck, its combined utilization valuehas actually been reduced from 84.2% in the base casesimulation to 79.3%, due to the reduction of its uptime. On theother hand, combined utilization of other unit procedureshave increased significantly. This leads to an overall increaseof process throughput. Further debottlenecking can only beachieved if the long duration of the Transfer-out operation inP-4/V-103 (to filler P-5/FL-101) can be reduced.
Figure 6 shows the simulation flowsheet of Scheme 3 thatexplores the reduction of P-4/V-103 uptime from a differentperspective. As the Transfer-Out duration of P-4/V-103 isdependent upon the filling rate in P-5/FL-10, one alternativeto reduce the duration of Transfer-Out operation in P-4/V-103is to install a high speed filler to shorten the filling durationin P-5/FL-10, and hence the Transfer-out duration in P-4/V-103. As shown in Figure 6, a new filler (50 tubes/min;
purchase cost of $300,000) is installed in addition to the newmultifunctional blending tank in Scheme 2 to accelerate thefilling rate. Simulation results showed that with the reduc-tion of Transfer-out duration in P-4/V-103, combined utiliza-tion values of P-4/V-103, P-5/FL-101 and P-6/BC-101 havebeen reduced slightly, while other unit procedures increase intheir combined utilization values - Table B. The net result isthe reduction of minimum cycle time to 12 hrs and an increaseannual production rate of 147 batches, i.e., 122.7% comparedto the base case (fifth column in Table A).
Another debottlenecking alternative focusing on reducingthe overall uptime of P-4/V-103 is presented in Scheme 4 -Figure 7. Instead of installing a new filling machine as inScheme 3, an intermediate storage tank (V-104; purchasecost of US $10,000) is added in addition to the installation ofa new Blending Tank (P-4/V-103). This scheme exhibits thesame characteristics as the combination of Scheme 1 andScheme 2. Simulation results showed that the annual pro-duction for this scheme is 173 batches with a minimum cycletime reduced to 9.9 hrs (sixth column in Table A). Thiscorresponds to an increase of annual production rate of 162%,fulfilling the future market demand. It also should be noted

6 PHARMACEUTICAL ENGINEERING JULY/AUGUST 2006
Batch Process Simulation
©Copyright ISPE 2006
Figure 5. Debottlenecking Scheme 2 with the installation of new multifunctional blending tank.
Table C. Cost of raw material for base case simulation.
Raw Material Symbol Price ($/kg) Unit/Batch Cost/Batch ($) Annual Cost ($) % Contribution
Emulsifier EMUL 15.50 30.00 kg 465.00 30,690.00 11.15
Emulsifying Wax ESW 5.05 3.60 kg 18.18 1,200.00 0.44
Foam Stable FS 3.00 14.40 kg 43.20 2,851.00 1.04
Antimicrobial Agent AM 4.00 0.24 kg 0.96 63.00 0.02
Active Ingredient AI 650.00 2.00 kg 1,300.00 85,800.00 31.17
Emulsifying Ointment OIN 15.00 12.00 kg 180.00 11,880.00 4.32
Deionized Water DI water 0.50 137.76 kg 68.88 4,546.00 1.65
Water Water 0.03 69.63 kg 2.09 138.00 0.05
Tube Tube 0.10 13,333.00 1,333.30 88,000.00 31.97
Carton Box Small box 0.05 13,333.00 666.65 44,000.00 15.98
Pallet Box Big box 0.50 185.00 92.50 6,110.00 2.22
TOTAL COST 3,635.44 239,939.06 100.00
that after the installation of intermediate storage tank V-101, filler P-5/FL-101 has became the unit procedure with thehighest combined utilization value. As shown in Table B, allunit procedures experienced an increase in their combinedutilization values except that of P-4/V103. This is consistentwith the finding of Koulouris et al,5 where new bottleneckequipment will emerge after the current bottleneck is over-come. Debottlenecking efforts are stopped at this scheme asthe debottlenecking objective is reached, i.e., achieving the150% increase in production as compared to current produc-tion. However, to cater for future expansion plan as re-quested by the management team, the replacement of a newP-5/FL-101 is studied in the next debottlenecking scheme.
Figure 8 shows the simulation flowsheet for Scheme 5,which includes filler P-5/FL-101 for debottlenecking. With
the presence of the additional intermediate tank and the highspeed filling machine, the production increases to 215 batchesper annum, i.e., an increase of 225% with minimum cycle timereduced to 7.6 hr (seventh column in Table C). The capitalinvestment needed in this scheme is calculated as the sum-mary of individual equipment in the previous schemes, i.e.$565,000.
All the proposed debottlenecking schemes have demon-strated significant improvement on the annual productionthroughput. This is mainly due to the reduction of minimumcycle time associated with main blending tank procedures. Aspreviously mentioned, Scheme 4 serves as the debottleneckingscheme for current increase of production; while Scheme 5with the highest process throughput is reserved for futureexpansion plans.

JULY/AUGUST 2006 PHARMACEUTICAL ENGINEERING 7
Batch Process Simulation
©Copyright ISPE 2006
Figure 6. Debottlenecking Scheme 3 with the installation of new multifunctional blending tank and new filler.
Economic EvaluationPreliminary economic evaluations are next carried out for thebase case simulation and each of the debottlenecking schemes.This is done via the economic evaluation function of thesimulation software.10 In order to regenerate a realistic costestimate, raw material costs and equipment purchase costsare obtained from local industrial suppliers. Table C showsthe cost of the raw material for the production of anti-allergiccream and their contribution to the overall production cost inthe base case simulation. The active ingredient for the anti-allergic cream and the tube (where 15 g of cream is filled)
dominate the raw material cost, each contributing 31% of theoverall production cost. Note that the distribution of rawmaterial costs remains the same for all schemes as shown inTable C, only differing by total annual cost for each schemedue to the different annual throughput.
The economic evaluation comparing the variousdebottlenecking schemes with respect to the base case studyis shown in Table A. The Cost Benefit Ratio (CBR) is used asa tool in comparing the alternative schemes. As shown,except for Scheme 1, all other debottlenecking schemes arehaving similar CBR values with Scheme 2 and Scheme 5
Figure 7. Debottlenecking Scheme 4 with the installation of intermediate tank and new multifunctional blending tank.

8 PHARMACEUTICAL ENGINEERING JULY/AUGUST 2006
Batch Process Simulation
©Copyright ISPE 2006
having the highest value of 2.47. This indicates that exceptfor Scheme 1 all debottlenecking schemes have equal valuefor investment.
In the previous debottlenecking section, it is shown thatScheme 4 was selected to be the debottlenecking scheme due toits fulfillment to future customer demand, i.e., by producingmore than 150% of the current production. On the other hand,Scheme 5 that has been identified to be the future debottleneckingscheme also shows a promising CBR value of 2.47.
ConclusionIn this work, Computer-Aided Process Design (CAPD) andsimulation tools are used in the systematic identification of theprocess bottleneck and a debottlenecking study. An operationalpharmaceutical case study of anti-allergic cream production isused to demonstrate the effectiveness of the tools. The base caseand four debottlenecking schemes are simulated using SuperProDesigner. The annual process throughput is increased signifi-cantly with the reduction of equipment uptime of the processtime bottleneck. The study produced a debottlenecking schemethat achieves the current production needs, with a scheme thatwill cater for a future expansion plan.
References1. Westerberg, A. W., Hutchison, H. P., Motard, R. L., and
Winter, P., Process Flowsheeting, Cambridge: CambridgeUniversity Press, 1979.
2. Petrides, D., Sapidou, E., and Calandranis, J., “Com-puter-Aided Process Analysis and Economic Evaluationfor Biosynthetic Human Insulin Production – A CaseStudy,” Biotechnology and Bioengineering, 48, 1995, pp.529-541.
3. Hwang, F., “Batch Pharmaceutical Process Design andSimulation,” Pharmaceutical Engineering, January/Feb-ruary 1997, pp. 28-43.
4. Ernst, S., Garro, O. A., Winkler, S., Venkataraman, G.,Langer R., Cooney, C. L., and Sasisekharan, R., “ProcessSimulation for Recombinant Protein Production: CostEstimation and Sensitivity Analysis for Heparinase IExpressed in Escherichia coli,” Biotechnology and Bioengi-neering, Vol. 53, No. 6, 1997, pp. 575-582.
5. Koulouris, A., Calandranis, J., and Petrides, D. P.,“Throughput Analysis and Debottlenecking of IntegratedBatch Chemical Processes,” Computers and ChemicalEngineering, Vol. 24, 2000, pp. 1387-1394.
6. Petrides, D. P., Koulouris, A., and Siletti, C., “ThroughputAnalysis and Debottlenecking of Biomanufacturing Fa-cilities: A Job for Process Simulators,” BioPharm, August2002, pp.2-7.
7. Petrides, D. P., Koulouris, A., and Siletti, C., “The Role ofProcess Simulation in Pharmaceutical Process Develop-ment and Product Commercialization,” PharmaceuticalEngineering, Vol. 22, No. 1, 2002, pp. 56-65.
8. Oh, S. K. W., Kuek, K. H., and Wong, V. V. T., “Design,Simulation and Optimisation of A Large Scale MonoclonalAntibody Production Plant: Upstream Design,” Pharma-ceutical Engineering, Vol. 24, No. 6, 2004, pp. 42-60.
9. Blank, L. T. and Tarquin A. J., Engineering Economy,New York: McGraw-Hill, 2003.
10. Intelligen, Inc., SuperPro Designer User’s Guide, ScotchPlains: Intelligen, Inc., 2005.
AcknowledgementThe authors would like to thank Dr. Alexandros Koulouris,the Managing Director of Intelligen Europe, for his construc-tive feedback with this project.
Figure 8. Debottlenecking Scheme 5 for future plant expansion.
JULY/AUGUST 2006 PHARMACEUTICAL ENGINEERING 9
Batch Process Simulation
©Copyright ISPE 2006
About the AuthorsJully Tan is a research student at the Chemi-cal Engineering Pilot Plant, UniversitiTeknologi Malaysia (CEPP, UTM). She re-ceived her BEng degree in chemical engi-neering from the Universiti Teknologi Ma-laysia and is currently pursuing her MScresearch work in CEPP, UTM. She conductedher industrial attachment at a local pharma-
ceutical production plant where this project is carried out. Atthe plant, she assisted the plant management team to evalu-ate different debottlenecking schemes for various pharma-ceutical production processes using computer-aided processsimulation tools. She can be contacted via e-mail:[email protected] or by phone: +60(12)-6670382.
Chemical Engineering Pilot Plant, Universiti TeknologiMalaysia, 81310 Skudai, Johor, Malaysia.
Dominic C. Y. Foo is an Assistant Professorat the University of Nottingham Malaysia.Prior to this position, he served as a Post-graduate Researcher at the Chemical Engi-neering Pilot Plant, Universiti TeknologiMalaysia (CEPP, UTM), where this workwas completed. He obtained his BEng, MEng,and PhD from the Universiti Teknologi Ma-
laysia, all in chemical engineering. His main areas of workinclude that of process synthesis, analysis, and design forcleaner production and efficient manufacturing. He makesuse of computer-aided process design and simulation tools inoptimizing and debottlenecking batch manufacturing pro-cesses, such as pharmaceutical, fine, and specialty chemicalproduction. He is a member of the Institution of Engineers,Malaysia (IEM) and the Institution of Chemical EngineersUK (IChEM) Malaysia Branch, previously known as theInstitution of Chemical Engineers Malaysia (IChEM). Hecan be contacted via e-mail: [email protected] foodominic@ yahoo.com, by phone: +60(03)-89248130, orby fax: +60(03)-89248017. His personal Web site is http://www.geocities.com/foodominic/.
School of Chemical and Environmental Engineering, Uni-versity of Nottingham Malaysia Campus, Broga Rd., 43500Semenyih, Selangor, Malaysia.
Sivakumar Kumaresan is a lecturer inchemical engineering at the Universiti Ma-laysia Sabah. He has a BS in chemical engi-neering from Texas A&M University (US),an MSc in advanced control from the Univer-sity of Manchester Institute of Science andTechnology (UK), and is currently complet-ing his PhD in herbal processing at the Chemi-
cal Engineering Pilot Plant, Universiti Teknologi Malaysia.His area of work includes the application of process simula-tion tools to pharmaceutical modelling and he is currentlyworking on model-based phytochemical processing designand optimization focusing on the standarization of herbalextracts for pharmaceutical applications. He can be con-tacted via e-mail: [email protected] or [email protected],by phone: +60(88)-320000 ext. 3064, or by fax: +60(88)-320348.
Chemical Engineering Program, School of Engineeringand Information Technology, Universiti Malaysia Sabah,Locked Bag 2073, 88999, Kota Kinabalu, Malaysia.
Ramlan A. Aziz is a Professor and Directorof the Chemical Engineering Pilot Plant,Universiti Teknologi Malaysia. He obtainedhis BEng and MEng from the University ofManchester Institute of Science and Tech-nology (UMIST, UK). His main areas of workinclude developing small and medium scaleenterprises in Malaysia through process and
product development based on natural products andbioprocessing. He is a member of the Filtration Society of UKand has served as a Vice President for Institution of ChemicalEngineers Malaysia (IChEM). He can be contacted via e-mail: [email protected], by phone: +60(07)-5531662 orby fax: +60(07)-5569706. His Web site is http://www.cepp.utm.my/.
Chemical Engineering Pilot Plant, Universiti TeknologiMalaysia, 81310 Skudai, Johor, Malaysia.

JULY/AUGUST 2006 PHARMACEUTICAL ENGINEERING 1
New Products and Literature
©Copyright ISPE 2006
Filter Media
The “HemiPleatTM High Efficiency(HE)” Filter Media from Farr APC of-fers an unsurpassed MERV 15* effi-ciency rating and double the servicelife. With a filtration efficiency of 99.999percent on 0.5 micron particles andlarger, it is ideal for the capture of toxicand other ultra-fine dusts, and for ap-plications where process air is recircu-lated downstream of the collector forenergy savings.
Farr Air Pollution Control, 3505 S.Airport Rd., Jonesboro, AR 72401,www.farrapc.com.
Hose Tracking andAnalysis System
The AdvantaPure division of NewAgeIndustries, Inc., has announced thatits Hose Track Process EquipmentIdentification and Lifecycle Analysis
System has been validated for 21 CFRPart 11. The third party validation,conducted by VALSPEC of Royersford,PA, affirms the product’s compliancewith Title 21 of the Code of FederalRegulations, Part 11, which relates toelectronic records and signatures.
Advantapure, 145 James Way,Southampton, PA 18966, www.advantapure.com.
SoftwareEmerson Process Management hasenhanced the functionality of its DeltaVSIS products with the release of ver-sion 8.4 software. The 8.4 release ex-tends bulk edit capability to SIS mod-ules and remote I/O, version control isextended to SIS modules and Logicsolver configuration, a new report wasadded to verify that periodic softwareupgrades do not impact the DeltaV SISlogic solver configuration. This upgradewill significantly reduce engineeringtime and effort on large projects as wellas improve IEC 61511 compliance.
Emerson Process Management,12301 Research Blvd., Bldg. 3, Austin,TX 78759, www.emersonprocess.com.
Water Purification System
Millipore has announced the new puri-fication strategy behind Millipore’s Q-POD unit, the remote dispenser of the
Milli-Q® Advantage system. The lastwater purification step is performed atthe outlet of the Q-POD unit by a spe-cific POD Pack, which removes con-taminants critical for specific experi-mentations just before the water leavesthe system.
Millipore Corp., 290 Concord Rd.,Billerica MA 01821, www.millipore.com.
Cleaning ValidationSupport Package
GE Analytical Instruments, a divisionof GE Water & Process Technologies,has announced its new Sievers Clean-ing Validation Support Package(Sievers CVSP), a comprehensive setof documentation providing guidancefor the use of Total Organic Carbon(TOC) methodology in laboratory andon-line cleaning validation applica-tions. The Sievers CVSP includes guid-ance, examples, worksheets, templates,and sample protocols that will signifi-cantly reduce the time and effort re-quired to define and execute cleaningvalidation requirements.
GE Water & Process Technologies,6060 Spine Rd., Boulder, CO 80301,www.geinstruments.com.
Manufacturing ExecutionSystems (MES) Software
Werum Software & Systems America,Inc., a leading supplier of MES for thepharmaceutical and biotech industries,has launched new versions of its PAS-X PHARMA and PAS-X BIOTECHproduct lines. Designated PAS-XPHARMA V2.3 and PAS-X BIOTECHV2.2, the updated software suites in-
Reprinted from
PHARMACEUTICAL ENGINEERING®
The Official Magazine of ISPE
July/August 2006, Vol. 26 No. 4
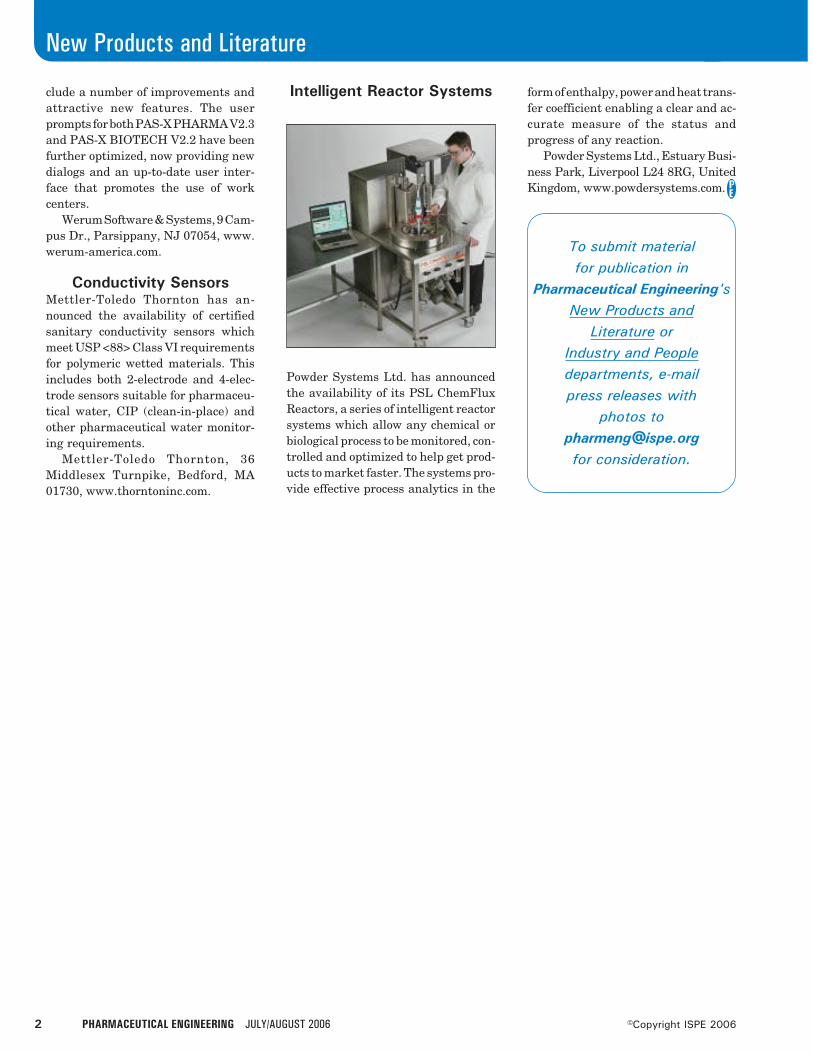
2 PHARMACEUTICAL ENGINEERING JULY/AUGUST 2006
New Products and Literature
©Copyright ISPE 2006
clude a number of improvements andattractive new features. The userprompts for both PAS-X PHARMA V2.3and PAS-X BIOTECH V2.2 have beenfurther optimized, now providing newdialogs and an up-to-date user inter-face that promotes the use of workcenters.
Werum Software & Systems, 9 Cam-pus Dr., Parsippany, NJ 07054, www.werum-america.com.
Conductivity SensorsMettler-Toledo Thornton has an-nounced the availability of certifiedsanitary conductivity sensors whichmeet USP <88> Class VI requirementsfor polymeric wetted materials. Thisincludes both 2-electrode and 4-elec-trode sensors suitable for pharmaceu-tical water, CIP (clean-in-place) andother pharmaceutical water monitor-ing requirements.
Mettler-Toledo Thornton, 36Middlesex Turnpike, Bedford, MA01730, www.thorntoninc.com.
Intelligent Reactor Systems
Powder Systems Ltd. has announcedthe availability of its PSL ChemFluxReactors, a series of intelligent reactorsystems which allow any chemical orbiological process to be monitored, con-trolled and optimized to help get prod-ucts to market faster. The systems pro-vide effective process analytics in the
form of enthalpy, power and heat trans-fer coefficient enabling a clear and ac-curate measure of the status andprogress of any reaction.
Powder Systems Ltd., Estuary Busi-ness Park, Liverpool L24 8RG, UnitedKingdom, www.powdersystems.com.
To submit materialfor publication in
Pharmaceutical Engineering'sNew Products and
Literature orIndustry and Peopledepartments, e-mailpress releases with
photos [email protected] consideration.

JULY/AUGUST 2006 PHARMACEUTICAL ENGINEERING 1
Industry and People
©Copyright ISPE 2006
FDA Counterfeit DrugsTask Force Report
The FDA has announced new steps tostrengthen existing protections againstthe growing problem of counterfeitdrugs. The measures, which were rec-ommended in a report released by theagency’s Counterfeit Drug Task Force,emphasize certain regulatory actionsand using new technologies for safe-guarding the integrity of the US drugsupply. The latest Task Force report isthe third in a series of documents ex-ploring the means of ensuring the safetyof the US drug supply. The first report,issued in 2004, outlined the frame-work for protecting the public fromcounterfeit medicines, and the secondreport, released last year, assessed theprogress toward implementing the2004 recommendations. All Task ForceReports can be found at http://www.fda.gov/counterfeit/.
Pfizer Facility ReceivesAwards from Environmental
Organizations
The Pfizer Clinical Research Unit(CRU), of New Haven, Connecticut,has been recognized by two nationalenvironmental organizations for thesuccessful utilization of “high perfor-mance” and “eco-friendly” principles,procedures and materials during de-sign and construction. Completed inApril 2005, the 62,000 sq. ft., three-story Pfizer CRU which features state-of-the-art, flexible lab and researchspace for the clinical trials of drugproducts has been awarded Silver Lead-ership in Energy and EnvironmentalDesign LEEDTM Certification by theUnited States Green Building Council(USGBC), the first such designationfor a building in Connecticut. The GreenBuilding Initiative, a non-profit net-work of building industry leaders com-
mitted to bringing sustainability tomainstream residential and commer-cial construction, also awarded thePfizer CRU a “Three Globes” designa-tion under its Green Globes environ-mental assessment and ratings sys-tem, for the incorporation of energyand environmental considerations inplanning and construction.
Pfizer Inc., 235 East 42nd Street,New York, NY 10017, www.pfizer.com.
O’Neal Awarded ContractO’Neal, Inc., a Southeastern US leaderin planning, design and constructionhas announced that United Therapeu-tics Corporation, a biotechnology com-pany based in Silver Spring, MD, willcontract with O’Neal for consultingservices related to its solid dose facilitythat will be built in Research TrianglePark, NC. O’Neal, which was recentlyranked 15th nationally for buildingpharmaceutical facilities by ENR Con-struction, will assist United Therapeu-tics in the architectural, engineeringand pre-construction services of theapproximate 125,000-square-foot facil-ity, which will ultimately employ up to300 people.
O’Neal, Inc., 10 Falcon Crest Dr.,Greenville, SC 29607, www.onealinc.com.
FDA Takes Action AgainstUnapproved Drug Products
The FDA has acted to improve drugsafety and quality by strengtheningefforts against unapproved drug prod-ucts. FDA efforts will begin againstprescription products containing theantihistamine carbinoxamine, becauseof safety concerns regarding their usein children less than two years of age.The agency is also issuing a final guid-ance document outlining its approachto addressing other medicines that aremarketed without FDA approval. TheFDA estimates that there are severalhundred different unapproved activeingredients in prescription drugs onthe market, with less than 2% of pre-scribed drugs being unapproved. FDA’sunapproved drugs Web page is http://www.fda.gov/cder/drug/unapproved_drugs/default.htm.
To submit materialfor publication in
Pharmaceutical Engineering'sNew Products and
Literature orIndustry and Peopledepartments, e-mailpress releases with
photos [email protected] consideration.
Reprinted from
PHARMACEUTICAL ENGINEERING®
The Official Magazine of ISPE
July/August 2006, Vol. 26 No. 4

JULY/AUGUST 2006 PHARMACEUTICAL ENGINEERING 1
ISPE Update
©Copyright ISPE 2006
Mark Your Calendar with these ISPE EventsAugust 200610 San Francisco/Bay Area Chapter, Golf Tournament and Winery Tour, Chardonnay Golf Club, Napa, California,
USA17 Boston Area Chapter, Annual Golf Tournament, Granite Links Golf Club, Quincy, Massachusetts, USA17 San Diego Chapter, Vendor Night, Hilton La Jolla Torrey Pines, La Jolla, California, USA18 San Diego Chapter, Golf Tournament, Twin Oaks Golf Course, San Marcos, California, USA22 Greater Los Angeles Area Chapter, Commuter Conference, California, USA
22 San Francisco/Bay Area Chapter, Commuter Conference at Novartis, Emeryville, California, USA
24 Pacific Northwest Chapter, Educational Event, Vancouver, British Columbia, Canada
30 Nordic Affiliate, Conference, “New Concepts for Commissioning and Qualification,” Copenhagen, Denmark
31 Puerto Rico Chapter, Members Night, Puerto Rico
September 200611 - 13 Great Lakes Chapter, Educational Tracks + Social Event + Golf Outing, Educational Tracks at the Crowne Plaza,
Evening Social Event at the NCAA Hall of Fame, Golf Outing at Heartland Crossing, Indianapolis, Indiana, USA11 - 15 ISPE Boston Classroom Training and GAMP Americas Forum, Hyatt Regency Cambridge, Cambridge, Massachusetts,
USA
12 Delaware Valley Chapter, Program Meeting, USA
12 Nordic Affiliate, Conference, “Operating Efficiency joint with Mentor Communications,” Malmo, Sweden
14 Ireland Affiliate, Seminar, “R&D Pilot Plant Commercialization,” Ireland
14 UK Affiliate-North West Region, Joint Seminar with IChemE, United Kingdom
18 - 22 ISPE Vienna Congress, InterContinental Wien, Wien, Austria19 Chesapeake Bay Area Chapter, Annual Golf Tournament, Whiskey Creek Golf Course, Ijamsville, Maryland, USA20 - 21 DACH Affiliate, Fachdiskussion, Water and Steam, Basel, Switzerland
21 Greater Los Angeles Area Chapter, Golf Tournament, California, USA
21 Pacific Northwest Chapter, Educational Sessions and Vendor Night, Bell Harbor Int'l Conference Center, Seattle,Washington, USA
22 Rocky Mountain Chapter, Golf Tournament, Vista Ridge Golf Course, Denver, Colorado, USA26 Boston Area Chapter, Pilot Plants Seminar, USA28 Puerto Rico Chapter, GAMP Puerto Rico Forum, Puerto Rico
October5 Nordic Affiliate, GAMP Conference, Copenhagen, Denmark5 San Francisco/Bay Area Chapter, Commuter Conference at Pipe Trades Training Center, San Jose, California,
USA9 - 12 ISPE Prague Training, Crowne Plaza, Prague, Czech Republic10 Delaware Valley Chapter, Program Meeting, USA12 Ireland Affiliate, “Pharmaceutical Documentation” Seminar, Ireland12 Italy Affiliate, “Cost Efficiency New Technologies Effectiveness and Quality in Pharmaceutical Supply Chain”
Seminar, Italy12 UK Affiliate-North West Regio, “Management of Pharmaceutical Waste” Seminar, United Kingdom18 Boston Area Chapter, 2006 Vendor Night, Gillette Stadium Clubhouse, Foxboro, Massachusetts, USA19 DACH Affiliate, Workshop, Biberach, Germany19 France Affiliate, MES/EBR Conference, France24 Greater Los Angeles Area Chapter, Commuter Conference, California, USA26 Nordic Affiliate, Freeze Drying Seminar, Sodertalje, Sweden
Dates and Topics are subject to change
Reprinted from
PHARMACEUTICAL ENGINEERING®
The Official Magazine of ISPE
July/August 2006, Vol. 26 No. 4
JULY/AUGUST 2006 PHARMACEUTICAL ENGINEERING 1
Classified Advertising
©Copyright ISPE 2006
Architects, Engineers - Constructors
CH2M Hill, PO Box 22508, Denver, CO80222, www.ch2mhill.com. See our adin this issue.
CRB Consulting Engineers, 7410 N.W.Tiffany Springs Pkwy., Suite 100, KansasCity, MO 64153. (816) 880-9800. See ourad in this issue.
IPS – Integrated Project Services, 2001Joshua Rd., Lafayette Hill, PA 19444.(610) 828-4090. See our ad in this issue.
NNE US, 7868 Hwy. 70 W., Clayton, NC27527. (919) 359-6600. See our ad in thisissue.
Parsons, 150 Federal St., Boston, MA02110. (617)-946-9400. See our ad inthis issue.
Employment Opportunities
Mechanical Discipline Manager: AustinAECOM provides comprehensiveconsulting, architecture, engineeringand construction services to clients
globally. We are seeking a MechanicalDiscipline Manager for our Chicagooffice. This position oversees HVAC,piping, plumbing and fire protectiondesign. Majority of projects are lifescience or process related. The successfulcandidate will possess a P.E. registrationand familiarity with ISPE Baseline®
Guides. We are an employee ownedcompany offering professional challengealong with a competitive compensationand benefits package. Submit yourresume to our career site at:www.austin.aecom.com. EOE/AAP, M/F/V/H, An AECOM Company.
Employment Search Firms
Jim Crumpley & Associates, 1200 E.Woodhurst Dr., Bldg. B-400, Springfield,MO 65804. (417) 882-7555. See our ad inthis issue.
Filtration Products
US Filter, 125 Rattlesnake Hill Rd.,Andover, MA 01810. (978) 470-1179. Seeour ad in this issue.
Label Removal Equipment
Hurst Corp., Box 737, Devon, PA 19333.(610) 687-2404. See our ad in this issue.
Passivation andContract Cleaning Services
Active Chemical Corp., 4520 Old LincolnHwy., Oakford, PA 19053. (215) 676-1111. See our ad in this issue.
Cal-Chem Corp., 2102 Merced Ave., SouthEl Monte, CA 91733. (800) 444-6786.See our ad in this issue.
Oakley Specialized Services, Inc., 50Hampton St., Metuchen, NJ 08840. (732)549-8757. See our ad in this issue.
Sterile Products Manufacturing
Validation Services
ProPharma Group, 10975 Benson Dr.,Suite 330, Overland Park, KS 66210;5235 Westview Dr., Suite 100, Frederick,MD 21703. (888) 242-0559. See our ad inthis issue.
Water Treatment
Christ Pharma & Life Science AG,Haupstrasse 192, 4147 Aesch,Switzerland. +41 617558111. See our adin this issue.
Reprinted from
PHARMACEUTICAL ENGINEERING®
The Official Magazine of ISPE
July/August 2006, Vol. 26 No. 4
DID YOU KNOW...?More than 56% of Subscribers
Forward Pharmaceutical Engineeringto One or More People
Source: 2005 Publications Survey
For advertising opportunities, call ISPE Directorof Sales, Dave Hall at +1-813-960-2105.