Embed Size (px)
Citation preview

A Holocene Geoarchaeological Record for the Upper Willamette Valley, Oregon: The Long Tom and Chalker Sites
Brian L. O’Neill, Thomas J. Connolly, and Dorothy E. Freidel
with contributions by Patricia F. McDowell and Guy L. Prouty
University of Oregon Anthropological Papers 61 Published by the Museum of Natural History and Department of Anthropology
�������������� ���������
�������������������������������
����������������
�!���
�����
�
�"��
�#��$
���� ���
��%�����
���
�������������� ���������
�����
���!�&�����#��������
�����
���
��
�!���
�!���
����
�����
'( ') '* '+
,, ,- ,+ ,*

A Holocene Geoarchaeological Record for the Upper Willamette Valley, Oregon: The Long Tom and Chalker Sites
Brian L. O’Neill, Thomas J. Connolly, and Dorothy E. Freidel
with contributions by Patricia F. McDowell and Guy L. Prouty
University of Oregon Anthropological Papers 61
Published by the Museum of Natural History and the Department of Anthropology
University of Oregon, Eugene 2004

ii

iii
Abstract Data recovery investigations at two prehistoric sites were prompted by the Oregon Department of Transportation’s realignment of the Noti-Veneta segment of the Florence to Eugene Highway (OR 126) in Lane County, Oregon. The Long Tom (35LA439) and Chalker (35LA420) archaeological sites are located on the floodplain of the Long Tom River in the upper Willamette Valley of western Oregon. Investigations at these sites included an examination of the geomorphic setting of the project to understand the processes that have shaped the landscape and to which its human occupants adapted. The cultural components investigated ranged in age between about 10,000 and 500 years ago. Geomorphic investigation of this portion of the Long Tom River valley documents a landform history spanning the last 11,000 years. This history is punctuated by periods of erosion and deposition, processes that relate to both the preservation and absence of archaeological evidence from particular periods. The identification of five stratigraphic units, defined from trenching and soil coring in the project area, help correlate the cultural resources found at sites located in the project. Stratigraphic Unit V, found at depths to approximately 250 cm, is a clayey paleosol with cultural radiocarbon ages between 11,000 and 10,500 cal BP. Unit IV, with radiocarbon ages between approximately 10,000 and 8500 cal BP, consists of fine-textured sediments laid down during a period of accelerated deposition. An erosional unconformity separates Unit IV from the overlying Unit III. In the archaeological record, this unconformity represents a gap of nearly 3000 years, from 8500 to 5700 cal BP, and corresponds to a period of downcutting in the Willamette system that culminated with a transition from the Winkle to Ingram floodplain surfaces. Unit III sediments are sandy loams within which are found numerous oven features at the Long Tom, Chalker, and other nearby archaeological sites, and date between approximately 5700 to 4100 years ago. A near absence of radiocarbon-dated sediments in the project area between approximately 4100 and 1300 years ago suggests either a lack of use of this area during this period, or an erosional period that was apparently less severe on a regional scale. Units II and I are discontinuous bodies of vertically accreted sediments which represent a period of rapid deposition in the project area during the last 1300 years. It is estimated that Unit I sediments were deposited within the last 500 years. Investigations at the Long Tom site discovered three cultural components. Components 1 and 3 are ephemeral traces of human presence at the site. The Late Holocene-age Component 1, found within Stratigraphic Units I and II, contains a small assemblage of chipped stone tools and debitage dominated by locally obtainable obsidian. The Early Holocene-age Component 3 contains a single obsidian uniface collected from among a scatter of fire-cracked rock and charcoal found within Stratigraphic Unit IV. Charcoal from this feature returned a radiocarbon age of 9905 cal BP. Contained within Stratigraphic Unit III, Component 2 presents evidence for a concentrated period of site use between approximately 5000 and 4000 cal BP. Geophysical exploration of the deep alluvial sediments with a proton magnetometer located magnetic anomalies, a sample of which was mechanically bisected and hand-excavated for closer analysis. A total of 21 earth ovens and two rock clusters was exposed in sediments associated with radiocarbon ages clustering about 4400 cal BP. Charred fragments of camas bulbs and hazelnut and acorn husks were recovered from the ovens. Few tools were discovered in their vicinity. Larger-scale excavations within the Middle Holocene sediments at the west end of the site discovered what is interpreted as a residential locus. Archaeological investigations at the Chalker site identified three cultural components. Component 3, the oldest of the three, contains a small portable tool assemblage and is represented by a well-preserved earth oven with an associated radiocarbon age of 4610 cal BP, roughly contemporaneous with the Middle Holocene-age Long Tom site occupation. Component 3 is found within Stratigraphic Unit III sediments. The upper two components are of Late Holocene-age, with projectile point assemblages dominated by small (arrow-size) specimens. Component 2, perhaps the most intensively occupied period, dates between 1280 cal BP and 925 cal BP, and lies within Stratigraphic Unit II sediments. In addition to narrow-necked and small stemless projectile point types, the artifact assemblage includes drills, other bifaces, unifaces, utilized flakes, chopper/cores, hammerstones, a hammer/anvil stone, and split and unsplit obsidian pebbles. Excavations may have exposed a temporary warm-weather shelter. The artifact assemblage of Component 1, found within Stratigraphic Unit I sediments, is dominated by projectile points associated with radiocarbon ages ranging between 660 cal BP and 510 cal BP.

iv
The proton magnetometry undertaken at the Chalker and Long Tom sites was the first use of this remote sensing technique in western Oregon. The fine-grained silt of the Long Tom River valley, within which the cultural deposits were buried, provided an unusually good environment for the use of this prospecting method. Maps produced from the survey results guided excavations and provided information regarding the number of extant earth ovens and their location. Macrobotanical analysis of samples recovered from the Chalker and Long Tom sites identified eight economically important plant species including hazel, acorn, camas, thimbleberry, chokecherry, Indian plum, Miner’s lettuce, and bedstraw. Most significantly, camas was found in Middle Holocene-age oven features, calling into question the hypothesis that this time period had been too xeric for exploitation of this root crop. Obsidian studies of debitage from the Chalker and Long Tom sites found that the vast majority of the material found at these sites during all periods of occupation was locally obtained Inman Creek-A and Inman Creek-B obsidian. The Middle Holocene-age assemblages of both sites, however, contain small proportions of exotic obsidian from the more distant Obsidian Cliffs and Newberry Volcano sources. Hydration analysis of Inman Creek types A and B yield no noticeable difference in their rates of hydration. Evidence obtained from data recovery of the Middle Holocene-age components of the Chalker and Long Tom sites, coupled with information collected from other sites in the region, present a pattern of intensification in the exploitation of camas during a 1000 year period beginning approximately 5000 years ago. The culture history of the Willamette Valley is inextricably tied to a landform which also has a dynamic history. This report, coupling the findings of geomorphology and archaeology, is a pioneering effort in its attempt to understand the relationship of the human use of the changing landscape in the upper Willamette Valley during the last 11,000 years.

v
Preface Archaeological data recovery investigations of the Chalker (35LA420) and Long Tom (35LA439) sites by the State Museum of Anthropology were prompted by Oregon Department of Transportation plans to construct a new alignment of the Florence to Eugene Highway (OR 126) between the small communities of Veneta and Noti in Lane County, Oregon, west of Eugene. Reconnaissance and testing along various proposed routes had discovered a number of archaeological sites occupying the valley bottom adjacent to the Long Tom River (O’Neill 1987). The final alignment avoided many of these cultural resources but would impact the Chalker and Long Tom sites. Field work was carried out by a Museum field crew between September 22 and November 18, 1986. The Oregon Department of Transportation was represented by Pieter Dykman, Director of the Environmental Section, and Maxine Banks, Cultural Resources Technician. We thank both for their assistance and patience. We are also grateful to the Oregon Country Fair for their interest in the project and for permission to travel freely across their property during the data recovery phase. We would like to particularly recognize John Stamp for his continued interest in the project and for urging others in the community to become involved in elucidating the region's natural and cultural history. The Museum acknowledges Bernie Larsen and the City of Veneta for granting permission for travel through their property to reach the Chalker site. Further, we thank Mr. David Kinney, Veneta City Manager at the time of this project, for his support and interest in recording cultural resources on city-owned property. At the direction of Mr. Kinney, the Museum conducted a reconnaissance and testing of a sewage lagoon which the city proposed excavating near the Chalker and Stamp archaeological sites. Fill dirt removed from this lagoon would be used in the construction of the highway. The Noti-Veneta Archaeological Project was under the overall supervision of Dr. Thomas Connolly, Museum Research Director. Directing the field work and supervising the report preparation was Dr. Brian L. O'Neill, Museum staff archaeologist. Prior to conducting excavations at the Chalker and Long Tom sites a magnetometer survey of these two areas was directed by Dr. Connolly with help from Dr. Brian Hemphill and Dr. Robert Musil. Connolly reduced the data, producing images used to plan the excavation phase. To our knowledge, the work at the Long Tom and Chalker sites was the first use of a magnetometer to locate buried archaeological deposits in western Oregon. That it was a success is evident from the results presented by Connolly in Chapter 6. Under appropriate sedimentological conditions, geophysical exploration has become another methodological tool employed by the Museum in its research. Fieldwork, beginning under balmy Autumn conditions and ending with constantly wet rain gear, was often challenging. Connolly and O'Neill collaborated in supervising and directing fieldwork, with Dr. David Eisler serving as Field Assistant. Those participating in the fieldwork included Nora Bessler, Jessica Bondy, Kevin Donald, Jim Driskoll, Pam Endzweig, Jim Guthrie, Brian Hemphill, Rhonda Johnson, Steve McCormick, Judy McNesby, Kathryn Madden, Regina Marchesini, Dennis Pontius, Guy Prouty, John Stamp, Steve Trimell, Wayne Tucker, and Tom Ulmschneider. Following the backhoe trenching at the Long Tom site, profiles were examined and those containing evidence of cultural features were illustrated by Jessica Bondy. Soil profiles in excavations and backhoe trenches were described by Dr. Patricia McDowell of the University of Oregon Geography Department, who also provided a clear and convincing argument for the human origin of the rock, bisque and charcoal feature observed at the bottom of one of the trenches--which later returned a radiocarbon age of 9900 cal BP. McDowell conducted a sediment analysis of samples recovered from the Long Tom and Chalker sites, and her geomorphologic work provides a sound foundation upon which future research can be conducted in this region. Chapter 4 is the product of these investigations. Building upon the work begun by McDowell and the preliminary results of data recovery at the Chalker and Long Tom sites, Drs. Connolly and McDowell launched a geoarchaeology project on land owned by the Oregon Country Fair and City of Veneta (Freidel et al. 1989; Freidel 1989; Peterson 1989). Aided by a Department of the Interior Survey and Planning grant administered by the Oregon State Historic Preservation Office, as well as matching funds from the City of Veneta and Oregon Country Fair, this project was implemented by Dorothy Freidel and Lynn Peterson, with Dr. O’Neill’s guidance. Dr. Freidel was interested in documenting the stratigraphic history and processes along a segment of the Long Tom River valley where archaeological work had provided a lengthy

vi
series of radiocarbon ages for the alluvial deposits. The results of her work are summarized in Chapter 5 and woven throughout the discussion of the data recovery results. Plant processing, as witnessed by the numerous earth ovens, was thought to have been an important aspect of past human activity at the Long Tom site. Therefore, care was taken to collect soil samples from features which would be examined for macrobotanical remains. Column samples and grab samples were also collected at the Chalker site. Dr. Guy Prouty performed the water separation and flotation of these soil samples and identified the recovered macrofossils. Prouty’s contributions are detailed in Chapter 10. Radiocarbon dating of charcoal samples recovered from the sites during the data recovery project was reported by Beta Analytic, Inc., Coral Gables, Florida. Obsidian source analysis was conducted by Dr. Richard Hughes, Anthropological Studies Center, Sonoma State University, Rohnert Park, California. Obsidian hydration band measurement was performed and reported by Thomas Origer, also of the Anthropological Studies Center of Sonoma State University. Artifact illustrations were drawn by Museum illustrators Eric Carlson and Lance Peterson. Maps and profile illustrations were drafted by Museum Research Assistant Carolyn Armstrong. For the Chalker site (35LA420), the artifacts, records, and samples collected during this project are permanently curated at the Oregon State Museum of Anthropology, University of Oregon under accession number 615. The Oregon State Museum of Anthropology accession number for the Long Tom site (35LA439) data recovery artifacts, records, and samples is 616.

vii
Table of Contents Page Abstract .............................................................................................................................................. iii Preface .............................................................................................................................................. v List of Tables .............................................................................................................................................. ix List of Figures .............................................................................................................................................. xi Chapter 1 Research Context of the Upper Willamette Valley (Thomas J. Connolly and Brian L. O’Neill)....... 1 2 Natural Environment (Brian L. O’Neill and Thomas J. Connolly) .................................................... 5 Geology and Raw Material Sources............................................................................................. 5 Hydrology and Topography ......................................................................................................... 7 Present and Past Climates ............................................................................................................ 7 Vegetation .................................................................................................................................... 9 Fauna............................................................................................................................................ 10 3 Cultural Setting (Brian L. O’Neill and Thomas J. Connolly).............................................................. 13 Ethnography of the Long Tom Area ............................................................................................ 13 Prehistory of the Noti-Veneta Project Area.................................................................................. 18 4 Sediment Analysis Studies: Geomorphology and Soils of the Chalker and Long Tom Sites (Patricia F. McDowell) ....................................................................................................................... 27 Introduction.................................................................................................................................. 27 Geomorphic Setting of the Sites................................................................................................... 28 Geomorphic Surface and Soils in the Lower Long Tom River .................................................... 28 Geomorphic Stratigraphy and Sediments of the Sites on the Ingram Surface.............................. 31 Soil Chemical Studies at the Noti-Veneta Archaeological Sites .................................................. 36 Summary ...................................................................................................................................... 44 5 Alluvial Stratigraphy of the Long Tom River Floodplain (Dorothy E. Freidel) ................................. 45 Introduction.................................................................................................................................. 45 Project Setting .............................................................................................................................. 45 Methods........................................................................................................................................ 47 Stratigraphic Units and Environmental Facies ............................................................................. 49 Description and Dating of Long Tom Stratigraphic Units ........................................................... 50 Summary of Stratigraphic Units and Floodplain History............................................................. 58 6 Magnetometer Survey at the Long Tom and Chalker Sites (Thomas J. Connolly) ............................. 61 Principles of Magnetic Surveying ................................................................................................ 61 The Long Tom Site ...................................................................................................................... 64 The Chalker Site........................................................................................................................... 71

viii
Table of Contents (Continued) Chapter Page 7 Archaeology of the Long Tom Site (35LA439) (Brian L. O’Neill and Thomas J. Connolly)............. 75 Previous Archaeology .................................................................................................................. 76 Long Tom Site Stratigraphy......................................................................................................... 78 Data Recovery Investigations....................................................................................................... 80 Site Dating and Cultural Components.......................................................................................... 106 Cultural Features .......................................................................................................................... 110 Long Tom Site Artifacts............................................................................................................... 118 Long Tom Site Summary ............................................................................................................. 136 8 Archaeology of the Chalker Site (35LA420) (Brian L. O’Neill and Thomas J. Connolly) ................. 139 Previous Archaeology .................................................................................................................. 140 Chalker Site Stratigraphy ............................................................................................................. 142 Data Recovery Investigations....................................................................................................... 146 Site Dating and Definition of Cultural Components .................................................................... 157 Cultural Features .......................................................................................................................... 165 Chalker Site Artifacts ................................................................................................................... 171 Chalker Site Summary ................................................................................................................. 201 9 Obsidian Studies (Thomas J. Connolly and Brian L. O’Neill) ............................................................ 203 Introduction.................................................................................................................................. 203 Geochemical Sources of Long Tom and Chalker Site Obsidian .................................................. 203 Obsidian Hydration Analysis ....................................................................................................... 206 Summary ...................................................................................................................................... 208 10 Aboriginal Plant Use at the Chalker and Long Tom Sites (Guy L. Prouty, Brian L. O’Neill and Thomas J. Connolly) ..................................................................................................................... 211 Ethnobotanical Context of Recovered Specimens ....................................................................... 211 Methods and Results .................................................................................................................... 214 Discussion .................................................................................................................................... 217 11 Cultural and Landscape History of the Upper Willamette Valley: Summary and Discussion (Thomas J. Connolly, Brian L. O’Neill and Dorothy E. Freidel)........................................................ 221 Landform History and Chronology of the Long Tom Basin ........................................................ 221 Archaeology of the Long Tom Site.............................................................................................. 223 Archaeology of the Chalker Site .................................................................................................. 226 Efficacy of the Magnetometer Survey.......................................................................................... 227 The Long Tom and Chalker Sites in Regional Perspective.......................................................... 229 References Cited .............................................................................................................................................. 231

xi
List of Figures Figure Page 1.1 Location of the Long Tom and Chalker sites in the Long Tom River drainage .................................. 2 2.1 Setting of the Noti-Veneta Project ...................................................................................................... 6 2.2 Government Land Office map of the Project ...................................................................................... 8 3.1 Distribution of the Kalapuyan Indian groups in the Willamette Valley .............................................. 15 3.2 Upper Willamette Valley cultural chronology .................................................................................... 19 3.3 Location of important Long Tom River drainage archaeological sites ............................................... 22 4.1 Regional map showing setting of Project and drainage system........................................................... 27 4.2 Schematic cross-section of soils and geomorphic surfaces ................................................................. 29 4.3 Soil-geomorphology map of the lower Long Tom River Valley......................................................... 29 4.4 Plot of vertical accretion rate versus radiocarbon sample age............................................................. 35 4.5 Results of soil chemistry analyses of samples from Trench 179W/55N ............................................. 37 4.6 Results of soil chemistry analyses of samples collected from 179W/70W ......................................... 38 4.7 Results of soil chemistry from samples collected from the East Block............................................... 39 4.8 Results of soil chemistry from samples collected from the West Block ............................................. 40 4.9 Results of soil chemistry on samples collected from the Chalker site................................................. 42 5.1 Location of the Country Fair/Veneta Geoarchaeological Project........................................................ 46 5.2 Map of the study area showing transects and location of soil profiles ................................................ 47 5.3 Map of study area showing location of archaeological transects A-H ................................................ 48 5.4 Location of archaeological transects A-C ........................................................................................... 49 5.5 Particle size data from LT-18.............................................................................................................. 52 5.6 Particle size data from LT-33.............................................................................................................. 52 5.7 Transect 1 cross-section ...................................................................................................................... 53 5.8 Transect 2 cross-section ...................................................................................................................... 54 5.9 Transect 3 cross-section ...................................................................................................................... 55 5.10 Transect 3 Southeast cross-section...................................................................................................... 56 5.11 Trench C2 cross-section ...................................................................................................................... 57 5.12 Trench B2 cross-section ...................................................................................................................... 58 6.1 Graph of magnetic field intensity measured near the Long Tom site.................................................. 61 6.2 Topographic map of the Long Tom site showing magnetometer blocks............................................. 63 6.3 Magnetometer map of the eastern portion of the Long Tom site ........................................................ 65 6.4 Magnetometer map or the central portion of the Long Tom site......................................................... 66 6.5 Magnetometer map of the western portion of the Long Tom site ....................................................... 67 6.6 Topographic map of the Chalker site showing magnetometer survey blocks ..................................... 72 6.7 Magnetometer map of the Chalker site................................................................................................ 73 7.1 General view of data recovery trenching at the Long Tom site........................................................... 75 7.2 Stone bowl mortars, projectile points and pestle recovered during site testing................................... 77 7.3 East profile of Trench 191W ............................................................................................................... 79 7.4 Conducting the magnetometer survey at the Long Tom site ............................................................... 80 7.5 Magnetometer map of the east portion of the Long Tom site showing location of trench .................. 81 7.6 Magnetometer map of the central portion of the Long Tom site showing location of trenches .......... 82 7.7 Magnetometer map of the west portion of the Long Tom site showing location of trenches.............. 83 7.8 Location of backhoe trenches, excavation units, and block excavations at the Long Tom site........... 84 7.9 Beginning hand-excavation at the southern end of Trench 70W......................................................... 86 7.10 East profile of Trench 70W ................................................................................................................. 87 7.11 West profile of Trench 124W.............................................................................................................. 88 7.12 Two meter segment of Trench 124W.................................................................................................. 89

xii
List of Figures (Continued) Figure Page 7.13 General view to north of data recovery excavations at features 6, 7, and 8 ........................................ 90 7.14 Two meter segment of the east profile of Trench 171W ..................................................................... 91 7.15 Four meter segment of the west profile of Trench 179W.................................................................... 92 7.16 Plan view of features 14a and 14b along the west side of Trench 191W ............................................ 93 7.17 Two meter segment at the north end of Trench 191W ........................................................................ 94 7.18 Two meter segment of Trench 206W showing Feature 17.................................................................. 95 7.19 Two meter segment of Trench 206W showing Feature 18.................................................................. 96 7.20 The East Block Excavation Area at the Long Tom site....................................................................... 97 7.21 Excavations in progress in the East Excavation Block........................................................................ 97 7.22 Feature 10 in Unit A of the East Excavation Block............................................................................. 98 7.23 Feature 24 in Unit F of the East Excavation Block ............................................................................. 99 7.24 General view of the West Excavation Block....................................................................................... 100 7.25 The West Block Excavation Area at the Long Tom site ..................................................................... 101 7.26 View to southeast of work in progress in the West Excavation Block................................................ 102 7.27 Density of lithic debitage at the West Excavation Block .................................................................... 103 7.28 Excavated remains of Feature 19 ........................................................................................................ 104 7.29 Feature 25, a possible post mold ......................................................................................................... 105 7.30 Ranges of dendrocalibrated middle Holocene ages from the Long Tom site...................................... 107 7.31 Feature 9 earth oven bisected by Trench 171W .................................................................................. 112 7.32 Remains of Feature 4 earth oven along the west side of Trench 124W .............................................. 113 7.33 Plot of reconstructed total fire-cracked rock weight by earth oven diameter ...................................... 115 7.34 Feature 15 earth oven .......................................................................................................................... 115 7.35 Possible post mold or storage pit, Feature 8........................................................................................ 116 7.36 Component 1 and Component 2 projectile points ............................................................................... 119 7.37 Long Tom site drill and other formed bifaces ..................................................................................... 123 7.38 Long Tom site unifaces ....................................................................................................................... 125 7.39 Long Tom site chopper/cores .............................................................................................................. 127 7.40 Long Tom site pestles ......................................................................................................................... 129 7.41 Cobble-size anvils from the East Excavation Block............................................................................ 131 7.42 Cobble anvil or hopper mortar base ................................................................................................... 132 8.1 General view to north of the Chalker site............................................................................................ 139 8.2 Location of test excavations at the Chalker site .................................................................................. 140 8.3 Formed tools collected during testing at the Chalker site.................................................................... 141 8.4 Idealized Chalker site stratigraphic profile.......................................................................................... 142 8.5 West profile of Unit F ......................................................................................................................... 143 8.6 South profile of Unit E ........................................................................................................................ 143 8.7 Vertical distribution of total phosphorus values in soil samples from Unit E ..................................... 144 8.8 Topographic map of the Chalker site showing location of data recovery investigations .................... 145 8.9 Beginning excavations at the Chalker site........................................................................................... 147 8.10 View to southwest of work in progress at the Chalker site ................................................................. 148 8.11 Vertical distribution of debitage recovered from Units A and B......................................................... 150 8.12 West profile of Unit A......................................................................................................................... 150 8.13 View to south of work in progress at the Chalker site......................................................................... 151 8.14 Vertical distribution of debitage from units F, I, and J........................................................................ 152 8.15 Vertical distribution of debitage from units D, E, and H..................................................................... 153 8.16 West profile of Unit D......................................................................................................................... 153 8.17 South profile of Unit E ........................................................................................................................ 154 8.18 East profile of Unit H and west profile of Unit E................................................................................ 154

xiii
List of Figures (Continued) Figure Page 8.19 Vertical distribution of debitage from units C and G .......................................................................... 155 8.20 East profile of Unit C .......................................................................................................................... 156 8.21 Vertical distribution of Chalker site calibrated radiocarbon ages........................................................ 158 8.22 Distribution of dendrocalibrated Chalker site radiocarbon ages ......................................................... 159 8.23 Frequency distribution of hydration readings on Chalker site obsidian specimens............................. 161 8.24 Distribution of mean hydration values for Chalker site components .................................................. 162 8.25 Feature 1 fire pit along the west profile of Unit B............................................................................... 167 8.26 Feature 6 earth oven ............................................................................................................................ 168 8.27 Feature 4 rock cluster .......................................................................................................................... 168 8.28 Feature 7 rock cluster .......................................................................................................................... 169 8.29 Distribution of cultural features at the Chalker site............................................................................. 170 8.30 Stemless projectile points from the Chalker site ................................................................................. 176 8.31 Distribution of Chalker site projectile point neck width frequency..................................................... 177 8.32 Chalker site Narrow-neck Type 2 (NN2) projectile points.................................................................. 178 8.33 Chalker site Narrow-neck Type 3 (NN3) projectile points.................................................................. 179 8.34 Chalker site Heavy Broad-neck (HB) projectile points ....................................................................... 180 8.35 Chalker site drills and bifaces ............................................................................................................. 183 8.36 Chalker site end and side scrapers....................................................................................................... 186 8.37 Chalker site cobble choppers, hammer/anvil stone, and pestles.......................................................... 190 8.38 Relative proportions of obsidian, CCS, and basalt in the Chalker site components............................ 193 8.39 Proportion of CCS and obsidian cortical flakes in components at the Chalker site ............................ 198 9.1 Plot of obsidian hydration values by depth at the Chalker site............................................................ 206 9.2 Distribution of hydration values at the Chalker site ............................................................................ 207 9.3 Distribution of hydration age estimates............................................................................................... 209 10.1 Proportion of hazelnut, acorn and camas macrofossils from the Chalker and Long Tom sites........... 218 10.2 Proportion of the major macrofossil types found in the Chalker site components .............................. 219 11.1 Plot of calibrated radiocarbon ages by depth....................................................................................... 228

ix
List of Tables Table Page 2.1 Summary of three climatic episodes during the Holocene .................................................................. 9 2.2 List of plants currently common to the Noti-Veneta Project area ....................................................... 10 4.1 Soils of the project area ....................................................................................................................... 28 4.2 Detailed description of section in Trench 124W, Long Tom site........................................................ 31 4.3 Sediment size data from the Long Tom site ........................................................................................ 32 4.4 Sediment size data from the Chalker site ............................................................................................ 33 4.5 Raciocarbon dates, sample depths, and calculated accretion rates ...................................................... 34 4.6 Soil chemical analysis of the Long Tom site soil samples .................................................................. 36 4.7 Soil chemical analysis of the Chalker site soil samples ...................................................................... 41 4.8 Total element chemistry ...................................................................................................................... 43 5.1 Radiocarbon ages from the Country Fair-Veneta Geoarchaeological project area.............................. 51 6.1 Comparison of on-site and base station readings ................................................................................ 62 6.2 Summary of magnetic anomalies recorded at the Long Tom site ....................................................... 68 6.3 Magnetic signatures of features investigated at the Long Tom site..................................................... 70 6.4 Summary of magnetic anomalies recorded at the Chalker site............................................................ 74 7.1 Summary of cultural features exposed during test excavations at the Long Tom site......................... 76 7.2 Summary of the magnetic anomalies scheduled for examination at the Long Tom site ..................... 82 7.3 Summary of backhoe trenches excavated at the Long Tom site.......................................................... 85 7.4 Distribution of lithic debitage in the East Block at the Long Tom site ............................................... 99 7.5 Distribution of lithic debitage in the West Block at the Long Tom site .............................................. 102 7.6 Summary of Long Tom site data recovery excavation volume and recovery ..................................... 106 7.7 Radiocarbon determinations on Long Tom site charcoal samples ...................................................... 107 7.8 Geochemical sources and hydration values of Long Tom site obsidian specimens ............................ 108 7.9 Summary of the three Long Tom site components.............................................................................. 109 7.10 Summary of cultural features exposed during data recovery investigations ....................................... 111 7.11 Estimated total weight and density of fire-cracked rock in Long Tom site earth ovens...................... 114 7.12 Summary of Long Tom site artifacts by component ........................................................................... 118 7.13 Long Tom site projectile point data..................................................................................................... 119 7.14 Distribution of Long Tom site projectile points by component and type ............................................ 121 7.15 Long Tom site biface and drill data..................................................................................................... 122 7.16 Long Tom site uniface data ................................................................................................................. 124 7.17 Long Tom site utilized flake data........................................................................................................ 126 7.18 Long Tom site cobble/chopper data .................................................................................................... 127 7.19 Long Tom site core data...................................................................................................................... 128 7.20 Long Tom site pecked and ground stone tool data .............................................................................. 130 7.21 Long Tom site manuport data ............................................................................................................. 133 7.22 Summary of Long Tom site lithic debitage ......................................................................................... 134 7.23 Summary of lithic debitage from Component 1 .................................................................................. 135 7.24 Summary of lithic debitage from Component 2 .................................................................................. 135 8.1 Total phosphorus values in samples collected from Unit E................................................................. 144 8.2 Description of the Chalker site soil stratigraphic units........................................................................ 144 8.3 Chalker site excavation unit provenience and codes ........................................................................... 146

x
List of Tables (Continued)
Table Page 8.4 Summary of the debitage recovered from the Chalker site units......................................................... 149 8.5 Summary of Chalker site radiocarbon dates........................................................................................ 157 8.6 Geochemical source and hydration mean for obsidian debitage from Chalker site............................. 160 8.7 Summary statistics and calculated hydration ages for Chalker site components................................. 163 8.8 Definition of the Chalker site components .......................................................................................... 164 8.9 Summary of cultural features at the Chalker site................................................................................. 166 8.10 Summary of Long Tom site artifacts by component ........................................................................... 172 8.11 Chalker site projectile point data......................................................................................................... 174 8.12 Breakage pattern of the Chalker site points......................................................................................... 181 8.13 Distribution of Chalker site projectile points by component............................................................... 181 8.14 Chalker site drill, formed and unformed biface data ........................................................................... 182 8.15 Distribution of formed biface types by component ............................................................................. 184 8.16 Chalker site uniface data ..................................................................................................................... 185 8.17 Chalker site utilized flake data ............................................................................................................ 187 8.18 Chalker site chopper/core and hammerstone data ............................................................................... 189 8.19 Chalker site cores, split obsidian pebbles, and unmodified obsidian pebbles ..................................... 191 8.20 Raw material frequency of lithic debitage at the Chalker site ............................................................. 192 8.21 Raw material frequency of chipped stone tools................................................................................... 193 8.22 Chi-square test of frequency of raw material ...................................................................................... 194 8.23 Chi-square test comparing raw material of debitage and chipped stone tool ...................................... 195 8.24 Chi-square test chipped stone tools and raw material types ................................................................ 195 8.25 Chronologically ordered Long Tom drainage assemblages, obsidian debitage................................... 196 8.26 Flake type of lithic debitage by raw material ...................................................................................... 198 8.27 Debitage size by material .................................................................................................................... 199 8.28 Flake completeness of lithic debitage by material............................................................................... 200 9.1 Obsidian sources and hydration values for the Chalker site................................................................ 204 9.2 Distribution of obsidian geochemical types by site and component.................................................... 205 9.3 Obsidian hydration and calibrated radiocarbon age data pair averages............................................... 208 10.1 Location of column and fill samples from the Chalker and Long Tom sites....................................... 214 10.2 Botanical remains from cultural features at the Long Tom site .......................................................... 216 10.3 Botanical remains from the Chalker site ............................................................................................ 216 10.4 Modern and recovered flora found at 35LA420 and 35LA439 ........................................................... 217 10.5 Chi-square analysis of nut and bulb abundance .................................................................................. 218 11.1 Distribution of portable Component 2 tools across the Long Tom site ............................................... 225 11.2 Distribution of portable tools from the three Chalker site components............................................... 227

Chapter 1
Research Context of the Upper Willamette Valley
Thomas J. Connolly and Brian L. O’Neill Archaeological investigations at the Chalker (35LA420) and Long Tom (35LA439) sites were prompted by the Oregon Department of Transportation’s plan to realign a segment of the Florence-Eugene Highway (OR 126) between the communities of Noti and Veneta. When these sites were discovered in the proposed new highway corridor, additional survey and testing was done to identify an alternate route that would avoid the sites. For every new alignment examined, however, additional significant cultural sites were encountered (O’Neill 1987). While the final construction design avoided most of the identified sites, impacts to two, the Chalker and Long Tom sites, were found to be unavoidable. Data recovery excavation at these two sites was accomplished during the summer and fall of 1986, and is reported here. The Noti-Veneta project area is located in the upper Willamette Valley of western Oregon, along the middle course of the Long Tom River (Figure 1.1). The Willamette Valley is a structural trough, located between the volcanic Cascade Range to the east, and the uplifted, primarily sedimentary rocks of the Coast Range to the west. The Long Tom is a major west-side tributary of the Willamette River, draining the eastern flanks of the Coast Range. The upper Long Tom drains southerly, along the base of this range. The middle stretch of the Long Tom flows easterly, through a valley and floodplain of its own making, to the former marshy basin now occupied by Fern Ridge Reservoir within the main Willamette Valley. The lower Long Tom flows northerly, within the main Willamette Valley, paralleling the Willamette River for some 40 km before they join. The Noti-Veneta project area is in the eastern portion of the east-west trending Long Tom valley, where the valley begins to widen to the Willamette Valley about three km west of Fern Ridge Reservoir. Chapter 2, with its descriptions of the project area’s hydrology, geology, plant and animal resources, and what is known of past and current climates, presents an environmental context into which the archaeological studies are set. Production of this final report on the Chalker and Long Tom site excavations has been long overdue, but as we compiled this document in 2003 we had the benefit of reviewing the results of this work in a far more robust context than we could have when the fieldwork was completed a decade ago. Pettigrew (1980:77) lamented that archaeological research in the Willamette Valley at the outset of the 1980s was “in its infancy,” lacking research focus and appropriate methodologies, and a very limited foundation of data. Only a few dates from the valley older than about 2000 years were known. This fact led Davis (1978) to propose a gradual adaptation to the resources of the valley floor over the course of the Holocene, while Beckham et al. (1981:137) more appropriately attributed this pattern to poorly understood geomorphic processes. Apart from the varied opinions as to cause, there was consensus on the general absence of evidence regarding early and middle Holocene cultural histories in the Willamette Valley.
The lack of time depth in Willamette Valley archaeological remains did not deter development of a plethora of cultural chronologies (eg. White 1975; Davis 1978; Beckham et al. 1981). The earliest phases were represented by Cascadia Cave, a site in the Western Cascades (Newman 1966), and a handfull of stylistically early artifacts found in and around the valley (Allely 1975; Cressman 1947; Woodward 1972). Cultural phases of middle or late Holocene age were characterized by the beginning of “intense use of the Willamette River floodplain environment” (Beckham et al. 1981:167), as evidenced by sites bearing a variety of chipped and ground stone tools and rock-lined pit features interpreted as camas baking ovens. As outlined in Chapter 3, sites were assigned to a “Middle” or “Late” phase based on 1) the relative predominance of large to small projectile points, or 2) radiocarbon ages. Indeed, if not for radiocarbon dating, it would be difficult to sort sites by time; many of the investigated sites were middens that had seen a history of anthropogenic disturbances, and artifacts from sites of all ages included chipped stone knives and scrapers, cobble mauls and hammerstones, manos, pestles, and stone bowls that were not particularly chronologically distinct. Chronologies relied more on extrapolation from neighboring areas than on the valley’s archaeological record itself.

The Long Tom and Chalker Sites 2
Figure 1.1. Location of the Long Tom and Chalker archaeological sites in the Long Tom River drainage of the upper Willamette Valley (USGS Noti and Elmira quads, 7.5’ series).

3 Chapter 1 – Research Context
The observation of Beckham et al. (1981:137) that the nature of the Willamette Valley archaeological record is a function of floodplain history is consistent with contemporary acknowledgments (cf. White 1975; McDowell 1984) that “[g]eomorphic surfaces could serve as the basic environmental data base for an environmental model of archaeological site location” (McDowell 1984:43; emphasis added). Detailed mapping of geomorphic surfaces in the valley by Balster and Parsons (1968) provided the potential for relating landform history to the archaeological record. During the course of testing the various proposed roadway alignments for the Noti-Veneta corridor project, we found that all recorded sites were buried (O’Neill 1987), and that both the Chalker and Long Tom sites possessed stratigraphic evidence of relevance to interpreting the development of local river discharge patterns and floodplain history. We believed that systematic investigation of local geomorphic structures “would put the whole data base into a much clearer context in terms of land surface availability, site erasure, site discoverability, potential buried site location, climatic and vegetational history, and stratigraphic comparability and chronology” (Connolly 1986). Chapter 4 of this volume, by Patricia McDowell, reports site-specific sediment and pedogenic analyses for the Long Tom and Chalker sites, with an objective of relating local sediment histories to Balster and Parson’s (1968) valley-wide geomorphic model. McDowell’s study finds that stratigraphic structures are consistent and predictable throughout the project area, a significant finding with respect to future archaeological modeling. She offers preliminary conclusions regarding the stability of the Long Tom River fluvial system, and relates a landform history that was found to span the Holocene—a time frame not anticipated based on our initial testing. Finally, the results of soil chemistry studies have important implications for functional interpretations of the archaeological sites. Our discovery in the 1986 data recovery excavations of a 10,000 year long stratigraphic record encouraged further geoarchaeological investigations in the area. Supported by a National Park Service Historic Preservation matching grant, administered through the Oregon State Historic Preservation Office, and matching support from participating landowners (the Oregon County Fair organization and the City of Veneta) and the University of Oregon, the Oregon Country Fair/City of Veneta Geoarchaeological Project was launched “to develop an understanding of the relationship between areas of prehistoric cultural activity (archaeological sites) and geomorphological features and processes within a selected area of the Long Tom River Basin” (Connolly and McDowell 1987). The results of this supplemental project, initially reported in two unpublished masters theses and a summary document to the granting agency (Freidel 1989; Freidel et al. 1989; Peterson 1989), are reported here in Chapter 5, by Dorothy Freidel. Freidel reports on a stratigraphic record that adds important precision and context to McDowell’s initial site-specific work, and which is supported by a series of calibrated radiocarbon ages to 11,000 years ago. Most archaeological work in the Willamette Valley undertaken prior to the Long Tom and Chalker site excavations was focused on midden “mounds,” found along the Willamette’s primary tributaries (eg. Collins 1951; Cordell 1975; Davis 1978; Laughlin 1941, 1943; Miller 1975; Murdy and Wentz 1975; Toepel 1985; Woodward et al. 1975). These sites experienced repeated occupations through several millennia, and were the focus of excavations for oven pits, burials, and other human disturbances. These activities resulted in the mixing of cultural deposits to a significant degree. Further, few Willamette Valley sites had produced significant information on the period prior to 3500 years ago. This situation contrasts with sites in the Noti-Veneta highway corridor, and subsequent corollary studies in the project vicinity, which contain a buried and stratified archaeological record, substantial Middle Holocene components, and solid evidence for a Terminal Pleistocene/Early Holocene cultural presence (Peterson 1989; Connolly 1994). The contextual studies outlined above (and detailed in Chapters 4 and 5) provided an unprecedented opportunity to examine chronologically discrete archaeological assemblages throughout the time of human presence in the valley. Pettigrew’s (1980:77) observation that Willamette Valley archaeology was in its infancy in the early 1980s is reflected in the fundamental level of discussions regarding how to organize the valley’s archaeological record. White’s (1975) pioneering subsistence-settlement model attempted to classify sites throughout the valley based on environmental associations, but essentially viewed the homelands of the Kalapuya language family as a single analytic unit. Subsequent researchers, relying more heavily on the ethnographic record, began to examine archaeological data in the context of local sub-basins, study units more closely compatible with historic social divisions corresponding to language or dialectical units (Beckham et al. 1981:142-149; Connolly 1983). Connolly (1983) found that site patterning within different sub-basins differed significantly in response to local patterns of topography and vegetation. Cheatham’s (1988) analysis of site distributions in the Long Tom River basin (reported after the completion of fieldwork at the Chalker and Long Tom sites) suggests the presence of multiple localized village clusters, a pattern since observed by Ellis (1996) for other areas of the Willamette Valley. Cheatham suggests a pattern, particularly for the late precontact period, of localized village groups maintaining relatively well defined and constrained catchments. These works provide a far more robust archaeological context for assessing the Noti-Veneta project results than we could have imagined at the outset of our fieldwork.

The Long Tom and Chalker Sites 4
Testing at the Long Tom and Chalker sites revealed the presence of fire-cracked rock features. Similar features in the Willamette Valley had been identified as camas-baking ovens, but no camas was found during initial testing. Based on the absence of camas remains at the few middle Holocene sites investigated in the valley, several researchers had suggested that a shift to a relatively drier mid-Holocene climatic regime may have encouraged a shift away from this historic staple (Pettigrew 1980:77; Beckham et al. 1981:140-141; Cheatham 1984:115, 119). Botanical remains recovered from these features during data recovery, reported in Chapter 10, included charred camas, and confirmed their use as camas processing features. Sentiment on the use of camas has shifted 180 degrees from the time of our initial fieldwork, and in part because of it. Thoms (1989:307-308), citing this Long Tom data and Cheatham’s (1988) Fern Ridge findings, points to the upper Willamette Valley as providing evidence for “the early and regular use of plant foods in general, and camas in particular,” followed by the intensification of camas and active management of camas fields “as early as 4000 years ago in the Willamette Valley” (Thoms 1989:461; cf. Burtchard 1988). Resource “intensification,” or the husbanding, management, and processing of resources to enhance their reliability and productivity, is an issue of considerable importance to understanding the development and functioning of complex societies of the Pacific Northwest (Ames and Marshall 1981; Ames 1994). Discussions of this issue in the Willamette Valley has focused particularly on camas (Burtchard 1988; Thoms 1989; Roulette 1993; Bowden 1998); the Chalker and Long Tom site data have contributed significantly to this discussion. Thoms (1989:465) observes that “the dates from throughout the Pacific Northwest suggest that the development of community semisedentism and intensification of many different food resources occurred between about 5,500 and 4,000 years ago. In the Willamette and Calispell valleys, camas-related radiocarbon dates indicative of bulk processing, and hence sedentism, are as old as the dates for the development of community sedentism in salmon-rich places.” While figuring prominently in these theoretical discussions, the evidence from the Chalker and Long Tom sites has not been fully reported prior to this volume.

Chapter 2
Natural Environment
Brian L. O’Neill and Thomas J. Connolly The Noti-Veneta project area is situated between the Coast and Cascade mountain ranges in the upper Willamette Valley of western Oregon (Figure 2.1) in sections 35 and 36, Township 17 South Range 6 West, Willamette Meridian. Elevation of the project area is approximately 120 m above mean sea level . The major topographic feature of the project is the Long Tom River, a tributary of the Willamette River. The name “Long Tom” is apparently anglicized from a Native designation given variously as Sam Tomeleaf, Lamitambuff, Longtabuff, and Lumtumbuff, by such early western Oregon travelers as John Work, David Douglas, and Charles Wilkes (Scott 1923:264; McArthur 1992:519). The present environment of the project area has been characterized as
. . . a transition zone between the heavily timbered mountainous Coast Range and the predominantly agricultural Willamette Valley. Existing habitat conditions are largely the result of land use which has been strongly influenced by topography and the resultant capability of the land to endure cultivation. The controlling topographic features are the valley of the Long Tom River and its tributaries . . . and the steep sided uplands which separate these tributaries. Steep slopes restricting cultivation are most abundant to the west while bottom land and waterlogged soils are most abundant in the east.
Slopes and uplands are predominantly forest lands in active timber production, hill pasture, or both. A portion of the valley bottom lands are cultivated. Some that are generally too wet for cultivation are in riparian woodlands. Wetlands of small to moderate size occur frequently in the floodplain; these range in floral cover from deciduous swamp, shallow seasonal marsh which may or may not be used for grazing, to permanent pond (Highway Division 1982:34).
Geology and Raw Material Sources The Long Tom River drains the eastern slopes of the Coast Range, a north-south trending mountain chain that, within Oregon, extends from the Columbia River, on the north, to the Klamath Mountains near the Middle Fork Coquille River in the southwestern portion of the state. The Coast Range mountains are primarily composed of Eocene age (40 to 50 million years ago) marine sedimentary rocks, though volcanic activity contributed pyroclastic and igneous rocks to the landscape (Baldwin 1981). The latter occur as sills and dikes. Upon reaching the main Willamette Valley the Long Tom River turns north to parallel the course of the Willamette River for approximately 40 km before breaching the Willamette's levee and emptying into it. The Willamette Valley is an alluvial plain built upon a structural depression. The broad plain, which measures 30 to 50 kilometers in places, is broken by low basalt hills and, in the southern valley, by prominent basaltic buttes. Lithic materials of both sedimentary and igneous origin are found in archaeological sites in the area, and sources of these materials are found nearby. Cryptocrystalline silicates, which include chert, chalcendony, and jasper, are common rocks in this region. Nodules of obsidian occur in the bed of Inman Creek and other tributaries of the Long Tom River north and west of the project area (Skinner 1983:255-256, 303-317; Toepel 1985:27-29). This obsidian source was used by prehistoric peoples living in the area, as tools and waste flakes of this material have been identified by x-ray fluorescence (Cheatham 1984; Helzer 1997). Inman Creek obsidian is apparently a secondary source. The primary source of this material is located in the Western Cascades along Salt Creek, a tributary of the Middle Fork Willamette River (Skinner and Winkler 1991, 1994).

The Long Tom and Chalker Sites 6
Figure 2.1. Setting of the Noti-Veneta Project in the Long Tom River drainage along the western margin of the
Willamette Valley in northwestern Oregon (Landforms of the Northwestern States, 3rd edition, Erwin Raisz, 1965).

7 Chapter 2 – Natural Environment
Fire-altered sandstone and basalt cobbles are commonly found in Willamette Valley archaeological deposits and thought to have been employed as the heating element in earth ovens used to bake camas bulbs. In the project vicinity, the valley floor is composed of Pleistocene- and Holocene-age alluvium consisting of sand, gravel, and clay. Beyond the valley floor, sandstone is readily available as part of the Tyee Formation which forms the uplands to the north and south of the Long Tom River (Frank 1973: Plate 1). Basalt is also found nearby, capping some of the low hills south of the river (Vokes et al. 1951).
Hydrology and Topography The project area lies in the 526 square mile Long Tom Sub-basin, one of four principal sub-basins of the upper Willamette River Basin. The Long Tom is typical of tributary streams to the west of the Willamette River, with summer stream flows generally low and warm (Hutchison et al. 1966:27). During other times of the year however, the water table may be quite high, as discovered during archaeological field work conducted during late spring. Before modern efforts to drain the low lying areas to promote cultivation, the Long Tom River was described as follows:
The Long Tom is a very sluggish stream. It meanders thoughout its course and is bordered by a low marshy area in which there are many or-bow [sic] lakes and old stream channels. The marshy area floods nearly every year during the flood season and for this reason much of the land has turned sour and becomes unsuitable for cultivation. (Zimmerman 1927:28).
The 1853 Government Land Office Map of the Noti-Veneta portion of the Long Tom River drainage (Webster 1854) shows marshy areas bordering the river and creeks. It also shows what may be a small lake north of the site locations (Figure 2.2). The major tributary streams of the Long Tom River include Noti, Poodle, Elk, Coyote, Amazon, Bear and Ferguson creeks. A portion of the Noti-Veneta highway realignment project (between stations 293 and 430) lies within the 50-year floodplain of the Long Tom River (Highway Division 1975:1). Using stream flow data collected by a recording gauge near Noti, at the west end of the project, the flood characteristics of the river have been described as follows:
Extreme floods normally occur in the months of December through January from intense rainfall augmented at times by runoff from snowmelt. Approximately 45% of the annual rainfall occurs during these winter months (Highway Division 1975:2).
The largest flood of record, and now considered to be a 50-year recurrence flood, occurred in December 1955. The Long Tom and Chalker archaeological sites both lie within the 50-year floodplain, as do other sites recorded during the testing phase of the project.. The Long Tom Sub-basin is characterized by a flat to moderate gradient with 95 per cent of the lands below 300 meters (985 feet) in elevation. The western portion of the project area is characterized as foothill and pediment with floodplain lying to the east. Low alluvial terraces occur in most of the area. Drill records from the Long Tom indicate that alluviation has been a major geomorphic process, with accumulations of as much as 200 to 300 feet of Plio-Pleistocene deposits (Frank 1973; Baldwin 1981:60). The classification of the lower course of the Long Tom River as a "Yazoo-type stream," indicating that alluviation along the relatively flat gradient is a continuing process, should underscore the potential of this area to contain buried archaeological materials.
Present and Past Climates The Willamette Valley lies in the rain shadow of the Coast Range and, like other interior valleys of western Oregon, is relatively warm and dry during summer months, but is wet during winter. The average annual temperature recorded in Eugene is 11.2E C, ranging from an average January temperature of 3.7E C to an average July reading of 19.1E C. Average annual precipitation is 104 cm (41.6 inches) with an average annual snowfall of 18 cm (7.2 inches). Most of the precipitation occurs in late fall through early spring, the late spring and summer months being relatively dry (Franklin and Dyrness 1973:111).

The Long Tom and Chalker Sites 8

9 Chapter 2 – Natural Environment
Table 2.1. Summary and characteristics of the three general climatic episodes occurring during the Holocene
(Worona and Whitlock 1995). Episode Approximate Dates Climatic Regime Early Postglacial 16,000 to 12/10,000 Initially cool and moist, becoming increasingly warm and dry Middle Postglacial or Hypsithermal 12/10,000 to 6000 Accelerated warming and drying Late Postglacial 6000 to present Amelioration of thermal maximum; becoming cooler and wetter Pollen profiles, used as proxy data for the environmental conditions under which the flora of the time propagated, yield ample evidence of periods of climatic fluctuation during the past. Following the retreat of the continental glaciers some 15,000 years ago, a succession of climatic episodes occurred in the region (Hansen 1942, 1947, 1961; Heusser 1960; Worona and Whitlock 1995; Sea and Whitlock 1995). Three episodes have been identified to describe the broad changes that occurred during the past 15,000 years (Table 2.1). Recent investigations in the nearby central Coast Range illustrate these fluctuating climatic conditions. Paleoenvironmental researchers Marc Worona and Cathy Whitlock recovered an approximately 18 meter-long core from the edge of Little Lake, located approximately 20 km northwest of the Noti-Veneta project area (Worona and Whitlock 1995). Little Lake, at an elevation of 217 m, formed during the late Pleistocene behind a landslide which dammed Lake Creek. Analysis of this core included examination of pollen, plant macrofossils, and lithology. Radiometric data were obtained from 13 bulk sediment samples, and a layer of volcanic ash is attributed to the climactic eruption of Mount Mazama. The core spans approximately 42,000 years divided into five major but uneven climate periods marked by local changes in floristic composition. The last three cover the past 16,000 years of the late Pleistocene and Holocene. At the beginning of the Late-Glacial/Early Postglacial period at Little Lake (ca. 16,000 BP) spruce, pine, mountain hemlock and fir were present. Though temperatures continued to warm, as evidenced by the decline in cold-adapted species (e.g. spruce and mountain hemlock) and replacement with Douglas fir, western hemlock, and red alder and Sitka spruce by 12,000 BP, the climate remained cooler and wetter than at present (Worona and Whitlock 1995:874). Temperatures increased during the Early Holocene and a regime of summer drought developed which fostered a xerophytic floristic community in the Little Lake area characterized by Douglas fir, bracken fern, and oak. A wetter and cooler climate, along with the plants which thrive under these conditions, returned to the Little Lake region after approximately 6000 years ago. The significance of these climatic fluctuations lies in the observation that populations of plants and animals respond to ambient moisture and temperature. Their distribution and relative abundance in the region would have changed as the environmental factors which influence their success or failure changed. Toepel and Minor (1980) have incorporated this observation into their discussion of the change in subsistence pursuits that they have interpreted from the archaeological remains recovered from the 6,000 year old Flanagan site in the Long Tom Sub-basin (Pettigrew 1980:77; Beckham, Minor and Toepel 1981:136; Aikens 1984:88; Cheatham 1984:118-119).
Vegetation
The Willamette Valley is a vegetation mosaic that includes oak (Quercus) woodlands, coniferous forests, grasslands, chaparral, and riparian forest communities. This mosaic has apparently been created and maintained by centuries of human intervention and resource management activities. Savanna and open grasslands were maintained by the aboriginal population through the use of fire (Johannessen et al. 1971; Towle 1979, 1982, Boyd 1986). A reconstruction of the vegetation observed by early Euroamerican explorers and traders indicates that this practice extended as far south and west as the project area along the Long Tom River (Cheatham 1984:10). The river and streams were bordered by trees and a riparian vegetational community. With the introduction of fire control measures (Franklin and Dyrness 1973:110) and a substantially different set of exploitive strategies, including farming and stock raising (Ratcliff 1973; Towle 1982), distributional changes in the flora have occurred.

The Long Tom and Chalker Sites 10
Table 2.2. List of plants currently common to the Noti-Veneta Project area.
Trees
White oak Quercus garryana Madrone Arbutus menziesii Oregon ash Fraxinus latifolia Bigleaf maple Acer macrophyllum Vine maple Acer circinatum Douglas fir Pseudotsuga menziesii Grand fir Abies grandis Western yew Taxus brevifolia Willow Salix spp.
Shrubs Hawthorne Crataegus douglasii Hazelnut Corylus cornuta Oregon grape Berberis nervosa Trailing blackberry Rubus ursinus Thimbleberry Rubus parviflorus Black cap Rubus leucodermis Snowberry Symphoricarpos albus Serviceberry Amelanchier alnifolia Poison oak Rhus diversiloba Wild cherry Prunus emarginata Wild rose Rosa nutkana Wood rose Rosa gymnocarpa Cascara Rhamnus purshiana Mock orange Philadephus lewisii Nine-bark Physocarpus capitatus Spiraea Spiraea douglasii Wayfaring tree Viburnum ellipticum
Forbs Cat-tail Typha latifolia Wild carrot Daucus carota Dock Rumex spp. False dandelion Hypochoeris radicata Bedstraw Galium spp. Fire-weed Epilobium angustifolium Wild cucumber Marah oreganus Sedge Cyperaceae spp. Compass-plant Lactuca serriola Fairy bells Disporum hookeri Tansy ragwort Senecio jacobaea Camas Camassia quamash Licorice fern Polypodium volgare Bracken fern Pteridium aquilinum Sword fern Polystichum munitum A cadastral survey completed in September 1853 of the township within which the Noti-Veneta project is located (Figure 2.2) recorded “Fir and Oak Openings” on the level land close to the Long Tom River, while vegetation covering the hills north of the valley was noted as “Timber Fir & Oak. Undergrowth Hazel & Fern” (Webster 1854). The vegetation observed in the project area is consistent with that described by Franklin and Dyrness (1973:110-129) for the Willamette Valley. Cheatham's (1984:127) inventory of the flora in the vicinity of the Kirk Park archaeological sites along the Long Tom, approximately seven miles northeast of the project area, includes a variety of nuts and berries that were exploited by the original occupants of the area (Table 2.2). Camas is common in this region, occurring in pastures and low-lying wooded areas.
Fauna The project area is found within what Bailey (1936:19-21) refers to as the Humid Division of the Transition Life Zone, which includes forested settings on the west side of the Cascades. Among the characteristic animals inhabiting this zone are: elk (Cervus elaphus), black-tailed deer (Odocoileus hemionus), white-tailed deer (Odocoileus virginianus), brush rabbit (Sylvilagus bachmani), Western gray squirrel (Sciurus griseus), Douglas's squirrel (Tamiasciurus douglasii douglasii), Townsend's chipmunk (Tamias townsendii), flying squirrel (Glaucomys sabrinus), dusky-footed wood rat (Neotoma fuscipes), deer mouse (Peromyscus maniculatus), Townsend's vole (Microtus townsendii), mountain beaver (Aplodontia rufa), Camas pocket gopher (Thomomys bulbivorus), and bobcat (Lynx rufus). According to Lauman et al. (1972), other important terrestrial fauna in the Willamette Basin include black bear (Ursus americanus) and mountain lion (Felis concolor). Grizzly bear (Ursus klamathensis) was apparently once common in western Oregon and the Willamette drainage, but are no longer found there (Bailey 1937:323-328).

11 Chapter 2 – Natural Environment
Resident bird populations of the Humid Division of the Transition Zone include Blue grouse (Dendragapus obscurus), Ruffed grouse (Bonasa umbellus), Band-tailed pigeon (Columba fasciata), Northern pygmy owl (Glaucidium gnoma), pileated woodpecker (Dryocopus pileatus), Vaux's swift (Chaetura vauxi), Steller's jay (Cyanocitta stelleri), Townsend's warbler (Dendroica townsendi), winter wren (Troglodytes troglodytes), Brown creeper (Certhia americana), Black-capped chickadee (Penthestes atricapillus), Chestnut-backed chickadee (Parus rufescens), Bushtit (Psaltriparus minimus), Golden-crowned kinglet (Regulus satrapa), and Black-headed grosbeak (Pheucticus melanocephalus) (Bailey 1937:21; Csuti et al. 1997). During the fall and winter months a wide variety and large number of ducks and geese are present in the valley which is situated along the Pacific Flyway. Prior to drainage and flood control measures implemented during historic times waterfowl would have been more abundant. According to Hutchison et al. (1966:37-38), among the species observed are: mallard (Anas platyrhynchos), Blue-winged teal (Anas discors), shoveller (Anas clypeata), pintail (Anas acuta), wood duck (Aix sponsa), canvasback (Aytha valisineria), ruddy duck (Oxyura jamaicensis), Common merganser (Mergus merganser), and Canada goose (Branta canadensis). While there is some disagreement concerning the relative abundance of anadromous fish in the Willamette River and its tributaries (McKinney 1984), except for wild cutthroat trout, suitable spawning and rearing conditions for these fish were not present in the Long Tom drainage (Hutchison et al. 1966:27).
Despite unfavorable summer water conditions, wild cutthroat trout exist in moderate numbers in all streams maintaining perennial flows. Through evolution, these fish have adapted themselves to survive in the system (Hutchison et al. 1966:28).
Other native fish found in the drainage include suckers, squawfish, and redside shiners.

The Long Tom and Chalker Sites 12

Chapter 3
Cultural Setting
Brian L. O’Neill and Thomas J. Connolly Inhabiting the Long Tom River Sub-basin was the Long Tom or Chelamela band of Kalapuya Indians. Mentioned in the Dayton treaty of 1855 (Mackey 1974:136-141), by 1911 they apparently no longer existed as a distinct social entity and, except for extrapolation from other Kalapuya groups, “nothing is known of their customs” (Hodge 1911:242). Information presumably relevant to the Chelamela is derived from ethnographic texts obtained largely from other Kalapuya groups in the Willamette Valley (e.g. Jacobs et al. 1945). This chapter provides a brief review of the ethnographic and archaeological background relevant to the Noti-Veneta Project area, placing the investigations into their cultural context.
Ethnography of the Long Tom Area Ethnographic data for the Native American occupants of the upper Willamette Valley at the time of contact are sparse. Three factors are, in large part, responsible for this. First, this area was somewhat removed from the region where Euroamericans concentrated their initial trade and exploration activities. Second, the catastrophic effects of disease severely depleted the Indians' numbers and greatly disrupted the social organization of those who remained (Cook 1955; Taylor and Hoaglin 1962; Boyd 1975; Ratcliff 1973). Third, many natives that did survive were forcibly removed from their lands and resettled to reserves (O’Donnell 1991). All of this occurred prior to any systematic attempt to record their way of life. Ethnographic reconstruction of the lifeways of the native inhabitants of the upper Willamette Valley (e.g., Beckham 1977; Beckham, Minor and Toepel 1981; Jacobs et al. 1945) depends upon analogy and relies heavily upon information dealing with groups that occupied the lower Willamette Valley, primarily the Tualatin (e.g. Zenk 1976, 1990, 1994). Early explorer, trapper, trader, and settler accounts, as well as Indian Treaty and Agency records and later linguistic fieldwork, all help to provide a picture, however dim, of aboriginal life in this western Oregon region.
Language At the time of contact, the Willamette Valley was occupied by a least 13 Kalapuyan dialect groups. Kalapuyan is a language family of the Penutian phylum which also includes Sahaptian, Klamath-Modoc, Molala, Cayuse, Chinookan, Takelman, Alsea, Siuslawan, and Coosan (Voegelin and Voegelin 1964). From north to south in the valley, the named Kalapuyan groups were: the Tualatin, Pudding River, Yamhill, Luckiamute, Santiam, Marys River, Muddy Creek, Tsankupi, Long Tom, Mohawk, Chafan, Winefelly, and Yoncalla (Beckham, Minor and Toepel 1981:56). Their distribution coincided closely with the hydrological sub-basins of the valley (Figure 3.1). The Kalapuya dialect groups have been classified into three mutually unintelligible languages:
a) A northern group, including Tualatin and Yamhill dialects of the lower Willamette Valley.
b) Central Kalapuyan, in the middle and upper Willamette Valley “consisted of eight to a dozen or more dialects that varied only minutely from another. Each dialect was localized in a cluster of villages situated on some one creek or stream flowing into the Willamette or in some very small area near the Willamette. Each village cluster was identified by the natives themselves as a dialectic, economic, cultural, and political unit, and was given a name” (Jacobs et al. 1945:145). Santiam and Marys River are the best documented dialects in this group (Zenk 1990).

The Long Tom and Chalker Sites 14
c) Southern Kalapuya is represented by the southernmost occupants of the Willamette Valley, speakers of Yonkalla. These people also occupied the northern Umpqua River Basin (Jacobs et al. 1945:145-146, 154; Beckham, Minor and Toepel 1981:45).
Glottochronology, a lexicostatistical technique used to estimate the length of time necessary for the diverging of dialects and languages, suggests that “Kalapuyan speakers had been in the area for at least 1000 to 2000 years” (Beckham, Minor and Toepel 1981:46). Most archaeologists, however, suspect a much greater Kalapuyan time depth, perhaps including the greater part of the past 10,000 years.
Social Organization and Seasonal Round If it can be assumed that the members of the Long Tom band of the Kalapuya interacted with one another and with their environment in a fashion similar to those Kalapuyan groups farther to the north, then the description offered by Zenk (1976, 1990, 1994) and summarized by Beckham, Minor and Toepel (1981:59-81) provides a fair representation of the lifeways of this more southerly people. Kalapuya bands, at the basic organizational level, arranged themselves into autonomous winter villages. The larger dialect group did not reflect a supra-village political organization, but Zenk (1976) argues that there was a group identity and recognized rights of access to certain resources that did not extend to members of other dialect groups. While it is true that “head chiefs” appear as spokesmen for ethnic groups in their dealings with Whites, this is interpreted as an anomaly due to the insistence on the part of Euroamericans to treat only with representatives of a group regardless of its actual sociopolitical structure. Zenk suggests that there may have been an economic basis that bound the local winter groups together.
The Kalapuyan subsistence base seems to have been diverse, requiring access to a variety of riverine and upland and lowland habitats. Thus, winter-village groups were perhaps relatively small, with each necessarily having access to a comparatively large territory. Therefore, the loose organization of Kalapuyan local groups into larger dialectal-ethnic units (the specific organizational structure of which is, of course, unknown) could have had an adaptational significance: such a form of organization would have provided a territory large and diverse enough to offer each local group sufficient access to an adequate range of subsistence resources, but at the same time it would have kept population suitably dispersed by preserving the separate existence of small local groups (Zenk 1976:17-18).
The winter villages were occupied by a group of people who coalesced each winter, reckoned their descent patrilineally, brought in wives from outside the village, and correspondingly practiced a post-marital patri- or virilocal residence pattern. Individual status was achieved through the acquisition of wealth but did not become the basis of a system of social stratification. In part, this seems to be due to the vagaries of fortune; wealth could be won or lost with equal speed (Beckham Minor and Toepel 1981:62). The only substantial status distinction among the Kalapuyawas that between freemen and slaves, though it would appear that those Kalapuyan groups occupying the upper Willamette Valley more often were made slaves than took them.
Structures The Kalapuya practiced a biseasonal round, one dictated by the location and availability of resources during the dry and wet seasons. The colder, wetter winter months, when vegetal resources were scarce, was the time when the winter villages were fully occupied. The substantial, multi-family, semi-subterranean structures were sufficiently sound to ward off the elements. Using information gathered in 1877 by Albert Gatschet, a linguist/ethnographer employed by the U.S. Government, Zenk offers the following description of the dwellings of the Tualatin:
Winter houses were 40 to 50 feet long, with two to four or five families in one house; each individual family was partitioned off; there were two or three three-foot-high doors per house; there was a central fire pit and smokehole; planks, with excavated leg-room were provided for sitting; there were storage scaffolds; tule mats were used as mattresses; beds were raised, being about three feet high (there is also one interesting note to the effect that “bedsteads” were made of

15 Chapter 3 – Cultural Setting
planks, “painted with fancy ornaments,” inside of which nets were stretched as mattresses). Houses might be joined together in long house rows (e.g., 100 feet long). (Zenk 1976:141). William Hartless, a member of the Marys River band of the Kalapuya, provided a sketch of the lifeways of this people for the Bureau of American Ethnology (Mackey 1974:31-46). At the time Hartless was recording these “reminiscences” (1913), he was said to have been 70 years old. The brief description of the winter houses occupied by this more southern group indicates at least one substantial difference in construction technique. The southern winter house was apparently not semi-subterranean. Its lower walls were formed by banking earth against a superstructure of limbs and grass. Winter houses: Made of bark, grass and dirt. Forked sticks placed into ground. Cross-pieces tied on them twist grass. This serves as wall. Dirt reinforces the grass about 2 feet from ground. Roof made of bark inclined somewhat. Roof flat. Bark upheld by means of sticks. Just like a shed. Door consists of a mat of rushes. Could be raised from bottom or else shoved aside. Door rather small a man had to stoop to enter. Fireplaces right in center. Not dug out. Floor sanded. Smoke-hole a hole in bark. Beds along wall. Mats tulu-grass [sic; tule?]. No stools. Houses some 60 feet long as many as ten families partitioned off. Door usually faced river. Meat, etc. kept in baskets, sacks tied to rafters (Hartless, in Mackey 1974:42).
Sweathouses as large as approximately 16 feet in diameter, constructed of bent hazel sticks covered with fir boughs and dirt, and used for purification purposes, were situated near the villages as well as near the temporary camps. The heat for these was provided by heated stones (Beckham, Minor and Toepel 1981:70; Hartless, in Mackey 1974:42). With the appearance of spring and the first camas shoots, the winter village began to be abandoned by small groups intent on exploiting the bountiful vegetal resources of the area. “Six or more months of the year” were spent “in temporary open camps” by the Tualatin, though the “extent and frequency of harvest-season movement is largely undocumented” (Zenk 1976:43). Within these camps the shelters, if the weather required any, consisted of windbreaks of limbs and grass. From the temporary camps a wide variety of foods were collected.
Figure 3.1. Distribution of the Kalapuyan Indian groups in the Willamette Valley, with the territory of the Chelamela (Long
Tom) indicated by shading (after Toepel 1984).

The Long Tom and Chalker Sites 16
Plant and Animal Resources
One of the most important plant resources for the aboriginal inhabitants of the upper Willamette Valley was camas (Camassia spp.). This bulb commonly occurs in wet meadows and was harvested by women using digging sticks with a “crooked deer or elk antler cross-piece . . . affixed to the upper end of the stick and held against the belly during the digging operation” (Zenk 1976:54). Those bulbs collected in early spring were prepared for immediate consumption by boiling. As the harvesting season progressed, from June through October or later, large quantities of camas bulbs were roasted or baked in pit ovens. Camas ovens “were three to four feet wide and one to one-and-a-half feet deep” and “numbers of these pits might be dug on a particular occasion” (Zenk 1976:54-55). The bottom of the pits were lined with heated rocks upon which were alternately laid leaves or grass, camas, more leaves or grass, and the whole sealed with a layer of dirt. After their removal from the ovens, having baked anywhere from 24 hours to “four or five days” (Zenk 1976:55), the bulbs were dried in the sun, then some were pounded or pressed into cakes “about two inches thick and three to six inches in diameter” (Zenk 1976:54). Bulbs processed in this manner were saved for winter use or as a trade commodity. James Clyman witnessed the harvesting and processing of camas while camped near the Luckiamute River in May of 1845.
The Indians our neighbors ware out early digging roots this operation is performed by sinking a strong hard stick in the ground near the roots to be dug then taking pry on the outer extremity of the stick a portion of earth containing frorm 2 to six roots is taken up the roots being the size of a small onion and much resembling the onion in appearance They are then washed and clensed a hole of suitable size is dug in the earth filled with wood and stones after the earth and stones become well heated the fire is taken off and a Layer of green grass laid over the roots then a thin layer of earth over the whole and a fire outside of all which is kept up some 24 hours when it is allowed to cool down and the roots ready for use or for drying and putting away for future use when dry they keep for months or years [spelling, spacing, and punctuation as in the original] (Clyman 1960:153)
Tarweed (Madia spp. esp. M. sativa), commonly found on the dry bench lands at the valley edges, is another plant that was used by the Indians. The harvesting and processing of tarweed has been fairly well described in the western Oregon ethno-historic record (Applegate 1930:178-179; Riddle 1920:45-46; Sapir 1907). Harvested in August, the areas in which it was found were first burned off. The flames served several purposes; they removed the sticky exudate from the stems of the plants, and the pods in which the seeds are found were cracked open, making the seeds more easily harvested. The annual burning also reduced competing vegetation, and promoted the growth of even-age stands of this fire-dependent staple. According to Zenk (1976:59), Riddle's description of the harvesting of tarweed in the Cow Creek area of the Umpqua Basin by the Takelma closely parallels the less specific descriptions available of this practice in the Willamette Valley.
During the summer months the squaws would gather various kinds of seeds of which the tar weed seed was the most prized. The tar weed was a plant about thirty inches high and was very abundant on the bench lands of the valley, and was a great nuisance at maturity. It would be covered with globules of clear tarry substance that would coat the head and legs of stock as if they had been coated with tar. When the seeds were ripe the country was burned off. This left the plant standing with the tar burned off and the seeds left in the pods. Immediately after the fire there would be an army of squaws armed with an implement made of twigs shaped like a tennis racket [and] with their basket swung in front they would beat the seeds from the pods into the basket. This seed gathering would only last a few days and every squaw in the tribe seemed to be doing her level best to make all the noise she could, beating her racket against the top of her basket. All seeds were ground into meal with a mortar and pestle. The mortar was formed by forming a round hollow in the face of flat boulders, over which was placed a basket with a hole in the bottom to fit the depression in the rock, forming a kind of hopper to hold the seeds, then with a stone fashioned about two inches in diameter at [the] lower end and tapering to the other end to a size easily grasped with the hand the operator would sit upon the ground with the mortar between her knees and would pound the seeds, using the pestle which was usually about ten inches long, and weighing five or six pounds. . . (Riddle 1920:45-46).
17 Chapter 3 – Cultural Setting
Among the Tualatin of the lower Willamette Valley, tarweed gathering areas were owned by winter village groups. These areas may be sub-divided, the wealthier men controlling access to their individual plots which could yield as much as 10-20 bushels of seeds (Zenk 1976:58). Preserving tarweed was accomplished by parching the seeds on a board of ash-timber by mixing them with hot coals. As a food, ground tarweed seeds were apparently mixed with “mashed cooked camas and hazelnuts” (Zenk 1976:59). It is suspected that acorns (Quercus garryana) were used more extensively by aboriginal Kalapuyans than the ethnographic data suggest (Beckham, Minor and Toepel 1981:68). Apparently, this element of the diet declined in use after the removal of the native population to the reservations (Zenk 1976:60). Collected in October, acorns required processing to remove the bitter-tasting tannin from the flesh of the nut. This was accomplished by either of two methods. The first involved burying husked acorns in “blue clay” to be uncovered for use during the winter. The second was a water-leaching technique whereby the pulverized acorn meat was soaked in water. The processed acorn meal was sometimes pounded together with deer meat to be “eaten as a sort of hash” (Zenk 1976:61). Other vegetal resources collected by the Kalapuya for immediate consumption, as well as for storage, included a variety of berries--strawberries, blackberries, salal berries, huckleberries, serviceberries--hazelnuts, lupine, cattail, skunk cabbage, and bracken fern (Beckham, Minor and Toepel 1981:68). The techniques employed by the Kalapuya to hunt and trap the animals found in their territory have been described in some detail (Zenk 1976:63-68). Included among the methods used for taking such large animals as elk and deer were: a deer's head disguise used for a close approach, noose snares, pitfalls, and communal drives. Arrows tipped with points of stone could be propelled with sufficient force that “arrows often went pretty near through an elk” (Zenk 1976:65). Small game animals were also hunted. These included waterfowl, upland game birds, squirrels, rabbits, raccoons, and beavers. For immediate consumption, meat was either stone-boiled in a water-tight basket kettle with heated stones or roasted on spits or in ashes. Meat could also be preserved by fire-drying.
A stick scaffold was built, consisting of a framework measuring five to six feet high, three to four feet wide, and six to eight feet long. Cross-sticks were placed across the long horizontal sticks of the framework to form a platform. The women cut the deer meat into small strips, which were placed on the platform. Small fires to dry the meat were built under the scaffold and maintained, without interruption, for two days (Zenk 1976:69).
The rivers and streams also provided their share to the subsistence base of the people. Trout, suckers, eels, crawfish, and freshwater molluscs could be speared, trapped, or caught by hand (Zenk 1976:61-63; Beckham, Minor and Toepel 1981:69).
Trade and Population Estimates Indian trails, possibly used for trade purposes, have been identified (Collins 1951, Map 2). These radiate in all directions, connecting the Willamette Valley with the Columbia River to the north, the Pacific Ocean to the west, southwest Oregon and California to the south, and the Plateau and Great Basin regions of Oregon to the east. The Long Tom band undoubtedly participated in the regional trade network, the center of which was located at Willamette Falls. The items exchanged there were both subsistence and non-subsistence goods. Among the former would be deer meat and camas. The latter goods, which may have been transported some distance through the network, included dentalium, beads of bone and shell, nose and ear ornaments, pileated woodpecker scalps, otter skins, buckskins, and Euroamerican trade items such as glass beads, blankets, guns and powder (Zenk 1976:52). The precontact population of the Kalapuya is estimated to have been at least 10,000 (Boyd 1975:135), a figure that does not account for an estimated decline of one half to one-third due to smallpox epidemics in the 1780s (Zenk 1976:11; Boyd 1986:69). By the late 1830s, only 600 persons remained of this original population (Wilkes 1845 [4]:141). Introduced diseases, reaching epidemic proportions among the native inhabitants of the Willamette and lower Columbia river valleys (Cook 1955; Taylor and Hoaglin 1962; Boyd 1975), would seem to have swept away more than 95% of the Kalapuyan population in fewer than 70 years. Encroachment by farmsteading Euroamericans upon areas that had traditionally provided a substantial portion of the subsistence base for the Kalapuya, such as the camas fields, added further stress (Ratcliff 1973). With the removal of most survivors to the Grand Ronde Reservation in 1856 (O’Donnell 1991), the obliteration of the Native land use practices in the upper Willamette Valley was complete.
The Long Tom and Chalker Sites 18
Prehistory of the Noti-Veneta Project Area Chronology is one of the most basic questions facing archaeologists in their investigations of a region. Without an understanding of the time period in which a site was occupied, broader processual questions (e.g., settlement patterns, subsistence strategies, inter-regional patterns of trade, in situ cultural change, population replacement) cannot be adequately addressed. Archaeologists rely on temporally sensitive artifacts, those the morphology of which change over time, to construct cultural chronologies. Dates for the prehistoric periods within these chronologies are assigned by using radiocarbon assays of organic material found in association with these stylistically distinct artifacts. Seriation of collections is undertaken to determine their relative chronological position within the prehistoric sequence. In the Willamette Valley, projectile points represent the class of artifact found to be most useful in defining cultural periods. Several cultural chronologies for the Willamette Valley have been proposed (Collins 1951; Davis 1970a, 1970b, 1978; Davis et al. 1973; White 1974, 1975, 1979; Beckham, Minor and Toepel 1981; Toepel 1985b; Baxter 1986). The chronology offered by Beckham, Minor and Toepel (1981) and slightly revised by Toepel (1985b) is the current model against which data are being compared (e.g. Roulette et al. 1996; Lebow et al. 1996). This chronological scheme divides the valley into three provinces: the Cascade Foothills, the upper Willamette Valley, and the middle Willamette Valley (Figure 3.2). Within these areas cultural periods have been identified. Baxter (1986) has supplemented this with a corresponding chronology for the mountainous regions of the upper Valley. Figure 3.3 provides a comparative illustration of these periods, their Upper Willamette Valley cultural phases, and the environmental characteristics that accompanied each. The final chapter of the present report will address the value of this chronological scheme. The Willamette Valley cultural periods are distinguished one from the other primarily by the changes in the morphology of projectile points. The earliest (“Paleoindian”) period is associated with fluted points. The projectile point type characteristic of the Early Holocene is the leaf-shaped “Cascade” projectile point. Broad-necked, stemmed projectile points distinguish the Middle Holocene. The projectile points of the Late Holocene (<2000 yrs BP) are smaller, have narrow neck widths, and are thought to have been used to tip arrows rather than atlatl darts.
Earliest Occupants The evidence for early occupation of the Willamette Valley by Paleoindian people, though by no means conclusive, is suggestive. Fluted Clovis points have been recovered by amateurs as isolated finds in the valley (Allely 1975; Connolly 1994; Minor 1985). This artifact style is associated with the hunters who peopled North America prior to ca. 11,000 years. The bones of mammoths, one of the extinct species of Rancholabrean megafauna hunted during this period, have also been found in the valley (Cressman and Laughlin 1941; Cressman 1947). Unfortunately, the archaeological association in the Willamette Valley of these bones with tools of human manufacture “is possible, interesting, and stimulating . . . but is unproven” (Cressman 1947:178).
Early Holocene With a radiocarbon age of 8650 cal BP to mark its initial occupation, Cascadia Cave represents one of the earliest well-documented occupational episodes in the Willamette Valley (Newman 1966). Located on the South Santiam River in the lower regions of the Cascade Mountains, the projectile points associated with the site are generally the leaf-shaped Cascade type. Also recovered from the site were larger side-notched points which may represent a period of occupation since 7000 BP. Considered to be almost contemporaneous is Baby Rockshelter, located near Oakridge on the Middle Fork of the Willamette River in the Cascade foothills (Olsen 1975). Although this site is not dated radiometrically, a number of artifacts were recovered beneath what was assumed to be Mazama ash leading researchers to assign a date of occupation earlier than ca. 7500 BP. Recent chemical analysis of ash samples (Skinner and Radosevich 1990, 1991) has confirmed the source as the Mt. Mazama eruption and has resolved questions raised by researchers in the region of a “Mazama mimic” tephra (cf. Baxter and Connolly 1985). Judging by the cultural deposits recovered from the Cascadia Cave excavations, Newman suggests that the people of this period participated in a “relatively simple hunting and gathering culture” (1966:27-28). While the data available to previous researches suggested a geographic distribution of Early Archaic sites limited to the Cascade foothills (Beckham, Minor and Toepel 1981), investigations on the valley floor indicate that

19 Chapter 3 – Cultural Setting
Figure 3.2. Upper Willamette Valley cultural chronology and corresponding geologic and climatic episodes (after
Toepel 1985).
Years Ago
Geologic Epoch
Climatic Sequence
Willamette Basin Cultural Periods
Upper Willamette Valley Phases
Historic Ethnographic (Kalpuya)
1000
2000
Late Holocene
Late Holocene
Hurd Phase
3000
4000
Late Post-Glacial
(cooler, moister)
Lingo Phase
5000
6000
Middle Holocene
Flanagan Phase
7000
Middle Holocene
8000
(cooler/moister)
Middle Post-Glacial - - - - - - - - - - - - - - -
(warm, dry)
9000
10000
Early Holocene
Early Holocene
11000
Late Pleistocene
Early Post-Glacial
(cool, moist)
PaleoIndian
the people of this period exploited a wider range of environments. For example, the radiocarbon age obtained from charred camas bulbs collected in situ from a large camas oven excavated at the Hannavan Creek site, along the Long Tom River, is 8500 cal BP (7750±90 BP; Cheatham 1984:117). The Ralston site, tested in 1983, is another example of an early dated site in the Long Tom Sub-basin. Eroding from fine-grained alluvial deposits in the bank of Spencer Creek, a tributary of the Long Tom River, were two features containing fire-cracked rock and charcoal. The radiocarbon age of charcoal from one of these is 7400 cal BP (6525±100; Cheatham 1988).

The Long Tom and Chalker Sites 20
It is perhaps significant that these two sites, both found in alluvial settings, point toward a site-discovery and site-interpretation technique that has been, for the most part, overlooked in investigations in the Willamette Valley. The geomorphological work of Balster and Parsons (1968), which figures prominently in Chapters 4 and 5 of this report, indicates that surfaces of Early Holocene age may be both buried and exposed within the valley. Cheatham's investigations (1984:105) incorporate these geomorphic observations and is perhaps the only work, so far, to explicitly use the stratigraphic information generated by Balster and Parsons. Furthermore, Cheatham's data seem to confirm the notion that buried sites of the Early Holocene are present in the valley floor and that their apparent scarcity is simply a product of natural taphonomic processes (e.g. Aikens 1984:106).
Middle Holocene The Cascade foothills continued to be occupied by hunters and gatherers during the middle Holocene. However, during this period there is demonstrable evidence of continuing adaptation to and utilization of the resources of the valley floor. Accounting for the presence of this valley-wide pattern of occupation, the Lingo Phase has been proposed (Beckham, Minor and Toepel 1981:167-169). The name for this phase is derived from the Lingo site, situated on the Long Tom River near Junction City (Cordell 1975). Characteristic of this period and phase are the presence of (a) broad-stemmed projectile points that have been interpreted as the tips of atlatl darts and (b) mortars and pestles which indicate "the increased importance of vegetal resources in the subsistence of the aboriginal inhabitants" (Minor, Beckham and Toepel 1982:24). The charred remains of two of these important plant resources have been recovered from excavations: acorns from Luckiamute Hearth are associated with a radiocarbon age of 5970 cal BP (5250±270 BP; Reckendorf and Parsons 1966) and camas bulbs from the Flanagan site with a radiocarbon age of 3460 cal BP (3230±150 BP; Toepel and Minor 1980:20). A possible living floor of a domestic structure, dating to ca. 2900 cal BP (2800±110 BP and 2820±230 BP), was excavated at the Hurd Site (White 1975:148-151). This, the only tentative evidence so far of a habitation structure in the Willamette Valley during this period of occupation, was the remains of an elliptical structure measuring 7.5 x 5.4 m within which was a central fire hearth. The Hurd Site is located on an alluvial terrace near the community of Coburg.
Late Holocene The late Holocene of the upper Willamette Valley has been designated the Hurd Phase (Beckham, Minor and Toepel 1981:170-172). The beginning of the Hurd Phase is marked by a change in projectile point morphology, to predominantly smaller narrow-necked varieties (Pettigrew 1981), within the last 2000 years. The Hurd Phase continues to the Historic Period. The introduction of the bow and arrow complex to the area is assumed to account for the change in projectile point style. Based upon the size, number and distribution of sites of this age, “the Late Archaic was a time of considerable population growth” (Beckham, Minor and Toepel 1981:170). Furthermore, the differences in artifact assemblages distinguishing sites in the upper Willamette Valley from those in the middle valley to the north suggest the emergence and fixing of distinct group territories. Extra-territorial trade during the Hurd Phase is indicated by the exotic grave goods--Olivella beads and an abalone pendant--associated with a Lingo Site burial.
Archaeological Investigations in the Long Tom Subbasin Within a ten mile radius of the Noti-Veneta project area a total of 12 prehistoric archaeological sites had been recorded prior to the original pedestrian survey conducted in connection with the Highway 126 realignment project in May of 1980. Since that time, other surveys undertaken in the Long Tom basin have increased our awareness of site distribution. Over 100 sites were located by the Corps of Engineers' 1981 intensive survey of Fern Ridge Reservoir (Toepel 1985:10). In 1983 and 1984 an archaeological survey in the Long Tom River Sub-basin, supported by a SHPO survey grant, added another 18 sites to this inventory (Toepel 1985). The physiographic and vegetational setting in which sites are found may offer clues to the activities of their occupants. Sites have been found in the following physiographic settings: a) streamside, b) natural levee/sloughbank, c) floodplain, d) terrace, and e) hillside/foothills edge. The reconstruction of the natural vegetation of the Willamette Valley offered by Johannessen et al. (1971) provides zones into which sites may be placed. These include a) open prairie, b) prairie edge--which includes the interface between prairie and tree communities containing ash, fir, hemlock, maple, oak, and pine, and c) oak forest.

21 Chapter 3 – Cultural Setting
Toepel's preliminary analysis of the distribution of known sites in the Long Tom Sub-basin resulted in the following observations:
Sixty-two of the recorded 105 sites are associated with the prairie flatlands on the floor of the Long Tom Sub-basin. More than 27% of these prairie sites are known to contain grinding implements. An additional 32 sites are located on the interface of the prairie and the trees which edge the sub-basin floor (primarily oak, pine, fir, hemlock, and maple) and the Oregon white ash which closely follows the major water courses on the floodplain. It is assumed that camps located on such an interface would provide more protection from the elements and easier access to resources from two different vegetational zones. More than 40% of these prairie-edge sites appear to be grinding sites and very probably summer base camps or even villages. In all, more than 90% of the sites recorded to date are associated with the prairie floodplain. A vast majority of these sites are situated near marshes, streams or the main stem of the Long Tom River. The remaining 11 sites are located not far from the prairie, with nine associated with oak groves and two with oak groves near water sources (Toepel 1985:20-25, emphasis added).
She concludes her observations with the statement: "Temporally diagnostic projectile points indicate that much of the area was occupied during late Archaic times (within the last 2000 years), although some indications of earlier occupation were collected [during the survey] (Toepel 1985:31). Several prehistoric sites have been tested and excavated within the Long Tom River Sub-basin (Figure 3.3). The following is a brief description of the more important sites.
Lingo Site (35LA29) Portions of the Lingo Site, already mentioned as providing the name for the middle and upper Willamette Valley phase of the Middle Archaic, were excavated by the Kalapooya Chapter of the Oregon Archaeological Society (OAS) between 1962 and 1966. The University of Oregon (UO) conducted excavations at this open midden, which formed a nearly circular mound about 50 meters in diameter, during the summers of 1965 and 1966 (Cordell 1975:273-307). The artifact assemblage from this site includes projectile points, drills, gravers, scrapers, bifaces, and pestles. The features uncovered at this site included three basin-shaped fire pits within one of which were recovered the carbonized remains of three camas bulbs. Fourteen human burials, four excavated by UO and 10 by OAS, were encountered. Cordell describes these as "flexed burials in simple pits" (1975:304). Grave goods were associated with three of the burials. Burial 4, excavated by UO and identified as an adult female, had a pestle and beaver mandible in the pelvic region and a fragment of a shell pendant near the ribs. Burial C, excavated by OAS and identified as a possible adult female, was recovered with Olivella shell beads and an abalone pendant around the neck, clam shells near the elbows and behind the legs, and a projectile point at the rear of the skull in the fill of the pit. The poorly preserved burial E, also excavated by OAS, was found to have a broken pestle associated with the right femur. Charcoal from the site indicates occupation at 4700 cal BP (4130±110 BP) and ca. 2000 cal BP (2045±120 BP) (Cordell 1975:278). The older date comes from the bottom of the site where few tools were found. The projectile point inventory, with the presence of small narrow-necked varieties, provides evidence for utilization of this site during the following Hurd Phase of the Late Archaic.
Benjamin Sites (35LA41 and 35LA42) Excavations and subsequent analysis of artifacts recovered from the Benjamin sites (Miller 1975:309-347), two elevated middens located close to an old channel of the Long Tom River, reflect components of both the Lingo and Hurd Phases. The artifact assemblage from the Benjamin sites includes both chipped and ground stone tools: projectile points, scrapers, drills, pestles and mortars. The majority of the chipped stone tools were manufactured of obsidian. Miller distinguishes two types of features uncovered at the Benjamin sites. Fire hearths are described as

The Long Tom and Chalker Sites 22
. . rather shallow, ill-defined depressions filled with earth and charcoal that is usually, but not always, associated with a large number of fire-cracked rocks. The hearths were all badly disturbed either by the original inhabitants or by events occurring subsequent to occupation, and while the lack of well-defined boundaries makes their size difficult to measure precisely, they range between 50 to 70 centimeters in diameter and from several to 20 centimeters in depth (1975:314). The second type of feature is what Miller refers to as a roasting pit. These are . . . distinguished from [fire] hearths in that they possess a more definite form, tend to be much larger on the average, and have considerably greater depth. The [roasting] pits are roughly circular in form and were constructed
by scooping out relatively deep holes in the clay, to a depth ranging from 12 centimeters to over 64 centimeters. Their average depth was about 46 centimeters, measuring from the rim to the bottom of the pit. Diameters range from a low of 52 centimeters to over 165 centimeters.
The lining of the roasting pits consists of a very hard blue-grey fire-hardened clay from five to eight centimeters in thickness. On the interior surface of the lining, there is a much less cohesive, but compact, dry layer of bright reddish-orange oxidized clay, occurring as a result of repeated firing. All of the pits were filled with quantities of fire-cracked rocks, charcoal, and whole carbonized camas bulbs (1975:314).
Interestingly, the vertical distribution of these features is discontinuous, with “fire hearths” occurring stratigraphically above “roasting pits” (Miller 1975:314-321). This fact, along with the morphological differences between features and the associated radiocarbon ages (2340 cal BP for a 14C date of 2320±80 BP from a roasting pit,
Figure 3.3. Location of important Long Tom River drainage archaeological sites and their relationship to the Chalker and Long Tom sites.

23 Chapter 3 – Cultural Setting
and 1530 cal BP for a 14C date of 1640±130 BP from a fire hearth), leads Miller to conclude that there is a possibility of “at least two distinct cultural components being represented in each midden” (1975:321). Though the primary purpose of the Benjamin sites may have been to process camas,
. . . there is good evidence . . . that the efforts of the inhabitants were not confined entirely to this pursuit. Mortars and pestles, small round stones, and the relatively large number of projectile points and obsidian flakes present suggest that hunting, fishing, and tool-making activities were also performed. Since the ethnographic literature reports a division of labor in which women gathered camas while men hunted and fished, one can easily envision a situation where different kinds of activities, social and economic, occurred simultaneously (Miller 1975:345).
Kirk Park 1 (35LA565)
Kirk Park 1, interpreted as a summer base camp with camas processing, is an oval mound measuring 53 x 36 meters, and standing 1.2 meters above the surrounding floodplain (Cheatham 1988). The artifact assemblage included chipped and ground stone tools, a glass bead, and a clay pipe fragment. Four animal species were identifiable from the 22 pieces of bone recovered, and included deer, dog or coyote, raccoon, and turtle. Identifiable botanical remains included camas, acorn, hazelnut, and wild cherry. Of the 199 charred camas bulb fragments, 82% were recovered from the northernmost test pit, leading Cheatham to conclude that only the northern portion of the site had been dedicated to camas processing. A date of 540 cal BP (540±100) provides an age for one of the four features containing fire-cracked rock.
Kirk Park 2 (35LA568) Unlike Kirk Park 1, this site is relatively flat. Kirk Park 2 covers an area of 25 x 68 meters and is interpreted as an animal processing site. The artifact assemblage is similar to that recovered from Kirk Park 1 but includes a wedge, notched stone, and an antler flaker as well. The animal species identified from the poorly preserved 74 pieces of bone include deer, bear, mole, and rabbit. The macrobotanical remains include acorn and hazelnut fragments, cherry seeds, and eight charred camas bulb fragments, all of the last of which came from a large fire pit radiocarbon dated at less than 150 years BP. A second feature containing charcoal was dated to 475 cal BP (395±100).
Kirk Park 3 (35LA567) The low mound of Kirk Park 3 is 50 cm above the surrounding flood plain and covers an area 27 x 36 meters. Cheatham believes that this site represents a camas processing area and, with a total of 447 charred camas bulb fragments, contains more of this type of botanical remains than any of the other four sites at the Kirk Park Locality. Other botanical species are minimally represented by one fragment each of acorn and hazelnut. Absent from the artifact assemblage are drills, spokeshaves, stone bowls, and pestles. Three radiocarbon dates were obtained from two of the six features. The older dates of 3040 and 2850 cal BP (2910±60 and 2760±90) are from a fire-cracked rock feature from which 182 camas bulbs were recovered. An age of 1070 cal BP (1180±100) was from another fire-cracked rock feature.
Kirk Park 4 (35LA566) Kirk Park 4, which Cheatham interprets as a summer base camp, is an oval mound 1.5 meters in height covering an area of 59 x 40 meters. The artifact assemblage is similar to that of Kirk Park 1 with chipped and ground stone tools. Although 321 pieces of bone were recovered, only six of these were identifiable due to the poor preservation conditions. The faunal species represented by these include deer, beaver, and muskrat. The depth and horizontal distribution of the charred botanical remains indicate that the processing and use of camas, acorn and hazelnut was not limited in time or space at this site. Three radiocarbon dates from Kirk Park 4 indicate that the site was occupied for over 1800 years beginning approximately 3500 years ago.

The Long Tom and Chalker Sites 24
Perkins Peninsula Locality (35LA282)
The Perkins Peninsula Locality (Cheatham 1984:65-89) includes not only the Perkins Peninsula Site, but also a set of six discrete archaeological sites now on the floor of Fern Ridge Reservoir. These sites were tested in 1983 and 1984 by Cheatham and a field crew from the University of Oregon. Previously visited in 1949 by Joel Shiner (Cheatham 1984:27), subsequent test excavations conducted by Laughlin and Collins at 35LA282 in 1950 suggested that human remains and a number of features were present at this site.
[A] day of excavation was spent in excavating a midden deposit which was exposed for 30 meters along the face of Perkin's Peninsula . . . . Although only one day was spent in excavating, the returns were somewhat satisfying. There were only sixteen artifacts, one human parietal bone and numberous [sic] flakes, firecracked rocks, and animal bones recovered. A number of fire lenses were noted along the face of the embankment but they did not appear to be at any consistent vertical or horizontal order (Collins 1951:62).
Cheatham's excavation of the Perkins Peninsula Site, a mound covering 9430 square meters with cultural deposits of a meter thick, yielded an assemblage of chipped and ground stone tools, and clay pipe fragments (Cheatham 1984:65). The features uncovered at this site included circular areas of fired earth, with associated fire-cracked rocks, and a cow burial. No human skeletal remains were observed or collected. A variety of fragmented and whole macrobotanical remains were recovered, representing acorns, camas bulbs, hazelnuts, and cherry seeds. Cheatham notes that, "The specimens are located throughout the deposits from the surface to 80 cm, suggesting a long and continuous use of these resources" (1984:71). A Hurd Phase occupation is suggested from the two radiocarbon assays, which provide ages of 1160 and 970 cal BP (1220±80 and 1085±100). The six sites in the Perkins Park drawdown zone (i.e., the zone on the reservoir floor between high and low water levels) were identified and delimited through (a) an examination of aerial photographs, (b) the locating and shovel testing of black midden deposits, (c) surface collection of artifacts and the plotting of their horizontal distribution, and (d) a systematic testing of the phosphate levels throughout the locality. All of the sites are situated contiguous to an abandoned creek which skirted the edge of Perkins Peninsula. While a number of artifacts, both chipped and ground stone, were recovered from the surface collecting activities and subsurface investigations, only two hearths or ovens were excavated. No radiocarbon dates were obtained from these sites.
Hannavan Creek Locality (35LA647) The present setting of the Hannavan Creek Locality in the Fern Ridge Reservoir is similar to that of the sites described above in the Perkins Park drawdown zone (Cheatham 1984:91-103). These too are situated adjacent to a stream channel, Hannavan Creek, within the boundaries of the drawdown zone. Within this area five discrete aboriginal sites have been discerned from a 700 meter-long continuous scatter of cultural material found in an 80 meter-wide swath along the bank of Hannavan Creek. Ground stone and flaked lithic items were recovered from these sites, and eroded features of fire-cracked rocks were observed on the surface. Two radiocarbon dates from Area E of the Hannavan Creek Site, 8470 cal BP (7750±90) and 7620 cal BP (6830±100), were returned on charred camas bulbs recovered from a camas oven. Though these dates are not entirely consistent with one another, they provide solid evidence of an Early Holocene age for this feature. Cheatham's description of this site and the feature from which the date originates are presented below.
Area E is an oval site 138 x 35 meters across. it is located in the drawdown zone along both banks of one of the old meander channels of Hannavan Creek. Erosion has been apparently severe in this area; cultural deposits extend only to 40 cm below the surface. Seven surface features identified as fire hearths and camas ovens are visible on the surface. Prehistoric artifacts include 3 projectile points, 1 biface fragment, 30 scrapers, 1 drill, 1 graver, 1 spokeshave, 44 used flakes, 1 groundstone fragment, 3 choppers, 3 hammerstones, 1 anvil, 1 notched stone, and 30 waste flakes. All of the stone tools were recovered on the surface of the site, including the only broad-necked projectile point recovered from 35LA647 (Cheatham 1984:100).
Feature 3E, visible on the surface, is a concentration of about 200 pebble sized subangular rocks, spalls, bisque, and charcoal fragments. It is about 150 cm in diameter and 22 cm in depth. Three hundred fifty charred camas bulb fragments were recovered (Cheatham 1984:102).

25 Chapter 3 – Cultural Setting
The significance of these dates, like the date obtained at the Ralston Site, is that they strongly argue for the occupation and exploitation of valley floor resources during the Early Holocene. Furthermore, the gathering and processing of camas would appear to be a substantially older subsistence pursuit than had been originally thought.

The Long Tom and Chalker Sites 26

Chapter 4
Sediment Analysis Studies: Geomorphology and Soils of the Chalker and Long Tom Sites
Patricia F. McDowell
Introduction In this chapter, I provide an overview of the geomorphic setting and stratigraphy of the Long Tom and Chalker archaeological sites. Three major questions are addressed. What is the regional geomorphic setting of the Long Tom and Chalker sites? What is the local geomorphic context of the sites, and how does it relate to the geomorphic stratigraphy of the Willamette Valley established previously by Balster and Parsons (1968, 1969)? What is the history of floodplain development at these sites? This chapter is based on the results of previous (O'Neill 1987) and current archaeological studies, data obtained from topographic maps, air photos and soil maps, and a limited amount of field and laboratory work. Soil chemistry results are also presented and analyzed.
Figure 4.1. Regional map showing the setting of Noti-Veneta Project and drainage system (after Baldwin 1981).
����
����
����������
���������
��������
����� ��
���
�����
�������
����
���� �����
����
�����
��
�����
����
������
����
������
������� �����
�
� �
� �
���������
�����
������������

The Long Tom and Chalker Sites 28
Table 4.1. Soils of the project area.
Series Classification Profile Position and Drainage
Ingram Surface Chehalis silty clay loam Cumulic Ultic Haploxerol A/Bw/C floodplains, well-drained Cloquato silt loam Cumulic Ultic Haploxeroll A/C floodplains and bottomlands, well-drained McBee silty clay loam Cumulic Ultic Haploxeroll A/Bw/C floodplains, moderately well-drained Newberg loam Fluventic haploxeroll A/C floodplains and undulating bottomlands; Wapato silty clay loam Fluvaquentic Haplaquoll A/Bw/Cg depressions on flood plains; old filled channels; poorly drained
unknown intermediate terrace Noti loam Typic Humaquept A/Bw/C/IIC/ IIIC floodplains and drainageways on terraces, Linslaw loam Aquultic Haploxeralf A/Bt/IIC drainageways of terraces and alluvial fans;
Dolph surface Veneta loam Ultic Haploxeralf A/Bt/IIC old terraces, moderately well-drained Salkum silt loam Xeric Haplohumult A/B/Bt/IIBt/IIIC lower-lying old terraces; well-drained
Geomorphic Setting of the Sites
The Long Tom Valley in the vicinity of the Noti-Veneta Project is geomorphically interesting because it is part of an interconnected network of valleys (Figure 4.1), probably formed by stream piracy (Baldwin 1981). Former connections existed between Noti Creek (a tributary of the Long Tom) and Coyote Creek, between Poodle Creek and the Upper Long Tom River, and between Swamp Creek (a tributary of the Long Tom) and Bear Creek. The evidence for these former connections is alluvial valley segments, which are graded to the Long Tom Valley, but do not contain major stream channels. At some time in the past, for example, the upper drainage of Noti Creek flowed southeastward into Coyote Creek, but a tributary of the Long Tom at Noti cut its headwaters southward and captured this drainage. Similarly, the Long Tom probably flowed south through the valley of Poodle Creek, and the upper drainage of Bear Creek probably flowed through the valley of Swamp Creek to the Long Tom. The times at which these drainage adjustments occurred are not known, but they almost certainly pre-date human occupation at the Chalker and Long Tom sites. They are not directly significant to the geomorphology at these sites, but the resulting network of connected valleys may have made prehistoric travel though this part of the Coast Range easier. The immediate geomorphic setting of the sites is entirely alluvial, the product of lateral migration and deposition by the main channel of the Long Tom River. The sites are located adjacent to the Long Tom River, on a low alluvial terrace. This terrace, lying at 390 feet a.s.l., is the lowest extensive geomorphic surface along the Long Tom.
Geomorphic Surface and Soils in the Lower Long Tom River The pattern of soils on the floor of the Long Tom River Valley indicates that several geomorphic surfaces of different ages are present. Balster and Parsons (1968; Parsons, Balster and Ness 1970) related soil development to geomorphic surfaces of different ages in the main Willamette Valley. It is possible to infer correlations of geomorphic surfaces of the Willamette Valley with the Long Tom Valley, by comparing soil development. A schematic cross-section and a geomorphic map of the Long Tom River Valley, based on these inferred correlations, are shown in Figures 4.2 and 4.3. Soils of the Noti-Veneta Highway archaeological project area are summarized in Table 4.1.

29 Chapter 4 – Sediment Analysis Studies
Figure 4.2. Schematic cross-section of soils and geomorphic surfaces of the Long Tom River Valley in the Noti-Veneta Project area; cross-section (A-B) location is shown in Figure 4.3 below.
Figure 4.3. Soils-geomorphology map of the lower Long Tom River Valley, showing cross-section (A-B) location.
���
���
��
���
���
���
���
���
���� ���!"#��� ���$%��&�����'
(�� )*��+���",����$*����������'
-�����!���.������"/'"0�����1$��������'
-�����*��+���
"2� ������'
"3�#��$4��5��������'
0���.�����
� ���!
������6�7������7��
� #
����
)���8���������
� ���!"#��� ���$%��&�����'
(�� )*��+���",����$*����������'
0�����1$��������
-�����
*��+���
"3�#��$
4��5��
� �����'2� ��
����
0�����1$��������
� ���!"#��� ���$%��&�����'
(�� )
0���.�����4)��������
�����
��
���
-�����
-�����
,����
(�� )
�� �� �� ��
�� �� �� ��
�
#
�
� �
������
���������

The Long Tom and Chalker Sites 30
Three of the geomorphic surfaces defined by Balster and Parsons--Dolph, Winkle and Ingram--are significant in the Noti-Veneta study area. The Dolph surface is an old alluvial terrace or pediment which stands high above modern stream levels. The Dolph surface is not well dated, but it is probably more than 50,000 years old and may be 100,000 years old. At some time after construction of the Dolph surface, but before 40,000 years ago, the Willamette River incised below the Dolph surface, and several units of glaciofluvial and glaciolacustrine sediments were deposited in the Willamette Valley. (The Linn Formation, earliest of these post-Dolph deposits, is older than 40,000 BP; Balster and Parson 1969). Contemporaneous events in Coast Range drainages such as the Long Tom are not known. The Winkle and Ingram surfaces are archaeologically significant because buried, stratified sites may occur in these young deposits. The Winkle geomorphic surface, an alluvial terrace, started forming approximately at the time of the earliest known human occupation of the Willamette Valley region. Available radiocarbon dates for the Winkle surface place its development at about 12,000 to 5000 BP (Parsons, Balster and Ness 1970). At some time between about 5000 and 3000 BP, streams of the Willamette Valley system incised their channels, abandoning the Winkle surface as the active floodplain. They began to construct the slightly lower Ingram geomorphic surface, which continued to develop until approximately 500 BP or later. Today the Ingram surface is a high floodplain along the Long Tom River. Soil development and archaeological radiocarbon dates obtained in this study confirm that the modern high floodplain of the lower Long Tom River is the Ingram geomorphic surface. Eight of the nine archaeological sites examined in the Noti-Veneta Archaeological Project (O'Neill 1987) are located on this surface, on the McBee silty clay loam soil. This soil occurs in a wide band on both sides of the channel of the Long Tom River in sections 35 and 36, T17S (Patching 1987). Other soils on the Ingram surface in this area include Cloquato silt loam immediately to the west of 35LA439, and Newberg loam and Chehalis silty clay loam at the margins of the river channel just upstream from the sites. All of these soils are Haploxerolls with weakly developed B horizons, typical of the Ingram surface (Parsons, Balster and Ness 1970). Balster and Parsons (1968; Parsons, Balster and Ness 1970) originally conceived of the Ingram surface as a younger body of deposits inset into the Winkle and older geomorphic surfaces, but it was later recognized that Ingram-age sediment sometimes overlapped onto lower parts of the Winkle surface, a situation referred to as High Ingram geomorphic surface (Parsons and Herriman 1970). In this case, the surface soil (dating from the younger Ingram episode) is only moderately developed, but older deposits, possibly with a buried paleosol, occur deeper in the section. At the Long Tom Site, a radiocarbon age of ca. 9900 cal BP (8890+120 BP) on a cultural feature 163 cm below the surface indicates that Ingram-age alluvium overlies Winkle-age alluvium here. The High Ingram geomorphic surface in the lower Long Tom River Valley is dominated by the McBee soil series. A detailed soil profile description of McBee silty clay loam at the Long Tom Site is presented in Table 4.2. A geomorphic feature that is probably related to the Ingram surface is the elongated body of Wapato silty clay loam soil that occurs along the north margin of the Ingram geomorphic surface north of the Long Tom channel. Wapato silty clay loam is a poorly drained soil that occurs in depressions on floodplains (Patching 1987). This soil body is apparently slightly lower than the adjacent Ingram surface soils, and it is occupied by several small drainageways and the lower part of Indian Creek. The form and extent of this body of Wapato soil suggests that it is a former east-flowing channel of the Long Tom River. At some time in the past, the Long Tom shifted to its present more southerly position, abandoning this channel segment. it has been largely filled by subsequent alluviation. There is no direct evidence for the age of this feature, but the Wapato soil is comparable in its profile development to Ingram surface soils. The close proximity of several Middle Holocene-age sites to the present channel suggests that this channel has been active since 4500 BP or earlier. The abandoned northern channel, therefore, probably dates from the middle or early Holocene. Farther from the Long Tom channel is the Dolph geomorphic surface, occupied by Veneta loam and Salkum silt loam soils. This high terrace occurs along the north edge of the Long Tom Valley north of the sites and southeast of the sites at the town of Veneta. The Dolph geomorphic surface greatly predates the earliest known human occupation of the Willamette Valley region, and prehistoric sites on the Dolph surface are likely to occur only as surface or very shallow sites. Archaeological site 35LA766 occurs on the Dolph surface, on the Veneta silt loam soil. Noti loam and Linslaw loam occur along drainageways incised slightly below the level of the Dolph surface and on fans and drainageways just below the terrace escarpment. South of the Long Tom River, a body of Noti and Linslaw soils occurs between the Dolph surface on which the town of Veneta is located and the lower Ingram surface along the river channel. The Noti and Linslaw soils therefore occupy an intermediate stratigraphic and chronologic position between the lower Ingram surface along the Long Tom River and the higher Dolph surface at the margins of the valley floor. Their age and origin in the Long Tom Valley is not known, however. These soils may be temporally correlative to the soils and deposits of the Winkle geomorphic surface of the main Willamette Valley, or they may be older than the Winkle surface.

31 Chapter 4 – Sediment Analysis Studies
Table 4.2. Detailed description of section in Trench 124W, Long Tom site showing corresponding field strata
identified during archaeological investigations and the broader stratigraphic units identified by Freidel (Chapter 5) for the Veneta-Country Fair Project area.
Depth (cm)
Field Strata
Stratigraphic Units
(Freidel)
Description
0-23
A1 horizon; very dark brown (10YR 2/2 moist) silt loam; strong crumb structure; well-bioturbated, with 50% or more fecal pellets; friable; many medium and fine roots; clear, slightly wavy lower boundary
23-33 A2 horizon; very dark brown (10YR 2/3 moist) silt loam; strong, medium to fine subangular blocky structure; structure is porous, nearly crumb; well-bioturbated with 30-50% fecal pellets; friable; common medium and fine roots; clear, slightly wavy lower boundary
1
33-47
I
AB horizon; dark brown (10YR 3/3 moist) silt loam; moderate, medium to fine subangular blocky; porous, with some pores up to 2 mm diameter; well-bioturbated with 10-25% fecal pellets; friable; some krotovinas at this level and below; clear, slightly wavy lower boundary
47-66
II
B2t horizon; dark yellowish brown (10YR 3/4 moist) clay loam (with fine sand); strong, medium subangular blocky; very porous, with many fine and large (2 mm) pores; friable, but slightly firmer than above; some incipient cutans or mottles (slightly darker, more distinct patches on ped faces); common fine roots; clear wavy lower boundary
66-90
2
III
B31 horizon; dark yellowish brown (10YR 4/4 moist) loam (with clay and fine sand); moderate, medium to coarse subangular blocky; very porous with common fine and large pores; very few fecal pellets; friable, slightly firm; few incipient cutans or mottles, as above; common, medium to fine slightly paler patches (mottles?) on ped faces, giving a slightly mottled appearance; few fine roots; diffuse lower boundary
90-130 IIB32 horizon; dark yellowish brown (10YR 4/4 moist) sandy clay loam; coarse, medium to weak subangular blocky structure; friable, slightly firm; few fine and coarse pores; few fine roots; few fecal pellets; some bisque; clay content increases with depth in this horizon; diffuse lower boundary
130-170
3
IIC horizon; dark yellowish brown (10YR 4/4) sandy clay loam; weak, coarse subangular blocky structure; friable, slightly firm; few fine and coarse pores; very few roots; some bisque, charcoal; orange lenses, apparently burned areas, occur near bottom of this layer; burned areas are up to 20 cm across, contain charcoal
IV
170-350 V
augering from the bottom of the trench (170 cm) to this depth showed continuation of 130-170 cm layer, with clay content increasing to silty clay loam at 200-275 cm and clay at 340 cm; color becoming more gleyed (gray) and mottled (orange) with depth
In summary, three geomorphic surfaces of different ages are present in the study area: the late Holocene High Ingram surface on which most of the archaeological sites occur, an intermediate surface of unknown age characterized by Noti and Linslaw soils, and the high, old Dolph surface along the margins of the valley.
Geomorphic Stratigraphy and Sediments of the Archaeological Sites on the Ingram Surface
This section focuses on the sedimentary stratigraphy of deposits on the Ingram surface and on reconstruction of the geomorphic processes which formed this surface. First, the overall architecture of the Ingram surface is described, based on data from six archaeological sites that were tested between 1980 and 1987. Then,

The Long Tom and Chalker Sites 32
Table 4.3. Sediment size data and facies of samples from the Long Tom site.
Sample Texture Field Number % sand % silt % clay Stratum Facies
Long Tom 179W/55N LT-55N-1 16.4 59.6 24.0 1 vertical accretion 3 LT-55N-2 15.8 55.2 29.0 2 " LT-55N-3 14.6 53.9 31.5 2 " LT-55N-4 14.2 56.3 29.5 2 " LT-55N-5 28.9 49.1 22.0 3 vertical accretion 2 LT-55N-6 28.8 46.2 25.0 3 " LT-55N-7 60.3 28.7 11.0 4 lateral accretion 1 LT-55N-8 64.5 26.0 9.5 4 " LT-55N-9 58.7 32.3 9.0 4 "
Long Tom 179W/70N LT-70N-1 23.0 48.5 28.5 1 vertical accretion 3 LT-70N-2 21.4 55.6 23.0 1 " LT-70N-3 30.1 43.9 26.0 2 " LT-70N-4* LT-70N-5 45.3 37.7 17.0 3 vertical accretion 2 LT-70N-6 40.3 39.2 20.5 3 " LT-70N-7 28.8 57.2 14.0 3 " LT-70N-8 45.7 38.3 16.0 3 " LT-70N-9 30.6 44.9 24.5 3 " LT-70N-10 26.1 52.4 21.5 3 "
Long Tom East Block LT-EB-1 28.6 60.4 11.0 1 vertical accretion 3 LT-EB-2 39.1 38.4 22.5 2 " LT-EB-3 57.0 30.0 13.0 3 lateral accretion 1
Long Tom West Block LT-WB-1 21.4 51.6 27.0 1 vertical accretion 3 LT-WB-2 21.9 50.6 27.5 2 " LT-WB-3 24.9 48.6 26.5 3 vertical accretion 2 * No sediment analysis was done on samples at boundaries of stratigraphic units. deposits at the Long Tom and Chalker sites are described in detail. Finally, a tentative model of development of the floodplain is presented. Previous archaeological testing for the Noti-Veneta Highway Project has provided stratigraphic information from six sites (O'Neill 1987). These data consist of descriptions of strata recognized in the field by archaeological survey and testing crews, and there may be inconsistencies in textural and color designations among the crews. However, the data indicate that, in composite, a three-part textural sequence is present. The sequence consists of silt or silt loam at the top, clayey silt in the middle, and fine sand to fine sandy silt in the lower part. The complete sequence was observed in excavations only at the Humphrey (35LA760) and Long Tom (35LA439) sites. At other sites only the upper and middle strata were encountered, or the middle stratum was missing and the upper stratum overlaid the lower stratum.

33 Chapter 4 – Sediment Analysis Studies
Table 4.4. Sediment size data and facies of samples from the Chalker site.
Sample Texture Field Number % sand % silt % clay Stratum Facies
Chalker 14N/18W CH-14N-1 13.7 66.3 20.0 1 vertical accretion 3 CH-14N-2 7.2 74.8 18.0 2AU " CH-14N-3 8.5 68.0 23.5 2AU " CH-14N-4 35.2 46.3 18.5 2AU " CH-14N-5 18.5 62.0 19.5 2AU " CH-14N-6* CH-14N-7 30.2 53.8 16.0 2AL " CH-14N-8 24.1 43.4 32.5 2AL " CH-14N-9 21.6 46.9 31.5 2AL " CH-14N-10* CH-14N-11 25.2 46.8 28.0 2B " CH-14N-12 20.8 53.2 26.0 2B " * No sediment analysis was done on samples at boundaries of stratigraphic units. The upper silt zone, which was often divided into two strata based on pedogenic development (color and compaction), is 50-100 cm thick and has Late Holocene-age material associated with it. Where present, the middle clayey silt starts at about 50 cm below the surface and extends to 150 cm or more. Its clayier texture may be due to pedogenic translocation of clay to the soil B horizon, rather than to sedimentation processes different from those of the upper silt zone. Late and Middle Holocene-age material is found in this clayey silt zone. The lower fine sand or fine sandy silt zone was observed at three sites, 35LA439, 35LA440, and 35LA760, below a depth of 100 cm. In the detailed profile description from 35LA439 (Table 4.2), this lower zone begins at a depth of 90 cm. At other sites, this zone was not observed but may be present below the depths tested. At two sites, 35LA439 and 35LA440, there is a strong association of Middle Holocene-age material with the upper surface of this zone. An Early Holocene radiocarbon date occurs within the lower fine sandy zone at 35LA439. All three of the sedimentary zones described above are alluvial deposits of the Long Tom River. Particle size data (Tables 4.3 and 4.4) and stratigraphic relationships indicate that the upper silty and clayey silt zones are vertical accretion deposits, sediment deposited on the floodplain by overbank flood waters. Vertical accretion deposits may include natural levees, positive relief features along the outer edge of channel meander bends. The lower fine sand or fine sandy silt zone is probably lateral accretion deposits, deposited from higher energy flow within the channel banks. Lateral accretion deposits are laid down across the floodplain as the channel migrates laterally through time. These lower sandy deposits of the Long Tom River are, however, quite fine-textured relative to typical lateral accretion deposits. An alternative explanation is that they are vertical accretion deposits of an earlier, higher energy river regime. More sampling of modern sedimentary facies in the Long Tom system would help to understand the genesis of these deposits. A facies classification of the field strata at the Long Tom and Chalker sites is presented in Tables 4.3 and 4.4. Vertical accretion deposits are the extensive, silty sediments which make up most of the sequences studied. This facies includes subsurface silty clay field strata that are probably soil B horizons. The vertical accretion deposits at these sites are divided into two layers, vertical accretion 2 of a middle Holocene episode of deposition and vertical accretion 3 of a late Holocene episode of deposition. The sandier lateral accretion sediments of episode 1 occur at the bottom of several of the profiles. At the Long Tom site, vertical accretion 3 occurs as an extensive silty mantle which forms a natural levee at the south end of trench 179W, near the abandoned meander, and thins away from the natural levee. These deposits are underlain by vertical accretion deposits of episode 2, a silty layer of variable thickness with a concentration of Middle Archaic-age material at its upper boundary (field stratum 3). Near the south end of trench 179W, this layer is only about 20 cm thick,but it thickens to 140 cm at 70N. The sandier sediments of lateral accretion 1 underlie vertical accretion 2. The Chalker Site is located on a natural levee of an abandoned channel segment, and all samples analyzed are identified as vertical accretion 3. The lower sandy zone probably represents an alluvial episode (episode 1) of the Long Tom River that occurred in the Early Holocene. The floodplain surface of this early episode later was buried by silty vertical

The Long Tom and Chalker Sites 34
Table 4.5. Radiocarbon dates, sample depths, and calculated accretion rates.*
Site Depth Calculated vertical Number Years BP (cm below surface) accretion rate, mm/yr 35LA758 420± 60 102 0.243 35LA760 380±60 95 0.250 35LA420 450±50 40 0.089 650±50 70 0.108 720±80 50 0.069 990±60 70 0.071 1050±80 110 0.105 1090±160 100 0.092 1190±100 70 0.059 1190±60 90 0.076 1280±80 80 0.063 1340±140 120 0.090 2080±75 130 0.063 3120±280 130 0.042 4130±100 130 0.031 35LA658 1130±65 90 0.080 4240±100 140 0.033 4320±80 135 0.031 9130±200 175 0.019 9660±140 250 0.026 35LA759 4040±110 75 0.019 35LA439 3780±110 90 0.024 3880±90 85 0.022 4110±70 125 0.030 4120±70 110 0.027 4190±100 90 0.021 4230±100 60 0.014 4400±75 85 0.019 8890±120 165 0.019 * Additional dates from 35LA658 are reported here which were secured from grant funded excavations conducted subsequent to the excavations discussed in the text. accretion deposits (episode 2), just before or during the Middle Archaic occupation. Episode 3 of alluviation was in the late Holocene, during or following the Middle Archaic cultural period. Further evidence for three distinct episodes of alluviation is provided by analysis of the depth/age relationships of radiocarbon-dated samples from the archaeological sites. For each subsurface radiocarbon date in vertical accretion deposits, a vertical accretion rate, depth divided by age, can be calculated. If vertical accretion processes have operated continuously and at a constant rate, older dates will be obtained from proportionately deeper samples. In Table 4.5 and Figure 4.4 all radiocarbon dates obtained from the Noti-Veneta Highway Archaeological Project, with their sample depths and calculated vertical accretion rates are shown. Figure 4.4 shows that there is not a constant vertical accretion rate. Dates from the last 2000 years indicate the highest vertical accretion rates, and the older dates indicate anomalously slow rates of vertical accretion. The differences are probably due not to slow vertical accretion during the earlier periods, but to a pause in vertical accretion during

35 Chapter 4 – Sediment Analysis Studies
Middle Archaic time, between episode 2 and episode 3. The differences in vertical accretion rates therefore support the idea of two or three distinct episodes of accretion separated by pauses with slow or no accretion. This is a tentative model for the history of the lower Long Tom River floodplain, and this model should be tested by (1) additional stratigraphic studies and dating to demonstrate whether the lower sandy zone is chronologically distinct from the overlying siltier deposits, and (2) studies of soil profiles to identify episodes of soil development during pauses in vertical accretion. The stratigraphic summary, although based on limited data, indicates that there is a somewhat predictable architecture to the alluvial facies of the lower Long Tom River. Facies analysis suggests that the Long Tom River has been a fine-textured meandering stream with a very slow rate of lateral migration at least throughout the late Holocene. During episode 1, the Long Tom may have migrated more actively or have been a higher energy system. Distinctly lacking from these deposits is any evidence of natural (non-cultural) alluvial gravels or coarse sands. Furthermore, there is no evidence of cut-and-fill structures typical of actively incising or laterally migrating streams. In addition to the facies model, the morphology of the lower Long Tom channel and floodplain also indicate a very stable alluvial environment. Air photos show well-vegetated banks along the modern channel with small active point bars and no active meander belt. The channel appears to be deeply incised below the modern floodplain surface. Comparison of old maps and air photos with recent air photos shows no evidence of lateral
Figure 4.4. Plot of vertical accretion rate versus radiocarbon sample age.

The Long Tom and Chalker Sites 36
Table 4.6. Soil chemical analysis of the Long Tom site soil samples.
Sample P Ca Mg K Na Fe Mn Number Depth pH tot av tot% av/meq tot% av/meq tot% av/ppm tot% tot% tot/ppm
Long Tom 179W/55N LT-55N-1 10 5.2 930 2 0.40 7.7 0.65 3.2 1.43 237.9 0.68 4.05 1345 LT-55N-2 30 5.3 620 1 0.38 7.2 0.62 3.3 1.40 70.2 0.69 3.92 1155 LT-55N-3 50 5.5 550 0 0.42 7.0 0.72 3.6 1.58 58.5 0.75 4.46 1065 LT-55N-4 70 5.4 470 0 0.36 6.2 0.69 3.8 1.43 46.8 0.69 4.28 706 LT-55N-5 90 5.5 420 0 0.37 5.1 0.58 3.5 1.40 23.4 0.76 3.60 363 LT-55N-6 110 5.4 330 0 0.36 4.7 0.52 3.4 1.37 27.3 0.76 3.17 329 LT-55N-7 130 5.5 360 2 0.44 3.2 0.44 2.3 1.57 27.3 0.95 2.68 242 LT-55N-8 170 5.4 280 3 0.45 2.6 0.41 2.0 1.67 19.5 1.00 2.39 289 LT-55N-9 190 5.5 310 2 0.41 3.0 0.43 2.4 1.56 27.3 0.95 2.60 253
Long Tom 179W/70N LT-70N-1 10 5.0 750 1 0.39 5.7 0.60 2.4 1.45 132.6 0.73 3.86 1030 LT-70N-2 30 5.2 670 1 0.34 5.3 0.57 2.6 1.29 105.3 0.64 3.75 934 LT-70N-3 50 5.3 490 0 0.35 4.6 0.49 2.5 1.31 93.6 0.71 3.10 628 LT-70N-4 70 5.4 390 2 0.40 3.4 0.51 2.1 1.57 35.1 0.87 2.96 397 LT-70N-5 90 5.5 330 1 0.45 3.5 0.50 2.2 1.65 27.3 0.95 2.81 390 LT-70N-6 110 5.5 310 1 0.42 4.2 0.53 2.6 1.53 19.5 0.86 2.93 420 LT-70N-7 130 5.7 340 1 0.36 5.6 0.62 3.6 1.48 27.3 0.73 3.34 773 LT-70N-8 150 5.6 290 1 0.40 4.6 0.50 2.9 1.47 19.5 0.83 2.68 393 LT-70N-9 170 5.6 330 1 0.37 6.0 0.62 4.0 1.47 27.3 0.73 3.29 533 LT-70N-10 190 5.6 350 2 0.35 6.3 0.62 4.2 1.44 35.1 0.69 3.32 587
Long Tom East Block LT-EB-1 10 5.0 790 3 0.36 4.7 0.52 1.5 1.34 50.7 0.72 3.37 663 LT-EB-2 40 5.3 510 1 0.37 3.0 0.49 1.4 1.47 27.3 0.84 2.94 424 LT-EB-3 60 5.4 340 5 0.39 3.0 0.41 1.5 1.52 23.4 0.90 2.27 270
Long Tom West Block LT-WB-1 10 5.1 760 2 0.35 5.0 0.57 1.9 1.34 109.2 0.71 3.55 9.66 LT-WB-2 40 5.5 490 0 0.34 5.4 0.59 3.4 1.36 42.9 0.73 3.55 768 LT-WB-3 60 5.5 350 0 0.37 4.7 0.64 4.1 1.53 35.1 0.85 3.72 471 channel shifting within the last 25 years. Several abandoned channel segments that are partly filled are present within about 150 meters of the modern channel, but they do not seem to be part of an active meander belt. They occur mainly adjacent to the railroad embankment and are probably the result of artificial channel realignment during railroad construction. The abandoned channel segments at the Long Tom Site and Chalker Site probably both were cut off during railroad construction. This interpretation of little or no recent lateral migration by the Long Tom River is supported further by 1) the soil patterns and geomorphic surfaces discussed in the preceding section, and 2) a radiocarbon date of 4240 + 100 at 35LA658 located within 50 meters horizontally of the modern channel (O'Neill 1987). This behavior has resulted in the preservation of a rich concentration of stratified prehistoric archaeological sites.
Soil Chemical Studies at the Noti-Veneta Archaeological Sites Two applications of soil chemical analysis were explored in this study: 1) documenting the impact of prehistoric human occupation on the soil of the sites, and 2) investigating the type and degree of soil development.

37 Chapter 4 – Sediment Analysis Studies
Figure 4.5. Results of soil chemistry analyses of samples from Trench 179W/55N, Long Tom site.
�
��
��
��
��
���
���
���
���
���
���
�
��
��
��
��
���
���
���
���
���
���
�
��
��
��
��
���
���
���
���
���
���
� �9� �9� �9� �9� �9� :
�
��
��
��
��
���
���
���
���
���
���
�
��
��
��
��
���
���
���
���
���
���
�
��
��
��
��
���
���
���
���
���
���
�
��
��
��
��
���
���
���
���
���
���
�
��
��
��
��
���
���
���
���
���
���
�
��
��
��
��
���
���
���
���
���
���
�
��
��
��
��
���
���
���
���
���
���
�
��
��
��
��
���
���
���
���
���
���
�
��
��
��
��
���
���
���
���
���
���
�
��
��
��
��
���
���
���
���
���
���
� �� �� �� �� ��� �����
��� ��� ��� ��� ��������$ �
� � � ��7����6���$ �
� �9� � �9� � �9����;�$<
� ��� ��� ��� ���� �������3�$ �
�9� �9� �9����4�$<
� � � � � � ��7����6��4�$��5
�9� �9� �9� �9� �9����3�$<
� �9� � �9� ��7����6��3�$��5
�9� �9� �9� �9� �9����=$<
� �� ��� ��� ��� ����7����6��=$��5
�9� �9� �9� �9� ������$<
���! ��� ���&
!� )$��
!� )$��
!� )$��
!� )$��
!� )$��
!� )$��
!� )$��
!� )$��
!� )$��
!� )$��
!� )$��
!� )$��
!� )$��

The Long Tom and Chalker Sites 38
�
��
��
��
��
���
���
���
���
���
���
�
��
��
��
��
���
���
���
���
���
���
�
��
��
��
��
���
���
���
���
���
���
� �9� �9� �9� :
�
��
��
��
��
���
���
���
���
���
���
�
��
��
��
��
���
���
���
���
���
���
�
��
��
��
��
���
���
���
���
���
���
�
��
��
��
��
���
���
���
���
���
���
�
��
��
��
��
���
���
���
���
���
���
� �� �� �� �� ��� �����
��� ��� ��� �������$ �
� � ��7����6���$ �
�9� � �9� ����;�$<
��� ��� ��� �������3�$ �
�9� �9� �9� �9� �9����=$<
� �� ��� ��� ��� ����7����6��=$��5
�
��
��
��
��
���
���
���
���
���
���
�
��
��
��
��
���
���
���
���
���
���
�
��
��
��
��
���
���
���
���
���
���
�
��
��
��
��
���
���
���
���
���
���
�9� �9� �9����4�$<
� � � � ��7����6��4�$��5
�9� �9� �9� �9����3�$<
� �9� � �9� ��7����6��3�$��5
�9� �9� �9� �9� ������$<
�
��
��
��
��
���
���
���
���
���
���
!� )$��
!� )$��
!� )$��
!� )$��
!� )$��
!� )$��
!� )$��
!� )$��
!� )$��
!� )$��
!� )$��
!� )$��
!� )$��
���������
�9�
�9�
�9�
���! ��� ���&
Figure 4.6. Results of soil chemistry analyses of samples collected from Trench 179W/70N, Long Tom site.

39 Chapter 4 – Sediment Analysis Studies
��9� �9� �9� :
� �� �� �� �� ��� �����
��� ��� �������$ �
� � � ��7����6���$ �
� �9� � �9����;�$<
� ��� ��� ������3�$ �
�9� �9� �9� �9����=$<
� �� ��� ��� ��� ����7����6��=$��5
�9� �9��9�����4�$<
� � � ��7����6��4�$��5
�9� �9� �9����3�$<
�9� �9��9� �9��7����6��3�$��5
�9� �9� �9������$<
!� )$��
!� )$��
!� )$��
!� )$��
!� )$��
!� )$��
!� )$��
!� )$��
!� )$��
!� )$��
!� )$��
!� )$��
!� )$��
�
��
��
��
��
��
��
�
��
��
��
��
��
��
�
��
��
��
��
��
��
�
��
��
��
��
��
��
�
��
��
��
��
��
��
�
��
��
��
��
��
��
��� ��� ��� � �
�
��
��
��
��
��
��
�
��
��
��
��
��
��
�
��
��
��
��
��
��
�
��
��
��
��
��
��
�9� 9��
�
��
��
��
��
��
��
�
��
��
��
��
��
��
�
��
��
��
��
��
��
���! ��� ���&
Figure 4.7. Results of soil chemistry analyses from samples collected from the East Block excavation unit, Long Tom site.

The Long Tom and Chalker Sites 40
� �9� �9� :
� �� �� �� �� ��� �����
��� ��� �������$ �
� � ��7����6���$ �
�� �9����;�$<
� ��� �������3�$ �
�9� �9� �9� �9����=$<
� �� ��� ��� ��� ����7����6��=$��5
�9� �9��9�����4�$<
� � � ��7����6��4�$��5
�9� �9� �9����3�$<
� �� ��7����6��3�$��5
�9� �9� �9������$<
!� )$��
!� )$��
!� )$��
!� )$��
!� )$��
!� )$��
!� )$��
!� )$��
!� )$��
!� )$��
!� )$��
!� )$��
!� )$��
�
��
��
��
��
��
��
�
��
��
��
��
��
��
�
��
��
��
��
��
��
�
��
��
��
��
��
��
�
��
��
��
��
��
��
�
��
��
��
��
��
��
��� ��� ���
�
��
��
��
��
��
��
�
��
��
��
��
��
��
�
��
��
��
��
��
��
�
��
��
��
��
��
��
�9� 9��
�
��
��
��
��
��
��
�
��
��
��
��
��
��
�
��
��
��
��
��
��
�9�
� ��
���! ��� ���&
Figure 4.8. Results of soil chemistry analyses from samples collected from the West Block excavation unit, Long Tom site.

41 Chapter 4 – Sediment Analysis Studies
Table 4.7. Soil chemical analysis of the Chalker site soil samples.
Sample P Ca Mg K Na Fe Mn Number Depth pH tot av tot% av/meq tot% av/meq tot% av/ppm tot% tot% tot/ppm CH-14N-1 5 5.6 790 4 0.60 15.3 0.71 5.9 1.23 183.3 0.63 3.94 1030 CH-14N-2 15 5.8 800 2 0.49 12.7 0.76 5.6 1.21 148.2 0.58 4.29 1200 CH-14N-3 25 5.6 520 1 0.40 9.3 0.66 4.8 1.22 117.0 0.63 3.73 809 CH-14N-4 35 5.8 370 1 0.46 7.7 0.56 3.9 1.44 120.9 0.80 3.14 708 CH-14N-5 45 5.9 450 0 0.47 9.0 0.66 4.7 1.39 156.0 0.81 3.69 850 CH-14N-6 55 5.9 430 1 0.44 8.9 0.61 4.6 1.28 159.9 0.74 3.49 762 CH-14N-7 65 5.9 650 4 0.41 7.4 0.56 4.1 1.23 144.3 0.74 3.65 610 CH-14N-8 75 5.9 420 1 0.39 6.7 0.62 4.1 1.43 109.2 0.77 3.51 676 CH-14N-9 85 5.7 380 1 0.35 6.0 0.58 3.9 1.34 93.6 0.70 3.33 552 CH-14N-10 95 5.6 410 2 0.38 5.8 0.60 3.8 1.43 78.0 0.77 3.40 619 CH-14N-11 105 5.6 420 2 0.34 5.8 0.57 3.9 1.34 97.5 0.70 3.20 574 CH-14N-12 115 5.8 390 1 0.42 7.9 0.59 4.4 1.35 117.0 0.74 3.42 710 Thirty-seven soil samples were analyzed chemically, 25 from the Long Tom (LT) site and 12 from the Chalker (Ch) site. The Chalker Site samples represent a single vertical column from the main excavation block from which samples were taken at 10 cm intervals. The Long Tom Site is represented by two such sample columns, as well as samples of soils representing the three major stratigraphic units defined in the east and west excavation blocks. Samples were analyzed chemically in two ways. In the first analysis, a portion of each sample was digested in a perchloric-nitric-hydrofluoric acid mixture, and the content of seven major elements--phosphorus (P), calcium (Ca), magnesium (Mg), potassium (K), sodium (Na), iron (Fe), and manganese (Mn)--was determined by ion-coupled plasma spectroscopy. This analysis gives the total content of each element, including both primary minerals and secondary forms resulting from soil weathering. This total element analysis was performed by Chemex Labs, Ltd. of Sparks, Nevada. Secondly, the available amount of four elements--P, Ca, Mg, K--was measured by the Soils Testing Laboratory, Oregon State University. This analysis measures only the free ions which are available to go into solution and be taken up by plants; ions contained in minerals are not included. Available element chemistry of a soil reflects the degree to which the soil has been leached and any additions of material in soluble form, through fertilizer for example. The results of these examinations for the Long Tom and Chalker site samples are presented in Tables 4.6 and 4.7. Ca, Mg, K and Na are the major base cations of soils. In natural soils, all are derived from weathering of primary minerals in rocks. All four are subject to leaching in the soil environment. Na is most easily leached, with K, Mg, and Ca following in order of ease of leaching. P is the most significant element in detecting prehistoric human occupation of a soil. It is highly concentrated in human and animal wastes, and it remains insoluble and largely unleached in soils. P therefore serves as a marker of prehistoric occupation which persists long after the site has been abandoned and perishable material has disappeared (McDowell 1988). P typically occurs in insoluble compounds associated with Fe and Mn in acid soils, and with Ca in basic soils (Bohn, McNeal and O'Connor 1979). Ca and P are highly concentrated in bone and shell, with levels of Ca higher than P. Na is moderately concentrated in bone. Mammal muscle tissue is fairly high in K, P and Na. K, Fe, and Mn are unlikely to be enriched in soils as a result of human activities (McDowell 1988). In general, soil samples from the Noti-Veneta project sites show no clear evidence of anthropic (unintentionally affected by human occupation; Eidt 1984) chemical enrichment (Table 4.8). Total phosphorus values of the samples analyzed range from about 300 to 1000 ppm. Most of the high values (above 600 ppm) are associated with soil high in organic matter in the A horizon. McDowell (1988) found that a minimum total P concentration of 1000 ppm is typical of culturally-enriched archaeological soils. Subsequent unpublished studies have supported 1000 ppm as a minimum criterion for clear human enrichment of soil. All of the Noti-Veneta samples analyzed fell below this level, probably because these are transient sites, with no permanent occupation. Bivariate plots of total versus available P, Ca, Mg, and K were examined to see the relationship between these two forms of chemical analysis. Previous researchers have suggested that (1) available P is not a valid index of soil enrichment, so total P must be measured, but that (2) available Ca, Mg, and K are useful for archaeological studies. In this study, the two forms of chemical analysis were compared to determine whether total Ca, Mg and K,

The Long Tom and Chalker Sites 42
�9��9� �9� �9� :
� �� �� �� �� ��� �����
��� ��� �������$ �
� � � ��7����6���$ �
� �9� � �9����;�$<
��� ������ �������3�$ �
�9� �9� �9� �9����=$<
� �� ��� ��� ��� ����7����6��=$��5
�9��9����4�$<
� �� ���7����6��4�$��5
�9��9� �9����3�$<
� �� ��7����6��3�$��5
�9� �9� �9������$<
!� )$��
!� )$��
!� )$��
!� )$��
!� )$��
!� )$��
!� )$��
!� )$��
!� )$��
!� )$��
!� )$��
!� )$��
!� )$��
�
��
��
���
��
��
���
�
��
��
���
��
��
���
�
��
��
���
��
��
���
�
��
��
���
��
��
���
�
��
��
���
��
��
���
�
��
��
���
��
��
���
��� ��� ��� �
�
��
��
���
��
��
���
�
��
��
���
��
��
���
�
��
��
���
��
��
���
�
��
��
���
��
��
���
�9� �9�
�
��
��
���
��
��
���
�
��
��
���
��
��
���
�
��
��
���
��
��
���
�9� �
����
�� �� �� �9�
�9��9�
���! ��� ���&
Figure 4.9. Results of soil chemistry analyses on samples collected from unit 14N/18W of the block excavation at the Chalker site.

43 Chapter 4 – Sediment Analysis Studies
measured in the same process as total P, are representative, or whether available Ca, Mg and K should be analyzed separately. The bivariate plots of total Mg versus available Mg, and of total Ca versus available Ca, both showed a strong positive relationship. Several data points showed anomalously high values of total Ca compared to available Ca. These samples had a high sand content, indicating a mineralogic rather than pedogenic or cultural explanation for the breakdown of the total Ca/available Ca relationship. The bivariate plot of total K versus available K showed a negative relationship. Profile plots indicate that available K decreases steadily with depth, while total K varies more irregularly. High values of total K occur in the upper part of the profiles, associated with the A horizon, but they also occur in the lower part of the profiles, presumably associated with unweathered primary minerals high in K. This plot suggest that total K may not be an appropriate index of human-caused enrichment of K, if any exists. The bivariate plot of total P versus available P indicated no significant relationship between these two variables, supporting the idea that available P does not reveal anthropic enrichment of soil. These conclusions concerning the relationships between concentrations of total and available elements, while useful as preliminary results, may not be valid in other geologic and pedogenic environments. Although none of the samples analyzed show clear evidence of human enrichment of total P, chemical variations within the soil profiles suggest that these are complex, stratified soils. Profile Ch-14 has a sharp increase of total P (to 650 ppm) at 60-70 cm depth. Available P also increases here, but there are no major increases in other elements. Most importantly, this increase in P is not associated with a corresponding increase in Fe and Mn, which would be expected if natural soils chemical processes were responsible. Profiles LT-55 and LT-70 have slight subsurface variations in P content, but these do not appear to reflect human influence. Ca shows either a general decrease down-profile, probably due to biotic and fertilizer concentrations at the surface, or small-magnitude variations down-profile that are not significant. Down-profile fluctuations in total K and Na in profiles Ch-14, LT-55, and LT-70 are significant, but there is no evidence to associate them with human enrichment; they seem to be related to textural changes, and therefore probably to mineralogical changes, in the profiles. Other aspects of chemical profile variations in the Noti-Veneta profiles can be recognized by comparison with similar non-anthropic soil profiles. Cloquato silt loam, Chehalis silty clay loam, and Wapato silty clay loam are three soils series that typically occur on the ingram geomorphic surface in Lane County (Patching 1987) for which soil chemical data are available (Huddleston 1982). These data represent typical chemical profiles of non-anthropic soils in geomorphic settings comparable to that of the Noti-Veneta sites. In all three soils, pH is most acidic in the surface horizon, and pH increases with depth in the profile. Available Ca is highest in the A horizon, and decreases downward to the C horizon by 15 to 30%. The pattern of change in available K is similar to that of available Ca. Available Mg, however, increases from the A horizon downward to the B or C horizon. In the soil profiles from the Noti-Veneta sites, available Ca and K generally decrease downward. Profile LT-70, however, has a subsurface increase in available Ca at 110 to 200 cm depth. This corresponds to a zone of somewhat finer texture, and higher total Fe, total Mn and total and available Mg, but there is no corresponding concentration of P or Ca. This subsurface zone probably reflects a change in parent material without any signficant human enrichment. In profile CH-14 at 40 to 70 cm depth, there is a modest subsurface concentration of available K, associated with a modest increase in total and available P. This is probably a buried land surface enriched by prehistoric human occupation. Available Mg in the archaeological profiles typically decreases downward, and follows the pattern of available Ca, unlike available Mg in the Chehalis, Cloquato and Wapato soils.
Table 4.8. Total element chemistry; comparative values from typical non-anthropic soils and Noti-Veneta archaeological samples.
Noti-Veneta samples; Typical mean values by horizon Element Non-anthropic soils1 A B or C P 800 773 424 Ca 15000 4100 4000 Mg 5000 5700 6100 K 14000 13600 14300 Na 5000 6900 7800 Fe 40000 37800 33100 Mn 1000 1031 590 1Bowen 1979

The Long Tom and Chalker Sites 44
In conclusion, the following observations may be offered regarding the results of soil chemical studies undertaken at the Chalker and Long Tom sites. 1) Overall, total P concentrations are much lower than those at other archaeological sites (cf. McDowell
1988), suggesting that human activity at these sites was either very brief or very low intensity--though there is evidence of possible human influence in Profile Ch-14 at 40 to 70 cm;
2) Otherwise, data on total P concentrations indicates that prehistoric human influences on these soils is very
slight; highest values occur at the modern soil surface in all profiles studied, reflecting modern human and biotic processes of concentration;
3) Down-profile variations in chemistry and texture indicate the profiles Ch-14, LT-55 and LT-70 are
complex, stratified soils; 4) Soil chemical analysis at sites that were transient camps with low-intensity use does not provide as many
insights as at more intensively occupied sites, but it does yield results that are generally interpretable and unambiguous. This technique does have the potential of revealing prehistoric human influences on soils under a broad range of archaeological and geomorphic conditions;
5) In this environment, total Ca and Mg are as valuable as available Ca and Mg for understanding anthropic
influences on soil. Total K varies in a very different way from available K, however. Total P is preferable to available P for understanding anthropic influences on soil.
Summary The Long Tom and Chalker sites occur in an area which is particularly significant because of 1) its position on the boundary of two major ecological/physiographic regions, and 2) its complex and well-preserved alluvial stratigraphy. The sites are in an area of High Ingram geomorphic surface. A tentative geomorphic model for three separate episodes of alluvial sedimentation, separated by episodes of relative stability, during the Holocene, has been developed here. Archaeological remains from the Early Archaic, Middle Archaic and Late Archaic periods are stratified within the Holocene alluvial deposits. The deeply buried, radiocarbon-dated, Early Archaic remains were encountered at only one site. The alluvial stratigraphy appears to be consistent and predictable throughout the project area, suggesting that it may be possible to predict the occurrence of more Early and Middle Archaic remains. Old cultural remains are preserved here because the channel of the Long Tom River has been relatively stable. Results of soil chemistry studies at the Chalker and Long Tom sites indicate a low intensity of activity, suggestive of short-term seasonal occupations.

Chapter 5
Alluvial Stratigraphy of the Long Tom River Floodplain
Dorothy E. Freidel
Questions regarding the sedimentological history of the Long Tom river basin persisted after the data recovery excavations at the Long tom and Chalker sites. As an outgrowth of the archaeological work, a geomorphological study was undertaken to reconstruct the sediment history of the project area. The research presented in this chapter was made possible by a grant from the Oregon State Historic Preservation Office, with additional financial support from the Oregon Country Fair, the City of Veneta, and the University of Oregon.
Introduction A substantial body of literature exists on the nature of alluvial systems and floodplain morphology (Schumm 1973; Vanoni 1975; Allen 1965). Many studies have shown that rivers experience episodic alluviation, stability, and degradation in response to intrinsic and extrinsic stimuli such as sediment supply or gradient change, climate and vegetation fluctuations or tectonic movements (Baker and Penteado-Orellana 1977, 1978; Knox et al. 1981; McDowell 1983; Brakenridge 1981, 1984). McDowell (1983) suggests that evidence for episodic erosion, stability and aggradation may be found in sediment units which are distinguished by differences in lithology and soil development, are bounded by erosional surfaces, and are temporally distinct. In order to estimate past changes in a river's hydrologic regime, the sinuosity of ancient river channels has been correlated with sedimentary properties--such as grain sized, sorting, roundness and lithology (Baker and Penteado-Orellana 1977). This study was stimulated by a need to understand the relationship between archaeological deposits and the sediment strata in which they are situated in the Long Tom River floodplain. This information would provide the means to develop a landform history for the project area, and the opportunity to formulate a model which can help locate similar archaeological sites in the same region (McDowell this volume; Freidel et al. 1989). This chapter investigates the stratigraphic and geomorphic nature of the Holocene soils and sediments of the Long Tom River with the goal of formulating a geomorphic history of the river valley. Results of this study define five stratigraphic units: Unit V, 11,000-10,250 years ago; Unit IV, 10,250-8000 years ago; Unit III, 5500-4000 years ago; Unit II, 2000-1100 years ago; and Unit I, 1100 years ago to historic times. Gaps in the sediment chronology of the project area, presumed to represent erosional periods, are found between sediment units IV and III (8000-5500 years ago), and between units III and II (4000-2000 years ago).
Project Setting The Country Fair/Veneta Archaeological Project area is located on both sides of the Long Tom River in Sections 25, 26, 35 and 36, T17S, R6W, Willamette Meridian, at an elevation of approximately 115 m above mean sea level (Figure 5.1). At the study site, the floodplain is composed of slowly permeable Pleistocene and Holocene alluvium to a depth of 30-45 m, overlying gray Flouornoy sandstone. The water table varies seasonally between 010 meters below the surface (Frank 1973) Geomorphic surfaces of Pleistocene age in the Willamette Valley include the Eola, Dolph, Calapooyia, Senecal, and Chanmpoeg surfaces. The Winkle, Ingram, and Horseshoe are Holocene in age. In the Long Tom River Valley, the soils have been tentatively correlated with three of these surfaces: the Dolph, Winkle and Ingram (see McDowell this volume). The soils adjacent to the Long Tom channel in the study area (Figure 5.2) are in the McBee silty clay loam series and include small areas of Chehalis, Cloquato, Newberg, and Wapato soils (Patching 1987). These are deep, moderately well-drained Haploxerolls formed in recent alluvium. Farther from the channel, soils formed in swales and drainageways dissecting older alluvial terraces have been classified in the Linslaw loam and Noti loam series.

The Long Tom and Chalker Sites 46
Figure 5.1. Location of the County Fair / Veneta Geoarchaeological Project area in the Long Tom River Sub-basin, upper Willamette Valley (USGS Elmira Quad, 7.5' Series, 1957).

47 Chapter 5 – Alluvial Stratigraphy
These are deep, poorly drained Argixerolls. The McBee, Linslaw and Noti soil bodies tend to be linear stringers reflecting floodplain development and terrace incision, and the location of present and former channels (Patching 1987). A long, narrow body of Wapato silty clay loam is located just northwest of the study site, roughly parallel to the present Long Tom channel. Wapato soils form in depressions on floodplains (Patching 1987). The shape and position of this soil body, slightly lower than the adjacent Linslaw and Noti soils, has suggested to McDowell (this volume) that this deep, poorly drained soil marks a former course of the Long Tom River.
Methods Initial descriptions of soils and sediments were obtained from river bank profiles, soil augering, and soil coring along transects perpendicular to the river (Figure 5.2). These transects were placed to intersect the range of geomorphic surfaces, different soil types, and interesting geomorphic features--as well as passing near archaeological sites. Sediment data obtained along the transects were used to create stratigraphic cross-sections of the floodplain. The archaeological fieldwork consisted of surveying along geomorphic transects with remote sensing equipment (proton magnetometer) capable of detecting buried cultural features (Peterson 1989), then excavating selected suspected features.
Figure 5.2. Map of the study area showing transects and location of soil profiles relative to soil distribution (Patching 1987) and Willamette Valley geomorphic surfaces (McDowell this volume).

The Long Tom and Chalker Sites 48
Soil auger holes, dug to a minimum depth of three meters, were bored by hand along the transects at uneven intervals of 200-300 meters. Thick woods, brush, swamp, and other obstacles prevented even placement of the holes. Detailed descriptions of the sediments were taken in the field and special note was made of any charcoal, bisque, or rock fragments. Soil cores, up to four meters in length, were obtained using a Giddings Hydraulic Soil Probe. These were taken to the laboratory for detailed study. A plan was devised to place nine backhoe trenches along geomorphic transects intersecting areas where suspected cultural material had been observed in the auger holes (Figure 5.3). Five additional trenches were dug in the Veneta lagoon area where several archaeological sites had been previously recorded and a number of magnetic anomalies were detected with the proton magnetometer (Peterson 1989). Trenches B2 and C1, in the lagoon, were placed to investigate possible paleochannel features revealed in the magnetometer survey (Figure 5.4). Trenches D3 on Transect 1, and F1 on Transect 3 were excavated to look at differences in sediment across geomorphic surface boundaries. Soil profiles were described in many of the trenches (Freidel 1989), though not all due to time and weather limitations--four trenches became flooded before soil descriptions could be made. Appendix B presents a description of samples LT-18 and LT-33. Samples of charcoal and other organic material were collected for radiocarbon dating of sediments along stratigraphic boundaries. Hydrometer analysis (Day 1965; Folk 1980) was performed on two sets of samples, profiles LT-18 and LT-33, to obtain particle size distributions. Profile LT-18 was located north of the Long Tom site on Transect 1, and LT-33 was located near the southeast end of Transect 3 in Trench C2. The composition and characteristics of the
Figure 5.3. Location of archaeological transects A-H, surveyed by magnetometer, and their relation to geomorphic transects and recorded sites (Peterson 1989:20).

49 Chapter 5 – Alluvial Stratigraphy
sand fraction of each sample were described in terms of percent quartz, feldspar, and other minerals, size, sorting, and roundness. Samples from the two sediment sets were also tested for loss on ignition of organic matter (Davies 1974).
Stratigraphic Units and
Environmental Facies
A stratigraphic unit is a body of sediments which was laid down during a discrete period of time. Within each unit may be several environmental facies deposited by somewhat different processes in different fluvial environments, depending on flood magnitude and proximity to the river channel during the period of deposition. Distinguishing stratigraphic units in the Long Tom River floodplain was difficult because the sediments are fairly uniform, and the soils are complex, overlapping profiles that typically involve more than one stratigraphic unit.
Lithologic characteristics--such as horizon development, horizon boundaries, and color--were used to delineate the stratigraphic units. None of these factors alone was considered sufficient to define a unit boundary. Each profile and auger hole description was considered separately, then patterns were sought between adjacent soil columns along the transects. The following criteria were used to define stratigraphic boundaries: 1) Abrupt or clear horizon boundaries were most typical of stratigraphic unit boundaries. Pedogenic
processes, however, can also produce distinct contrasting horizons in soils formed in uniform parent material, and these may be confused with different episodes of sediment deposition (Birkeland 1984).
2) Less well-defined boundaries, designated gradual or diffuse, were considered indicative of continuous
deposition. An exception to this occurred when a stratigraphic unit boundary separated two deposits composed of the same facies, and soil development had overprinted both units (Vreeken 1984; Ruhe and Olson 1980). In these cases, criteria other than soil horizon boundaries were used to identify stratigraphic units.
Figure 5.4. Location of archaeological transects A-C, the excavated trenches, and sites recorded in the vicinity of the Veneta lagoon (Peterson 1989:28).

The Long Tom and Chalker Sites 50
3) Boundaries that were laterally continuous from one profile to an adjacent profile, or along trench walls,
were considered more likely to be major stratigraphic boundaries than short, discontinuous boundaries. 4) Layers of contrasting soil texture separated by clear or abrupt boundaries were interpreted as evidence of
pause in deposition or change in depositional environment. In particular, changes in the percentage of sand in a given layer was given considerable weight because sand is not easily translocated during pedogenesis (Birkeland 1984).
5) The most reliable indicator for delineating stratigraphic boundaries was contrast in the degree of pedogenic
development as indicated by color, soil structure, presence of soil pores, roots, and evidence of illuvial clay. Subdivisions of stratigraphic units into facies aids in the interpretation of depositional environment and reconstruction of floodplain history. An environmental facies (Bates and Jackson 1980), as referred to here, is a type of sedimentary deposit that can be assigned to a particular process or environment of formation, based on its sedimentary characteristics and on comparison with other recent deposits in the study area. Characteristics which may be used to identify facies and differentiate between facies include texture, depositional structures, inclusions (such as drifted or in situ plant remains), three-dimensional geometry of beds, and stratigraphic and geomorphic context. One or more facies may be present in each stratigraphic unit. Floodplain sediments may be divided into two major types: lateral accretion deposits and vertical accretion deposits. Laterally accreted deposits form as the meander bend of a river migrates across its floodplain, removing sediments from the cut bank at the outside of the meander and redepositing sediments on the inside as a point bar. Point bar deposits are poorly sorted but tend to fine upward, and range in texture from the coarsest bedload materials to fine sand and silt. Cross bedding and lenses of silt and sand may be seen if not blurred or erased by soil forming processes. Inclusions of plant remains, such as twigs and leaf fragments, may be seen. Vertical accretion deposits are formed when particles suspended in overbank floodwaters are deposited on the surface of the floodplain. Because they are dominated by particles transported in suspension, vertical accretion deposits are finer in texture than lateral accretion deposits. Overbank deposits tend to infill depressions on the floodplain resulting in a fairly smooth, near horizontal surface. Vertical accretion deposits can be subdivided into a number of specific facies, including the following: a) Swales and bars formed on the upper surface of point bars are found as concave upward lenses and may be
filled with well-bedded, vertically accreted sediments ranging from the coarsest bedload sediments to fine sand and silt.
b) Levee deposits are composed of interbedded coarse and fine sediments ranging from very fine sand to silt
and clay, with silt predominant. Natural levee deposits occur as a wedge-shaped lens with its thicker edge along the channel bank.
c) Channel fill deposits in abandoned meander cutoffs range in texture from sands through silty sands to silts
and dark silty clays. They can be distinguished primarily by concave upward deposits abutting abruptly against the cutbank of the abandoned channel, while showing a diffuse or gradual boundary with point bar deposits on the other side of the old channel.
d) Flood basin deposits are composed of the finest sediments--silts and clays--and are the most aerially
extensive deposits on the floodplain, though they may be less thick than the point bar and levee deposits. The dominant sedimentary structure is horizontal lamination.
Description and Dating of Long Tom Stratigraphic Units The task of deriving a history of floodplain development from alluvial deposits is complex. A synthesis of sedimentologic, pedologic, and archaeologic evidence is required to develop a probable scenario of erosion, deposition, and stability. In this study the floodplain deposits of the Long Tom River were first divided into stratigraphic units, then environmental facies were identified within those units, the relative or radiocarbon age of each unit was established, and finally the soil development of the stratigraphic units were compared. The results of

51 Chapter 5 – Alluvial Stratigraphy
Table 5.1. Radiocarbon ages* from the Country Fair-Veneta Geoarchaeological project area and their
stratigraphic context. Dendrocalibrated Intercept(s)1 Srat 14C Age plus 1-sigma error range Unit Source Lab. No.2 Depth/Stratigraphic Context Site 35LA760 (Humphrey site) 380±60 510 (475) 320 BP Unit I O’Neill 1987 Beta-19976a 95 cm; point bar deposits Site 35LA758 (Country Fair 1) 420±60 520 (500) 460 BP Unit I O’Neill 1987 Beta-19975a 102 cm; point bar deposits Site 35LA420 (Chalker site) 450±50 530 (510) 490 BP Unit I Freidel et al. 1989 Beta-24088a 40 cm 650±50 670 (660) 560 BP Unit I Freidel et al. 1989 Beta-19978a 70 cm 720±80 710 (675) 655 BP Unit I Freidel et al. 1989 Beta-19980a 50 cm 990±60 960 (930) 840 BP Unit I Freidel et al. 1989 Beta-24089a 70 cm 1050±80 1060 (960) 920 BP Unit I Freidel et al. 1989 Beta-28755a 110 cm 1090±100 1090 (980) 930 BP Unit I Freidel et al. 1989 Beta-24091a 100 cm 1190±60 1180 (1120, 1090) 1060 BP Unit II Freidel et al. 1989 Beta-19981a 60 cm 1190±100 1270 (1120, 1090) 980 BP Unit II Freidel et al. 1989 Beta-24090a 70 cm 1280±80 1290 (1260) 1100 BP Unit II O’Neill 1987 WSU-3462a 80 cm; Unit boundary I/II 1340±140 1350 (1280) 1100 BP Unit II Freidel et al. 1989 Beta-24092a 120 cm 2080±75 2140 (2050) 1950 BP Unit II O’Neill 1987 WSU-3463a 130 cm 3120±280 3680 (3360) 2950 BP ??? Freidel et al. 1989 Beta-24093a 130 cm 4130±100 4830 (4800, 4770, 4610, 4590, 4570) 4450 BP Unit III Freidel et al. 1989 Beta-20175a 130 cm Site 35LA658 (Stamp site) 1130±65 1130 (1060) 970 BP Unit II O’Neill 1987 WSU-3461a 90 cm; 4240±100 4870 (4840) 4620 BP Unit III O’Neill 1987 WSU-3460a 140 cm 4320±80 4980 (4870) 4840 BP Unit III Freidel et al. 1989 Beta-28781a 135 cm 9130±200 10,340 (10,040) 9930 BP Unit IV Freidel et al. 1989 Beta-28780b 175 cm 9660±140 10,990 (10,910) 10,490 BP Unit V Freidel et al. 1989 Beta-28779a 250 cm Site 35LA439 (Long Tom site) 3780±110 4400 (4150) 3990 BP Unit III Freidel et al. 1989 Beta-19983a 90 cm 3880±90 4430 (4400, 4370, 4350) 4150 BP Unit III O’Neill 1987 Beta-2452a 85 cm 4110±70 4820 (4810, 4770, 4640, 4610, 4580) 4528 BP Unit III O’Neill 1987 Beta-2453a 125 cm 4120±70 4830 (4810, 4770, 4640, 4610, 4580) 4530 BP Unit III Freidel et al. 1989 Beta-19984a 110 cm 4190±100 4860 (4830, 4750, 4730, 4660) 4560 BP Unit III O’Neill 1987 WSU-3466a 90 cm 4230±100 4870 (4840, 4740) 4610 BP Unit III O’Neill 1987 WSU-3465a 60 cm 4400±75 5240 (4980) 4870 BP Unit III O’Neill 1987 WSU-3464a 85 cm 8890±120 9980 (9910) 9680 BP Unit IV Freidel et al. 1989 Beta-20176a 165 cm Site 35LA759 (East Pond site) 4040±110 4820 (4530) 4410 BP Unit III Freidel et al. 1989 Beta-19977a 85 cm Site 35LA804 (Veneta Lagoon A) 4600±110 5460 (5310) 5060 BP Unit III Freidel et al. 1989 Beta-28754a 100 cm Site 35LA860 (Trench D) 7690±80 8850 (8500, 8430) 8390 BP Unit IV Freidel et al. 1989 Beta-28782a 95 cm Site 35LA861 (Veneta Lagoon B) 9485±90 10,860 (10,530, 10,520, 10,480) 10,370 BP Unit V Freidel et al. 1989 Beta-28777a 240 cm Transect 1 (Probe LT-7) 9820±140 (10,990) BP Unit V Freidel 1989 Beta-28783b *Where more than one intercept is calculated, the median calibrated age is used in the text. 1. University of Washington Quaternary Isotope Lab Radiocarbon Calibration Program Rev 3.0.3 2. Dated material; a = wood charcoal; b = soil

The Long Tom and Chalker Sites 52
this research were then compared to the geomorphic model of the Willamette Valley developed by Balster and Parsons (1968, and subsequent works; see also McDowell 1991). Five stratigraphic units have been identified in the Long Tom River floodplain sediments. Each will in turn be described in terms of its sedimentary characteristics, facies, and age. These descriptions are based on field data refined by laboratory results. Particle size data and loss on ignition results were derived from laboratory analysis of samples LT-18 on Transect 1 and LT-33 on transect 3 (Figures 5.5 and 5.6). Radiocarbon dates associated with the defined stratigraphic units are presented in Table 5.1. Stratigraphic units in the central part of the study area, along Transect 2 and the northwest portion of Transect 3, are all very fine grained, varying only from silty clay loam to clay. In addition, no radiocarbon dates have been obtained from this part of the study area. Therefore, assignment of stratigraphic unit designations are tentative for all units on Transect 3 Northwest, and have been left out for transect 2.
Stratigraphic Unit I Unit I, the surface layer, is a silt loam or silty clay loam which ranges in thickness from 15 to 60 cm and averages about 35 cm. Unit I typically contains less than 15% moderately well sorted to well sorted subangular fine and very fine sand. The sand lithology is dominated by quartz and feldspar, with minor amounts of muscovite and biotite. Unit I is found on both Transects 1 and 3 Southeast, but appears to be absent on Transects 2 and 3 Northwest (Figures 5.7-5.10). Boundaries with underlying Unit II are almost exclusively clear, and in a few areas are abrupt and well defined. There appear to be three facies in Unit I, including flood basin, natural levee, and point bar deposits. Flood basin deposits dominate Unit I, including all of Transects 1 and 3 Northwest. These sediments are all very fine, ranging in texture from silty clay to silt loam. The percentage of sand in this sediment layer is quite low, and seems to become finer with distance from the channel. On Transect 3 Southeast, Unit I sediments are a natural levee facies, based on high sand content and relationship to the modern channel. Unit I sediments are much sandier
Figure 5.5. Particle size data and loss on ignition results from profile LT-18.
Figure 5.6. Particle size data and loss on ignition results from profile LT-33.

53 Chapter 5 – Alluvial Stratigraphy
(40% or more) here than elsewhere in the study area. The sand fraction is very fine, moderately to very well sorted, and angular to subangular. In addition, Unit I here appears to thin somewhat and become finer grained with distance from the channel. It varies from a fine sandy loam within a few meters of the river, to a loam at about 25 meters, to a silt loam at approximately 55 meters from the river. Beginning at the southeast end of Transect 3 and ending at the present river channel, the land surface rises about 1 meter over this distance. The third facies of Unit I is the laterally accreted point bar deposit located on Transect 3 on the northwest bank of the river. This sediment was not described or sampled except to collect samples of the modern river sediments. Unit I soils are the youngest in the study area. Field profiles describe the soils as very dark brown silt loam with moderate fine subangular blocky or moderate medium crumb structure. The A horizon is 20-30 cm thick. Loss on ignition analysis revealed ca. 5.6% organic matter at LT-33, and a maximum of 15.4% organic matter at LT-18. Many Unit I profiles contain fine roots, common fine pores, and faint fine orange mottles.
Figure 5.7. Transect 1 cross-section, showing detail of stratigraphy between profiles LT-7 to LT-19.

The Long Tom and Chalker Sites 54
Stratigraphic Unit II In most of the study area, Unit II is a silty clay loam, clay loam or silty clay. In general, these sediments are approximately 25-35 cm thick and contain less than 20% sand. Where buried, the upper boundary of Unit II, corresponding to the lower boundary of Unit I, occurs at about 45 cm below the current land surface, and the lower boundary ranges in depth from 60-82 cm below the surface. Boundaries between Unit II and underlying Unit III are generally clear and smooth or wavy. Unit II is discontinuous on Transect 1, and is thought to form the surface layer on Transects 2 and 3 Northwest. On Transect 1, north of the Long Tom site, Unit II is a layer 25-35 cm in thickness draped over the broadly undulating upper surface of Unit III. A lens of Unit II sediment appears northwest of the young point bar deposits on Transect 3, and southeast of the present channel, where it is about 20 cm thick. Unit II contains 4 to 14% very fine sand which is generally well sorted, angular to subangular. Lithologic composition is similar to Unit I sands. Most of Unit II appears to consist of a single facies--flood basin deposits. On Transect 3 Southeast, however, Unit II fines with increasing distance from the channel as is typical of natural levee deposits. The geometry of these sediments for a wedge shape with the blunt edge along the river bank (Figure 5.10). Therefore, this unit--as well as Units I and probably III--seem to be natural levee deposits in this part of the study area. Where Unit II soils form the present surface, they are somewhat more strongly developed than Unit I soils. Unit II soils are clay loams or silty clay loams with color ranging from very dark brown at the surface to dark yellowish brown where buried. Structure is strong fine subangular blocky or crumb to moderated medium subangular blocky where buried. A few thin argillans, few orange mottles, and common fine pores are seen. Loss on ignition testing showed less organic matter in the upper part of buried Unit II soils than in the surface horizons of exposed Unit I soils. Radiocarbon dates indicate that Unit I and II soils are contemporaneous with the Ingram geomorphic surface in the Willamette Valley, where Balster and Parsons (1968) estimate (from radiocarbon evidence) that development began before about 3500 years ago and partial abandonment as an active floodplain may have begun no earlier than 555 BP (Balster and Parsons 1968). This compares with a maximum age of 3360 cal BP (3120±280 BP) for Units I and II in the study area.
Figure 5.8. Transect 2 cross-section. Boundaries and unit designations have been omitted due to lack of definitive evidence. Soil textures are included to show range and stratigraphic
relationships.

55 Chapter 5 – Alluvial Stratigraphy
Stratigraphic Unit III Unit III sediments are loam, sandier than the overlying units, and containing varying amounts of fine and very fine sand. Unit III is discontinuous on Transect 1 where it disappears on the southern end. On Transect 3 Southeast, Unit III is 25-45 cm thick, though in places seems to disappear. The upper boundary varies in depth while the lower boundary is quite level: at about 105 cm below the surface along Transect 1 and approximately 130 cm on Transect 3 Southeast. the upper boundary with Unit II is clear, indistinct, and irregular, with much bioturbation. The boundary with underlying Unit IV is clear to gradual and wavy or irregular. The sand fraction of Unit III is fine to very fine, moderately to well sorted, and angular to subangular. The lithology is generally similar to that of Units I and II. On Transect 1 and Transect 3 Southeast, Unit III sediments are probably a natural levee deposit. It is with these levee deposits, at the south end of Transect 1, that the main occupations at the Long Tom site are associated. On Transect 2 and Transect 3 Northeast, Unit III consists of flood basin deposits, very clayey and low in sand content. Unit III soils are typically dark yellowish brown with moderate to strong medium subangular blocky structure at the surface of the unit. Common argillans are seen on ped faces and in tubules. Many profiles have distinct orange brown or brown mottles and few fine iron or manganese nodules. At LT-18, 2% of the soil is composed of organic material, and at LT-33 2.6% of the soil is organic. In context with the overlying soil, it appears that most of the pedogenic characteristics in this unit are due to overprinting, with relatively little soil development identified with this stratigraphic unit. Twelve radiocarbon dates from cultural contexts in Unit III sediments in the Country Fair/Veneta Project area provide an age range of 5300 to 4100 cal BP (Figure 5.11). Unit III soils appear to have formed during the transition period between Ingram and Winkle surfaces, which Balster and Parsons (1968) say occurred between approximately 6000 and 3500 years ago. During this time, the Winkle surface was abandoned as a floodplain and the Ingram surface began deposition. Unit III sediments were deposited on an erosional unconformity, the upper boundary of Unit IV. It appears that Unit III sediments were subject to erosion during the transition, and were deposited relatively rapidly toward the end of this period. The discontinuous and irregular boundary with Unit II suggests the upper boundary of Unit III may also be erosional.
Figure 5.9. Transect 3 Northwest cross-section. Unit designations are provisionally assigned due to absence of radiocarbon dates in this section of the study area.

The Long Tom and Chalker Sites 56
Stratigraphic Unit IV
Unit IV is a loam, varying in texture from silty clay loam to fine sandy loam along Transect 1. On Transect 3, Unit IV is a silty clay. Unit IV thickness ranges from about 30 cm on the southeast end of Transect 3, to 90 cm or more on Transect 1. The boundary with Unit III is clear and quite level. The lower boundary is clear, smooth, and indistinct on Transect 3 Southeast, and clear to abrupt and distinct on Transect 1. No description of linear character of the lower boundary of Unit IV was obtained on Transect 1 as it was not exposed in a trench. Depth of the lower boundary ranges from about 160-210 cm below the surface. The sand fraction of Unit IV is very fine, well sorted, subangular
sand at LT-18 and in the lower part of Unit IV at LT-33. The upper portion of Unit IV at LT-33 is more poorly sorted, has more iron concretions, and has a higher quartz:feldspar ratio. These characteristics suggest that more pedogenic alteration of the upper part of Unit IV deposits has occurred at LT-33. Along Transect 1, Unit IV sediments are similar in texture to those in Unit III, but tend to fine downward. On Transect 3 Southeast, these sediments are very different in texture from the Unit III sediments. The clayey Unit IV sediments of Transect 2 and both ends of Transect 3 are probably flood basin deposits. On Transect 1, this facies may represent a natural levee environment or possibly flood basin deposits which were nearer the channel. Unit IV soils are dark yellowish brown, in some cases slightly redder than the overlying unit. Structure is generally moderate medium subangular blocky, but a great range is seen throughout the study area. In most profiles, common argillans have formed on ped faces and in tubules. Common fine and medium pores and iron and manganese nodules are found. In a few cases, laminations and other depositional features have been preserved near the bottom of the unit. Percentage loss on ignition of the upper parts of Unit IV is similar to that of Unit III. Unit IV soils are moderately developed, with evidence of pedogenic development while this surface was subaerially exposed indicated by stronger and finer structure, and colors that have lower value or higher chroma, compared to the overlying deposits. Three radiocarbon dates were obtained from Unit IV sediments. In Trench C2, dark amorphous organic material containing charcoal was collected from Feature C4 and dated at 10,040 cal BP (9130±200 BP; Beta 28780). Feature C4 is located just below the upper boundary of Unit IV (Figure 5.11). Feature D1 in Trench D3, Transect 1, was radiometrically dated at 8400 cal BP (7690±80 BP; Beta 28782, ETH-4763). This is an accelerator date on charcoal collected on the east wall of the trench at 95-100 cm below the surface. This date probably comes from the surface of Unit IV. The third radiocarbon assay is derived from charcoal collected from a cultural feature at the Long Tom site with an age of 9910 cal BP (8890±120 BP).
Stratigraphic Unit V Unit V is a dense clay layer that is partly pedogenic rather than depositional in origin. This unit typically contains more than 50% clay, which increases with depth at LT-18 and LT-33. Unit V is probably over 1 meter thick and its upper boundary is 1.6 to 3.4 meters below the modern land surface. No definite lower boundary was observed. On Transect 3, the clay of Unit V was underlain, about 2.5 meters below the surface, by a fine sandy loam that is probably simply a different facies of Unit V. In Trench B2 where the lower boundary of the dense clay was visible, it was clear, smooth, and distinct.
Figure 5.10. Transect 3 Southeast cross-section. Cartoon shows geomoetry of stratigraphy in relation to present land surface and modern river channel. The wedge-like shape of these sediment layers is evidence
of a natural levee deposit.

57 Chapter 5 – Alluvial Stratigraphy
The sand content of Unit V is everywhere less than 15%, and commonly less than 2%. The sediments of Unit V are all very fine grained throughout the study area. The unit probably is composed of a single facies of flood basin deposits, altered by soil development. This buried soil probably developed over several thousand years. The clay content is very high, up to 70% at the bottom of LT-18, with less than 1% sand. This strongly suggests that a good portion of the clay was weathered from the parent material in situ, a process which requires at minimum several thousand years (Birkeland 1984:208). Unit V is a clearly defined clayey paleosol which is found in most parts of the study area. It is characterized by stronger, finer structure and darker or redder color, compared to the overlying units. On Transect 1, the structure is strong to moderate fine subangular blocky, but on Transect 3 Southeast, where it underlies another clayey paleosol formed in Unit IV, it is weak to moderate medium subangular blocky. This soil has developed common to many iron and manganese nodules and common argillans. Where most strongly developed at LT-7, the surface layer is a black, midden-like sediment. Although no cultural material or charcoal was contained in the sediment, there was sufficient organic material for the sample to be radiocarbon-dated as a bulk soil sample. The resulting age of 10,990 cal BP (9820±140 BP; Beta 28783) can be interpreted as the average radiocarbon age of the humus in the sample. It represents the mean residence time of the humus in the ancient soil at the time of burial, plus the time elapsed since burial. Two other radiocarbon dates are associated with Unit V, both obtained from the southeast end of Transect 3. In Trench C2 at Feature C1/C2, charcoal just beneath the upper boundary of Unit V has an age of 10,910 cal BP (9660±140 BP; Beta 28799). In Trench B2 (Figure 5.12) at Feature B8, charcoal from 10 cm below the upper boundary of Unit V produced a date of 10,500 cal BP (9485±90 BP; Beta 28777, ETH-4762). In contrast to the bulk soil radiocarbon assay, the two dates obtained from charcoal represent the times of death of the trees from which the charcoal came. The residence time of humus in soil depends on a number of factors including climate, vegetation and other organic input, texture of the parent material, and how long the soil has been forming. The effect of these factors in western Oregon is unknown, so no quantitative estimate of soil humus residence time can be made. The mean age of soil humus in A horizons of surface soils in the central U.S. is 200 to 850 radiocarbon years (Buol et al. 1989:166; Birkeland 1984:150). Ruhe (1983) reports the ages of A-horizon organic carbon from two Mollisols in Iowa, one well-drained and the other more poorly drained, are 440 ± 120 BP and 270 ± 120 BP, respectively (Ruhe 1983:15). The humus date, therefore, probably represents a time at least several hundred years older than the time of burial of the soil. Assuming that the charcoal collected from Unit V dates from late in the period of soil development and just shortly before burial of the Unit V land surface, the
Figure 5.11. Trench C2 cross-section. Trench C2 is located near the City of Veneta lagoon at the southeast end of Transect 3 and adjacent to site 35LA625, the Stamp site. Cultural features are marked by numbers 1 through 12. Feature C6 is a camas roasting oven dated 4860 cal BP in Unit III; Feature C4, within Unit IV, dated 10,400 cal BP; and within Unit V, Feature C1/C2 dated 10,910 cal BP. Soil profile LT-32 was on the
east wall of the trench opposite C1/C2, and LT33 was just north of Feature 8.

The Long Tom and Chalker Sites 58
humus date should represent a time slightly older than the two charcoal dates. The soil humus date, therefore, seems stratigraphically consistent with the charcoal dates. Together, these dates indicate Unit V was an exposed land surface from sometime before 11,000 years ago until shortly after 10,500 years ago.
Summary of Stratigraphic Units and Floodplain History The alluvial sediments of the Long Tom River near Veneta have been provisionally divided into five stratigraphic units. It must be noted that these are generalized subdivisions; in some cases more than one depositional unit was seen within a stratigraphic unit, but these were combined in order to simplify and clarify the overall geomorphic history of the floodplain. Unit I consists of three facies; a thin layer of silty vertically accreted flood basin deposits, natural levee deposits, and much thicker recent point bar deposits near the present river channel. It has weakly to moderately developed surface soils. Most of this unit was probably deposited within the last few hundred years, in the area of intermittently active floodplain accretion at this time. Unit II consists of discontinuous bodies of vertically accreted flood basin deposits dating from sometime after 4000 BP to ca. 950 BP. Eight of the nine radiocarbon dates from this unit are 2000 years or later; the absence of sediments in the ca. 4000-2000 year age range, and evidence of erosion of the underlying Unit III surface, suggest a period of erosion during this interval. Unit II has moderately developed clay loam soils where it forms the surface layer and where buried by Unit I. Due to their similarity and lack of radiocarbon dates or cultural features, assignment of unit designations for I and II are tentative for soils along Transects 2 and 3 Northeast. Unit III consists of sediment that appears to have been deposited quite rapidly between 5300 and 4300 years ago on an erosional unconformity which formed the surface of Unit IV. Most of the soil development observed in Unit III is probably attributable to overprinting from soil profiles developed in Unit II. Evidence suggests that the surface of Unit III also was subject to erosion. Its upper boundary is irregular, and cross-section profiling of Trench C2 revealed that Unit III is discontinuous on the north end of the trench. The irregularity of the upper boundary may also be attributed to the great amount of bioturbation seen at both ends of the study area, but this cannot account for the unit's discontinuity. Radiometric dating provides strong evidence for the erosional unconformity underlying Unit III. In Trench C2, a camas oven dated at 4860 cal BP is only 5 cm above the Unit IV
Figure 5.12. Trench B2 cross-section. Trench B2 is located in the City of Veneta lagoon on the east end of the study area. During excavation of the lagoon, about 1.5 meters of soil were removed, so the Unit III surface shown is 1.5 meters below the original land surface. Cultural deposits, mainly fire hearths, are indicated by
numbers 8 through 22 in boxes. Trench B4 was excavated perpendicular to B2 to investigate the swale. Soil profile LT-34 was located next to Profile Column B1, which produced cultural
material in Feature B8 --radiocarbon dated at 10,500 cal BP (Peterson 1989).

59 Chapter 5 – Alluvial Stratigraphy
surface which has been dated at 10,040 cal BP on charcoal from a small hearth feature only a few meters away. A possible scenario is that the sediments representing the period between 8400 years ago (end of deposition and beginning of stability of Unit IV) to about 5300 years ago (minimum date for beginning of deposition of Unit III) were washed away in one or more flood events. In addition to the geomorphic evidence of erosion, the dated human occupation record of the study area has a 3000 year hiatus during this interval. It seems unlikely that the area would be abandoned by people for 3000 years, then re-occupied. The sediments of Unit IV are vertically accreted flood basin deposits with a weakly to moderately developed clayey soil. The upper surface forms an erosional unconformity with Unit III. Dates on Unit IV span an approximately 1600 year period, from 10,040 to 8400 years ago. It is likely, however, that deposition did not occur continuously over this period. There is some evidence of pedogenic development at the surface during part of this period. Deposition of Unit IV may have been concentrated mainly between 10,500 and 10,000 years ago, followed by stability and only localized deposition up to 7700 years ago. Unit V consists of fine flood basin alluvium, with a well developed clayey paleosol formed in it. This unit varies in thickness from one end of the study site to the other, and it overlies sandier sediments at the eastern end. Cultural and soil dates indicate that deposition was essentially complete and subaerial exposure began by at least 10,500 to 11,000 years ago, but no date on the beginning of deposition has been obtained from the study area. Correlation with the Winkle geomorphic surface of the Willamette Valley indicates that deposition probably began after 13,000 years ago. Based on stratigraphic and sedimentological analysis of cores and profiles throughout the study area, and fixed with 33 radiocarbon ages, a floodplain history of the study area may be summarized as follows: 1) Deposition of the oldest sediments (Unit V) observed in this study began prior to 11,000 years ago. It is
probable that these sediments post-date major geomorphic changes that occurred in the Willamette Valley at about 13,000 years ago.
2) A period of stability (nondeposition) allowed soil formation to occur on the surface of Unit V. 3) A brief period of deposition (Unit IV) followed, ending perhaps as early as 10,000 years ago, but certainly
by 8400 years ago. During the latter part of this time was a period of stability during which some soil development occurred.
4) The next 3100 years are not well understood. At some time between 8400 and 5300 years ago, a major
period of erosion occurred. It is possible that some deposition occurred early in this 3100 years, and erosion was concentrated toward the end, but no direct evidence for this was discovered in the study area.
5) Between 5300 and 4300 years ago, a relatively sandy layer was deposited. Some of this layer appears to
have been removed by erosion during or after deposition. This sediment probably was not a stable surface for very long. The dynamic landscape represented by Unit III appears to have attracted human occupation, as represented by; the cultural record at the Long Tom site.
6) Evidence of erosion of the Unit III surface, and the rarity of radiocarbon ages in the 4300-2000 year time
frame, suggests a period of degradation. 7) Another period of deposition began sometime after 4300 years ago, but before 2100 years ago, and lasted
until 1100 years ago. 8) This period of accretion was followed by a time of stability during which soils began to form. In some
areas of the study site, this depositional layer is still subaerially exposed. 9) Beginning sometime after 1100 years ago the youngest floodplain sediments began deposition which is
continuing intermittently up to the present time. Floodplain morphology of the Long Tom River is dominated by vertically accreted deposits. This contrasts strongly with the commonly encountered floodplain, which is predominantly composed of laterally accreted point bar sediments. The meander belt of the Long Tom River is narrow, covering only 15% of the floodplain; the channel is deep and stable. This unique floodplain morphology has resulted in preservation of 11,000 years of

The Long Tom and Chalker Sites 60
vertically stratified cultural deposits. Further research will be required to identify the intrinsic and extrinsic controls influencing this unusual pattern. The Willamette River tends to rework its floodplain sediments through lateral migration, in the process destroying evidence of cultural occupation which may be buried in these sediments. The prehistoric development of the Long Tom river floodplain, as described above, and the exceptional stability of the Long Tom river trough, may be characteristic of other western tributaries of the Willamette River, where they exit the Coast Range. Sharing a similar geologic and climatic past, such areas may prove to be richer in prehistoric cultural remains than the main Willamette Valley--if the unusual predominance of vertically accreted sediments as observed in the Long Tom floodplain is found also in these other tributaries.

Chapter 6
Magnetometer Survey at the Long Tom and Chalker Sites
Thomas J. Connolly
Although preliminary testing at the Long Tom Site resulted in the recovery of relatively few formed tools and a low density of lithic debris, abundant evidence of prehistoric cultural activity was found to be present throughout the site in the form of rock and charcoal features. Such features are common in Willamette Valley archaeological sites, and are generally thought to be the remains of camas processing ovens such as those described in a number of ethnographic and ethnohistoric sources (Clyman 1960, Smith 1986, Zenk 1976). Testing at the Long Tom Site showed that these features were dispersed over a large area (approximately 9300 square meters, or 2.3 acres). As a means of locating widely scattered cultural features buried beneath the sediments of a topographically featureless alluvial plain, a magnetometer survey was implemented. While camas ovens were not encountered during initial testing of the Chalker Site, scattered rock suggested their presence. A magnetometer survey was also carried out at this site to aid in the possible discovery of such features, and to provide a comparative data set for the Long Tom Site.
Principles of Magnetic Surveying Differences in the magnetic properties between cultural features and their surrounding sediment matrix may be of a measurable magnitude. Such differences can be detected with the aid of a magnetometer, an instrument capable of measuring the intensity of the earth's magnetic field at a particular point. Buried cultural features have the potential of being detected as magnetic perturbations, or anomalies, in the total magnetic field in the area of interest (Weymouth and Nickel 1977; Hathaway and Burtchard 1986). Magnetism may be induced in cultural features by heating. Prior to heating, molecular components of minerals with high magnetic susceptibility (such as magnetite and hematite), which are naturally present in rocks
Figure 6.1. Graph of magnetic field intensity measured near the Long Tom site on August 8, 1986, showing normal diurnal changes between 8:53 a.m. and 2:46 p.m., and an atmospheric anomaly occurring at 2:37
p.m.

The Long Tom and Chalker Sites 62
Table 6.1. Comparison of on-site (Block N) and base station readings,Long Tom site, August 12, 1986.
Base Station On-Site Magnetometer -------------------------------------------------------------- -------------------------------------------------------------------------- Day Time Reading Intensity Line Day Time Station Intensity 224 16:20:38 85 54178.7 9 224 16:19:54 171 54176.3 224 16:21:08 86 54178.9 9 224 16:19:59 172 54173.6 224 16:21:38 87 54178.8 9 224 16:20:06 173 54169.8 224 16:22:08 88 54178.9 9 224 16:20:11 174 54167.8 224 16:22:38 89 54179.0 9 224 16:20:18 175 54166.2 224 16:23:08 90 54179.0 9 224 16:20:23 176 54169.2 224 16:23:38 91 54179.2 9 224 16:20:28 177 54165.4 224 16:24:08 92 54179.2 9 224 16:20:34 178 54168.5 224 16:24:38 93 54179.3 9 224 16:20:39 179 54171.7 224 16:25:08 94 54179.2 9 224 16:20:45 180 54165.1 224 16:25:38 95 54179.2 9 224 16:20:51 181 54164.6 224 16:26:08 96 54179.2 9 224 16:20:57 182 54156.9 224 16:26:38 97 54179.3 9 224 16:21:02 183 54153.6 224 16:27:08 98 54179.4 9 224 16:21:08 184 54152.0 224 16:27:38 99 54179.7 9 224 16:21:14 185 54192.1 224 16:28:08 100 54179.6 9 224 16:21:19 186 54224.0 224 16:28:38 101 54179.6 9 224 16:21:26 187 54220.9 224 16:29:08 102 54179.9 9 224 16:21:31 188 54180.7 224 16:29:38 103 54179.8 10 224 16:22:16 189 54178.7 and sediments, tend to be more or less randomly oriented. During heating, especially at high temperatures, these molecular components tend to become reoriented, aligning themselves with the earth's magnetic field and thus parallel to each other. This alignment results in a net magnetization of the feature, and serves to locally amplify the earth's magnetic field. This local magnetization of a feature stands out as a magnetic intensity contrast, or anomaly, from the ambient magnetic field (Breiner 1973). Differences in sediment textures, compaction, and chemical makeup of soils can also produce magnetic readings of contrasting intensity. Cultural activities that result in such differences, such as housepit construction or midden accretion, may produce discernable magnetic intensity contrasts. A magnetometer survey was conducted over an area of 6800 square meters (1.68 acres) of the Long Tom site, representing that portion of the 9300 square meter site to be directly affected by the proposed highway construction. Magnetometer survey was also conducted over the entire area of the Chalker site (ca. 600 square meters). Two proton precession magnetometers were employed for the study (EG&G Geometrics Model 856), which are capable of reading the earth's magnetic field as an absolute value measured in gammas with an accuracy of 0.1gamma. One instrument was used as a mobile device to record on-site magnetic readings. The other was set up as a stationary off-site standard to record the ambient magnetic field at regular time intervals. The intensity of the earth's magnetic field changes during the course of a day by values that can be as great or greater than the magnetic anomalies we hope to detect, so measurement of a correction for this diurnal flux is essential. Magnetic storms may also cause anomalous readings that could be mistakenly interpreted as subsurface magnetic anomalies without an off-site standard to record natural perturbations of the field. Figure 6.1 provides a graph of diurnal changes in magnetic field intensity measured near the Long Tom site between 8:43 a.m. and 2:46 p.m. on August 8, 1986. Also recorded on Figure 6.1 is an atmospheric anomaly, that lasted just over two minutes from 2:36 to 2:38 p.m. (14:36-14:38). This atmospheric anomaly provided readings of approximately 110 gammas below the normal field readings, and would have appeared as a strong negative anomaly on the magnetic site map had there not been an off-site base station to independently record this irregularity. Both magnetometers are synchronized by built-in Julian clock monitors which measure the exact time of each reading. The off-site base station is set to automatically record magnetic readings at a set time interval (we used 20 and 30 second intervals) so that on-site readings may be corrected against nearly simultaneous readings.

63 Chapter 6 – Magnetometer Survey
Figu
re 6
.2.
Topo
grap
hic
map
of t
he L
ong
Tom
site
, sho
win
g ve
geta
tion,
hig
hway
stat
ions
and
mag
neto
met
er b
lock
s.

The Long Tom and Chalker Sites 64
Both base station and on-site magnetometers had internal memory capacity, to record the magnetic field value in gammas and attendant temporal and physical provenience values. For both base station and on-site instruments, Julian calendar day and time of day were stored as a means of relating recorded magnetic values. Additionally, line number and sequent reading numbers were assigned to values recorded by the on-site instrument, that directly corresponded to points on the provenience grid established over the sites (see Table 6.1). The targeted survey areas were sectioned into 20 x 20 meter blocks, which are convenient survey units that have become standard in magnetometer mapping of archaeological sites (Weymouth and Nickel 1977; Weymouth and Huggins 1985; Hathaway and Burtchard 1986). Readings were taken at one meter intervals in all surveyed areas, with a sensor height of 50 cm above the ground. Each 20 x 20 meter block contained 441 (21 x 21) data points, and half blocks (10 x 20 meters) contained 231 (11 x 21) data points. In open areas four whole blocks could be easily surveyed in a single day, while in areas of dense brush only two blocks per day were completed. Each 20 x 20 meter block was surveyed as a series of 21 lines, each with 21 data points. At the beginning of each line, a line number was manually entered into the magnetometer memory, and data point readings were stored in sequence by line number. Software was provided with the magnetometers (EG&G Geometrics Magpac version 4.1.0) that provided simple menu-driven programs to: 1) Transfer field data from the magnetometer memory to micro-computer data files, using a standard
RS-232 serial input terminal; 2) Generate data files corrected for diurnal variation from on-site and base station files; and
3) Generate variable density contour maps with unlimited options for setting contour intervals and starting contour level.
The Long Tom Site The provenience grid established over the Long Tom site was referenced to the system of highway stations (sta.) which marked the proposed highway centerline. Highway station 354+00 was the primary grid reference point (Figure 6.2). The proposed centerline, which was oriented 113o 6' west of magnetic north from sta. 354 across the site, served as the grid baseline. Beginning at sta. 354 and progressing in a westerly direction, a series of 20 meter square blocks was marked on either side of the baseline for a distance of 200 meters. This represented the area of the site to be directly affected by the highway construction. For the magnetometer survey, each block established within the grid was assigned a letter designation, A through S, beginning with the southeastern-most block and proceeding clockwise to the northeastern-most block (see Figure 6.2). Half blocks (10 x 20 meters) were surveyed in cases where a significant portion of a 20 meter square block extended beyond the estimated site boundary. Fifteen whole blocks and four half blocks were surveyed at the Long Tom Site. Isomagnetic contour maps that reflect patterns of magnetic intensity throughout the Long Tom Site are presented in Figures 6.3 through 6.5. Magnetic anomalies within each block were identified on the maps and recorded (Table 6.2). A total of 173 anomalies were isolated, including 70 with dipolar signatures (adjacent positive and negative readings), 93 with positive monopolar signatures, and 10 with negative monopolar signatures. Dipolar anomalies produce a field with both positive and negative components with respect to the ambient magnetic field intensity. Monopolar anomalies appear as single pole positive or negative fields. Some of the patterns observed on the magnetic maps can be accounted for by observations of surface topography and features in the site area. First, the northern portion of the mapped area was in an open field mowed annually for hay, while the southern portion was within a zone of riparian vegetation including oak, fir, maple, ash, and a thick understory of brushy shrubs. Probably due in part to different moisture content of soils in each of these areas, and in part to soil density due to root activity, magnetic values are slightly higher in the southern (riparian) portion of the site than they are to the north. The boundary between these areas of differing background magnetic intensity varies from approximately 63N at the east end of the site to approximately 70N at the west end of the site. A second anomaly of natural origin is observable at the west end of the site. The former channel of the Long Tom River is recorded as a distinct negative anomaly, while the adjacent remnant levee is recorded as an arc producing a strong positive magnetic field. This positive field is probably related to different density and texture of the sediments associated with the levee, but may be also due to charcoal and midden deposits from prehistoric cultural activity found in some areas of the remnant levee.

65 Chapter 6 – Magnetometer Survey
Figu
re 6
.3.
Mag
neto
met
er m
ap o
f the
eas
tern
por
tion
of th
e Lo
ng T
om si
te (s
urve
y bl
ocks
B-D
, rig
ht to
left
acro
ss th
e bo
ttom
, and
bl
ocks
Q-S
, lef
t to
right
acr
oss t
he to
p).
The
boun
dary
bet
wee
n th
e op
en fi
eld
to th
e no
rth a
nd b
rush
y ar
ea to
the
sout
h is
visi
ble
in u
nits
B
-D; m
ost o
f the
ano
mal
ies i
n th
ese
low
er b
lock
s rpr
esen
t bal
ing
wire
and
oth
er m
etal
lic d
ebris
.

The Long Tom and Chalker Sites 66
Figu
re 6
.4.
Mag
neto
met
er m
ap o
f the
cen
tral p
ortio
n of
the
Long
Tom
site
(sur
vey
bloc
ks E
-G, f
rom
righ
t to
left
acro
ss th
e bo
ttom
, and
bl
ocks
N-P
, fro
m le
ft to
righ
t acr
oss t
he to
p).

67 Chapter 6 – Magnetometer Survey
Figu
re 6
.5.
Mag
neto
met
er m
ap o
f the
wes
tern
por
tion
of th
e Lo
ng T
om si
te (s
urve
y bl
ocks
H-J
, fro
m ri
ght t
o le
ft ac
ross
the
botto
m, a
nd
bloc
ks K
-M, l
eft t
o rig
ht a
cros
s the
top)
.

Tabl
e 6.
2. S
umm
ary
of m
agne
tic a
nom
alie
s rec
orde
d at
the
Long
Tom
site
.
A
nom
aly
Sum
mar
y Fe
atur
e Su
mm
ary
Ano
mal
y Su
mm
ary
Feat
ure
Sum
mar
y N
umbe
r C
ente
r In
tens
ity
Type
N
umbe
r
Type
C
ente
r D
epth
Dia
met
er
Num
ber
Cen
ter
Inte
nsity
Ty
pe
Num
ber
Typ
e C
ente
r D
epth
D
iam
eter
A
1 54
N,2
1W
130
Dip
olar
--
U
ndet
erm
ined
--
--
--
E3
55
N,1
02W
14
2 D
ipol
ar
--
Und
eter
min
ed
--
--
--
A
2 59
N,2
1W
75
Dip
olar
--
U
ndet
erm
ined
--
--
--
E4
66
N,1
05W
81
M
onop
olar
--
U
ndet
erm
ined
--
--
--
A3
58N
,39W
16
7 D
ipol
ar
--
Und
eter
min
ed
--
--
--
E5
61N
,105
W
20
Dip
olar
--
U
ndet
erm
ined
--
--
--
B1
61N
,45W
38
M
onop
olar
--
U
ndet
erm
ined
--
--
--
E6
58
N,1
05W
53
D
ipol
ar
--
Und
eter
min
ed
--
--
--
B
2 58
N,4
8W
102
Dip
olar
--
U
ndet
erm
ined
--
--
--
E7
52
N,1
05W
-6
8 M
onop
olar
--
B
H tr
ench
14
50.0
N,1
06.0
W
--
60
B
3 59
N,4
9W
93
Dip
olar
--
U
ndet
erm
ined
--
--
--
E8
53
N,1
06W
47
M
onop
olar
--
U
ndet
erm
ined
--
--
--
B4
56N
,49W
24
M
onop
olar
--
U
ndet
erm
ined
--
--
--
E9
60
N,1
07W
24
D
ipol
ar
--
Und
eter
min
ed
--
--
--
B
5 60
N,5
2W
58
Dip
olar
--
U
ndet
erm
ined
--
--
--
E1
0 58
N,1
08W
-8
0 M
onop
olar
--
B
H tr
ench
5
57.5
N,1
08.0
W
--
60
B
6 54
N,5
2W
97
Dip
olar
--
U
ndet
erm
ined
--
--
--
E1
1 56
N,1
07W
20
M
onop
olar
--
U
ndet
erm
ined
--
--
--
B7
56N
,53W
31
M
onop
olar
--
U
ndet
erm
ined
--
--
--
E1
2 58
N,1
11W
54
M
onop
olar
--
U
ndet
erm
ined
--
--
--
B8
53N
,55W
53
D
ipol
ar
--
Und
eter
min
ed
--
--
--
E13
54N
,111
W
166
Dip
olar
--
U
ndet
erm
ined
--
--
--
B9
62N
,57W
44
D
ipol
ar
--
Und
eter
min
ed
--
--
--
E14
57N
,113
W
35
Mon
opol
ar
--
Und
eter
min
ed
--
--
--
B
10
59N
,59W
10
8 D
ipol
ar
--
Und
eter
min
ed
--
--
--
E15
55N
,115
W
223
Dip
olar
--
U
ndet
erm
ined
--
--
--
C1
63N
,62W
34
M
onop
olar
--
U
ndet
erm
ined
--
--
--
E1
6 62
N,1
16W
37
M
onop
olar
--
U
ndet
erm
ined
--
--
--
C2
53N
,63W
85
D
ipol
ar
--
Bal
ing
wire
54
.0N
,62.
5W
0-3
--
E17
56N
,117
W
53
Mon
opol
ar
--
Und
eter
min
ed
--
--
--
C
3 50
N,6
3W
-75
Mon
opol
ar
--
BH
tren
ch 2
50
.0N
,63.
0W
--
60
E18
50N
,117
W
30
Mon
opol
ar
--
Und
eter
min
ed
--
--
--
C
4 60
N,6
4W
251
Dip
olar
--
B
alin
g w
ire
61.0
N,6
4.0W
0-
3 --
E1
9 67
N,1
19W
11
2*
Mon
opol
ar
--
Und
eter
min
ed
--
--
--
C
5 61
N,6
7W
53
Dip
olar
--
U
ndet
erm
ined
--
--
--
E2
0 64
N,1
19W
18
* M
onop
olar
--
U
ndet
erm
ined
--
--
--
C6
58N
,67W
13
2 D
ipol
ar
--
Und
eter
min
ed
--
--
--
E21
60N
,119
W
309*
D
ipol
ar
--
Und
eter
min
ed
--
--
--
C
7 61
N,7
0W
350
Dip
olar
--
B
alin
g w
ire
61.0
N,7
0.0W
0-
3 --
E2
2 56
N,1
19W
79
* M
onop
olar
--
U
ndet
erm
ined
--
--
--
C8
54N
,70W
17
M
onop
olar
2
Ove
n 54
.0N
,70.
0W
63-9
8 12
0 F1
62
N,1
21W
23
M
onop
olar
--
U
ndet
erm
ined
--
--
--
C9
59N
,72W
29
3 D
ipol
ar
--
Und
eter
min
ed
--
--
--
F2
52N
,122
W
30
Mon
opol
ar
--
Und
eter
min
ed
--
--
--
C
10
58N
,75W
11
7 D
ipol
ar
--
Und
eter
min
ed
--
--
--
F3
60N
,125
W
179
Dip
olar
--
B
alin
g w
ire
60.0
N,1
25.0
W
0-3
--
C
11
62N
,80W
42
D
ipol
ar
--
Und
eter
min
ed
--
--
--
F4
55N
,124
W
26
Mon
opol
ar
4 O
ven
55.5
N,1
24.0
W
63-
80
110
D
1 65
N,8
2W
97
Dip
olar
--
U
ndet
erm
ined
--
--
--
F5
50
N,1
24W
-1
8 M
onop
olar
--
B
H tr
ench
6
50.0
N,1
24.0
W
--
60
D
2 58
N,8
2W
11
Mon
opol
ar
--
Und
eter
min
ed
--
--
--
F6
57N
,129
W
51
Mon
opol
ar
--
Und
eter
min
ed
--
--
--
D
3 50
N,8
2W
16
Mon
opol
ar
--
Und
eter
min
ed
--
--
--
F7
52N
,129
W
59
Dip
olar
--
U
ndet
erm
ined
--
--
--
D4
63N
,84W
25
D
ipol
ar
--
Und
eter
min
ed
--
--
--
F8
57N
,131
W
63
Mon
opol
ar
--
Und
eter
min
ed
--
--
--
D
5 59
N,8
6W
276
Dip
olar
--
B
alin
g w
ire
59.5
N,8
5.0W
0-
3 --
F9
52
N,1
31W
23
3 D
ipol
ar
--
Und
eter
min
ed
--
--
--
D
6 61
N,8
7W
89
Dip
olar
--
B
alin
g w
ire
61.0
N,8
6.5W
0-
3 --
F1
0 61
N,1
32W
40
M
onop
olar
--
U
ndet
erm
ined
--
--
--
D7
50N
,87W
11
2 D
ipol
ar
--
Und
eter
min
ed
--
--
--
F11
65N
,133
W
108
Dip
olar
--
U
ndet
erm
ined
--
--
--
D8
58N
,88W
24
1 D
ipol
ar
--
Bal
ing
wire
58
.5N
,87.
5W
0-3
--
F12
62N
,138
W
48
Dip
olar
--
U
ndet
erm
ined
--
--
--
D9
60N
,91W
26
M
onop
olar
--
U
ndet
erm
ined
--
--
--
F1
3 63
N,1
40W
32
M
onop
olar
--
U
ndet
erm
ined
--
--
--
D10
62
N,9
3W
316
Dip
olar
--
B
alin
g w
ire
62.0
N,8
2.5W
0-
3 --
G
1 56
N,1
40W
7
Mon
opol
ar
--
Und
eter
min
ed
--
--
--
D
11
64N
,95W
20
9 D
ipol
ar
--
Bal
ing
wire
64
.5N
,94.
5W
0-3
--
G2
68N
,142
W
14
Mon
opol
ar
--
Und
eter
min
ed
--
--
--
D
12
63N
,96W
19
D
ipol
ar
--
Und
eter
min
ed
--
--
--
G3
55N
,143
W
9 M
onop
olar
--
U
ndet
erm
ined
--
--
--
D13
59
N,9
7W
294
Dip
olar
--
U
ndet
erm
ined
--
--
--
G
4 50
N,1
45W
29
M
onop
olar
--
U
ndet
erm
ined
--
--
--
D14
57
N,9
7W
62
Mon
opol
ar
--
Und
eter
min
ed
--
--
--
G5
60N
,146
W
17
Mon
opol
ar
7 O
ven
60.7
N,1
45.8
W
75
-100
16
0
D15
56
N,9
8W
14
Mon
opol
ar
--
Und
eter
min
ed
--
--
--
G6
64N
,147
W
8 M
onop
olar
--
U
ndet
erm
ined
--
--
--
D16
61
N,1
00W
53
D
ipol
ar
--
Und
eter
min
ed
--
--
--
G7
67N
,148
W
94
Dip
olar
--
B
alin
g w
ire
67.5
N,1
48.0
W
0-3
--
D
17
50N
,94W
-2
5 M
onop
olar
--
B
H tr
ench
3
50.0
N,9
5.0W
--
60
G
8 57
N,1
49W
18
9 D
ipol
ar
--
Und
eter
min
ed
--
--
--
E1
66
N,1
01W
63
D
ipol
ar
--
Und
eter
min
ed
--
--
--
G9
53N
,148
W
9 M
onop
olar
--
U
ndet
erm
ined
--
--
--
E2
58N
,102
W
106
Dip
olar
--
U
ndet
erm
ined
--
--
--
G
10
51N
,151
W
17
Mon
opol
ar
--
Und
eter
min
ed
--
--
--
-- T
able
Con
tinue
s --

69 Chapter 6 – Magnetometer Survey
Tabl
e 6.
2 co
ntin
ued.
Sum
mar
y of
mag
netic
ano
mal
ies r
ecor
ded
at th
e Lo
ng T
om si
te.
Ano
mal
y Su
mm
ary
Feat
ure
Sum
mar
y A
nom
aly
Sum
mar
y Fe
atur
e Su
mm
ary
Num
ber
Cen
ter
Inte
nsity
Ty
pe
Num
ber
Typ
e C
ente
r D
epth
Dia
met
er
Num
ber
Cen
ter
Inte
nsity
Ty
pe
Num
ber
Typ
e C
ente
r D
epth
Dia
met
er
G11
65
N,1
54W
22
M
onop
olar
--
U
ndet
erm
ined
--
--
--
K
3 74
N,2
02W
30
M
onop
olar
--
U
ndet
erm
ined
--
--
--
G12
52
N,1
54W
18
M
onop
olar
--
U
ndet
erm
ined
--
--
--
K
4 88
N,2
04W
48
M
onop
olar
--
U
ndet
erm
ined
--
--
--
G13
51
N,1
56W
17
M
onop
olar
--
U
ndet
erm
ined
--
--
--
K
5 72
N,1
04W
32
6 D
ipol
ar
--
Und
eter
min
ed
--
--
--
G
14
69N
,158
W
52
Dip
olar
--
U
ndet
erm
ined
--
--
--
K
6 74
N,2
05W
30
M
onop
olar
--
U
ndet
erm
ined
--
--
--
H1
69N
,161
W
366
Dip
olar
--
B
alin
g w
ire
69.5
N,1
60.5
W
0-3
--
K7
86N
,206
W
46
Mon
opol
ar
--
Und
eter
min
ed
--
--
--
H
2 63
N,1
61W
87
D
ipol
ar
--
Bal
ing
wire
64
.5N
,160
.5W
0-
3 --
K
8 82
N,2
07W
10
0 D
ipol
ar
--
Und
eter
min
ed
--
--
--
H
3 61
N,1
61W
86
D
ipol
ar
--
Bal
ing
wire
61
.5N
,161
.0W
0-
3 --
K
9 78
N,2
06W
46
M
onop
olar
17
O
ven
77.7
N,2
06.0
W
40
-70
120
H
4 58
N,1
62W
68
D
ipol
ar
--
Bal
ing
wire
58
.0N
,161
.5W
0-
3 --
K
10
76N
,206
W
51
Mon
opol
ar
--
Und
eter
min
ed
--
--
--
H
5 50
N,1
61W
24
D
ipol
ar
--
Und
eter
min
ed
--
--
--
K11
71
N,2
06W
74
D
ipol
ar
--
Nai
ls
71.5
N,2
06.0
W
0
-10
--
H
6 69
N,1
63W
93
D
ipol
ar
--
Bal
ing
wire
69
.5N
,162
.5W
0-
3 --
K
12
90N
,208
W
90
Mon
opol
ar
--
Und
eter
min
ed
--
--
--
H
7 63
N,1
63W
41
D
ipol
ar
--
Und
eter
min
ed
--
--
--
K13
73
N,2
09W
86
D
ipol
ar
--
Und
eter
min
ed
--
--
--
H
8 66
N,1
65W
11
7 D
ipol
ar
--
Bal
ing
wire
67
.0N
,164
.5W
0-
3 --
K
14
78N
,210
W
34
Mon
opol
ar
--
Und
eter
min
ed
--
--
--
H
9 64
N,1
66W
30
5 D
ipol
ar
--
Bal
ing
wire
64
.5N
,165
.5W
0-
3 --
K
15
72N
,211
W
55
Mon
opol
ar
--
Und
eter
min
ed
--
--
--
H
10
56N
,167
W
-55
Mon
opol
ar
--
Und
eter
min
ed
--
--
--
K16
76
N,2
13W
37
M
onop
olar
--
U
ndet
erm
ined
--
--
--
H11
64
N,1
68W
43
D
ipol
ar
--
Und
eter
min
ed
--
--
--
K17
89
N,2
14W
86
M
onop
olar
20
Fi
re p
it 88
.4N
,215
.0W
33-4
5 45
H12
56
N,1
68W
76
D
ipol
ar
--
Und
eter
min
ed
--
--
--
K18
72
N,2
15W
42
M
onop
olar
19
O
ven
73.0
N,2
14.0
W
90
-130
19
5
H13
60
N,1
69W
26
M
onop
olar
--
U
ndet
erm
ined
--
--
--
K
19
78N
,218
W
66
Dip
olar
--
U
ndet
erm
ined
--
--
--
H14
66
N,1
70W
24
D
ipol
ar
--
Und
eter
min
ed
--
--
--
K20
73
N,2
18W
58
D
ipol
ar
--
Und
eter
min
ed
--
--
--
H
15
53N
,170
W
36
Mon
opol
ar
--
Und
eter
min
ed
--
--
--
L1
74N
,182
W
40
Mon
opol
ar
--
Und
eter
min
ed
--
--
--
H
16
50N
,172
W
34*
Mon
opol
ar
--
Und
eter
min
ed
--
--
--
L2
84N
,183
W
12
Mon
opol
ar
--
Und
eter
min
ed
--
--
--
H
17
66N
,173
W
29
Dip
olar
--
U
ndet
erm
ined
--
--
--
L3
71
N,1
83W
18
M
onop
olar
--
U
ndet
erm
ined
--
--
--
H18
65
N,1
75W
12
8 D
ipol
ar
--
Und
eter
min
ed
--
--
--
L4
74N
,184
W
17
Mon
opol
ar
--
Und
eter
min
ed
--
--
--
H
19
69N
,179
W
30
Mon
opol
ar
12
Ove
n 69
.0N
,178
.6W
50
-85
120
L5
71N
,185
W
24
Mon
opol
ar
--
Und
eter
min
ed
--
--
--
I1
60
N,1
81W
53
M
onop
olar
--
U
ndet
erm
ined
--
--
--
L6
90
N,1
89W
13
M
onop
olar
--
U
ndet
erm
ined
--
--
--
I2
64N
,181
W
71
Mon
opol
ar
--
Und
eter
min
ed
--
--
--
L7
75N
,191
W
-68
Mon
opol
ar
--
Und
eter
min
ed
--
--
--
I3
61
N,1
86W
60
* M
onop
olar
--
U
ndet
erm
ined
--
--
--
L8
72
N,1
92W
45
M
onop
olar
14
Tw
o ov
ens
72.7
N,1
91.9
W
65
-95
200+
I4
68N
,187
W
40
Mon
opol
ar
--
Und
eter
min
ed
--
--
--
L9
88N
,196
W
11
Mon
opol
ar
--
Und
eter
min
ed
--
--
--
I5
63
N,1
89W
54
* M
onop
olar
--
U
ndet
erm
ined
--
--
--
L1
0 81
N,1
98W
22
M
onop
olar
--
U
ndet
erm
ined
--
--
--
I6
68N
,190
W
38
Mon
opol
ar
--
Und
eter
min
ed
--
--
--
L11
73N
,198
W
36
Mon
opol
ar
--
Und
eter
min
ed
--
--
--
I7
69
N,1
91W
42
M
onop
olar
--
U
ndet
erm
ined
--
--
--
L1
2 89
N,1
99W
10
M
onop
olar
--
U
ndet
erm
ined
--
--
--
I8
65N
,191
W
63*
Mon
opol
ar
13
Roc
k cl
uste
r 65
.7N
,191
.0W
70
-85
100?
M
1 90
N,1
60W
35
M
onop
olar
22
O
ven
90.0
N,1
59.7
W
65
-68
100
I9
68
N,1
92W
-2
* M
onop
olar
--
B
H tr
ench
16
68.0
N,1
92.0
W
--
60
M2
89N
,165
W
37
Mon
opol
ar
21
Ove
n 90
.0N
,165
.3W
75-8
5 75
I10
69N
,194
W
53
Mon
opol
ar
--
Und
eter
min
ed
--
--
--
M3
86N
,167
W
9 M
onop
olar
24
O
ven
86.6
N,1
66.9
W
75
-95
212
I1
1 67
N,1
95W
54
* M
onop
olar
--
U
ndet
erm
ined
--
--
--
M
4 85
N,1
69W
13
M
onop
olar
--
U
ndet
erm
ined
--
--
--
I12
65N
,194
W
47*
Mon
opol
ar
--
Und
eter
min
ed
--
--
--
M5
87N
,171
W
31
Mon
opol
ar
10
Ove
n 88
.1N
,171
.3W
60-8
0 12
0
I13
65N
,196
W
56*
Mon
opol
ar
23
Ove
n 66
.3N
, 194
.8W
65-
105
160
M6
74N
,170
W
14
Mon
opol
ar
9 O
ven
74.6
N,1
69.6
W
60
-86
180
J1
67
N,2
02W
30
M
onop
olar
--
U
ndet
erm
ined
--
--
--
M
7 74
N,1
74W
14
M
onop
olar
--
U
ndet
erm
ined
--
--
--
J2
66N
,203
W
33
Mon
opol
ar
--
Und
eter
min
ed
--
--
--
N1
77N
,151
W
10
Mon
opol
ar
--
Und
eter
min
ed
--
--
--
J3
69
N,2
05W
64
D
ipol
ar
--
Und
eter
min
ed
--
--
--
N2
71N
,159
W
42
Dip
olar
--
U
ndet
erm
ined
--
--
--
J4
71N
,210
W
-84
Mon
opol
ar
--
BH
tren
ch 8
71
.0N
,21.
0W
--
60
O1
74N
,139
W
13
Mon
opol
ar
--
Und
eter
min
ed
--
--
--
J5
59
N,2
18W
51
D
ipol
ar
--
Und
eter
min
ed
--
--
--
Q1
74N
,87W
12
M
onop
olar
--
U
ndet
erm
ined
--
--
--
K1
71N
,201
W
77
Mon
opol
ar
--
Und
eter
min
ed
--
--
--
Q2
77N
,80W
-2
1 M
onop
olar
--
B
H tr
ench
13
77.0
N,8
0.0W
--
60
K2
83N
,201
W
38
Mon
opol
ar
--
Und
eter
min
ed
--
--
--
S1
70N
,51W
18
D
ipol
ar
--
Und
eter
min
ed
--
--
--

The Long Tom and Chalker Sites 70
Table 6.3. Magnetic signatures of features investigated at the Long Tom Site.
Feature Center Anomaly Intensity Depth Diameter Number Coordinates Number (gammas) (cm) (cm) Description 1 52.0N,70.0W -- 3 52-73 90 Shallow basin-shaped rock-lined oven 2 54.0N,70.0W C8 17 63-98 120 Shallow basin-shaped rock-lined oven 3 55.5N,70.0W -- -- 68-78 100? Small amorphous cluster of burned sandstone 4 55.5N,124.0W F4 26 63-80 110 Shallow, basin-shaped rock-lined oven with bisque rim 5 61.0N,124.0W F3 * 158-190 185? Amorphous lens of charcoal, bisque, burned sandstone 6 58.5N,144.5W -- 4 40-80 180? Small amorphous scatter of burned rocks, charcoal 7 60.7N,141.8W G5 17 75-100 160 Large, shallow bisque-rimmed oven, lined with burned
sandstone rocks 8 62.0N,145.3W -- -- 60-125 30 V-shaped pit with bisque and charcoal, worm castings 9 74.6N,169.6W M6 14 60-86 180 Large, shallow bisque-rimmed oven partially lined with
burned sandstone rocks 10 88.1N,171.3W M5 31 60-80 120 Shallow rock-lined oven 11 59.7N,179.8W I1 53^ 55-85 173 Shallow rock-lined oven 12 69.0N,178.6W H19 30 50-85 80x120 Shallow rock-lined oven 13 65.7N,191.0W I8 63^ 70-85 100^ Rock and charcoal cluster 14a 73.0N,191.3W L8 45 65-95 100+ Shallow rock-lined (mostly basalt) oven 14b 72.5N,192.5W L8 45 65-95 100+ Shallow rock-lined (mostly sandstone) oven,
superimposed over 14a 15 79.6N,191.0W ** -- 60-90 75 Shallow bisque-lined oven 16 72.0N,206.0W K11 * 55-85 200 Shallow rock-lined oven 17 77.7N,206.0W K9 46 40-70 120 Shallow rock-lined oven with bisque rim 18 88.0N,206.0W -- 22 50-70 105 Shallow rock-lined oven with bisque rim 19 73.0N,214.0W K18 42 90-130 195 Large, shallow rock and bisque-lined oven, 100_130 cm
deep; a possibly unrelated charcoal lens at 90 cm. 20 88.4N,215.0W K17 86 33-45 45 Small circular cluster of rocks in a shallow pit 21 90.0N,165.3W M2 37 75-85 75 Shallow rock-lined oven with partial bisque rim 22 90.0N,159.7W M1 35 65-85 100 Shallow rock-lined oven 23 66.3N,194.8W I13 71^ 65-105 160 Rock-lined oven with partial bisque rim, much charcoal 24 86.6N,166.9W M3 9 75-95 212 Large, shallow bisque-lined oven with few rocks 25 73.8N,216.0W -- -- 90-115 30 Small bisque-lined tapering pit (cooking pit?, mold of
burned post?) * Strong dipolar magnetic anomalies caused by metal mask subtler magnetic signals of more deeply buried cultural features ** Normal intensity reading within a field of unusually low readings, possibly due to higher sand content of local sediments ^ Natural levee formation affected a strong positive magnetic reading (20-25 gammas) that served to amplify the intensity of
feature_caused anomalies Magnetic patterns relating to these natural formations are not included in the summary of anomalies presented in Table 6.2. Ten monopolar anomalies were identified. These ranged in intensity from 18 to 366 gammas. All dipolar anomalies investigated were attributable to metal sources. Seventeen were caused by baling wire, and one was caused by a small cluster of nails and other historic debris. A total of 92 positive monopolar anomalies were recorded. Most of those investigated were attributable to prehistoric cultural features buried within the sediments deposited at the site. To evaluate subsurface sources of the magnetic anomalies identified, 210 meters of backhoe trenches were excavated through both monopolar and dipolar magnetic signatures of varying intensities. All backhoe trench profiles were then examined for historic and prehistoric cultural features that may have affected the ambient magnetic field. All exposed prehistoric features were then hand excavated to determine their nature, size, and function. Twenty-three monopolar anomalies were targeted for cross-sectioning by the backhoe trenches or for exposure in block excavations (Table 6.3). Sixteen of these anomalies (70%) directly corresponded with buried

71 Chapter 6 – Magnetometer Survey
cultural features, primarily camas processing ovens containing burned rocks, bisque, and charcoal. No direct source for seven of the anomalies could be determined, probably due in most cases to the trench missing a feature by a short distance. Examination of the backhoe trench profiles and subsequent excavation in selected portions of the site revealed twenty-five discrete subsurface prehistoric cultural features (Table 6.3). Nine of these features were not initially identified by their magnetic signatures, due to a number of reasons. Two features (8 and 25) were small pits (possible storage pits) that would not be expected to have magnetic signatures. Two features (1 and 6) provided magnetic signals of only 3 and 4 gammas respectively. While magnetically identifiable, these readings were not of sufficient magnitude to be recognized with the mapping contours initially selected. In two cases (Anomaly F3/Feature 5 and Anomaly K11/Feature 16), strong dipolar anomalies caused by surface or near-surface metal (baling wire) masked any magnetic signal that could be attributable to the prehistoric features. In another instance, Features 1, 2, and 3 formed a small cluster of features between 51.5 and 56 North in trench 70W. This cluster of features corresponds with an apparent single monopolar magnetic anomaly (Anomaly C8) centered at 54N/70W. Finally, magnetic readings of normal intensity were recorded over Feature 15, although this feature is located within an area of the site characterized by unusually low readings (cf. Anomaly L7). It is possible that this area of generally low readings identifies a former drainage channel, although clear evidence of a former channel was not specifically noted in the sediment profile of trench 191W. In sum, 23 monopolar anomalies were targeted for examination by excavation, 70% of which directly corresponded to buried cultural features, primarily camas ovens. Conversely, excavations revealed a total of 25 discrete features, 16 (64%) of which produced strong magnetic signatures. In light of the above evaluation of magnetometer data, a reasonable assessment of the unexcavated portions of the site can be offered. The 92 positive magnetic anomalies can be estimated to represent a minimum of 64 oven or hearth features. An additional 37 features that would not be magnetically identifiable would be expected, for an estimated (minimum) site total of 101 features. Based on these estimates, we can conclude that the data recovery excavations explored an estimated sample of up to 25% of the expected features within the projected impact area. Another important aspect of the magnetometer mapping is that it served to focus excavations on buried cultural features. While a relatively small proportion of the total impact area within the Long Tom site was exposed in excavations, a comparatively large sample of the estimated population of features within this area was explored.
The Chalker Site The area of the Chalker site, determined during the initial testing at the site, was estimated at approximately 500 square meters. A magnetometer map representing 600 square meters was produced that covered the entire estimated site area, and included one 20 x 20 meter block (block X) and one 10 x 20 meter block (block Y). A baseline for the site was established two meters north of and parallel to the proposed highway centerline. Highway station 390+00 was used as a grid reference point, with the southeast corner of the provenience grid (point 10N/10W) located on the baseline 12 meters east of station 390 (Figure 6.6). A magnetic contour map of the Chalker site is presented in Figure 6.7. Magnetic anomalies identified from the map are recorded in Table 6.4. Similar to the pattern observed at the Long Tom site, the levee on which the site is located produced a strong positive magnetic field. Again, it is possible that this may be due in part (but not entirely) to the prehistoric cultural activity that was apparently focused on the levee area. By contrast, the northern portion of the site, which is much sandier and may represent a former drainage channel, is characterized by unusually low magnetic intensity. Thirteen anomalies were identified at the Chalker site (Table 6.4). Two anomalies (X9 and Y3) that exhibit relatively lower magnetic values than surrounding areas correspond to gullies that cut through the levee and drain into the adjacent oxbow swale. Five additional anomalies (X5, X6, X8, Y1, and Y4) exhibit relatively lower magnetic values than surrounding areas and correspond directly to test pits and backhoe trenches excavated at the site in 1985. Similar features at the Long Tom site were invariably recorded as negative monopolar anomalies. At the Chalker site, however, magnetic values associated with these test units are in some cases positive in relation to the base values, but are considerably lower with respect to surrounding areas. The strong positive field of the levee area (50-90 gammas), which effectively amplified all associated anomaly readings, accounts for this discrepancy. One anomaly of relatively lower intensity than surrounding areas (X3) was recorded for which no source was determined.

The Long Tom and Chalker Sites 72
Figure 6.6. Topographic map of the Chalker site showing highway stations, oxbow lake, and magnetometer survey blocks.

73 Chapter 6 – Magnetometer Survey
Figu
re 6
.7 .
Mag
neto
met
er m
ap o
f the
Cha
lker
site
(sur
vey
bloc
k X
, at r
ight
, is 2
0x20
met
ers;
blo
ck Y
, at l
eft,
is 1
0x20
met
ers)
.

The Long Tom and Chalker Sites 74
Table 6.4. Summary of magnetic anomalies recorded at the Chalker site.
Anomaly Summary Feature Summary ---------------------------------------------------------- ---------------------------------------------------------------------------------------- Number Center Intensity Type Number Type Center Depth Diameter X1 22N 11W 35 Monopolar -- Undetermined -- -- -- X2 17N 11W 50 Monopolar -- Undetermined -- -- -- X3 16N 13W 29 Monopolar -- Undetermined -- -- -- X4 18N 14W 43 Monopolar -- Undetermined -- -- -- X5 21N 16W -2 Monopolar -- BH Trench 5 21N 16W -- 60 X6 13N 15W 12 Monopolar -- BH Trench 4 13N 15W -- 60 X7 18N 19W 45 Monopolar 6 Oven 19N 18W 125 130 X8 13N 22W 49 Monopolar -- Test Pit 1 13N 22W -- 100 X9 12N 26W -15 Monopolar -- Gully 12N 26W -- -- Y1 12N 31W -84 Monopolar -- BH Trench 1 12N 31W -- 60 Y2 15N 36W 59 Monopolar -- Undetermined -- -- -- Y3 13N 40W -65 Monopolar -- Gully 13N 40W -- -- Y4 13N 43W 47 Monopolar -- Test Pit 2 13N 43W -- -- The remaining five anomalies at the Chalker site represent positive monopolar anomalies. It should be noted here, as a caution to future magnetometer users, that these anomalies were not distinguished when the magnetic map was first generated. The magnetic contour intervals initially selected masked their presence, due to the high magnetic contrasts that characterized the northern (sandy) and southern (levee) portions of the site. Later manipulation of the magnetic contours permitted these anomalies to be highlighted. Fortunately, one of the positive magnetic anomalies (X7) was excavated, and was found to be a large camas oven at a depth of 120-130 cm. Three of the remaining anomalies are located near what was designated the eastern boundary of the site. Since the determination of site boundaries was based primarily on cultural material recovered from the upper component of the site, it seems possible, in light of the magnetometer map, that the boundary of the lower component extends even farther to the east. Site 35LA759, which contains camas ovens of a comparable age to the lower component of the Chalker site, is located only a short distance east and may be contiguous. If so, this component exhibits a character much like the Long Tom site, with numerous isolated ovens scattered over a relatively large area.
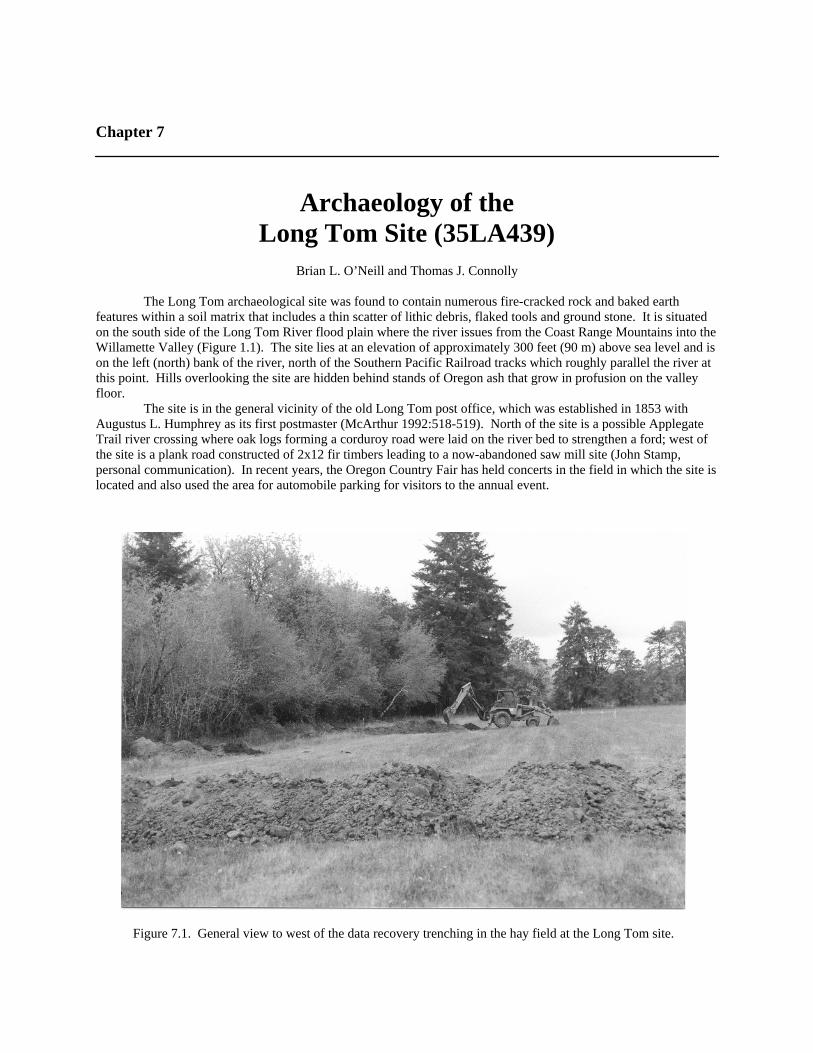
Chapter 7
Archaeology of the Long Tom Site (35LA439)
Brian L. O’Neill and Thomas J. Connolly
The Long Tom archaeological site was found to contain numerous fire-cracked rock and baked earth features within a soil matrix that includes a thin scatter of lithic debris, flaked tools and ground stone. It is situated on the south side of the Long Tom River flood plain where the river issues from the Coast Range Mountains into the Willamette Valley (Figure 1.1). The site lies at an elevation of approximately 300 feet (90 m) above sea level and is on the left (north) bank of the river, north of the Southern Pacific Railroad tracks which roughly parallel the river at this point. Hills overlooking the site are hidden behind stands of Oregon ash that grow in profusion on the valley floor. The site is in the general vicinity of the old Long Tom post office, which was established in 1853 with Augustus L. Humphrey as its first postmaster (McArthur 1992:518-519). North of the site is a possible Applegate Trail river crossing where oak logs forming a corduroy road were laid on the river bed to strengthen a ford; west of the site is a plank road constructed of 2x12 fir timbers leading to a now-abandoned saw mill site (John Stamp, personal communication). In recent years, the Oregon Country Fair has held concerts in the field in which the site is located and also used the area for automobile parking for visitors to the annual event.
Figure 7.1. General view to west of the data recovery trenching in the hay field at the Long Tom site.

The Long Tom and Chalker Sites 76
Table 7.1. Summary of cultural features exposed during the 1980 and 1985 test excavations at the Long Tom site. Diameter Depth (bs) Soil Uncalibrated** Feature Class (cm) (cm) Stratum 14C Date BP Description/Associations 1980-1 fire pit 40 80-90 2 circular stain/FCR*, charcoal ,and acorn 1980-2 fire pit 50 100-110 2 FCR cluster/charcoal and bisque 1980-3 fire pit 20 110-120 2 FCR cluster/charcoal 1980-4 fire pit 40 100-120 2 FCR cluster/charcoal 1980-5 fire pit 30 85 2/3 FCR cluster/scattered charcoal 1980-6 oven 120 100-150 2/3 FCR cluster/charcoal 1980-7 oven 100 80-110 2 3880±90 circular FCR cluster and basin 1980-8/9 oven 200 120-165 2/3 4110±70 circular FCR cluster and basin 1985-1 oven 130 80-100 2 4400±75 circular FCR cluster/charcoal 1985-2 oven 130 110-155 2/3 circular FCR cluster and basin 1985-3 oven 130 120-130 2/3 FCR cluster/charcoal 1985-4 oven >85 70-90 2 circular FCR cluster and basin 1985-5 oven 135 55-75 2 4230±100 circular FCR cluster and basin 1985-6 post mold 10 60-105 2 tapering stain 1985-7 fire pit 60 65 2 FCR cluster (dismantled Feature 5?) 1985-8 oven >55 85-115 2 4190±100 circular FCR cluster and basin; charred
hazelnut; hammerstone, anvil, stone bowl mortar fragments
1985-9 pit 30 60-90 2 charcoal flecking and bisque 1985-10 pit 30 50-95 2 charcoal flecking, bisque, charred hazelnut 1985-11 oven 100 70-85 2 FCR cluster/charcoal 1985-12 oven 100 70-90 2 FCR cluster/charcoal * FCR=fire-cracked rock; ** Calibrations to calendar years reported in tables 5.1 and 7.7 of this report. The site area is slightly elevated from the surrounding floodplain and is on a levee of the Long Tom River. To the south is an abandoned channel of the Long Tom River, possibly cut off by construction of the railroad tracks which were built along the top of a berm. At the western end of the site, oriented north-south, is a shallow swale, apparently a filled stream channel which, when active, emptied into the abandoned Long Tom channel. Currently, the site lies at the edge of a cultivated field where hay is annually harvested (Figure 7.1). A dense streamside vegetation community grows to the south of the field and includes Douglas fir, yew, oak, maple, blackberry, wild rose, and wild cucumber. The Douglas fir trees tend to be on the most elevated places, possibly reflecting the local conditions which include annual winter flooding and a high water table even in mid-summer.
Previous Archaeology The Long Tom site was originally identified by a thin surface scatter of fire-cracked rock and a piece of basalt debitage. Test excavations were conducted at site 35LA439 by the State Museum of Anthropology in 1980, 1981, and 1985 to determine the location and significance of cultural deposits within proposed highway corridors (O'Neill 1987). Engineering design changes were proposed to avoid the known site area; subsequent examination of these proposed changes expanded the known site area. In sum, the preliminary investigations of site 35LA439 included the excavation of 151 auger probes, 17 1x1 m and 1x2 m test pits, and 17 backhoe trenches within which systematic 1x.5 m and 1x.2 m profile columns were excavated. The fill from all of these test excavations was screened through 1/4 inch hardware cloth. As a result of these investigations, the cultural deposits were found to be scattered over approximately 9300 m² (ca. 2.3 acres) and to include two stratigraphically distinct components. Since the silt, clay, and sandy loam soils at this location are completely alluvial in origin--derived from the nearby Long Tom River and abandoned stream channel to the immediate west, fragments of sandstone found on the surface and in the excavations conducted at the site were interpreted as cultural in origin. Indeed, test excavations uncovered 17 features containing pieces of thermally altered sandstone--otherwise referred to as fire-cracked rock (Table 7.1). Based upon their dimensions, these features were labeled either "fire pit" or "oven." The former with diameters no greater than 60 cm; the latter averaging 130 cm in diameter. Furthermore, ovens characteristically were basin-shaped and contained greater quantities of fire-cracked rock. Given its proximity to an oven, one of the
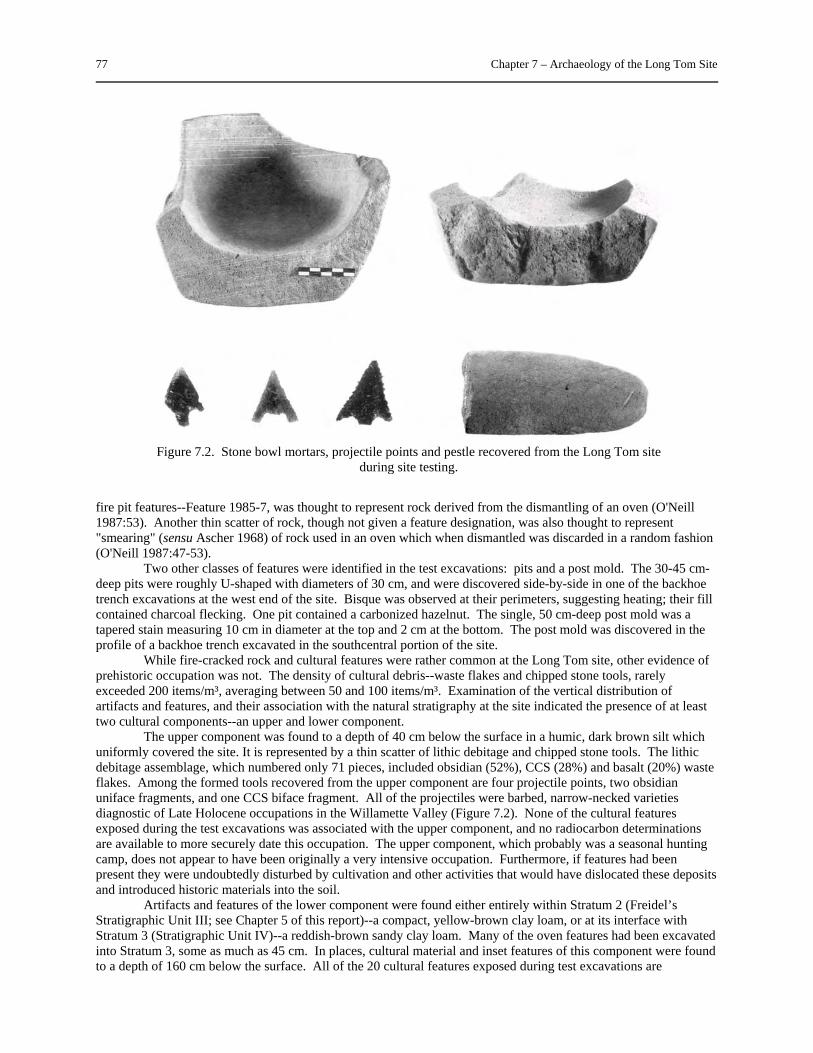
77 Chapter 7 – Archaeology of the Long Tom Site
fire pit features--Feature 1985-7, was thought to represent rock derived from the dismantling of an oven (O'Neill 1987:53). Another thin scatter of rock, though not given a feature designation, was also thought to represent "smearing" (sensu Ascher 1968) of rock used in an oven which when dismantled was discarded in a random fashion (O'Neill 1987:47-53). Two other classes of features were identified in the test excavations: pits and a post mold. The 30-45 cm-deep pits were roughly U-shaped with diameters of 30 cm, and were discovered side-by-side in one of the backhoe trench excavations at the west end of the site. Bisque was observed at their perimeters, suggesting heating; their fill contained charcoal flecking. One pit contained a carbonized hazelnut. The single, 50 cm-deep post mold was a tapered stain measuring 10 cm in diameter at the top and 2 cm at the bottom. The post mold was discovered in the profile of a backhoe trench excavated in the southcentral portion of the site. While fire-cracked rock and cultural features were rather common at the Long Tom site, other evidence of prehistoric occupation was not. The density of cultural debris--waste flakes and chipped stone tools, rarely exceeded 200 items/m³, averaging between 50 and 100 items/m³. Examination of the vertical distribution of artifacts and features, and their association with the natural stratigraphy at the site indicated the presence of at least two cultural components--an upper and lower component. The upper component was found to a depth of 40 cm below the surface in a humic, dark brown silt which uniformly covered the site. It is represented by a thin scatter of lithic debitage and chipped stone tools. The lithic debitage assemblage, which numbered only 71 pieces, included obsidian (52%), CCS (28%) and basalt (20%) waste flakes. Among the formed tools recovered from the upper component are four projectile points, two obsidian uniface fragments, and one CCS biface fragment. All of the projectiles were barbed, narrow-necked varieties diagnostic of Late Holocene occupations in the Willamette Valley (Figure 7.2). None of the cultural features exposed during the test excavations was associated with the upper component, and no radiocarbon determinations are available to more securely date this occupation. The upper component, which probably was a seasonal hunting camp, does not appear to have been originally a very intensive occupation. Furthermore, if features had been present they were undoubtedly disturbed by cultivation and other activities that would have dislocated these deposits and introduced historic materials into the soil. Artifacts and features of the lower component were found either entirely within Stratum 2 (Freidel’s Stratigraphic Unit III; see Chapter 5 of this report)--a compact, yellow-brown clay loam, or at its interface with Stratum 3 (Stratigraphic Unit IV)--a reddish-brown sandy clay loam. Many of the oven features had been excavated into Stratum 3, some as much as 45 cm. In places, cultural material and inset features of this component were found to a depth of 160 cm below the surface. All of the 20 cultural features exposed during test excavations are
Figure 7.2. Stone bowl mortars, projectile points and pestle recovered from the Long Tom site during site testing.

The Long Tom and Chalker Sites 78
assignable to the lower component, and include fire pits, ovens, pits, and a post mold. The artifact assemblage associated with the lower component is richer and more diverse than that of the upper component. It includes debitage, biface and uniface fragments, obsidian and CCS cores, hammerstones, anvils, a pestle and two stone bowl mortar fragments (Figure 7.2). The 127 pieces of lower component debitage include obsidian (45%), CCS (43%), basalt (11%), and other minor material type (2%) waste flakes. Macrobotanical remains from the cultural features were sparse, consisting solely of charred hazelnut shell fragments. Five charcoal samples associated with oven features exposed during the initial testing phase have radiocarbon ages between 4900 ad 4300 cal BP (3880±90 BP and 4400±75 BP), dating this lower component to the Middle Holocene (Table 7.1). The lower component assemblage and associated features indicated that the site area was occupied during the Middle Holocene by people who focused on collecting and processing plant resources. The cultural features have their analogs among the ethnographically recorded earth ovens used by the Kalapuya, and other Northwest Indians, to bake camas and other roots. The small amount of debitage collected from the site suggests that tool manufacture and maintenance was performed at the site using tool stone which could be acquired within easy walking distance. It is possible, given the post mold, that a temporary structure or a ramada was constructed to ward off the elements. Based upon the results of the testing program at the Long Tom site, it was determined that the lower component materials and features represented a significant archaeological resource. Although there are practically no surficial indications of an archaeological site, subsurface investigations recovered artifacts and features of two stratigraphically distinct occupations. The nature of these occupations, as reflected by the recovered artifacts and excavated features, suggest different uses of the site during the two best-represented periods. The presence of a third, older component was only tentatively suggested by the discovery of three pieces of debitage approximately 160-200 cm below the surface, within Stratum 3 (Stratigraphic Unit IV). Data recovery excavations during 1986 confirmed the presence of this occupation. Subsequent geoarchaeological work in the Long Tom drainage has discovered other stratigraphically comparable components elsewhere in the drainage (Freidel et al. 1989; Chapter 5, this report).
Long Tom Site Stratigraphy The geomorphology and depositional history of soils in the vicinity of the Long Tom site are described in detail in chapters 4 and 5 of this report. Presented here is a brief summary of the stratigraphy encountered and recorded during the archaeological excavations. The stratigraphic changes are very subtle and inconsistencies between recorders were not uncommon. For example, most archaeological field notes designate Field Stratum 1 (generally, the recognizable A horizon) to a depth of 40 cm; McDowell (Chapter 4, this volume) records an AB transitional horizon from a 33-47 cm depth. Field Stratum 2, which is relatively more clayey at the top and includes the primary cultural deposit in the lower portion of the unit, includes Freidel’s (Chapter 5, this volume) Stratigraphic Units II and III. A correspondence of the three recordations--archaeological field strata, geomorphologic soil strata, and stratigraphic units, is presented in Table 4.2. The backhoe trenches excavated as part of the data recovery process at the Long Tom site provided ample exposure to trace the soils longitudinally across the site. Figure 7.3 is a representation of the west profile of Trench 179W, located near the western end of the site. The southern end of this trench was placed at the edge of the meander channel which paralleled the southern edge of the site. Except for the pinching of the Stratum 3 deposits at its southern end, it is representative of the sediment profile and associated cultural features at the Long Tom site. During archaeological excavations, the sediments at the Long Tom site were separated into four soil strata on the basis of color and texture. Overlaying the first soil stratum, particularly within the tree line, was an approximately 5 cm-thick mat of ground-obscuring duff comprised of leaves and twigs. The four archaeological field strata include the following. Stratum 1 (generally consistent with Freidel’s Unit I) is a humic, dark brown silt loam occurring from the surface to a depth of 40 cm. It is crumbly and contains many large and small roots. Historic material is occasionally found near the surface; flakes and chipped stone tools are sparse. Stratum 2 (comprising Friedel’s Units II and III) is a yellow brown clay loam which was found to vary in thickness and depth, from 30 to 100 cm deep--generally thicker toward the Long Tom meander channel at the southwest portion of the site. The upper portion of this unit is slightly more compact than Stratum 1, due to higher clay content. In some profiles the lower 20-30 cm of Stratum 2 was seen to have an indistinct color contrast with the

79 Chapter 7 – Archaeology of the Long Tom Site
upper portion, but this was not observed in all profiles. The main, Middle Holocene-age cultural component at the Long Tom site was observed to be at the bottom of Stratum 2, at the interface with Stratum 3. Stratum 3 (generally consistent with Freidel’s Unit IV) is a compact, reddish-brown sandy clay loam found between 80 and 150-200 cm below the surface. The cultural material associated with this stratum generally came from near the top of the stratum, at the interface of strata 2 and 3. However, a lens of fire-cracked rock, charcoal, and bisque was observed approximately 160-180 cm below the surface and, upon excavation was found to represent an Early Holocene cultural feature--Feature 5. Stratum 4 is a moderately compact, yellow-brown silty sand with red and gray-brown mottles. It was prominent at the south end of trenches 179W and 204W, both of which cut into what is thought to have been the old meander channel levee. At the south end of Trench 179W it was found between 120 and 200 cm below the surface. This stratum was apparently discontinuous throughout the site area, becoming thin or dispersed to the north and east, away from the meander channel. An auger probe placed in the bottom of Trench 124W discovered that the clay content of the soil increases with depth (see Table 4.2). Backhoe trenches excavated at the perimeter of a wetland mitigation area west of the site encountered a gray clay. As is typical of this area, the topography at the Long Tom site was nearly flat. The difference in elevation between the south and north ends of the 20 meter-long Trench 179W was approximately 30 cm. East of there, along the 40 meter-long 120W line, the difference was only 25 cm. Sources of disturbance that were observed at the Long Tom site included recent agricultural practices, as well as accommodations for parking and recreation. Rodent burrows, particularly in strata 1 and 2, were observed in the excavations.
��� ��� ��� ��� ���
��
��
��
�
���
���
���
���
��
���
�
�
�
�
���������
Figure 7.3. East profile of Trench 191W showing the four soil strata encountered during data recovery excavations. Feature 14 is an oven feature consisting of fire-cracked rock and charcoal contained within a well-
defined basin of baked earth. Features such as this were common at the interface of strata 2 and 3.

The Long Tom and Chalker Sites 80
Data Recovery Investigations Proposed highway construction in the vicinity of the Long Tom site would impact the southern half of the known site area. To mitigate the damage that construction would cause to the features and other cultural deposits of the lower components, a course of data recovery was implemented during the summer and fall of 1986. It followed a three-stage approach which included (a) magnetometer surveying (see Chapter 6), followed by (b) backhoe trenching, and concluding with (c) systematic hand excavation.
Magnetometer Survey Fifteen 20x20 meter blocks and four 10x20 meter blocks were examined at one meter intervals using a proton magnetometer (Figure 7.4). The data obtained from this survey were used to produce a map of magnetic anomalies, identified as either dipolar or monopolar (Figures 6.3, 6.4 and 6.5). Dipolar signatures were thought to represent metal recently introduced to the site deposits. Monopolar signatures were thought to result from a realignment of the molecular structure of the sediments by heating. A strategy to test these hypotheses and confirm the presence of cultural features was developed that included excavating trenches through both dipolar and monopolar anomalies. Figures 7.5, 7.6 and 7.7 show the location and orientation of the ten trenches relative to the anomalies visible in the magnetometer maps. These maps divide the site area into three sections: east, central and west. Twenty-three anomalies were scheduled for examination (Table 7.2), and included 20 monopolar and three dipolar magnetic anomalies. The east portion of the site, lying between 40W and 100W displayed a moderate amount of activity along the southern half of the survey grid where the surface was covered with dense vegetation--trees and shrubs. Included in this area were discrete monopolar anomalies and large areas affected by dipolar readings. The northern
Figure 7.4. Conducting the magnetometer survey at the Long Tom site. A wooden stake marks the corner of a survey block and linen tapes are stretched across the block. Readings are taken at one-
meter intervals.

81 Chapter 7 – Archaeology of the Long Tom Site
half of the survey grid, which was entirely within the recently mowed hay field, contained little evidence of subsurface magnetic anomalies. A single trench was planned to investigate the east portion of the site. Trench 70W would bisect survey block C and examine two anomalies; dipolar anomaly C7 and monopolar anomaly C8 (Figure 7.5). The magnetometer imaging of the central portion of the site, between 100W and 160W, revealed an area of greater magnetic diversity, with discrete monopolar anomalies, large dipolar signatures, and broad areas of intermediate resonance. Much of the diversity was observed in the southern half of the survey grid, with the northern half less so, though greater than observed to the east. Dipolar anomalies obscured much of survey blocks E and F. This area was within the densely vegetated portion of the site along the southern margin of the hay field. The strong dipolar anomalies were found to be baling wire and other metallic debris discarded into the wooded perimeter of the cultivated field occupying the north blocks and northern third of the south blocks Two trenches were planned for this central portion. Trench 124W would bisect two monopolar anomalies--F4 and F5, and one dipolar anomaly--F3. The forty meter-long trench would also examine extensive areas--particularly in survey block O, where no anomalies had been recorded (Figure 7.6). Trench 145W, in survey block G, would examine two discrete monopolar anomalies, G4 and G5. The west portion of the site, between 160W and 220W, was magnetically the most diverse of the three areas and contained the greatest number of monopolar anomalies. The north half of the survey grid was equally as rich as the southern half, though the southern half contained more dipolar readings. To examine the anomaly-rich west portion of the site, plans called for the placement of seven trenches which would investigate 16 magnetic anomalies--all but one being monopolar (Figure 7.7). Also planned for examination was an area of greater magnetic intensity extending diagonally from the southeast to northwest in
Figure 7.5. Magnetometer map of the east portion of the Long Tom site between 40W and 100W showing the location of the single 20 meter-long Trench 70W, excavated to examine monopolar and dipolar anomalies
identified in survey block C.