Embed Size (px)
Citation preview
Hoo
ver I
nstit
utio
nA Hoover InstItutIon essAy on ContemporAry AmerICAn polItICs
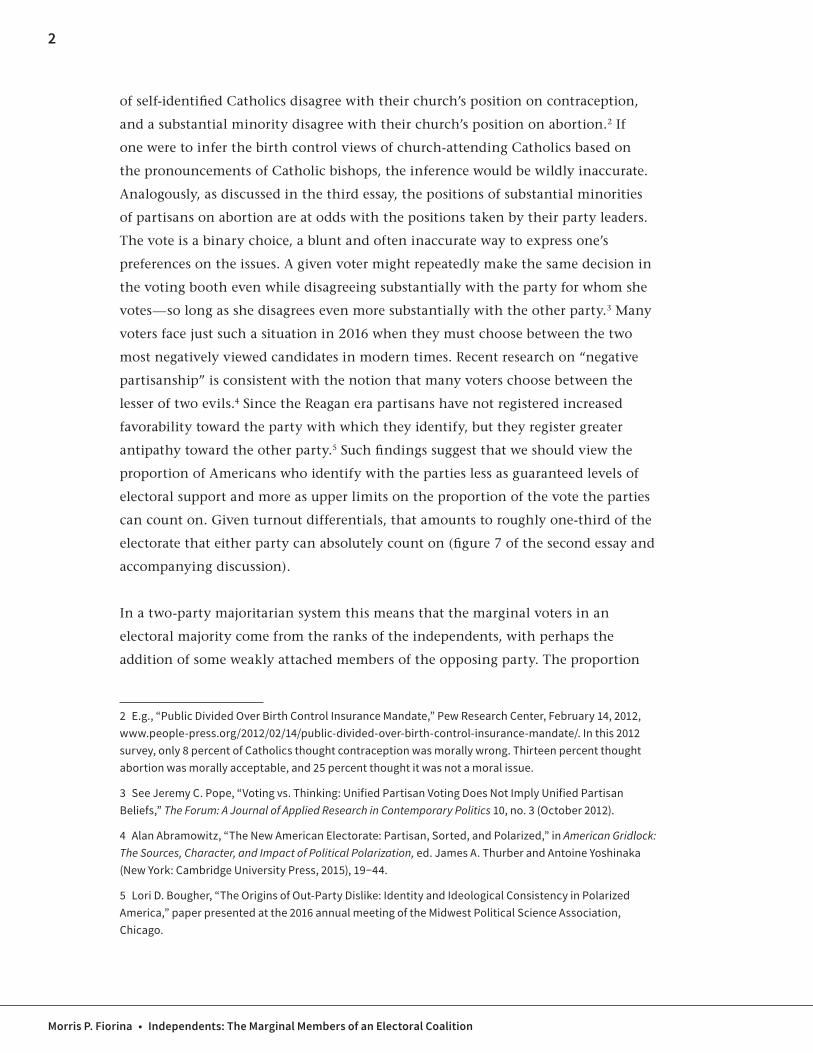
Independents: The Marginal Members of an Electoral CoalitionCurrently, the party balance in the United States is nearly even, roughly one-third
Democratic, one-third Republican, and one-third independent, taking turnout into account.
This means that to win a majority a party normally must capture at least as large a share
of independents as the other party. Thus, independents constitute the marginal members of
an electoral majority. We do not know nearly as much about this critical group of voters as
many pundits think. The electoral movements of this poorly understood category underlie
the unstable majorities of our time.
Morris P. Fiorina series no. 6
“We will never have a time again, in my opinion, in this country when you are going to have a polarization
of only Democrats versus Republicans . . . you are going to have the Independents controlling basically
the balance of power.”—Richard M. Nixon
“There are more independents than ever before. That means nothing.”—Aaron Blake
In recent elections partisans have voted for the presidential candidates of their
parties at rates exceeding 90 percent.1 These figures lead many commentators to
jump to the conclusion that the country is evenly divided into two deeply opposed
partisan camps. But, as shown in the third essay in this series, party sorting in the
general public remains far from perfect. Consider an analogy from the religious
realm. Probably 90 percent of self-identified Catholics who attend church services
attend Catholic services rather than those of other denominations, just as 90 percent
of partisans who turn out cast their votes for the party with which they identify. But
at the same time we know from various public opinion surveys that a large majority
Quotations are from former president Richard M. Nixon in an interview with Howard K. Smith of ABC News, March 22, 1971, Public Papers of the Presidents of the United States: Richard M. Nixon (Washington, DC: Office of the Federal Register), 460; and Aaron Blake, “There are more independents than ever before. That means nothing,” The Fix (blog), Washington Post, April 7, 2015, www . washingtonpost . com / blogs / the - fix / wp / 2015 / 04 / 07 / there - are - more - independents - than - ever - before - that - means - nothing / .
1 These rates are slight overestimates of partisan loyalty because a few people will change their partisanship to reflect their vote choice, artificially inflating the figures.
2
Morris P. Fiorina • Independents: The Marginal Members of an Electoral Coalition
of self-identified Catholics disagree with their church’s position on contraception,
and a substantial minority disagree with their church’s position on abortion.2 If
one were to infer the birth control views of church-attending Catholics based on
the pronouncements of Catholic bishops, the inference would be wildly inaccurate.
Analogously, as discussed in the third essay, the positions of substantial minorities
of partisans on abortion are at odds with the positions taken by their party leaders.
The vote is a binary choice, a blunt and often inaccurate way to express one’s
preferences on the issues. A given voter might repeatedly make the same decision in
the voting booth even while disagreeing substantially with the party for whom she
votes—so long as she disagrees even more substantially with the other party.3 Many
voters face just such a situation in 2016 when they must choose between the two
most negatively viewed candidates in modern times. Recent research on “negative
partisanship” is consistent with the notion that many voters choose between the
lesser of two evils.4 Since the Reagan era partisans have not registered increased
favorability toward the party with which they identify, but they register greater
antipathy toward the other party.5 Such findings suggest that we should view the
proportion of Americans who identify with the parties less as guaranteed levels of
electoral support and more as upper limits on the proportion of the vote the parties
can count on. Given turnout differentials, that amounts to roughly one-third of the
electorate that either party can absolutely count on (figure 7 of the second essay and
accompanying discussion).
In a two-party majoritarian system this means that the marginal voters in an
electoral majority come from the ranks of the independents, with perhaps the
addition of some weakly attached members of the opposing party. The proportion
2 E.g., “Public Divided Over Birth Control Insurance Mandate,” Pew Research Center, February 14, 2012, www . people - press . org / 2012 / 02 / 14 / public - divided - over - birth - control - insurance - mandate / . In this 2012 survey, only 8 percent of Catholics thought contraception was morally wrong. Thirteen percent thought abortion was morally acceptable, and 25 percent thought it was not a moral issue.
3 See Jeremy C. Pope, “Voting vs. Thinking: Unified Partisan Voting Does Not Imply Unified Partisan Beliefs,” The Forum: A Journal of Applied Research in Contemporary Politics 10, no. 3 (October 2012).
4 Alan Abramowitz, “The New American Electorate: Partisan, Sorted, and Polarized,” in American Gridlock: The Sources, Character, and Impact of Political Polarization, ed. James A. Thurber and Antoine Yoshinaka (New York: Cambridge University Press, 2015), 19−44.
5 Lori D. Bougher, “The Origins of Out-Party Dislike: Identity and Ideological Consistency in Polarized America,” paper presented at the 2016 annual meeting of the Midwest Political Science Association, Chicago.
3
Hoover Institution • Stanford University
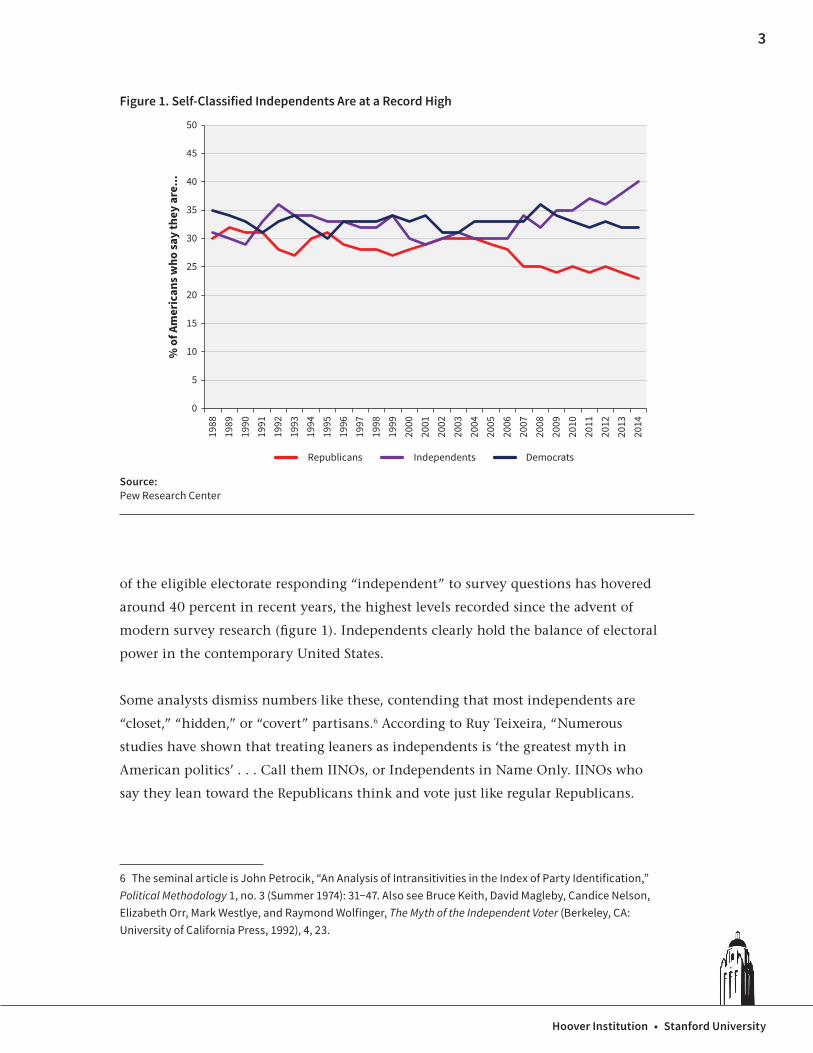
of the eligible electorate responding “independent” to survey questions has hovered
around 40 percent in recent years, the highest levels recorded since the advent of
modern survey research (figure 1). Independents clearly hold the balance of electoral
power in the contemporary United States.
Some analysts dismiss numbers like these, contending that most independents are
“closet,” “hidden,” or “covert” partisans.6 According to Ruy Teixeira, “Numerous
studies have shown that treating leaners as independents is ‘the greatest myth in
American politics’ . . . Call them IINOs, or Independents in Name Only. IINOs who
say they lean toward the Republicans think and vote just like regular Republicans.
6 The seminal article is John Petrocik, “An Analysis of Intransitivities in the Index of Party Identification,” Political Methodology 1, no. 3 (Summer 1974): 31−47. Also see Bruce Keith, David Magleby, Candice Nelson, Elizabeth Orr, Mark Westlye, and Raymond Wolfinger, The Myth of the Independent Voter (Berkeley, CA: University of California Press, 1992), 4, 23.
Figure 1. Self-Classified Independents Are at a Record High
0
5
10
15
20
25
30
35
40
45
50
1988
1989
1990
1991
1992
1993
1994
1995
1996
1997
1998
1999
2000
2001
2002
2003
2004
2005
2006
2007
2008
2009
2010
2011
2012
2013
2014
Republicans Independents Democrats
% o
f Am
eric
ans w
ho sa
y th
ey a
re...
Source: Pew Research Center
4
Morris P. Fiorina • Independents: The Marginal Members of an Electoral Coalition
IINOs who say they lean toward the Democrats think and vote just like regular
Democrats.”7
Teixeira’s claim rests on the fact that when self-identified independents are asked
whether they are closer to one party or the other, many will say yes. Like John
Petrocik and Alan Abramowitz, he contends that these “leaners” actually are
partisans who like the independent label.8 If this claim is true, the actual proportion
of independents—so-called “pure independents”—is no more than 10 percent of
the eligible electorate, a far cry from the 40 percent registered in the polls. From
the standpoint of the larger argument about overreach, it does not really matter
whether the party balance is about 33/33/33 or 45/10/45; the marginal members of
an electoral majority still must come from the ranks of the independents. But since
I believe that much of the conventional wisdom about independents is wrong, or at
least significantly overstated, the first part of this essay makes a slight digression and
examines them more closely.
How Do We Count Independents?
The American National Election Studies (ANES) which provide much of the data
discussed in these essays measure party identification with this survey question:
“Generally speaking, do you usually think of yourself as a Republican, a Democrat, an
independent, or what?” If the answer is Republican or Democrat, the respondent then
is asked, “Would you call yourself a strong [Republican, Democrat] or a not-very-strong
[Republican, Democrat]?” The resulting four categories are referred to in the political
science literature as strong Democrats, strong Republicans, weak Democrats, and weak
Republicans.
Respondents who answer the first question as independent or something else, then are
asked, “Do you think of yourself as closer to the Republican Party or the Democratic
Party?” Those respondents who answer that they are closer to one party or the other
are classified as Independent Democrats or Independent Republicans. These are the
leaning independents or “leaners” whom analysts often combine with weak partisans.
7 Ruy Teixeira, “The Great Illusion,” New Republic, March 6, 2012, www . tnr . com / book / review / swing - vote - untapped - power - independents - linda - killian .
8 Petrocik, “An Analysis of Intransitivities”; Alan Abramowitz, “Setting the Record Straight: Correcting Myths About Independent Voters,” Sabato’s Crystal Ball, July 7, 2011, www . centerforpolitics . org / crystalball / articles / aia2011070702 / .
5
Hoover Institution • Stanford University
In justifying this common practice Abramowitz asserts, “Research by political
scientists on the American electorate has consistently found that the large majority of
self-identified independents are ‘closet partisans’ who think and vote much like other
partisans.”9 And doubling down on his seminal 1974 contribution, Petrocik writes,
“Leaners are partisans. . . . [A]s an empirical matter, Americans who admit to feeling
closer to one of the parties in the follow-up probe—the leaners—are virtually identical
to those who are classified as ‘weak’ partisans . . . across a wide variety of perceptions,
preferences, and behaviors.”10
In my view the preceding claims go well beyond anything the data justify. Rather
than a large body of research that “consistently finds” that leaners are partisans,
researchers cite the same handful of studies, all of which fail to deal with a serious
methodological objection.11 The basic problem with the claims made in such studies
is their failure to deal with reverse causation or, in contemporary social science argot,
endogeneity.12
Causal Confusion
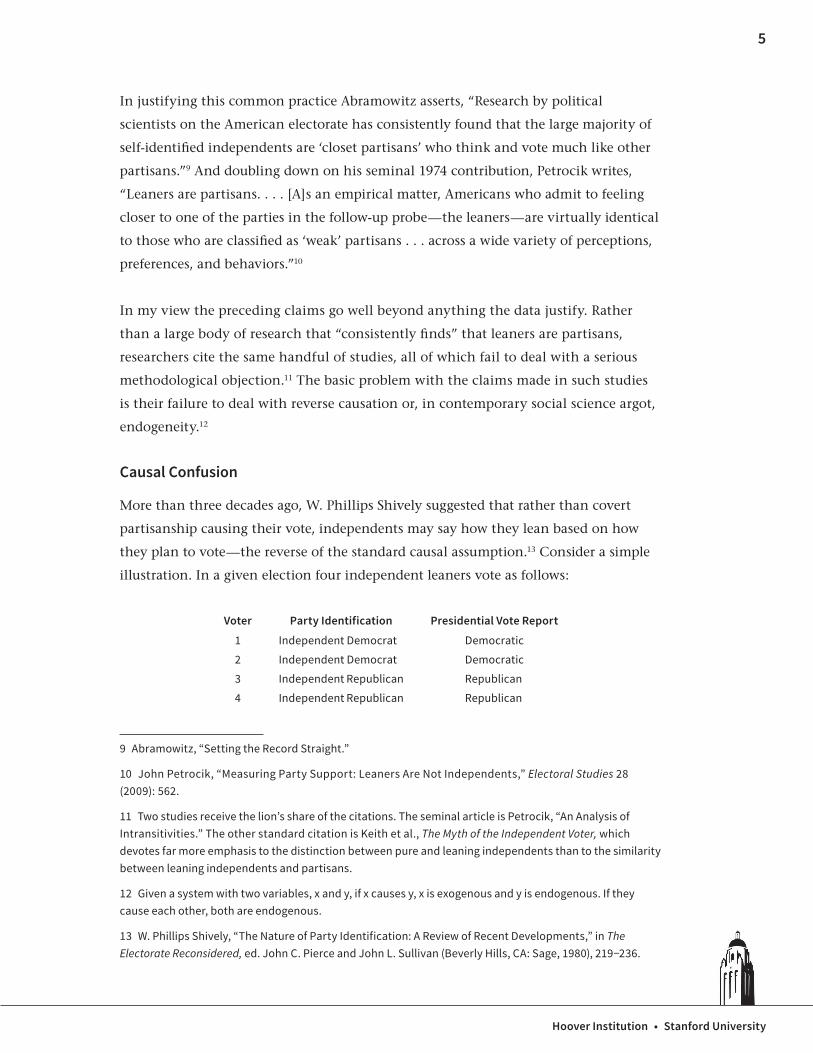
More than three decades ago, W. Phillips Shively suggested that rather than covert
partisanship causing their vote, independents may say how they lean based on how
they plan to vote—the reverse of the standard causal assumption.13 Consider a simple
illustration. In a given election four independent leaners vote as follows:
9 Abramowitz, “Setting the Record Straight.”
10 John Petrocik, “Measuring Party Support: Leaners Are Not Independents,” Electoral Studies 28 (2009): 562.
11 Two studies receive the lion’s share of the citations. The seminal article is Petrocik, “An Analysis of Intransitivities.” The other standard citation is Keith et al., The Myth of the Independent Voter, which devotes far more emphasis to the distinction between pure and leaning independents than to the similarity between leaning independents and partisans.
12 Given a system with two variables, x and y, if x causes y, x is exogenous and y is endogenous. If they cause each other, both are endogenous.
13 W. Phillips Shively, “The Nature of Party Identification: A Review of Recent Developments,” in The Electorate Reconsidered, ed. John C. Pierce and John L. Sullivan (Beverly Hills, CA: Sage, 1980), 219−236.
Voter Party Identification Presidential Vote Report
1 Independent Democrat Democratic
2 Independent Democrat Democratic
3 Independent Republican Republican
4 Independent Republican Republican
6
Morris P. Fiorina • Independents: The Marginal Members of an Electoral Coalition
So, independent leaning Democrats vote Democratic, and independent leaning
Republicans vote Republican, consistent with the covert partisanship view. But suppose
in the next election the same four voters report the following patterns:
We still have a perfect relationship: voters vote the way they lean, but voters two and
four changed their votes and changed their response to the “closer to” question to match
the change in their votes. Rather than covert partisans, they are actually swing voters.
How can we determine whether real-world voting patterns reflect the first or second
examples? One way would be to follow independent leaners over several elections
to see if they consistently lean and vote in the same direction. Such an analysis has
been done, and the reader interested in the details should digest Samuel J. Abrams and
Morris P. Fiorina, “Are Leaning Independents Deluded or Dishonest Weak Partisans?”
For the more casual reader a brief summary follows.
Leaning Independents Change their Self-Identification More than Weak Partisans Do
Presidential vote choice is the primary evidence cited by those who equate leaning
independents and weak partisans.14 Petrocik writes, “The almost indistinguishable
voting choices of leaners and weak identifiers of the same party is datum number
one for the proposition that leaners are partisans, even if their first inclination is to
respond to the party identification question by calling themselves independents.”15
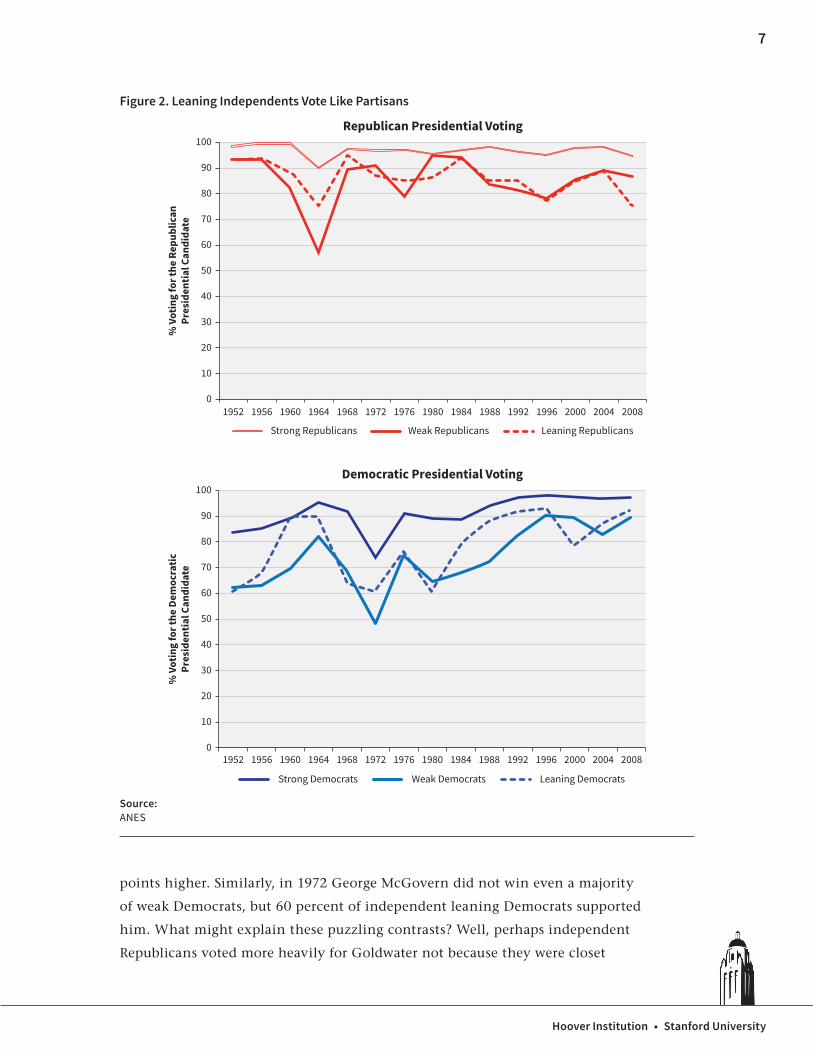
As figure 2 shows, independent leaners indeed are similar to weak partisans in their
presidential voting choices. In fact, they often are more loyal than weak partisans
as in the 1964 Goldwater and 1972 McGovern electoral debacles. But these facts
should immediately raise warning signs. According to the American National
Election Studies, in 1964 weak Republicans abandoned Barry Goldwater in droves,
but independent leaning Republicans registered support almost 20 percentage
14 They are less similar in their congressional voting behavior, particularly in midterm elections.
15 Petrocik, “Measuring Party Support,” 566−567.
Voter Party Identification Presidential Vote Report
1 Independent Democrat Democratic
2 Independent Republican Republican
3 Independent Republican Republican
4 Independent Democrat Democratic
7
Hoover Institution • Stanford University
points higher. Similarly, in 1972 George McGovern did not win even a majority
of weak Democrats, but 60 percent of independent leaning Democrats supported
him. What might explain these puzzling contrasts? Well, perhaps independent
Republicans voted more heavily for Goldwater not because they were closet
Figure 2. Leaning Independents Vote Like Partisans
0
10
20
30
40
50
60
70
80
90
100
1952 1956 1960 1964 1968 1972 1976 1980 1984 1988 1992 1996 2000 2004 2008
% V
otin
g fo
r the
Rep
ublic
anPr
esid
entia
l Can
dida
te
Strong Republicans Weak Republicans Leaning Republicans
Republican Presidential Voting
0
10
20
30
40
50
60
70
80
90
100
1952 1956 1960 1964 1968 1972 1976 1980 1984 1988 1992 1996 2000 2004 2008
% V
otin
g fo
r the
Dem
ocra
ticPr
esid
entia
l Can
dida
te
Strong Democrats Weak Democrats Leaning Democrats
Democratic Presidential Voting
Source: ANES
8
Morris P. Fiorina • Independents: The Marginal Members of an Electoral Coalition
Republicans; rather, they were independents who felt closer to the Republicans in
that election because they had decided to vote for Goldwater. Analogously, the high
level of independent Democratic support for McGovern may have been because
they were independents who liked McGovern and consequently said they leaned
Democratic.
In fifty-six of sixty comparisons of one-, two-, and four-year panel waves in the
ANES database, leaners are less stable than weak partisans, often by significant
margins—20 percentage points or more.16 In the four major presidential election
panel studies conducted by ANES (1956−60, 1972−76, 1992−96, and 2000−2004),
nearly 70 percent of strong partisans give the same response when queried about
their partisan identities during two presidential election campaigns four years
apart. A bit less than 50 percent of weak partisans give the same response, and
one-third of pure independents give the same response. But only 31 percent of
independent Democrats and 38 percent of independent Republicans give the same
response. Their partisan stability is closer to pure independents than to weak
partisans.17
Such findings suggest that the causal arrow runs not only from partisanship to vote,
but also from vote back to partisanship, particularly among citizens who choose the
independent label. Some (unknown) proportion of leaners vote the way they lean
because they tell us how they lean based on how they intend to vote. This endogeneity
in the survey responses artificially exaggerates the apparent strength of party loyalty
as an influence on the vote. And it misleads pundits and some political scientists to
conclude that partisanship has become nearly universal.
Additional Evidence
Analysts simply have not looked hard enough for data that contradict the practice of
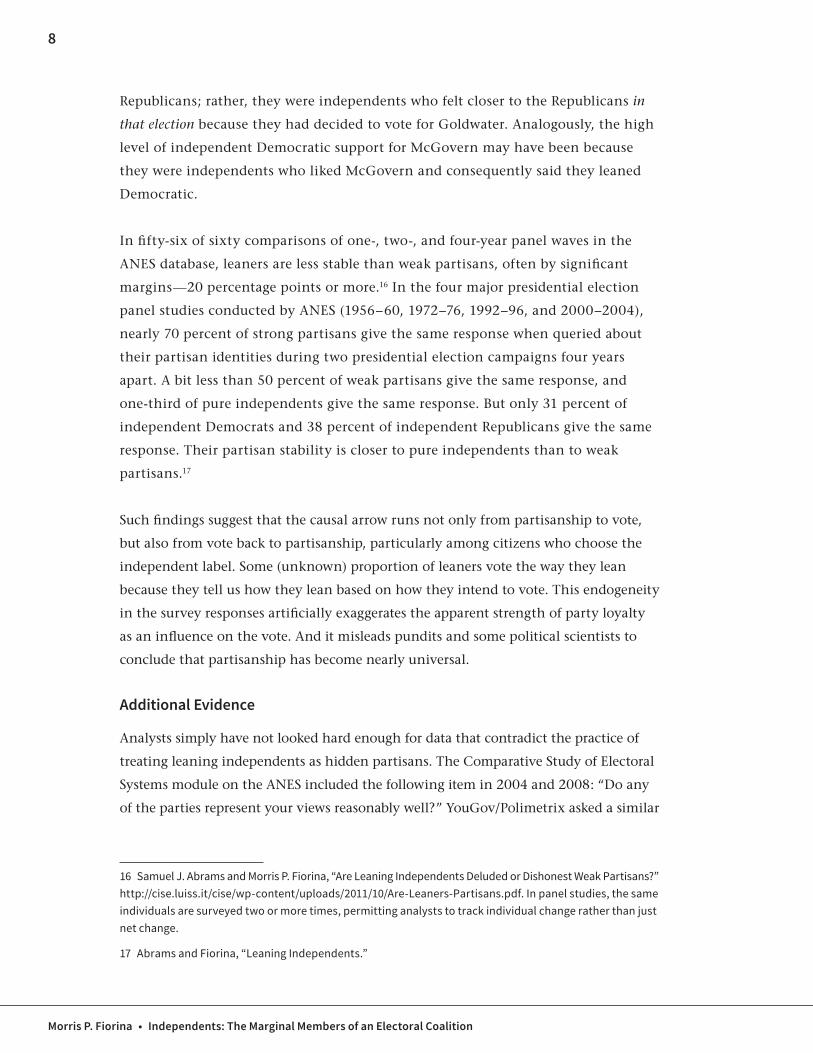
treating leaning independents as hidden partisans. The Comparative Study of Electoral
Systems module on the ANES included the following item in 2004 and 2008: “Do any
of the parties represent your views reasonably well?” YouGov/Polimetrix asked a similar
16 Samuel J. Abrams and Morris P. Fiorina, “Are Leaning Independents Deluded or Dishonest Weak Partisans?” http://cise .luiss.it/cise/wp-content/uploads/2011/10/Are-Leaners-Partisans.pdf. In panel studies, the same individuals are surveyed two or more times, permitting analysts to track individual change rather than just net change.
17 Abrams and Fiorina, “Leaning Independents.”
9
Hoover Institution • Stanford University
question in 2015. The responses in table 1 clearly indicate that leaning independents are
less satisfied with the party toward which they lean than are weak partisans.
When third-party candidates appear on the scene, leaning independents also
differentiate themselves from weak partisans. George Wallace in 1968, John Anderson
in 1980, Ross Perot in 1992 and 1996, and Ralph Nader and Pat Buchanan in 2000
all received higher support among independent leaners than among weak partisans.
When given the opportunity, independent leaners are more likely than weak partisans
to opt for candidates outside the two-party duopoly.
All in all, there is little basis for blanket claims that leaning independents are merely
closet partisans. I hasten to emphasize that I am not endorsing the opposite blanket
Table 1. Do Any of the Parties Represent your Views?
2004 CSES 2008 CSES 2015 Polimetrix
Strong Democrats 80 81 87
Weak Democrats 72 69 46
Independent Democrats 58 53 40
Independent Independents 47 36 11
Independent Republicans 66 49 50
Weak Republicans 83 60 63
Strong Republicans 93 85 93
Source: Comparative Study of Electoral Systems; Polimetrix
Table 2. Leaning Independents Vote for Third Parties at Higher Rates Than Weak Partisans Do
Strong Democrats
Weak Democrats
Leaning Democrats Independents
Leaning Republicans
Weak Republicans
Strong Republicans
1968 8 15 19 21 14 8 2
1980 4 8 26 14 13 10 4
1992 4 17 24 36 26 25 11
1996 3 10 19 28 12 11 1
2000 1 1 8 16 8 1 1
Source: ANES
10
Morris P. Fiorina • Independents: The Marginal Members of an Electoral Coalition
claim that they are all genuine independents either. Where the proportion of true
independents lies between the low estimate of 10 percent and the high estimate of
40 percent of the eligible electorate is a question to which political science currently
has no precise answer. Recent research suggests that independents and partisans
differ psychologically.18 Clearly independents are a heterogenous category. Some are
closet partisans. Some are ideological centrists. Some are cross-pressured, preferring
one party on some issues but a different party on other issues. Some are unhappy
with both parties but one more than the other, and some are, quite simply, clueless.
But whatever they are, they are an important component of the electoral instability
that characterizes the contemporary era. Their critical contribution to contemporary
elections lies in their volatility.
Independents and Electoral Instability
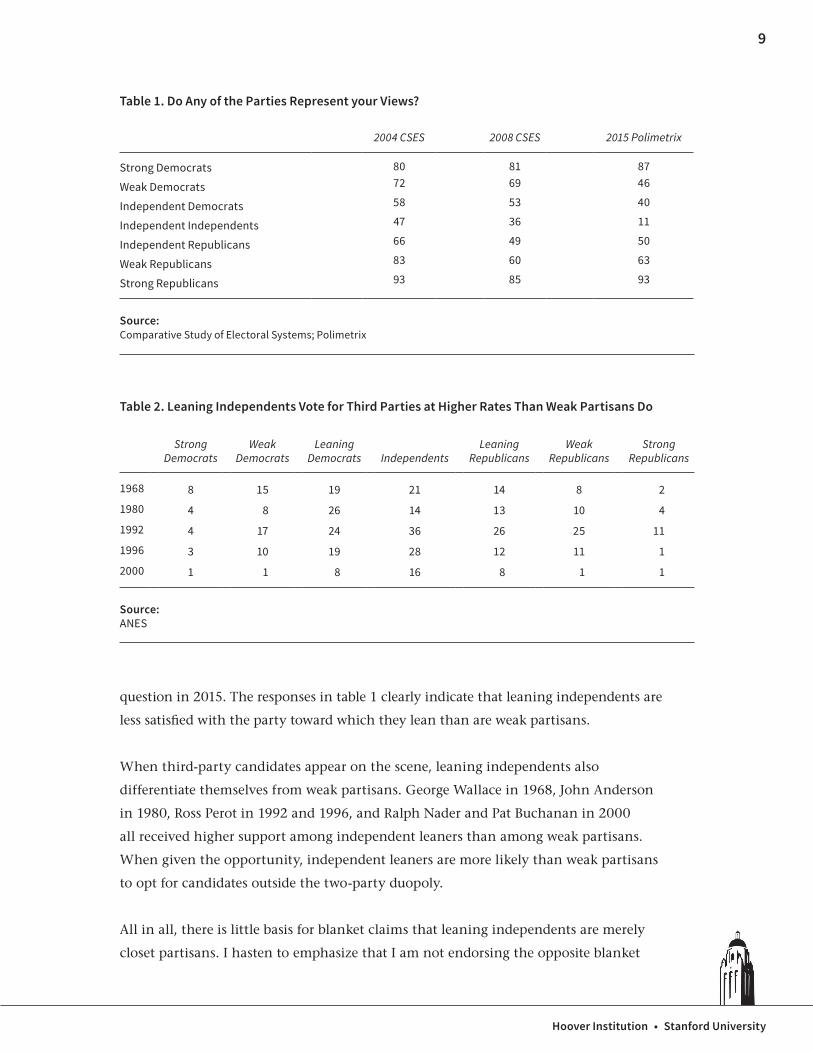
Figure 3 is a graph of the independent vote in presidential elections. Above the
50 percent line independents voted for the popular vote winner; below the line
18 This is an area that needs much more research. An important recent contribution is Samara Klar and Yanna Krupnikov, Independent Politics: How American Disdain for Parties Leads to Political Inaction (New York: Cambridge University Press, 2016).
0
10
20
30
40
50
60
70
80
90
100
1952 1956 1960 1964 1968 1972 1976 1980 1984 1988 1992 1996 2000 2004 2008 2012
% T
wo-
Part
y Pr
esid
entia
l Vot
e Su
ppor
ting
the
Win
ning
Can
dida
te
Figure 3. Presidential Winners Usually Are Those Who Carry the Independents
Source: ANES
11
Hoover Institution • Stanford University
they voted for the loser. Evidently in most elections the party that carries the
independent vote wins the election. The only exceptions are 1960 and 1976—both
extremely close elections at a time when the Democrats could theoretically win
the election with only Democratic votes—and 2004, when the Bush campaign
de-emphasized swing voters, went all out to maximize turnout of the base, and
managed to win narrowly.
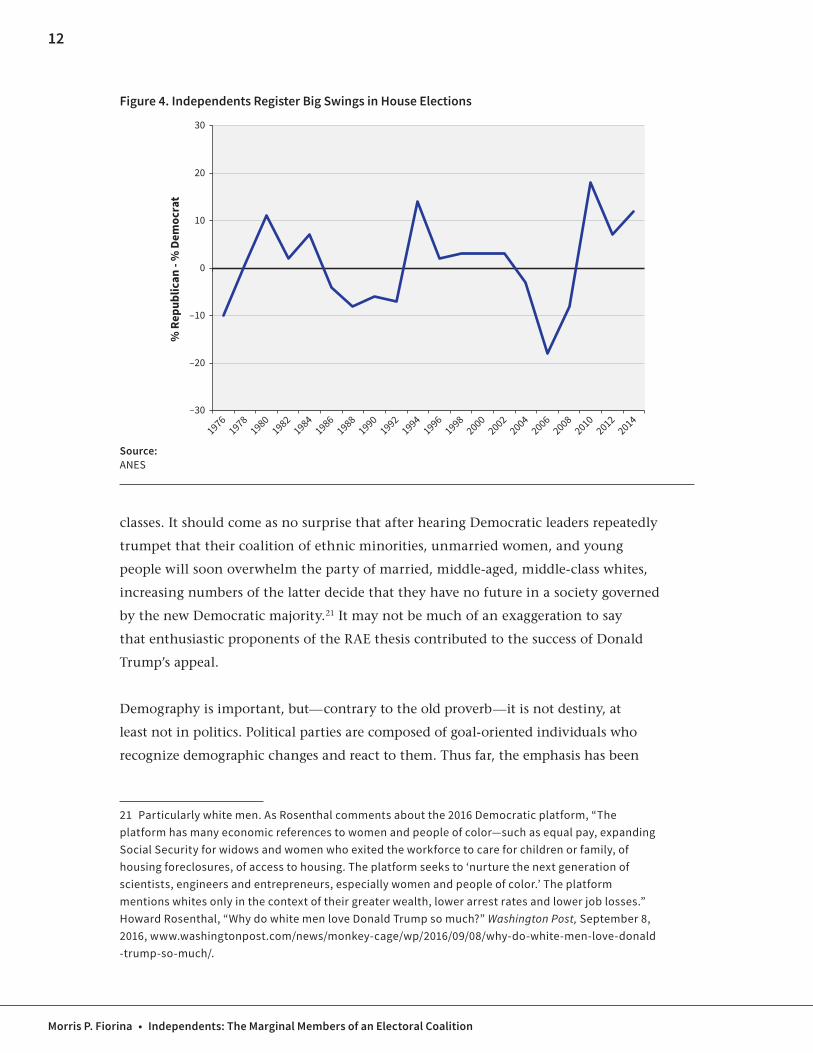
The picture in House elections is even more striking. As figure 4 shows, big swings in
the independent vote are associated with big electoral changes. A 20 percentage point
shift in the Republican direction contributed to the “Reagan Revolution” in 1980.
A similar shift was associated with the Republican takeover of the House in 1994. Then
the independents thumped the Republicans in 2006 and turned around and shellacked
the Democrats four years later—a massive 35 percentage point shift in support over a
four-year period. These movements illustrate my point about alienating the marginal
members of your electoral coalition. Each of the overreaches discussed in the fifth
essay is followed by a significant loss of independent support in the next election.
What About the Rising American Electorate?
Although I emphasize the critical role of independents as the marginal members of
electoral majorities, others place greater emphasis on specific demographic categories
as the marginal voters who contribute to our shifting majorities. Often called the
Rising American Electorate, RAE for short, the argument is that pro-Democratic
demographics are increasing while pro-Republican demographics are declining, and
that pro-Democratic demographic groups are more likely to turn out in presidential
elections than in congressional elections. John Judis and Ruy Teixeira generally are
credited with first advancing the argument.19 The RAE includes ethnic minorities,
especially Latinos, unmarried women, college-educated professionals, and young
people. By implication the declining electorate consists of whites, married people, the
less well educated, and older people (perhaps not coincidentally the Trump coalition).
The demographic trends are undeniable, and there is no question that other things
being equal, they have tended to work in a pro-Democratic direction—so far. But
recent elections have not been kind to the thesis, as Judis himself noted in a 2015
article.20 Gains in the RAE have been offset by losses in the white working and middle
19 See John Judis and Ruy Teixeira, The Emerging Democratic Majority (New York: Scribner, 2002).
20 John Judis, “The Emerging Republican Advantage,” National Journal, January 30, 2015, www . nationaljournal . com / magazine / the - emerging - republican - advantage - 20150130.
12
Morris P. Fiorina • Independents: The Marginal Members of an Electoral Coalition
classes. It should come as no surprise that after hearing Democratic leaders repeatedly
trumpet that their coalition of ethnic minorities, unmarried women, and young
people will soon overwhelm the party of married, middle-aged, middle-class whites,
increasing numbers of the latter decide that they have no future in a society governed
by the new Democratic majority.21 It may not be much of an exaggeration to say
that enthusiastic proponents of the RAE thesis contributed to the success of Donald
Trump’s appeal.
Demography is important, but—contrary to the old proverb—it is not destiny, at
least not in politics. Political parties are composed of goal-oriented individuals who
recognize demographic changes and react to them. Thus far, the emphasis has been
21 Particularly white men. As Rosenthal comments about the 2016 Democratic platform, “The platform has many economic references to women and people of color—such as equal pay, expanding Social Security for widows and women who exited the workforce to care for children or family, of housing foreclosures, of access to housing. The platform seeks to ‘nurture the next generation of scientists, engineers and entrepreneurs, especially women and people of color.’ The platform mentions whites only in the context of their greater wealth, lower arrest rates and lower job losses.” Howard Rosenthal, “Why do white men love Donald Trump so much?” Washington Post, September 8, 2016, www . washingtonpost . com / news / monkey - cage / wp / 2016 / 09 / 08 / why - do - white - men - love - donald - trump - so - much / .
–30
–20
–10
0
10
20
30
% R
epub
lican
- %
Dem
ocra
t
19761978
19801982
19841986
19881990
19921994
19961998
20002002
20042006
20082010
20122014
Figure 4. Independents Register Big Swings in House Elections
Source: ANES
13
Hoover Institution • Stanford University
on Democrats who clearly tailor the party’s appeal to take advantage of favorable
demographic trends. But political parties do not stay stupid forever, although they may
be stupid for a long time. It is safe to assume that Republicans (eventually) will act
to offset unfavorable demographic trends. Thus, the italicized other things being equal
clause generally will not hold over the long run.
The British Labour Party lost four consecutive elections in the eighteen years between
1979 and 1997, an impressive record roughly comparable to the Democrats, who lost
five out of six presidential elections in the twenty-four years between 1968 and 1992.
But Tony Blair and his allies and Bill Clinton and his eventually managed to re-orient
their parties.22 At some point those who espouse platforms that are demonstrated
electoral losers will be succeeded or pushed aside by a new cohort that espouses
policies that are more electorally salable.23 Given the history of the Democrats in the
1970s and 1980s, the Republicans could be in for several more presidential election
thumpin’s before they wise up, but there is no reason why Latinos, young people,
professionals, and unmarried women should be lost to them for decades.
What about the two-electorate variant of the Rising American Electorate thesis?
This is the argument that the presidential electorate has, and will continue to have,
a pro-Democratic cast but that the midterm electorate is more Republican because
of the lower turnout of groups that make up the RAE. While it is true that the
presidential electorate is more Democratic-leaning than the midterm electorate given
the present alignment of the parties, we do not think that this is the major factor in
the electoral instability of recent decades. The argument cannot explain when the
Republicans win the presidential election but lose the midterm badly as in 2004−06.
Moreover, consider that a midterm electorate that was 79 percent white thumped
the Republicans in 2006, while a midterm electorate that was only 75 percent
white shellacked the Democrats in 2010.24 Other things being equal, demographics
22 As noted in the first essay, the only Democratic presidential victory in that stretch was Jimmy Carter’s one-point win over the unelected incumbent who succeeded a president who resigned in disgrace.
23 The election of Jeremy Corbyn as leader of the British Labour Party reminds us that the process can work in reverse as well. Labour appears to have become stupid again. Alex Massie, “The Labour Party’s Two Word Suicide Note,” The Daily Beast, September 12, 2015, www . thedailybeast . com / articles / 2015 / 09 / 12 / labour - s - two - word - suicide - note . html.
24 Similarly, Harry Enten points out that the 2014 midterm and 2008 presidential electorates were very similar demographically, but the Republican share of the popular vote was 13 percentage points higher in the midterm. Harry Enten, “Voters Were Just as Diverse in 2014 As They Were in 2008,”
14
Morris P. Fiorina • Independents: The Marginal Members of an Electoral Coalition
alone would have predicted the opposite, but other things are rarely equal in
politics. Seth Hill, Michael Herron, and Jeffrey Lewis calculate that 78 percent
of the nation’s counties registered a higher vote for Barack Obama in 2008 than
for John Kerry in 2004, with most of the exceptions located in the South.25 Any
minor improvement in pro-Democratic demographics in those four years obviously
pales in comparison to the negative impacts on the Republicans of the housing
crisis and unpopular wars. Even more noteworthy, the slight improvement in pro-
Democratic demographics between 2006 and 2010 was evidently overwhelmed
by the vast differences in enthusiasm between Democratic and Republican voters
in the two elections, a difference that favored the Democrats in 2006 and the
Republicans in 2010.26 So, rather than stake their parties’ futures over differences of
a few percentage points in demographic categories, party leaders would do better to
do what they can to help an administration govern competently and restrain the
temptation to overreach.27
FiveThirtyEight, July 16, 2015 http:// fivethirtyeight . com / datalab / voters - were - just - as - diverse - in - 2014 - as - they - were - in - 2008 / .
25 Seth J. Hill, Michael C. Herron, and Jeffrey B. Lewis, “Economic Crisis, Iraq, and Race: A Study of the 2008 Presidential Election,” Election Law Journal 9, no. 1 (2010): 41−62.
26 Seth J. Hill, “A behavioral measure of the enthusiasm gap in American elections,” Electoral Studies 36 (2014): 28−38.
27 Moreover, some recent analyses indicate that demographic differences between voters and nonvoters may be systematically exaggerated because people who over-report voting (i.e., say that they voted when they didn’t) look more like actual voters than actual nonvoters. Stephen Ansolabehere and Eitan Hersh, “Who Really Votes?” in Facing the Challenge of Democracy: Explorations in the Analysis of Public Opinion and Political Participation, ed. Paul Sniderman and Benjamin Highton (Princeton, NJ: Princeton University Press, 2011), 267−291.
15
Hoover Institution • Stanford University
Essay Series
An Era of Tenuous Majorities: A Historical Context
Has the American Public Polarized?
The Political Parties Have Sorted
Party Sorting and Democratic Politics
The Temptation to Overreach
Independents: The Marginal Members of an Electoral Majority
The (Re)Nationalization of Congressional Elections
Is the US Experience Exceptional?
A Historical Perspective
Post-Election
The publisher has made this work available under a Creative Commons Attribution-NoDerivs license 3.0. To view a copy of this license, visit http://creativecommons.org/licenses/by-nd/3.0.
Hoover Institution Press assumes no responsibility for the persistence or accuracy of URLs for external or third-party Internet websites referred to in this publication, and does not guarantee that any content on such websites is, or will remain, accurate or appropriate.
Copyright © 2016 by the Board of Trustees of the Leland Stanford Junior University
Hoover Institution, Stanford University 434 Galvez MallStanford, CA 94305-6003650-723-1754
Hoover Institution in Washington The Johnson Center1399 New York Avenue NW, Suite 500 Washington, DC 20005202-760-3200
Series OverviewIn contrast to most of modern American political history, partisan
control of our national elective institutions has been unusually
tenuous during the past several decades. This essay series argues that
the ideologically sorted parties that contest elections today face strong
internal pressures to overreach, by which I mean emphasizing issues and
advocating positions strongly supported by the party base but which
cause the marginal members of their electoral coalitions to defect.
Thus, electoral losses predictably follow electoral victories. Institutional
control is fleeting.
The first group of essays describes the contemporary American
electorate. Despite myriad claims to the contrary, the data show that
the electorate is no more polarized now than it was in the later decades
of the twentieth century. What has happened is that the parties have
sorted so that each party is more homogeneous than in the twentieth
century; liberal Republicans and conservative Democrats have largely
passed from the political scene. The muddled middle is as large as ever
but has no home in either party. The growth in the proportion of self-
identified independents may be a reflection of the limited appeal of
today’s sorted parties.
The second group of essays develops the overreach argument, discusses
the role of independents as the marginal members of an electoral
majority, and explains how party sorting produces less split-ticket
voting. Rather than most voters being more set in their partisan
allegiances than a generation ago, they may simply have less reason to
split their tickets when almost all Democratic candidates are liberals and
all Republican candidates are conservatives.
The third group of essays embeds contemporary American politics in
two other contexts. First, in a comparative context, developments in
the European democracies are the mirror image of those in the United
States: the major European parties have depolarized or de-sorted or
both, whereas their national electorates show little change. The rise of
anti-immigrant parties may have some as yet not well-understood role
in these developments. Second, in a historical context, the instability of
American majorities today resembles that of the late nineteenth century,
when similar significant social and economic changes were occurring.
A final postelection essay will wrap up the series.
These essays naturally draw on the work of many people who have contributed to a very active research program. I thank colleagues John Aldrich, Douglas Ahler, Paul Beck, Bruce Cain, James Campbell, Shanto Iyengar, Matthew Levendusky, Sandy Maisel, Paul Sniderman, and Guarav Sood, whose questions forced me to sharpen various arguments; and David Brady in particular for almost daily conversations about the matters covered in the posts that follow.
About the Author
MoRRIS P. FIoRInAMorris Fiorina is the Wendt Family
Professor of Political Science at
Stanford University and a senior
fellow at the Hoover Institution. For
more than four decades he has
written on American politics with
particular emphasis on elections
and public opinion. Fiorina has
written or edited twelve books and
more than 100 articles, served as
chairman of the Board of the
American National Election Studies,
and received the Warren E. Miller
Career Achievement Award from
the American Political Science
Association Section on Elections,
Public Opinion, and Voting
Behavior. His widely noted book
Culture War? The Myth of a Polarized
America (with Samuel Abrams and
Jeremy Pope) is thought to have
influenced then Illinois state
senator Barack Obama’s keynote
speech to the 2004 Democratic
National Convention (“We coach
Little League in the blue states, and,
yes, we’ve got some gay friends in
the red states”).