Embed Size (px)
Citation preview

FACT BOOK A Housing Strategy for NSW
May 2020
Published by NSW Department of Planning, Industry and Environment
dpie.nsw.gov.au
Title: A Housing Strategy for NSW – Fact book
This document accompanies the Discussion Paper - A Housing Strategy for NSW.
© State of New South Wales through Department of Planning, Industry and Environment 2020. You may copy, distribute, display, download and otherwise freely deal with this publication for any purpose, provided that you attribute the Department of Planning, Industry and Environment as the owner. However, you must obtain permission if you wish to charge others for access to the publication (other than at cost); include the publication in advertising or a product for sale; modify the publication; or republish the publication on a website. You may freely link to the publication on a departmental website.
Disclaimer: The information contained in this publication is based on knowledge and understanding at the time of writing (May 2020) and may not be accurate, current or complete. The State of New South Wales (including the NSW Department of Planning, Industry and Environment), the author and the publisher take no responsibility, and will accept no liability, for the accuracy, currency, reliability or correctness of any information included in the document (including material provided by third parties). Readers should make their own inquiries and rely on their own advice when making decisions related to material contained in this publication.
A Housing Strategy for NSW – Fact book
NSW Department of Planning, Industry and Environment | i
Contents A Housing Strategy for NSW ........................................................................................................ 1
Housing Strategy Discussion Paper ............................................................................................ 1 This fact book .............................................................................................................................. 1
Theme 1: Housing supply in the right locations at the right time ............................................. 2
Sydney population growth ........................................................................................................... 2 Global city population growth comparison ................................................................................... 2 Housing supply and projected demand ........................................................................................ 3 Sydney housing supply distribution .............................................................................................. 6 Sydney housing approvals .......................................................................................................... 6 Regional NSW population growth ................................................................................................ 7 Regional NSW housing approvals ............................................................................................... 7
Theme 2: Diverse housing for diverse needs ............................................................................. 8
Aboriginal households ................................................................................................................. 8 Culturally and linguistically diverse communities ......................................................................... 9 Household composition ............................................................................................................. 11 Bedroom mix ............................................................................................................................. 17 Dwelling and household types ................................................................................................... 18 Household and dwelling sizes ................................................................................................... 20 Ageing ....................................................................................................................................... 22 People with a disability .............................................................................................................. 25
Theme 3: Housing with improved affordability and stability ................................................... 27
Home ownership rate ................................................................................................................ 27 Rental vacancy rates ................................................................................................................. 28 Housing prices and fundamental drivers .................................................................................... 29 Australian household debt ......................................................................................................... 29 Home loan lending by type of borrower ..................................................................................... 30 Rental market ............................................................................................................................ 30 Rental affordability ..................................................................................................................... 31 Rental stress ............................................................................................................................. 32 Homelessness ........................................................................................................................... 34 Ownership of private rental housing stock ................................................................................. 36 Sydney house prices by distance to CBD .................................................................................. 37
A Housing Strategy for NSW – Fact book
NSW Department of Planning, Industry and Environment | 1
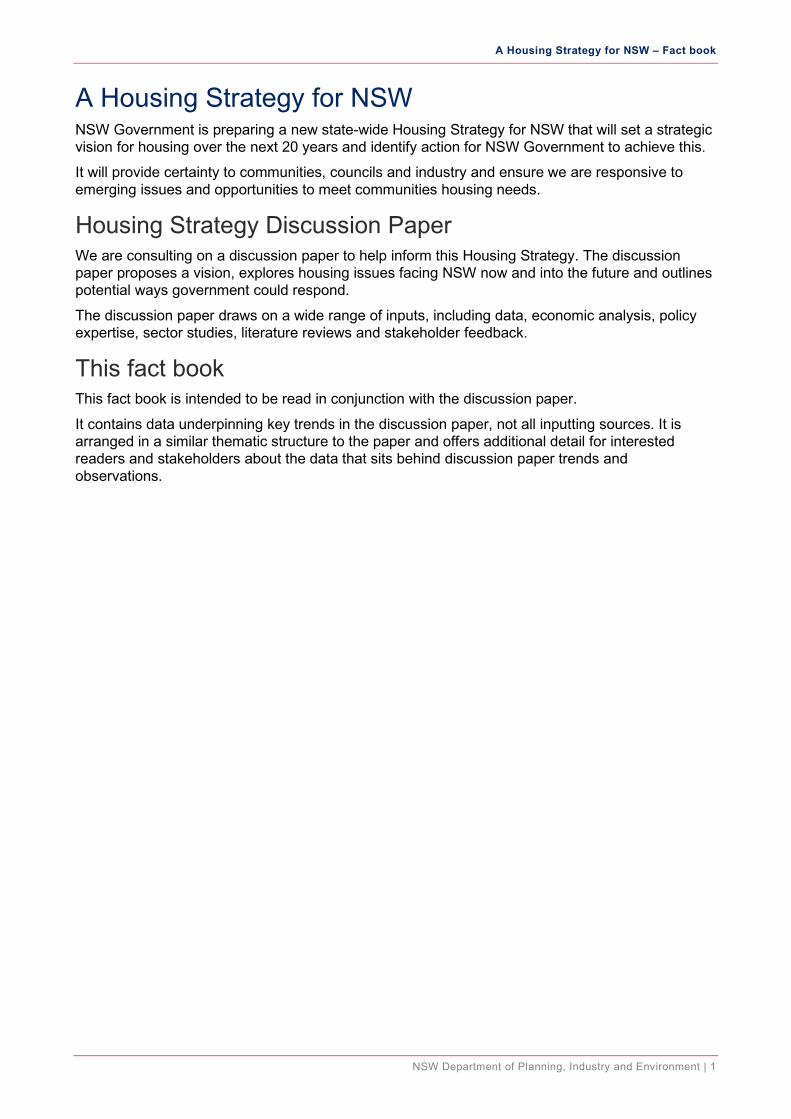
A Housing Strategy for NSW NSW Government is preparing a new state-wide Housing Strategy for NSW that will set a strategic vision for housing over the next 20 years and identify action for NSW Government to achieve this.
It will provide certainty to communities, councils and industry and ensure we are responsive to emerging issues and opportunities to meet communities housing needs.
Housing Strategy Discussion Paper We are consulting on a discussion paper to help inform this Housing Strategy. The discussion paper proposes a vision, explores housing issues facing NSW now and into the future and outlines potential ways government could respond.
The discussion paper draws on a wide range of inputs, including data, economic analysis, policy expertise, sector studies, literature reviews and stakeholder feedback.
This fact book This fact book is intended to be read in conjunction with the discussion paper.
It contains data underpinning key trends in the discussion paper, not all inputting sources. It is arranged in a similar thematic structure to the paper and offers additional detail for interested readers and stakeholders about the data that sits behind discussion paper trends and observations.

A Housing Strategy for NSW – Fact book
NSW Department of Planning, Industry and Environment | 2
Theme 1: Housing supply in the right locations at the right time Sydney population growth Figure 1 Historic (2001-2016) and projected (2021-2041) population – Greater Sydney1
Global city population growth comparison Figure 2 Global city population growth comparison
1 Australian Bureau of Statistics (2019), Regional Population Growth, Australia; Department of Planning, Industry and Environment (2019), 2019 NSW Population Projections
Milan
San Diego
Singapore
Athens
Seattle
San Francisco-San Jose Berlin
Detroit
Montreal
Phoenix
RomeBoston-Providence
Melbourne
Sydney
Washington DC
Atlanta
Barcelona
Kitakyushu
Philadelphia
Houston
Dallas-Fort Worth
Miami
Toronto
Madrid
London
Chicago
Nagoya
Paris
Los Angeles-RiversideNew York
Osaka-Kobe-Kyoto
Tokyo-Yokohama
-1.0
-0.5
0.0
0.5
1.0
1.5
2.0
1 000 2 000 3 000 4 000 5 000 6 000 7 000 8 000
y p pCities with more than 3 million people in developed countries
Sources: United Nations: World Urbanization Prospects (2018) and Country Classification; Duncan Smith, Centre for Advanced SpatialAnalysis (CASA), University Colleage London (UCL), density data based on European Commission Global Human Settlement Layer
Average population density (people per square kilometre)
Futu
re a
nnua
l pop
ulat
ion
grow
th %
(201
5-20
35)
Bubble size = Population (2015)
A Housing Strategy for NSW – Fact book
NSW Department of Planning, Industry and Environment | 3
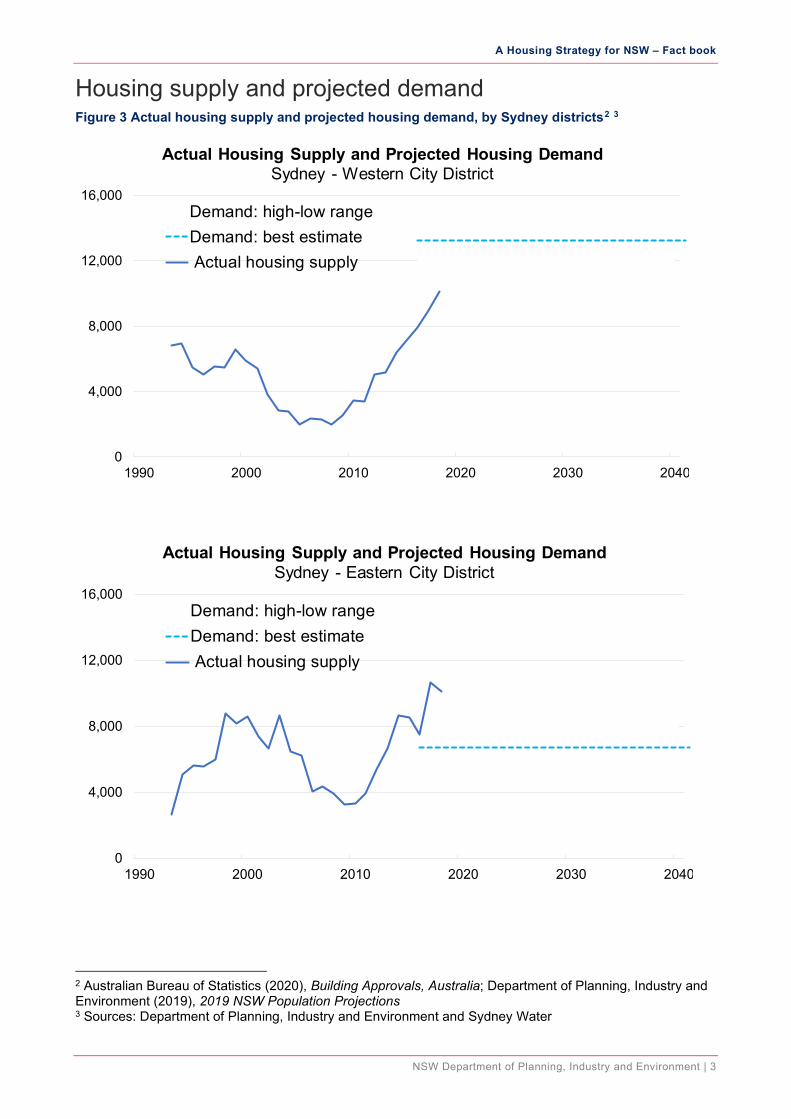
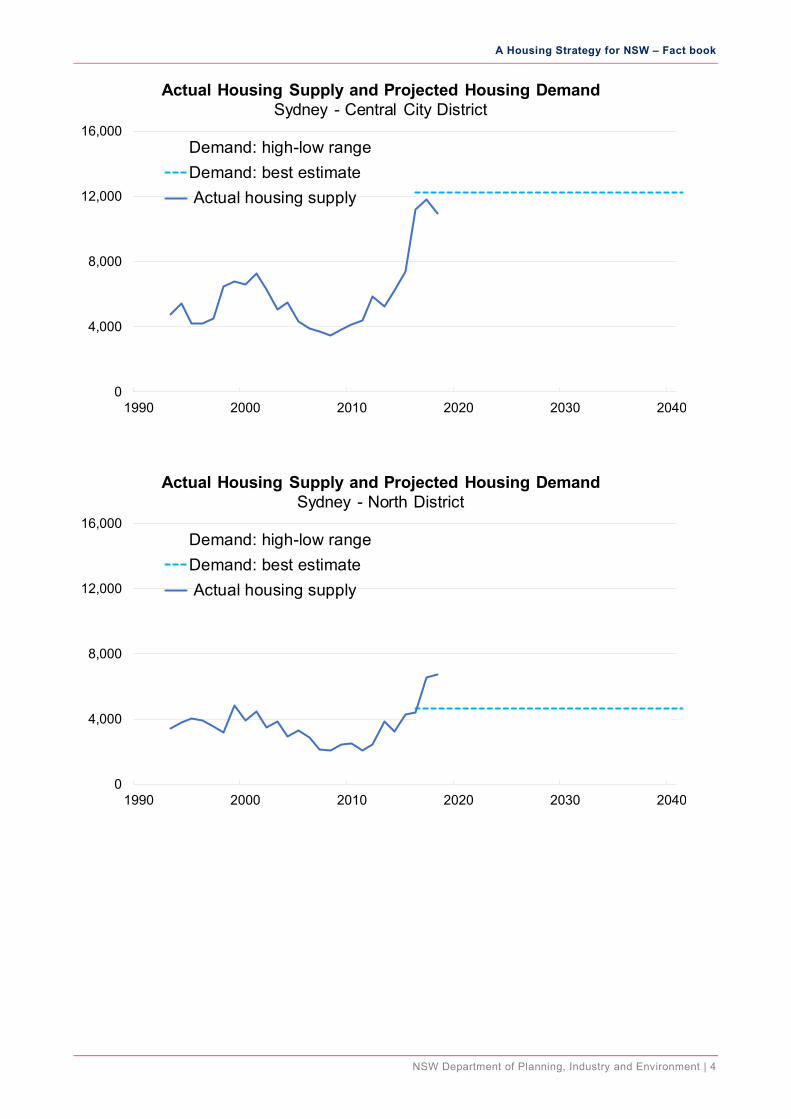
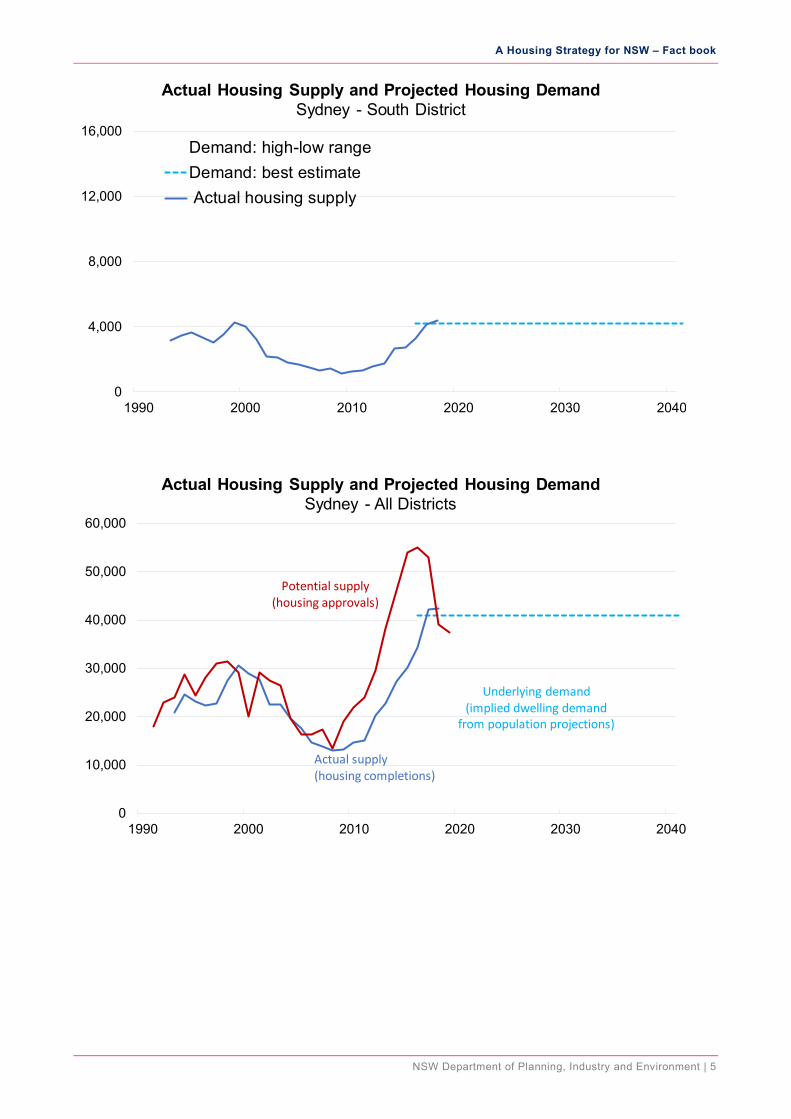
Housing supply and projected demand Figure 3 Actual housing supply and projected housing demand, by Sydney districts2 3
2 Australian Bureau of Statistics (2020), Building Approvals, Australia; Department of Planning, Industry and Environment (2019), 2019 NSW Population Projections 3 Sources: Department of Planning, Industry and Environment and Sydney Water
0
4,000
8,000
12,000
16,000
1990 2000 2010 2020 2030 2040
Actual Housing Supply and Projected Housing DemandSydney - Western City District
Demand: high-low rangeDemand: best estimate Actual housing supply
0
4,000
8,000
12,000
16,000
1990 2000 2010 2020 2030 2040
Actual Housing Supply and Projected Housing DemandSydney - Eastern City District
Demand: high-low rangeDemand: best estimate Actual housing supply
A Housing Strategy for NSW – Fact book
NSW Department of Planning, Industry and Environment | 4
0
4,000
8,000
12,000
16,000
1990 2000 2010 2020 2030 2040
Actual Housing Supply and Projected Housing DemandSydney - Central City District
Demand: high-low rangeDemand: best estimate Actual housing supply
0
4,000
8,000
12,000
16,000
1990 2000 2010 2020 2030 2040
Actual Housing Supply and Projected Housing DemandSydney - North District
Demand: high-low rangeDemand: best estimate Actual housing supply
A Housing Strategy for NSW – Fact book
NSW Department of Planning, Industry and Environment | 5
0
4,000
8,000
12,000
16,000
1990 2000 2010 2020 2030 2040
Actual Housing Supply and Projected Housing DemandSydney - South District
Demand: high-low rangeDemand: best estimate Actual housing supply
0
10,000
20,000
30,000
40,000
50,000
60,000
1990 2000 2010 2020 2030 2040
Actual Housing Supply and Projected Housing DemandSydney - All Districts
Actual supply(housing completions)
Underlying demand(implied dwelling demand
from population projections)
Potential supply(housing approvals)
A Housing Strategy for NSW – Fact book
NSW Department of Planning, Industry and Environment | 6
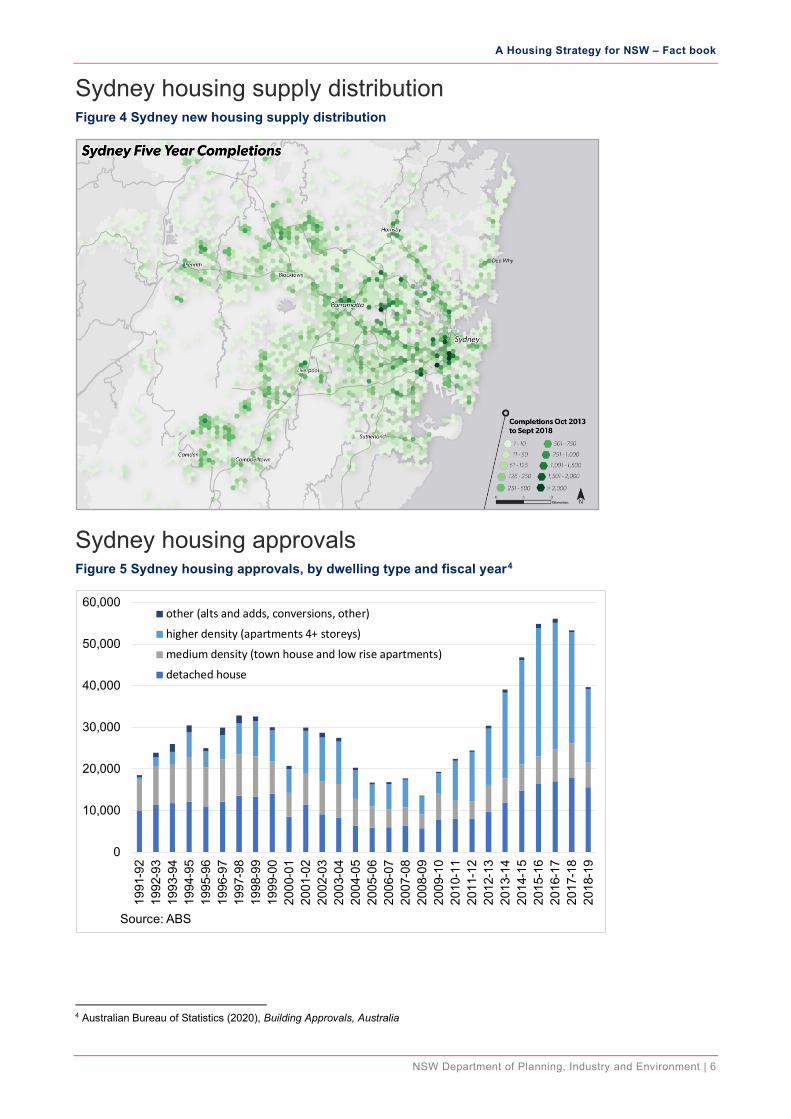
Sydney housing supply distribution Figure 4 Sydney new housing supply distribution
Sydney housing approvals Figure 5 Sydney housing approvals, by dwelling type and fiscal year4
4 Australian Bureau of Statistics (2020), Building Approvals, Australia
0
10,000
20,000
30,000
40,000
50,000
60,000
1991
-92
1992
-93
1993
-94
1994
-95
1995
-96
1996
-97
1997
-98
1998
-99
1999
-00
2000
-01
2001
-02
2002
-03
2003
-04
2004
-05
2005
-06
2006
-07
2007
-08
2008
-09
2009
-10
2010
-11
2011
-12
2012
-13
2013
-14
2014
-15
2015
-16
2016
-17
2017
-18
2018
-19
other (alts and adds, conversions, other)
higher density (apartments 4+ storeys)
medium density (town house and low rise apartments)
detached house
Source: ABS
A Housing Strategy for NSW – Fact book
NSW Department of Planning, Industry and Environment | 7
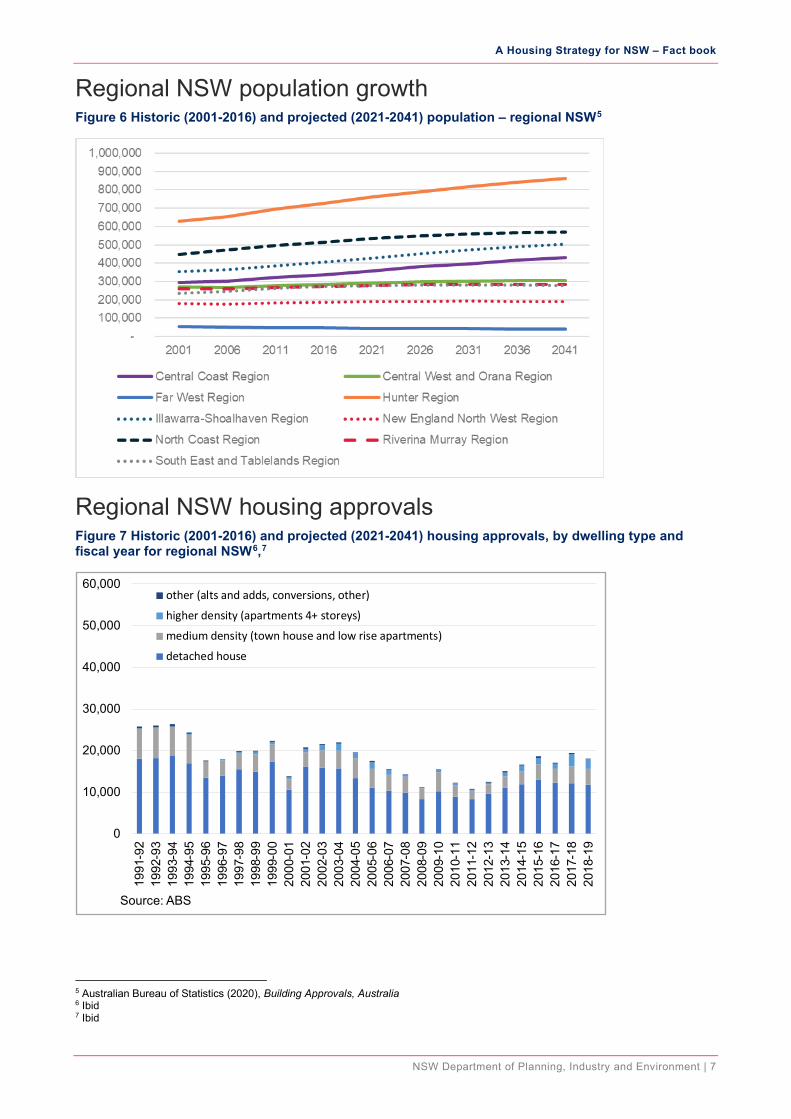
Regional NSW population growth Figure 6 Historic (2001-2016) and projected (2021-2041) population – regional NSW5
Regional NSW housing approvals Figure 7 Historic (2001-2016) and projected (2021-2041) housing approvals, by dwelling type and fiscal year for regional NSW6,7
5 Australian Bureau of Statistics (2020), Building Approvals, Australia 6 Ibid 7 Ibid
0
10,000
20,000
30,000
40,000
50,000
60,000
1991
-92
1992
-93
1993
-94
1994
-95
1995
-96
1996
-97
1997
-98
1998
-99
1999
-00
2000
-01
2001
-02
2002
-03
2003
-04
2004
-05
2005
-06
2006
-07
2007
-08
2008
-09
2009
-10
2010
-11
2011
-12
2012
-13
2013
-14
2014
-15
2015
-16
2016
-17
2017
-18
2018
-19
other (alts and adds, conversions, other)
higher density (apartments 4+ storeys)
medium density (town house and low rise apartments)
detached house
Source: ABS
A Housing Strategy for NSW – Fact book
NSW Department of Planning, Industry and Environment | 8
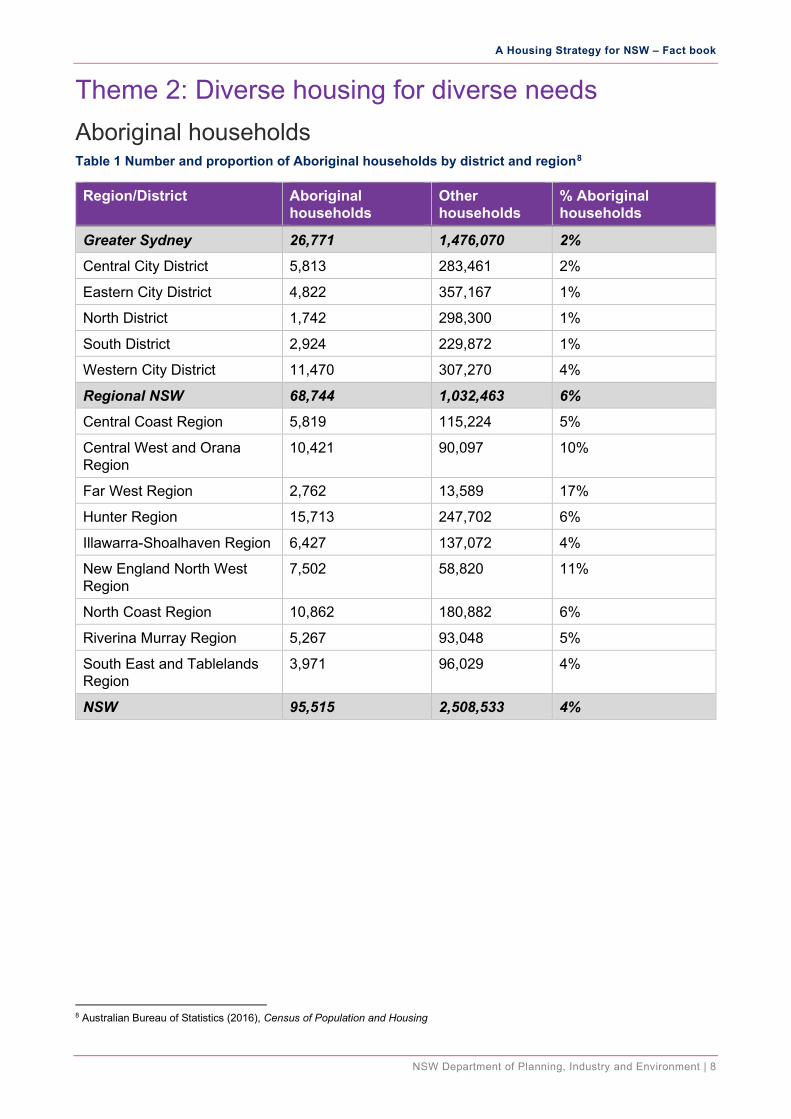
Theme 2: Diverse housing for diverse needs Aboriginal households Table 1 Number and proportion of Aboriginal households by district and region8
Region/District Aboriginal households
Other households
% Aboriginal households
Greater Sydney 26,771 1,476,070 2%
Central City District 5,813 283,461 2%
Eastern City District 4,822 357,167 1%
North District 1,742 298,300 1%
South District 2,924 229,872 1%
Western City District 11,470 307,270 4%
Regional NSW 68,744 1,032,463 6%
Central Coast Region 5,819 115,224 5%
Central West and Orana Region
10,421 90,097 10%
Far West Region 2,762 13,589 17%
Hunter Region 15,713 247,702 6%
Illawarra-Shoalhaven Region 6,427 137,072 4%
New England North West Region
7,502 58,820 11%
North Coast Region 10,862 180,882 6%
Riverina Murray Region 5,267 93,048 5%
South East and Tablelands Region
3,971 96,029 4%
NSW 95,515 2,508,533 4%
8 Australian Bureau of Statistics (2016), Census of Population and Housing
A Housing Strategy for NSW – Fact book
NSW Department of Planning, Industry and Environment | 9
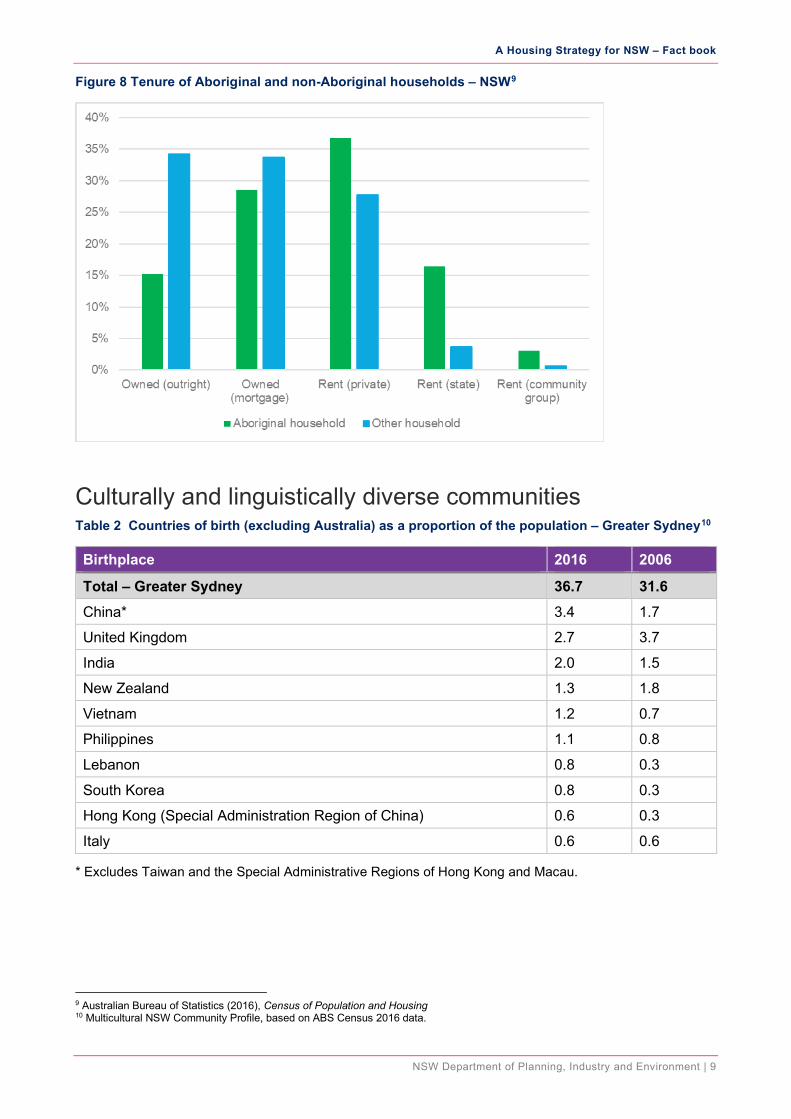
Figure 8 Tenure of Aboriginal and non-Aboriginal households – NSW9
Culturally and linguistically diverse communities Table 2 Countries of birth (excluding Australia) as a proportion of the population – Greater Sydney10
Birthplace 2016 2006
Total – Greater Sydney 36.7 31.6 China* 3.4 1.7
United Kingdom 2.7 3.7
India 2.0 1.5
New Zealand 1.3 1.8
Vietnam 1.2 0.7
Philippines 1.1 0.8
Lebanon 0.8 0.3
South Korea 0.8 0.3
Hong Kong (Special Administration Region of China) 0.6 0.3
Italy 0.6 0.6
* Excludes Taiwan and the Special Administrative Regions of Hong Kong and Macau.
9 Australian Bureau of Statistics (2016), Census of Population and Housing 10 Multicultural NSW Community Profile, based on ABS Census 2016 data.
A Housing Strategy for NSW – Fact book
NSW Department of Planning, Industry and Environment | 10
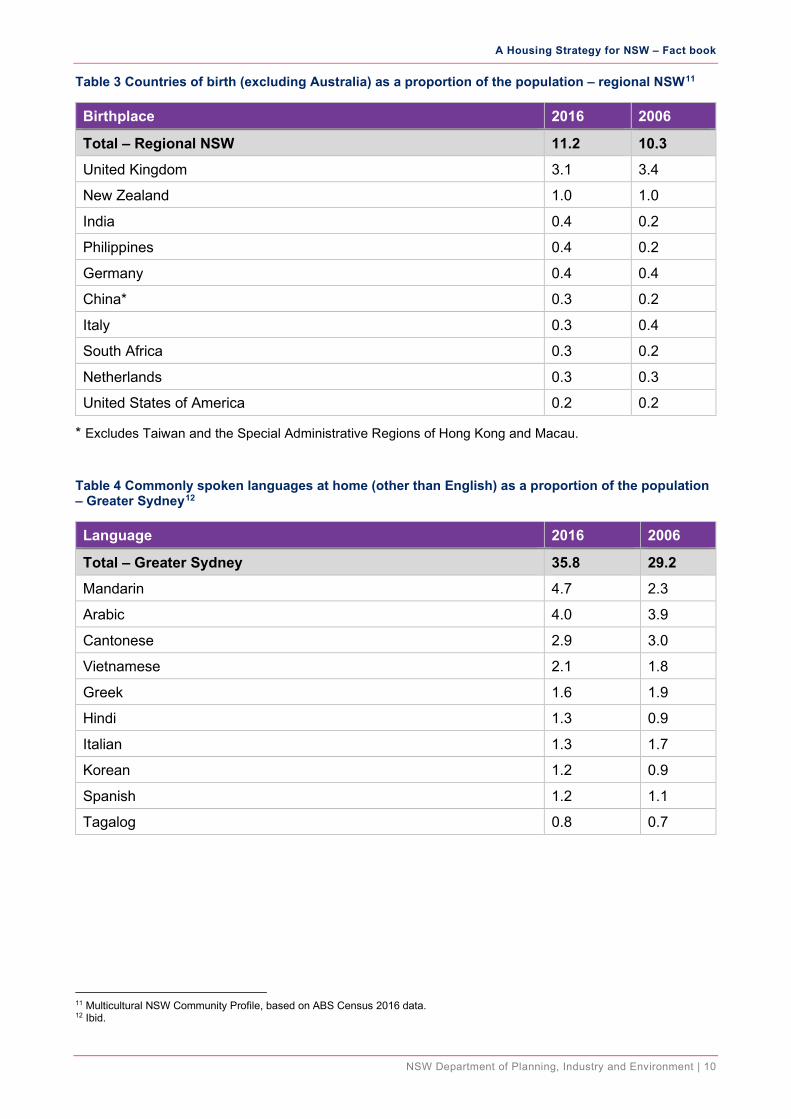
Table 3 Countries of birth (excluding Australia) as a proportion of the population – regional NSW11
Birthplace 2016 2006
Total – Regional NSW 11.2 10.3 United Kingdom 3.1 3.4
New Zealand 1.0 1.0
India 0.4 0.2
Philippines 0.4 0.2
Germany 0.4 0.4
China* 0.3 0.2
Italy 0.3 0.4
South Africa 0.3 0.2
Netherlands 0.3 0.3
United States of America 0.2 0.2
* Excludes Taiwan and the Special Administrative Regions of Hong Kong and Macau.
Table 4 Commonly spoken languages at home (other than English) as a proportion of the population – Greater Sydney12
Language 2016 2006
Total – Greater Sydney 35.8 29.2 Mandarin 4.7 2.3
Arabic 4.0 3.9
Cantonese 2.9 3.0
Vietnamese 2.1 1.8
Greek 1.6 1.9
Hindi 1.3 0.9
Italian 1.3 1.7
Korean 1.2 0.9
Spanish 1.2 1.1
Tagalog 0.8 0.7
11 Multicultural NSW Community Profile, based on ABS Census 2016 data. 12 Ibid.
A Housing Strategy for NSW – Fact book
NSW Department of Planning, Industry and Environment | 11
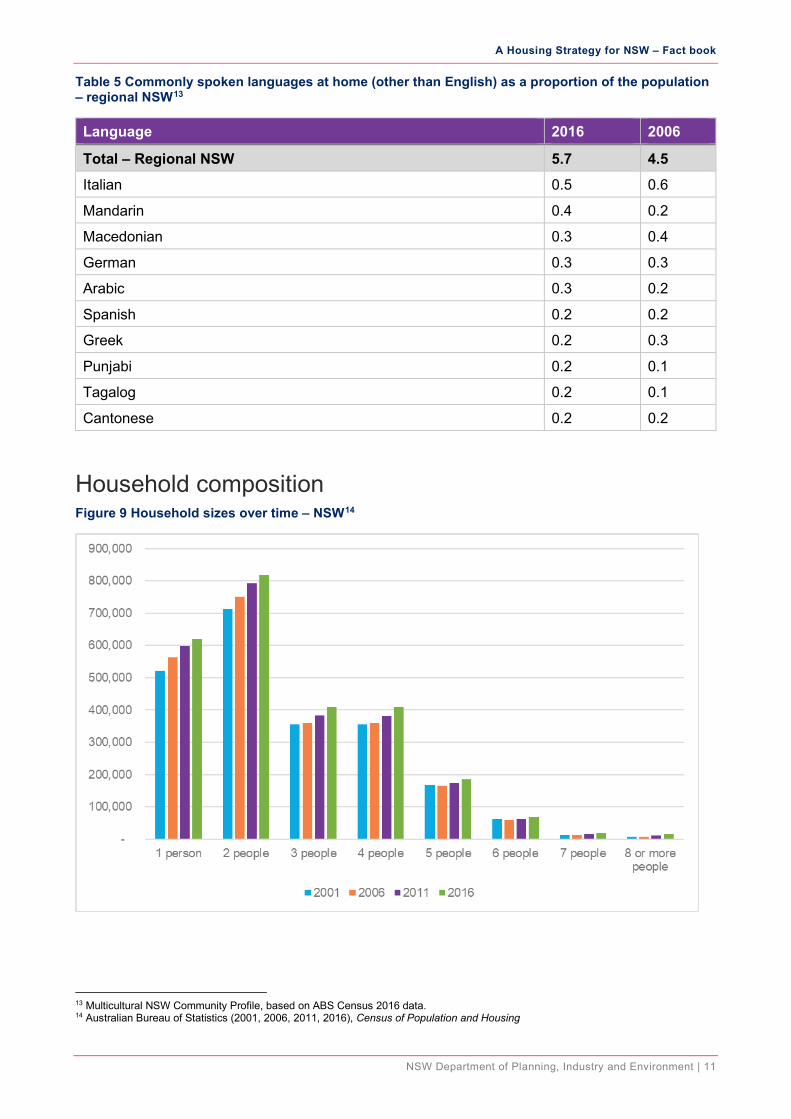
Table 5 Commonly spoken languages at home (other than English) as a proportion of the population – regional NSW13
Language 2016 2006
Total – Regional NSW 5.7 4.5 Italian 0.5 0.6
Mandarin 0.4 0.2
Macedonian 0.3 0.4
German 0.3 0.3
Arabic 0.3 0.2
Spanish 0.2 0.2
Greek 0.2 0.3
Punjabi 0.2 0.1
Tagalog 0.2 0.1
Cantonese 0.2 0.2
Household composition Figure 9 Household sizes over time – NSW14
13 Multicultural NSW Community Profile, based on ABS Census 2016 data. 14 Australian Bureau of Statistics (2001, 2006, 2011, 2016), Census of Population and Housing

A Housing Strategy for NSW – Fact book
NSW Department of Planning, Industry and Environment | 12
Table 6 Household sizes over time (as proportion of all households) – NSW15
Number of people 2001 2006 2011 2016
1 person 23.8% 24.7% 24.8% 24.4%
2 people 32.5% 33.0% 32.8% 32.1%
3 people 16.2% 15.8% 15.8% 16.1%
4 people 16.2% 15.8% 15.8% 16.1%
5 people 7.6% 7.2% 7.1% 7.3%
6 people 2.8% 2.6% 2.6% 2.7%
7 people 0.6% 0.6% 0.6% 0.8%
8 or more people 0.3% 0.3% 0.4% 0.6%
Figure 10 Proportion of young people living at home, by age16
15 Australian Bureau of Statistics (2001, 2006, 2011, 2016), Census of Population and Housing 16 Australian Bureau of Statistics (2016), Census of Population and Housing
A Housing Strategy for NSW – Fact book
NSW Department of Planning, Industry and Environment | 13
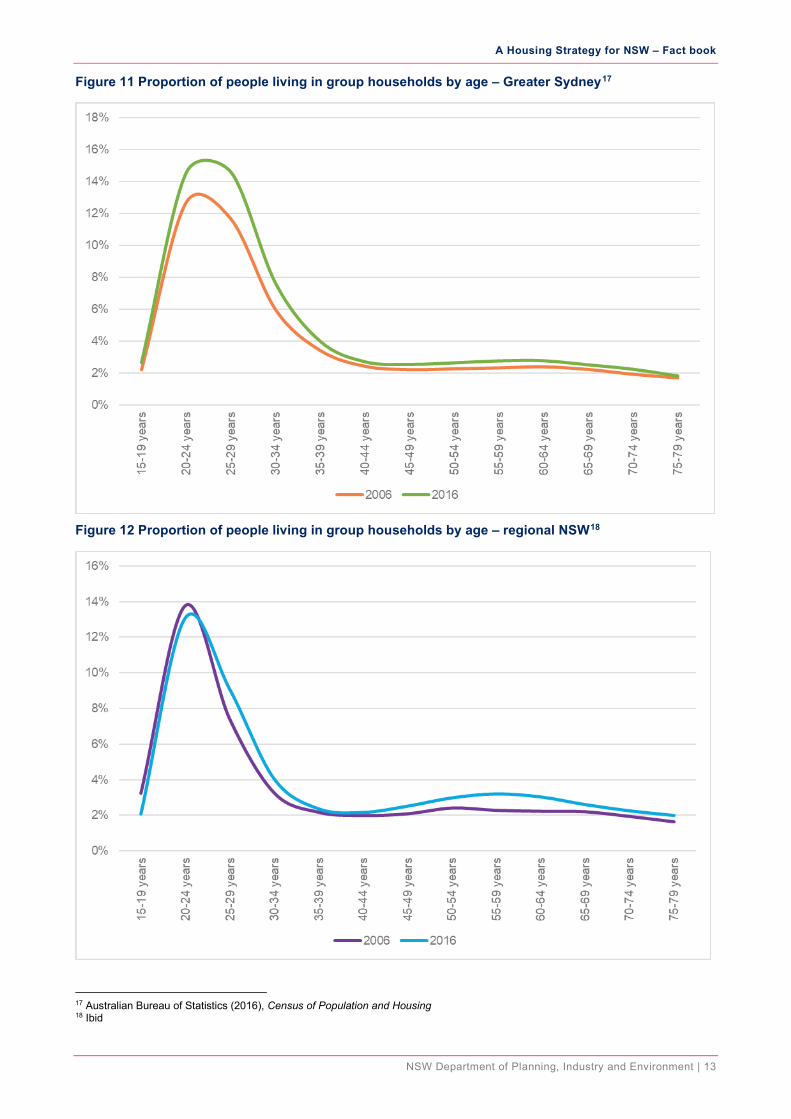
Figure 11 Proportion of people living in group households by age – Greater Sydney17
Figure 12 Proportion of people living in group households by age – regional NSW18
17 Australian Bureau of Statistics (2016), Census of Population and Housing 18 Ibid
A Housing Strategy for NSW – Fact book
NSW Department of Planning, Industry and Environment | 14
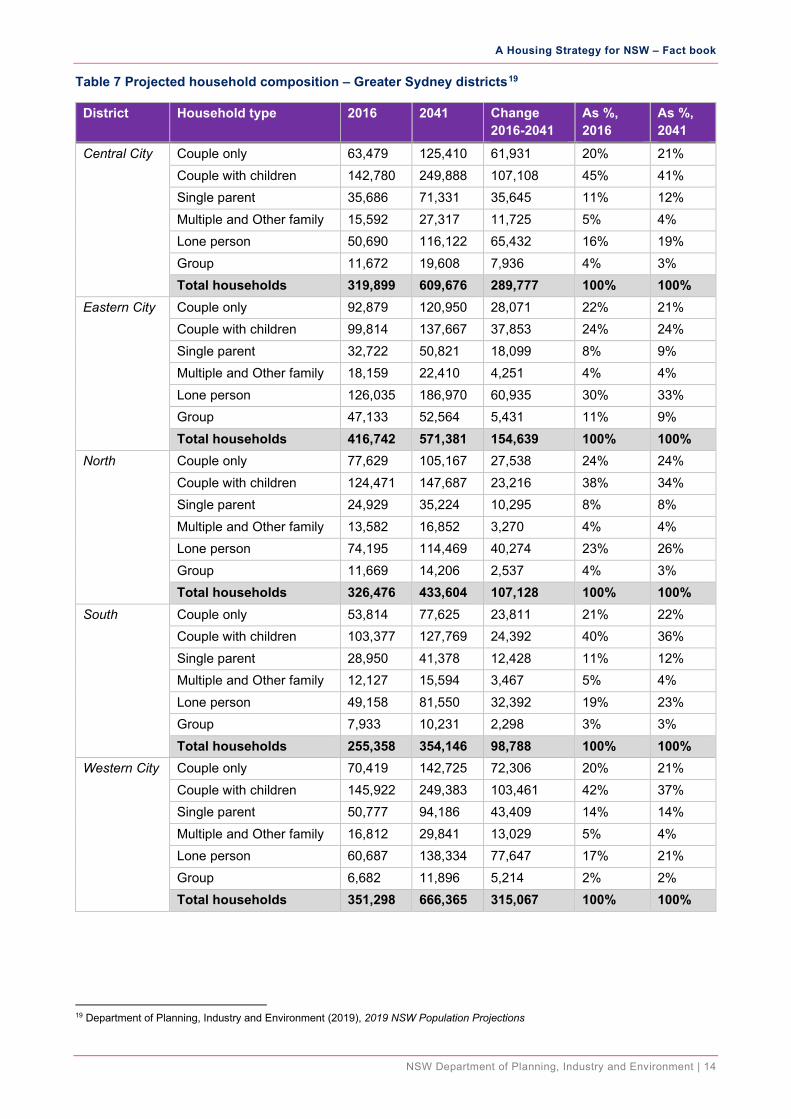
Table 7 Projected household composition – Greater Sydney districts19
District Household type 2016 2041 Change 2016-2041
As %, 2016
As %, 2041
Central City Couple only 63,479 125,410 61,931 20% 21% Couple with children 142,780 249,888 107,108 45% 41% Single parent 35,686 71,331 35,645 11% 12% Multiple and Other family 15,592 27,317 11,725 5% 4% Lone person 50,690 116,122 65,432 16% 19% Group 11,672 19,608 7,936 4% 3% Total households 319,899 609,676 289,777 100% 100%
Eastern City Couple only 92,879 120,950 28,071 22% 21% Couple with children 99,814 137,667 37,853 24% 24% Single parent 32,722 50,821 18,099 8% 9% Multiple and Other family 18,159 22,410 4,251 4% 4% Lone person 126,035 186,970 60,935 30% 33% Group 47,133 52,564 5,431 11% 9% Total households 416,742 571,381 154,639 100% 100%
North Couple only 77,629 105,167 27,538 24% 24% Couple with children 124,471 147,687 23,216 38% 34% Single parent 24,929 35,224 10,295 8% 8% Multiple and Other family 13,582 16,852 3,270 4% 4% Lone person 74,195 114,469 40,274 23% 26% Group 11,669 14,206 2,537 4% 3% Total households 326,476 433,604 107,128 100% 100%
South Couple only 53,814 77,625 23,811 21% 22% Couple with children 103,377 127,769 24,392 40% 36% Single parent 28,950 41,378 12,428 11% 12% Multiple and Other family 12,127 15,594 3,467 5% 4% Lone person 49,158 81,550 32,392 19% 23% Group 7,933 10,231 2,298 3% 3% Total households 255,358 354,146 98,788 100% 100%
Western City Couple only 70,419 142,725 72,306 20% 21% Couple with children 145,922 249,383 103,461 42% 37% Single parent 50,777 94,186 43,409 14% 14% Multiple and Other family 16,812 29,841 13,029 5% 4% Lone person 60,687 138,334 77,647 17% 21% Group 6,682 11,896 5,214 2% 2% Total households 351,298 666,365 315,067 100% 100%
19 Department of Planning, Industry and Environment (2019), 2019 NSW Population Projections
A Housing Strategy for NSW – Fact book
NSW Department of Planning, Industry and Environment | 15
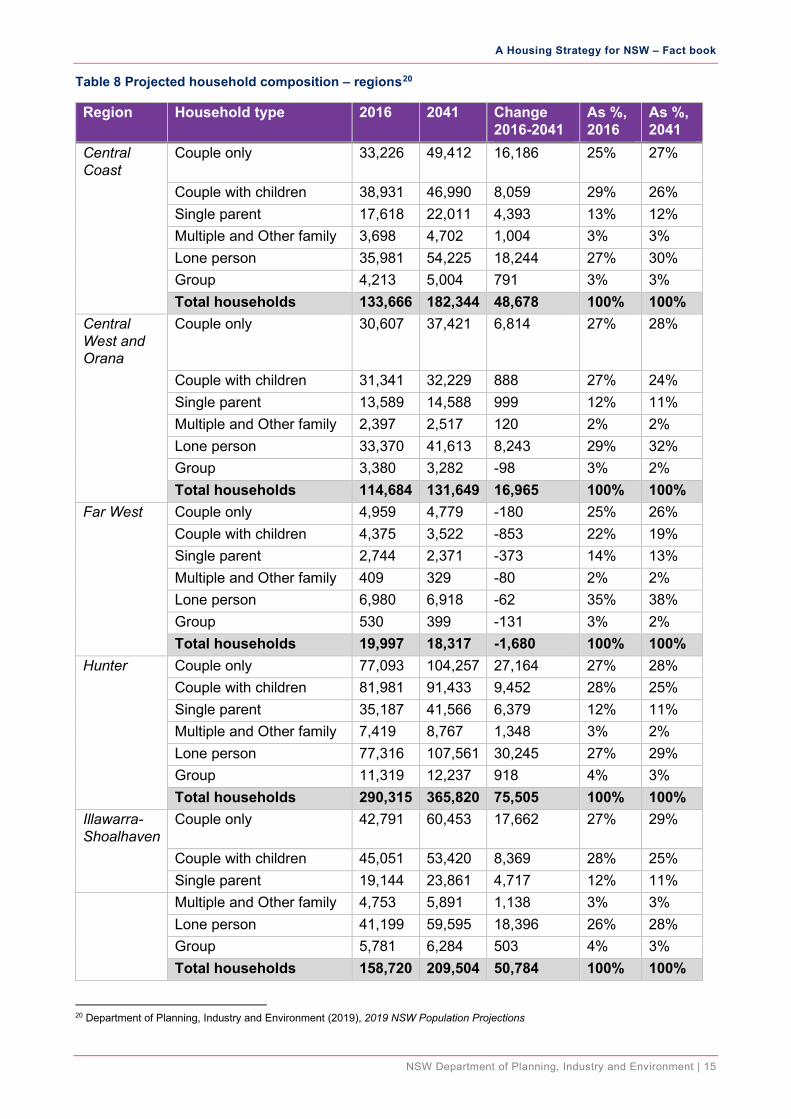
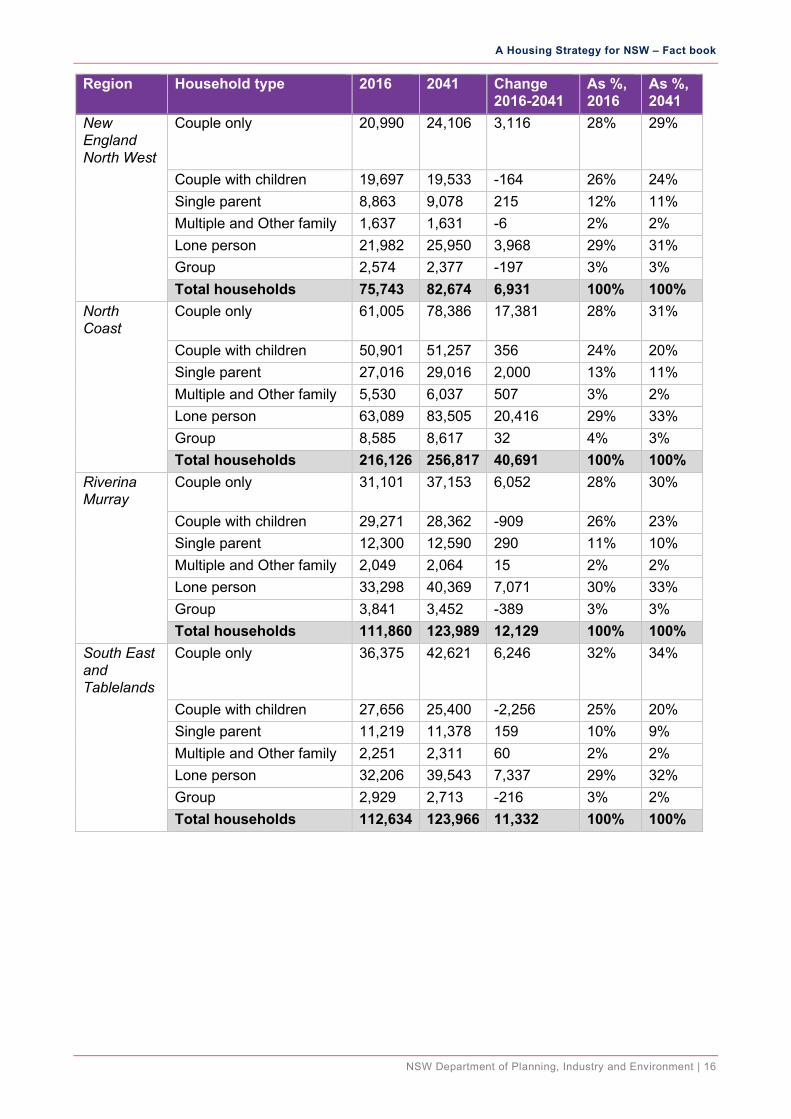
Table 8 Projected household composition – regions20
Region Household type 2016 2041 Change 2016-2041
As %, 2016
As %, 2041
Central Coast
Couple only 33,226 49,412 16,186 25% 27%
Couple with children 38,931 46,990 8,059 29% 26% Single parent 17,618 22,011 4,393 13% 12% Multiple and Other family 3,698 4,702 1,004 3% 3% Lone person 35,981 54,225 18,244 27% 30% Group 4,213 5,004 791 3% 3% Total households 133,666 182,344 48,678 100% 100%
Central West and Orana
Couple only 30,607 37,421 6,814 27% 28%
Couple with children 31,341 32,229 888 27% 24% Single parent 13,589 14,588 999 12% 11% Multiple and Other family 2,397 2,517 120 2% 2% Lone person 33,370 41,613 8,243 29% 32% Group 3,380 3,282 -98 3% 2% Total households 114,684 131,649 16,965 100% 100%
Far West Couple only 4,959 4,779 -180 25% 26% Couple with children 4,375 3,522 -853 22% 19% Single parent 2,744 2,371 -373 14% 13% Multiple and Other family 409 329 -80 2% 2% Lone person 6,980 6,918 -62 35% 38% Group 530 399 -131 3% 2% Total households 19,997 18,317 -1,680 100% 100%
Hunter Couple only 77,093 104,257 27,164 27% 28% Couple with children 81,981 91,433 9,452 28% 25% Single parent 35,187 41,566 6,379 12% 11% Multiple and Other family 7,419 8,767 1,348 3% 2% Lone person 77,316 107,561 30,245 27% 29% Group 11,319 12,237 918 4% 3% Total households 290,315 365,820 75,505 100% 100%
Illawarra-Shoalhaven
Couple only 42,791 60,453 17,662 27% 29%
Couple with children 45,051 53,420 8,369 28% 25% Single parent 19,144 23,861 4,717 12% 11% Multiple and Other family 4,753 5,891 1,138 3% 3% Lone person 41,199 59,595 18,396 26% 28% Group 5,781 6,284 503 4% 3% Total households 158,720 209,504 50,784 100% 100%
20 Department of Planning, Industry and Environment (2019), 2019 NSW Population Projections
A Housing Strategy for NSW – Fact book
NSW Department of Planning, Industry and Environment | 16
Region Household type 2016 2041 Change 2016-2041
As %, 2016
As %, 2041
New England North West
Couple only 20,990 24,106 3,116 28% 29%
Couple with children 19,697 19,533 -164 26% 24% Single parent 8,863 9,078 215 12% 11% Multiple and Other family 1,637 1,631 -6 2% 2% Lone person 21,982 25,950 3,968 29% 31% Group 2,574 2,377 -197 3% 3% Total households 75,743 82,674 6,931 100% 100%
North Coast
Couple only 61,005 78,386 17,381 28% 31%
Couple with children 50,901 51,257 356 24% 20% Single parent 27,016 29,016 2,000 13% 11% Multiple and Other family 5,530 6,037 507 3% 2% Lone person 63,089 83,505 20,416 29% 33% Group 8,585 8,617 32 4% 3% Total households 216,126 256,817 40,691 100% 100%
Riverina Murray
Couple only 31,101 37,153 6,052 28% 30%
Couple with children 29,271 28,362 -909 26% 23% Single parent 12,300 12,590 290 11% 10% Multiple and Other family 2,049 2,064 15 2% 2% Lone person 33,298 40,369 7,071 30% 33% Group 3,841 3,452 -389 3% 3% Total households 111,860 123,989 12,129 100% 100%
South East and Tablelands
Couple only 36,375 42,621 6,246 32% 34%
Couple with children 27,656 25,400 -2,256 25% 20% Single parent 11,219 11,378 159 10% 9% Multiple and Other family 2,251 2,311 60 2% 2% Lone person 32,206 39,543 7,337 29% 32% Group 2,929 2,713 -216 3% 2% Total households 112,634 123,966 11,332 100% 100%
A Housing Strategy for NSW – Fact book
NSW Department of Planning, Industry and Environment | 17
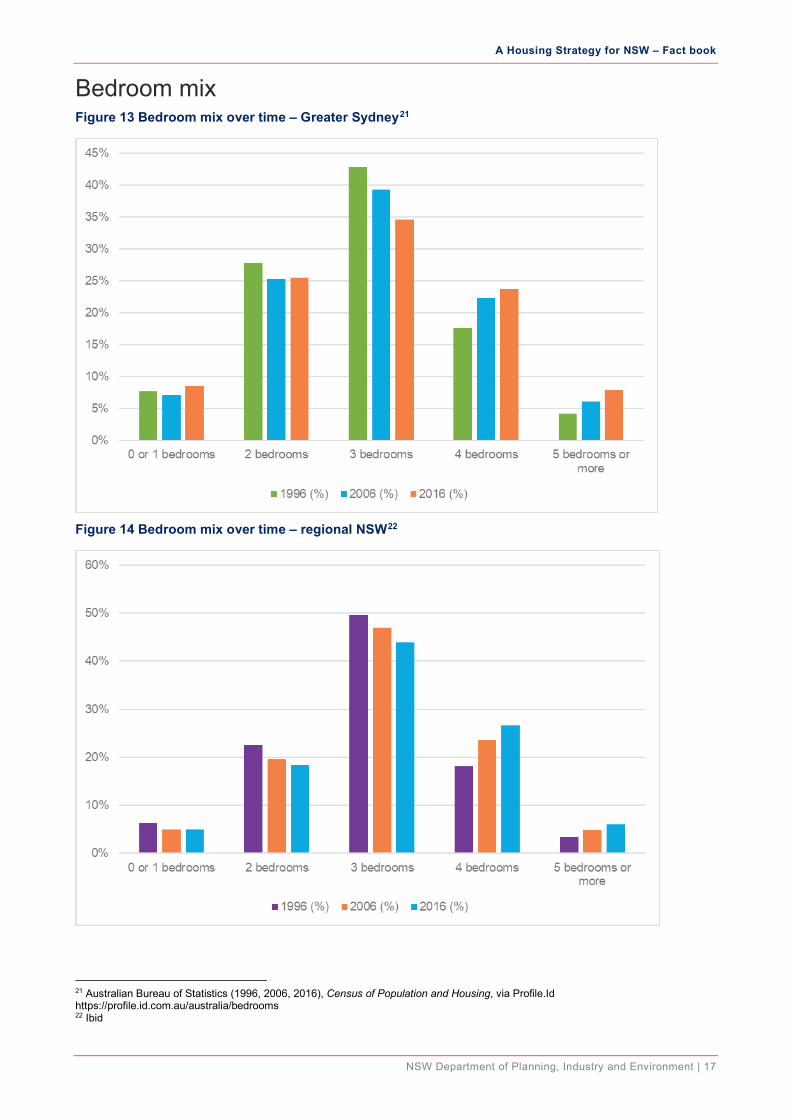
Bedroom mix Figure 13 Bedroom mix over time – Greater Sydney21
Figure 14 Bedroom mix over time – regional NSW22
21 Australian Bureau of Statistics (1996, 2006, 2016), Census of Population and Housing, via Profile.Id https://profile.id.com.au/australia/bedrooms 22 Ibid
A Housing Strategy for NSW – Fact book
NSW Department of Planning, Industry and Environment | 18
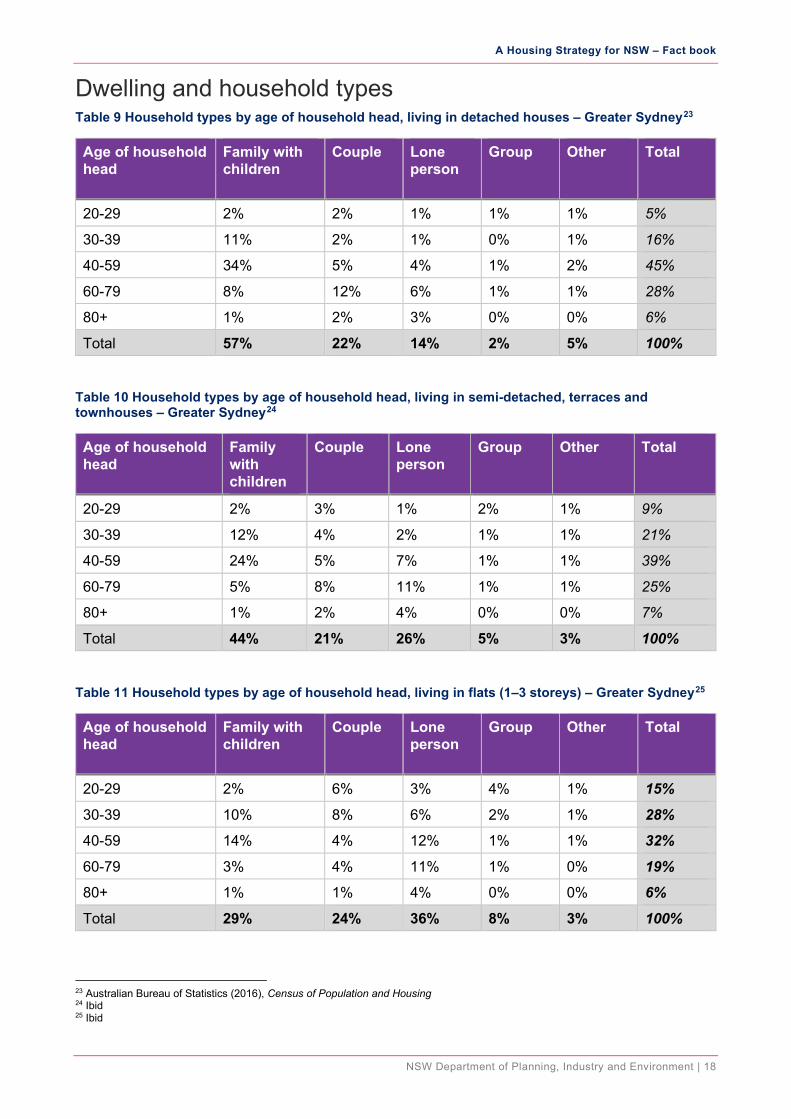
Dwelling and household types Table 9 Household types by age of household head, living in detached houses – Greater Sydney23
Age of household head
Family with children
Couple Lone person
Group Other Total
20-29 2% 2% 1% 1% 1% 5%
30-39 11% 2% 1% 0% 1% 16%
40-59 34% 5% 4% 1% 2% 45%
60-79 8% 12% 6% 1% 1% 28%
80+ 1% 2% 3% 0% 0% 6%
Total 57% 22% 14% 2% 5% 100%
Table 10 Household types by age of household head, living in semi-detached, terraces and townhouses – Greater Sydney24
Age of household head
Family with children
Couple Lone person
Group Other Total
20-29 2% 3% 1% 2% 1% 9%
30-39 12% 4% 2% 1% 1% 21%
40-59 24% 5% 7% 1% 1% 39%
60-79 5% 8% 11% 1% 1% 25%
80+ 1% 2% 4% 0% 0% 7%
Total 44% 21% 26% 5% 3% 100%
Table 11 Household types by age of household head, living in flats (1–3 storeys) – Greater Sydney25
Age of household head
Family with children
Couple Lone person
Group Other Total
20-29 2% 6% 3% 4% 1% 15%
30-39 10% 8% 6% 2% 1% 28%
40-59 14% 4% 12% 1% 1% 32%
60-79 3% 4% 11% 1% 0% 19%
80+ 1% 1% 4% 0% 0% 6%
Total 29% 24% 36% 8% 3% 100%
23 Australian Bureau of Statistics (2016), Census of Population and Housing 24 Ibid 25 Ibid
A Housing Strategy for NSW – Fact book
NSW Department of Planning, Industry and Environment | 19
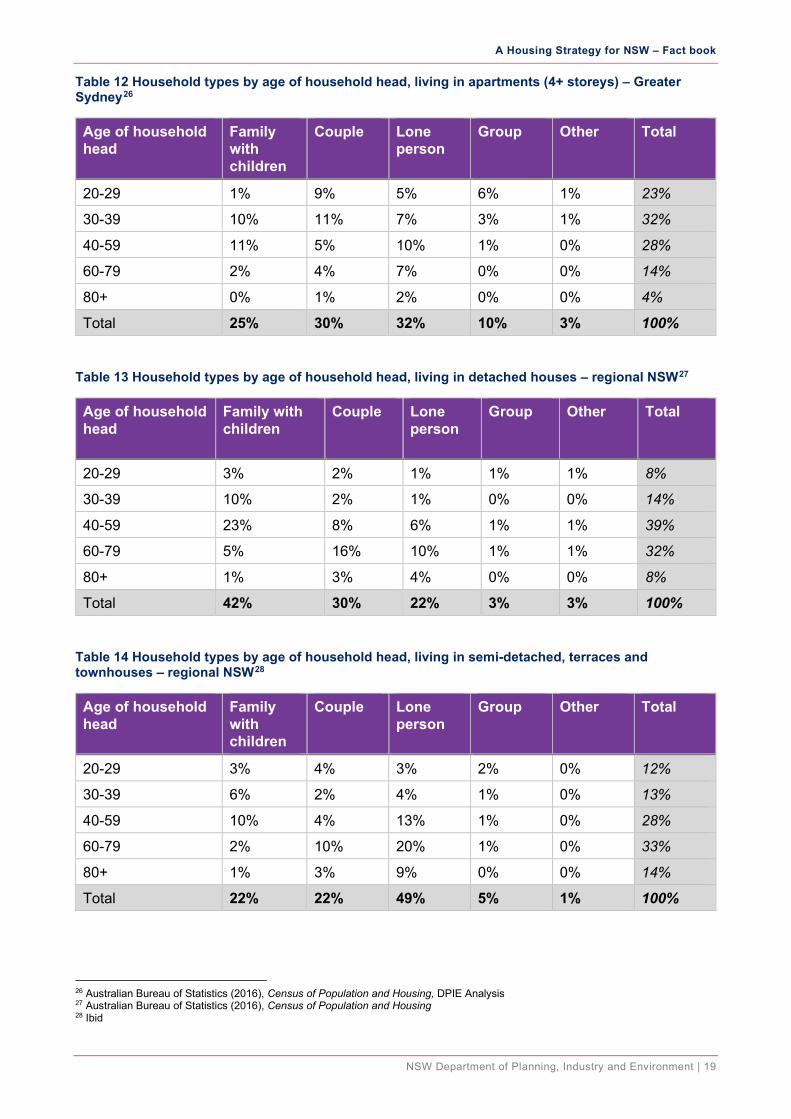
Table 12 Household types by age of household head, living in apartments (4+ storeys) – Greater Sydney26
Age of household head
Family with children
Couple Lone person
Group Other Total
20-29 1% 9% 5% 6% 1% 23%
30-39 10% 11% 7% 3% 1% 32%
40-59 11% 5% 10% 1% 0% 28%
60-79 2% 4% 7% 0% 0% 14%
80+ 0% 1% 2% 0% 0% 4%
Total 25% 30% 32% 10% 3% 100%
Table 13 Household types by age of household head, living in detached houses – regional NSW27
Age of household head
Family with children
Couple Lone person
Group Other Total
20-29 3% 2% 1% 1% 1% 8%
30-39 10% 2% 1% 0% 0% 14%
40-59 23% 8% 6% 1% 1% 39%
60-79 5% 16% 10% 1% 1% 32%
80+ 1% 3% 4% 0% 0% 8%
Total 42% 30% 22% 3% 3% 100%
Table 14 Household types by age of household head, living in semi-detached, terraces and townhouses – regional NSW28
Age of household head
Family with children
Couple Lone person
Group Other Total
20-29 3% 4% 3% 2% 0% 12%
30-39 6% 2% 4% 1% 0% 13%
40-59 10% 4% 13% 1% 0% 28%
60-79 2% 10% 20% 1% 0% 33%
80+ 1% 3% 9% 0% 0% 14%
Total 22% 22% 49% 5% 1% 100%
26 Australian Bureau of Statistics (2016), Census of Population and Housing, DPIE Analysis 27 Australian Bureau of Statistics (2016), Census of Population and Housing 28 Ibid
A Housing Strategy for NSW – Fact book
NSW Department of Planning, Industry and Environment | 20
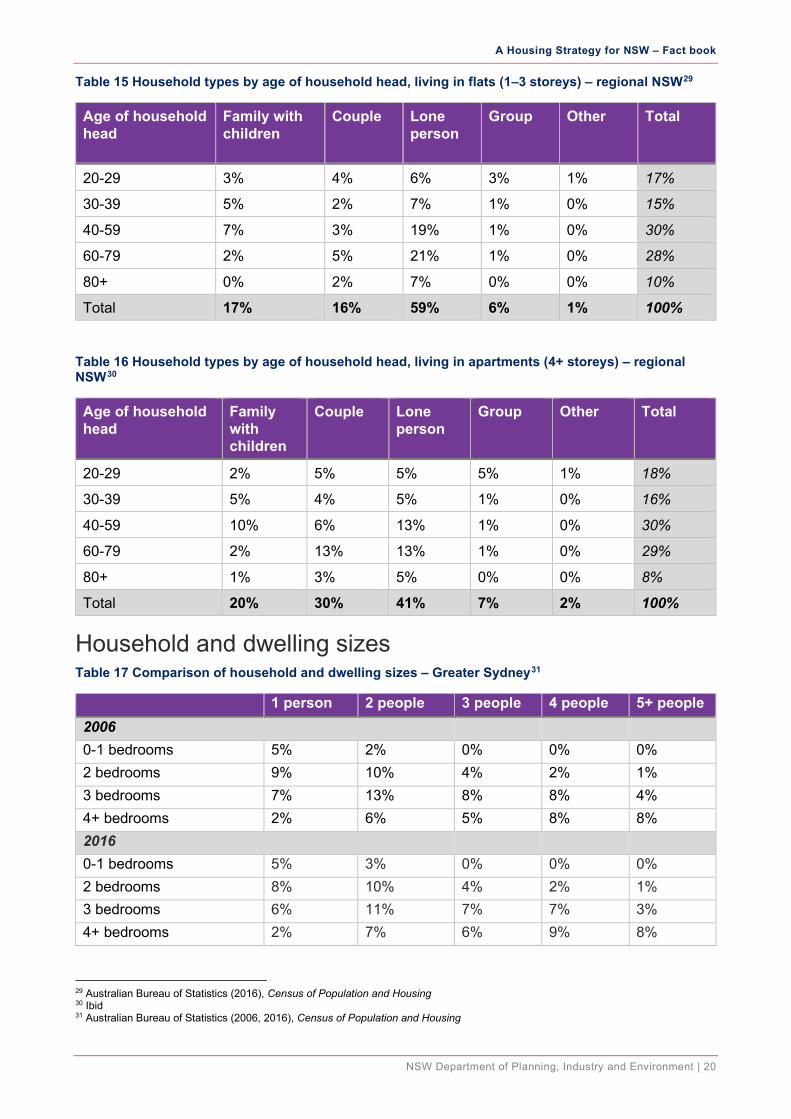
Table 15 Household types by age of household head, living in flats (1–3 storeys) – regional NSW29
Age of household head
Family with children
Couple Lone person
Group Other Total
20-29 3% 4% 6% 3% 1% 17%
30-39 5% 2% 7% 1% 0% 15%
40-59 7% 3% 19% 1% 0% 30%
60-79 2% 5% 21% 1% 0% 28%
80+ 0% 2% 7% 0% 0% 10%
Total 17% 16% 59% 6% 1% 100%
Table 16 Household types by age of household head, living in apartments (4+ storeys) – regional NSW30
Age of household head
Family with children
Couple Lone person
Group Other Total
20-29 2% 5% 5% 5% 1% 18%
30-39 5% 4% 5% 1% 0% 16%
40-59 10% 6% 13% 1% 0% 30%
60-79 2% 13% 13% 1% 0% 29%
80+ 1% 3% 5% 0% 0% 8%
Total 20% 30% 41% 7% 2% 100%
Household and dwelling sizes Table 17 Comparison of household and dwelling sizes – Greater Sydney31
1 person 2 people 3 people 4 people 5+ people 2006 0-1 bedrooms 5% 2% 0% 0% 0% 2 bedrooms 9% 10% 4% 2% 1% 3 bedrooms 7% 13% 8% 8% 4% 4+ bedrooms 2% 6% 5% 8% 8% 2016 0-1 bedrooms 5% 3% 0% 0% 0% 2 bedrooms 8% 10% 4% 2% 1% 3 bedrooms 6% 11% 7% 7% 3% 4+ bedrooms 2% 7% 6% 9% 8%
29 Australian Bureau of Statistics (2016), Census of Population and Housing 30 Ibid 31 Australian Bureau of Statistics (2006, 2016), Census of Population and Housing
A Housing Strategy for NSW – Fact book
NSW Department of Planning, Industry and Environment | 21
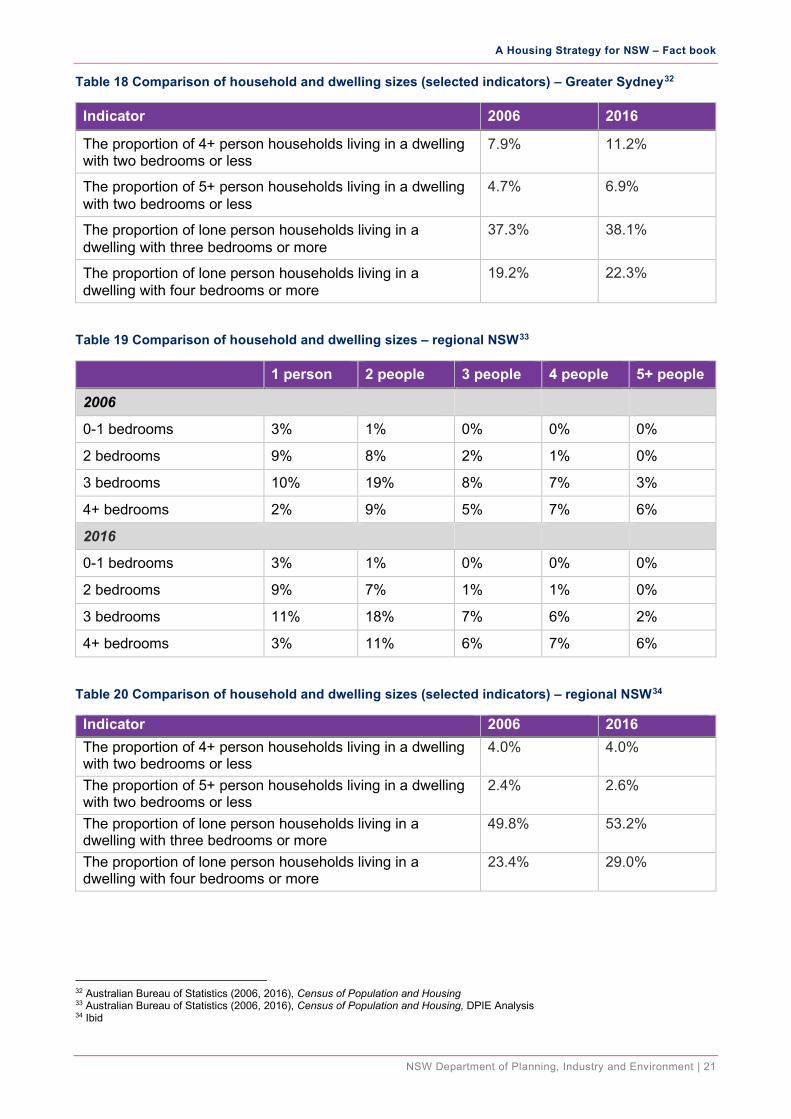
Table 18 Comparison of household and dwelling sizes (selected indicators) – Greater Sydney32
Indicator 2006 2016
The proportion of 4+ person households living in a dwelling with two bedrooms or less
7.9% 11.2%
The proportion of 5+ person households living in a dwelling with two bedrooms or less
4.7% 6.9%
The proportion of lone person households living in a dwelling with three bedrooms or more
37.3% 38.1%
The proportion of lone person households living in a dwelling with four bedrooms or more
19.2% 22.3%
Table 19 Comparison of household and dwelling sizes – regional NSW33
1 person 2 people 3 people 4 people 5+ people
2006
0-1 bedrooms 3% 1% 0% 0% 0%
2 bedrooms 9% 8% 2% 1% 0%
3 bedrooms 10% 19% 8% 7% 3%
4+ bedrooms 2% 9% 5% 7% 6%
2016
0-1 bedrooms 3% 1% 0% 0% 0%
2 bedrooms 9% 7% 1% 1% 0%
3 bedrooms 11% 18% 7% 6% 2%
4+ bedrooms 3% 11% 6% 7% 6%
Table 20 Comparison of household and dwelling sizes (selected indicators) – regional NSW34
Indicator 2006 2016 The proportion of 4+ person households living in a dwelling with two bedrooms or less
4.0% 4.0%
The proportion of 5+ person households living in a dwelling with two bedrooms or less
2.4% 2.6%
The proportion of lone person households living in a dwelling with three bedrooms or more
49.8% 53.2%
The proportion of lone person households living in a dwelling with four bedrooms or more
23.4% 29.0%
32 Australian Bureau of Statistics (2006, 2016), Census of Population and Housing 33 Australian Bureau of Statistics (2006, 2016), Census of Population and Housing, DPIE Analysis 34 Ibid
A Housing Strategy for NSW – Fact book
NSW Department of Planning, Industry and Environment | 22
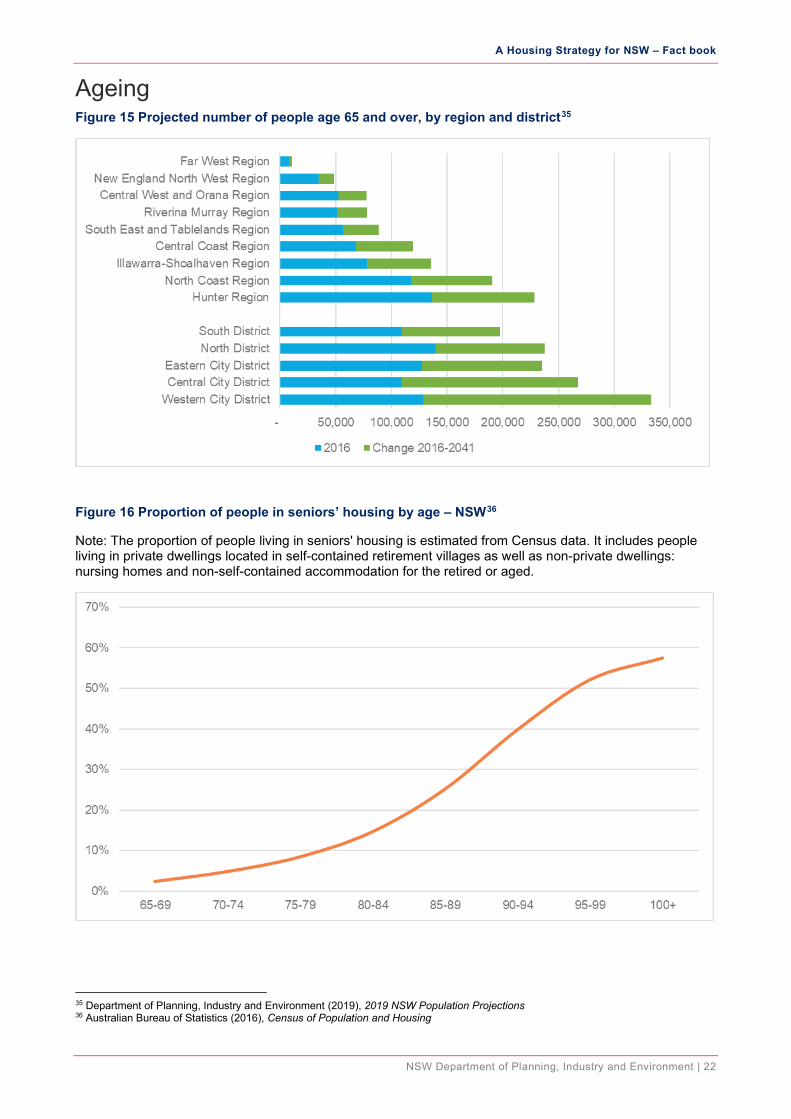
Ageing Figure 15 Projected number of people age 65 and over, by region and district35
Figure 16 Proportion of people in seniors’ housing by age – NSW36
Note: The proportion of people living in seniors' housing is estimated from Census data. It includes people living in private dwellings located in self-contained retirement villages as well as non-private dwellings: nursing homes and non-self-contained accommodation for the retired or aged.
35 Department of Planning, Industry and Environment (2019), 2019 NSW Population Projections 36 Australian Bureau of Statistics (2016), Census of Population and Housing
A Housing Strategy for NSW – Fact book
NSW Department of Planning, Industry and Environment | 23
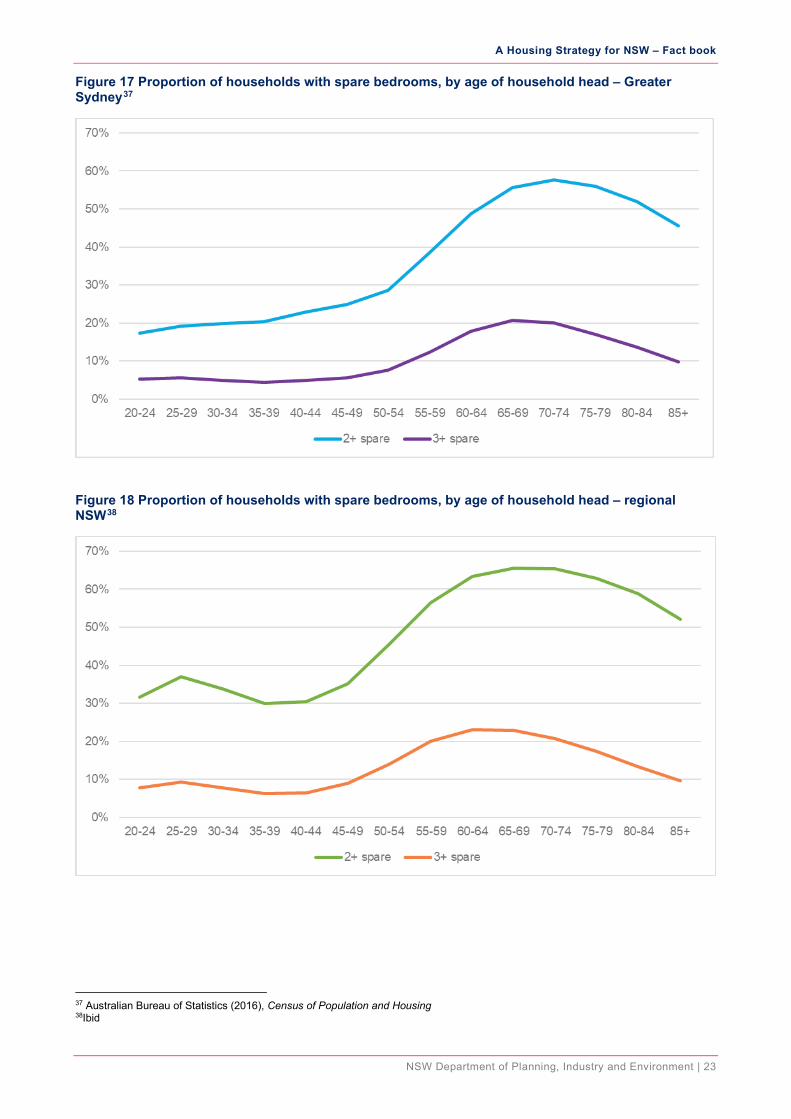
Figure 17 Proportion of households with spare bedrooms, by age of household head – Greater Sydney37
Figure 18 Proportion of households with spare bedrooms, by age of household head – regional NSW38
37 Australian Bureau of Statistics (2016), Census of Population and Housing 38Ibid
A Housing Strategy for NSW – Fact book
NSW Department of Planning, Industry and Environment | 24
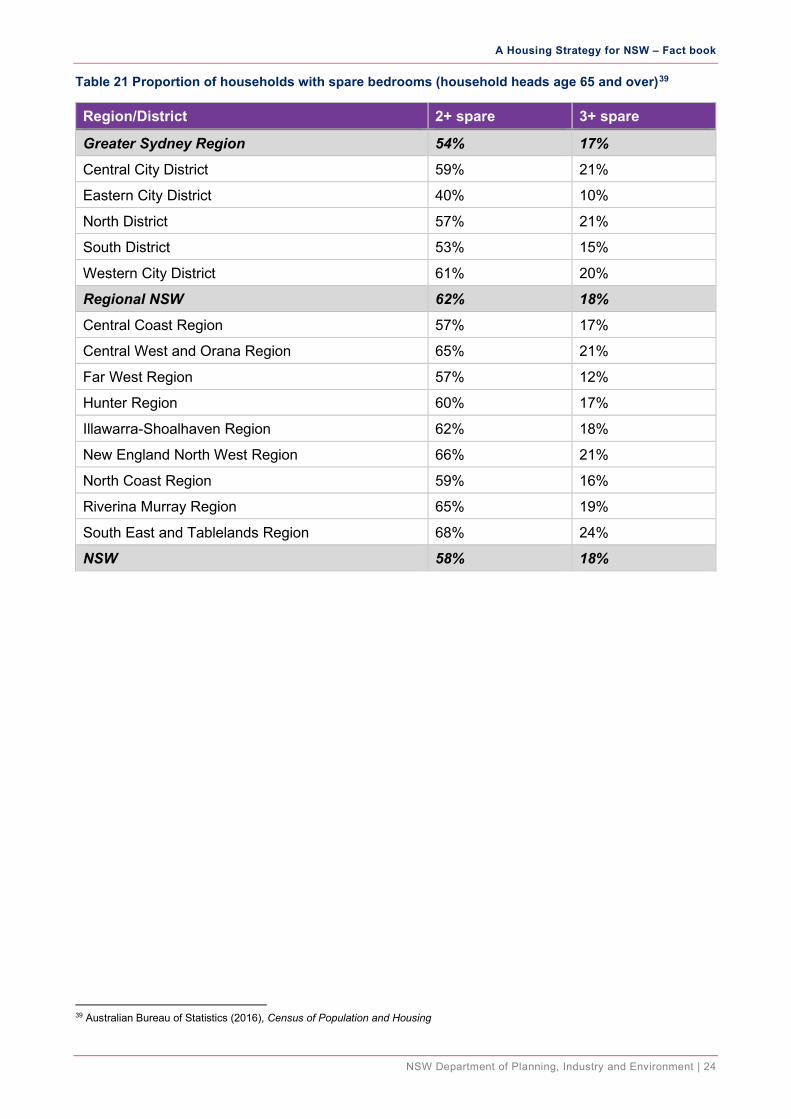
Table 21 Proportion of households with spare bedrooms (household heads age 65 and over)39
Region/District 2+ spare 3+ spare
Greater Sydney Region 54% 17%
Central City District 59% 21%
Eastern City District 40% 10%
North District 57% 21%
South District 53% 15%
Western City District 61% 20%
Regional NSW 62% 18%
Central Coast Region 57% 17%
Central West and Orana Region 65% 21%
Far West Region 57% 12%
Hunter Region 60% 17%
Illawarra-Shoalhaven Region 62% 18%
New England North West Region 66% 21%
North Coast Region 59% 16%
Riverina Murray Region 65% 19%
South East and Tablelands Region 68% 24%
NSW 58% 18%
39 Australian Bureau of Statistics (2016), Census of Population and Housing
A Housing Strategy for NSW – Fact book
NSW Department of Planning, Industry and Environment | 25
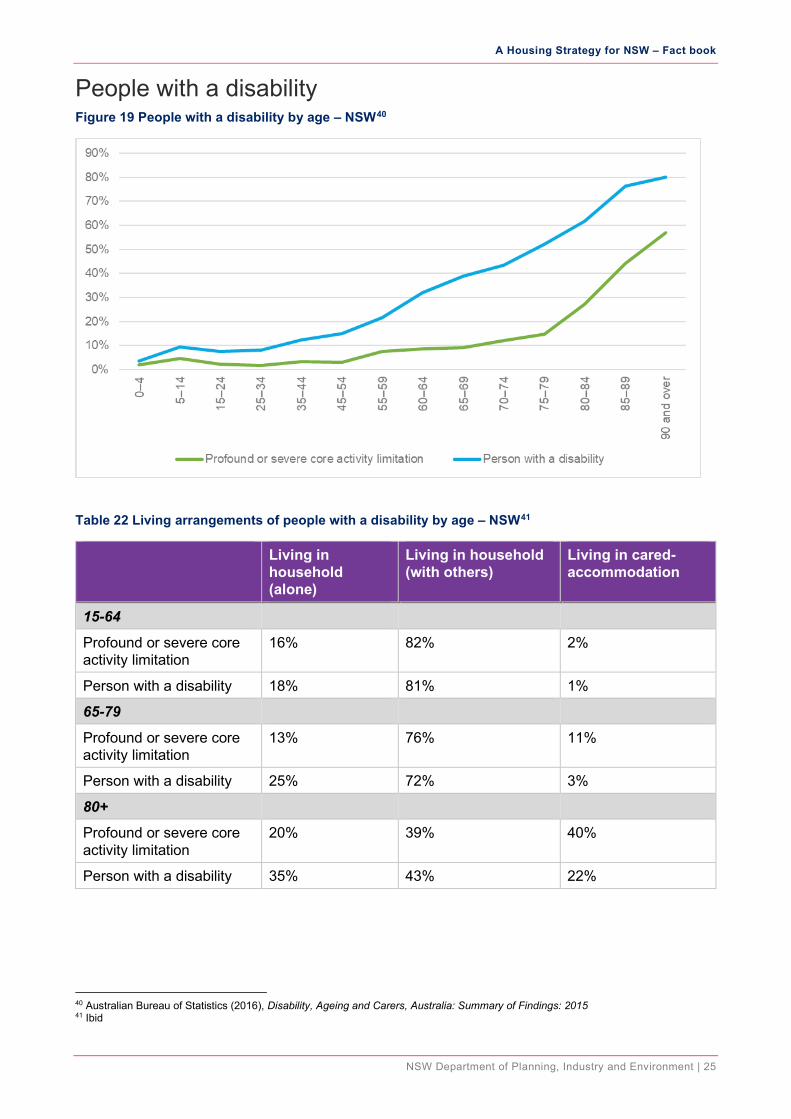
People with a disability Figure 19 People with a disability by age – NSW40
Table 22 Living arrangements of people with a disability by age – NSW41
Living in household (alone)
Living in household (with others)
Living in cared-accommodation
15-64
Profound or severe core activity limitation
16% 82% 2%
Person with a disability 18% 81% 1%
65-79
Profound or severe core activity limitation
13% 76% 11%
Person with a disability 25% 72% 3%
80+
Profound or severe core activity limitation
20% 39% 40%
Person with a disability 35% 43% 22%
40 Australian Bureau of Statistics (2016), Disability, Ageing and Carers, Australia: Summary of Findings: 2015 41 Ibid
A Housing Strategy for NSW – Fact book
NSW Department of Planning, Industry and Environment | 26
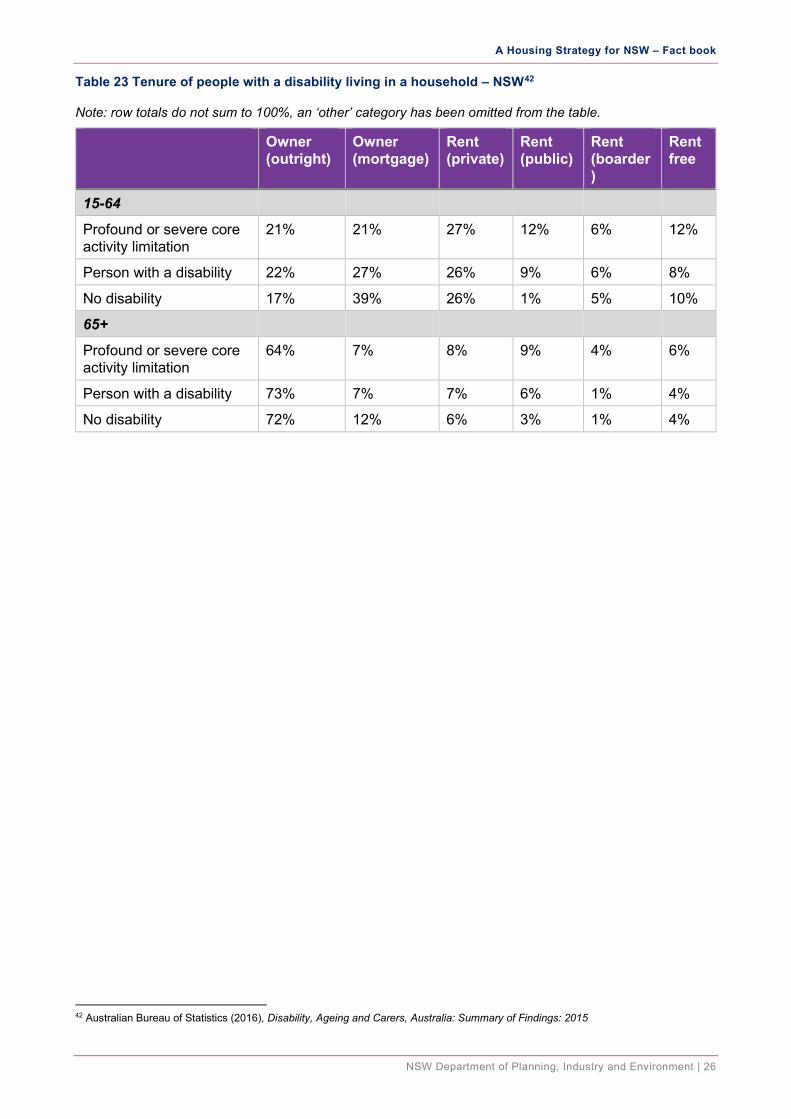
Table 23 Tenure of people with a disability living in a household – NSW42
Note: row totals do not sum to 100%, an ‘other’ category has been omitted from the table.
Owner (outright)
Owner (mortgage)
Rent (private)
Rent (public)
Rent (boarder)
Rent free
15-64
Profound or severe core activity limitation
21% 21% 27% 12% 6% 12%
Person with a disability 22% 27% 26% 9% 6% 8%
No disability 17% 39% 26% 1% 5% 10%
65+
Profound or severe core activity limitation
64% 7% 8% 9% 4% 6%
Person with a disability 73% 7% 7% 6% 1% 4%
No disability 72% 12% 6% 3% 1% 4%
42 Australian Bureau of Statistics (2016), Disability, Ageing and Carers, Australia: Summary of Findings: 2015
A Housing Strategy for NSW – Fact book
NSW Department of Planning, Industry and Environment | 27
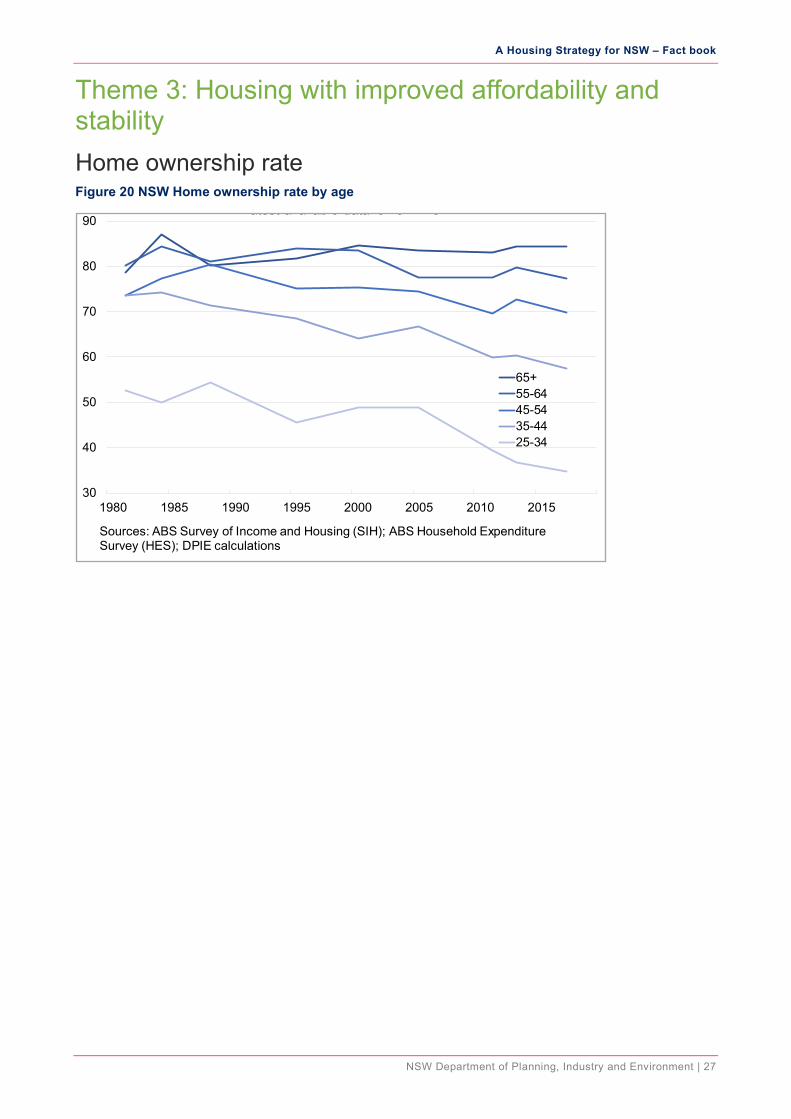
Theme 3: Housing with improved affordability and stability Home ownership rate Figure 20 NSW Home ownership rate by age
30
40
50
60
70
80
90
1980 1985 1990 1995 2000 2005 2010 2015
atest a a ab e data s 0 8
65+55-6445-5435-4425-34
Sources: ABS Survey of Income and Housing (SIH); ABS Household Expenditure Survey (HES); DPIE calculations
A Housing Strategy for NSW – Fact book
NSW Department of Planning, Industry and Environment | 28
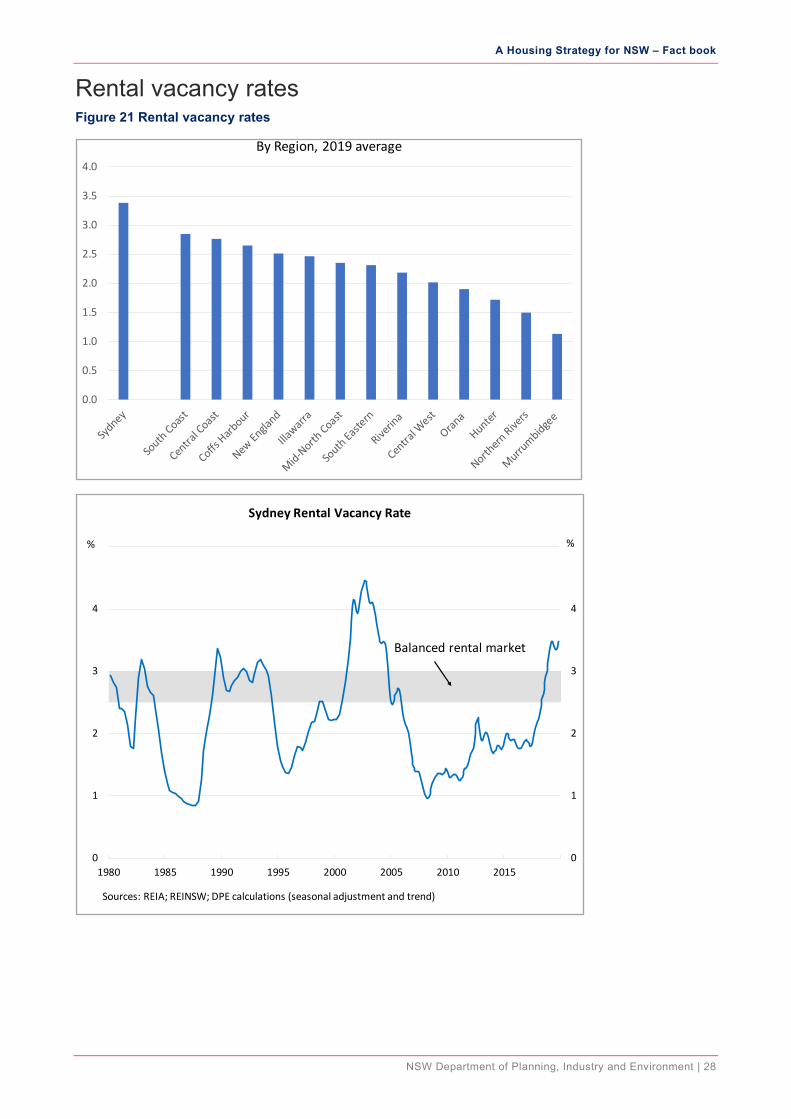
Rental vacancy rates Figure 21 Rental vacancy rates
0.0
0.5
1.0
1.5
2.0
2.5
3.0
3.5
4.0
By Region, 2019 average
0
1
2
3
4
5
0
1
2
3
4
5
1980 1985 1990 1995 2000 2005 2010 2015
%
Sources: REIA; REINSW; DPE calculations (seasonal adjustment and trend)
Balanced rental market
%
Sydney Rental Vacancy Rate
A Housing Strategy for NSW – Fact book
NSW Department of Planning, Industry and Environment | 29
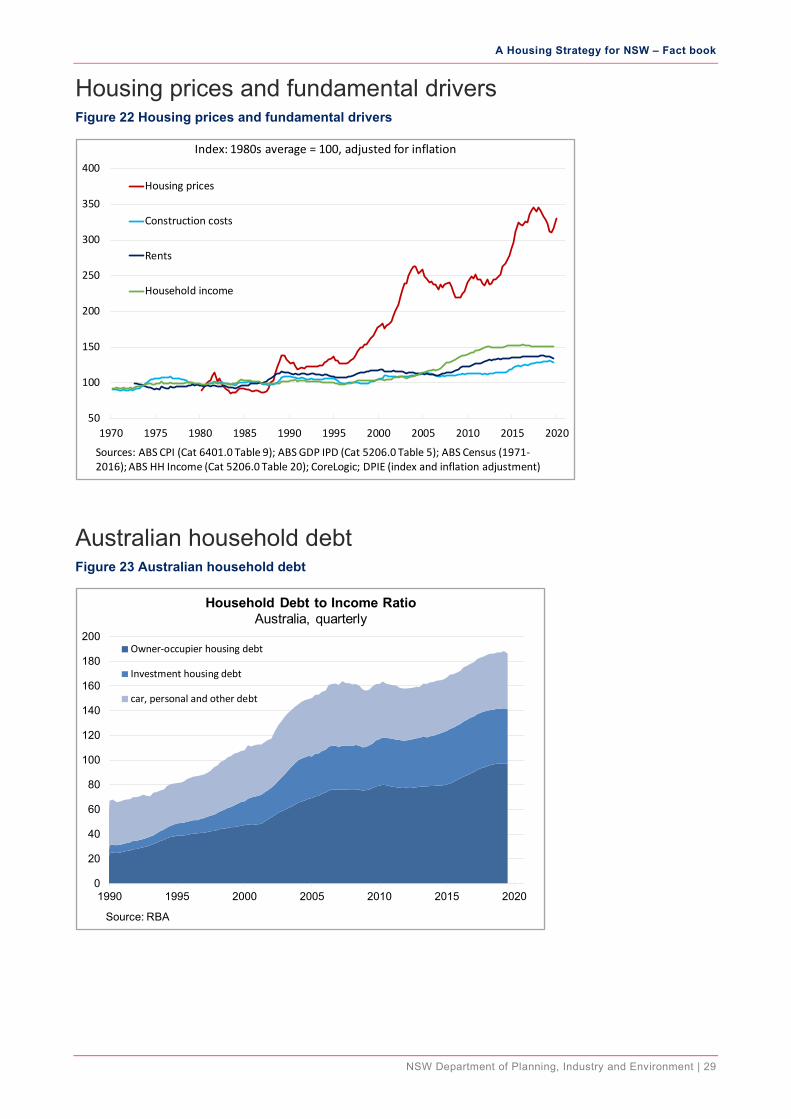
Housing prices and fundamental drivers Figure 22 Housing prices and fundamental drivers
Australian household debt Figure 23 Australian household debt
50
100
150
200
250
300
350
400
1970 1975 1980 1985 1990 1995 2000 2005 2010 2015 2020
y y g Index: 1980s average = 100, adjusted for inflation
Housing prices
Construction costs
Rents
Household income
Sources: ABS CPI (Cat 6401.0 Table 9); ABS GDP IPD (Cat 5206.0 Table 5); ABS Census (1971-2016); ABS HH Income (Cat 5206.0 Table 20); CoreLogic; DPIE (index and inflation adjustment)
0
20
40
60
80
100
120
140
160
180
200
1990 1995 2000 2005 2010 2015 2020
Household Debt to Income RatioAustralia, quarterly
Owner-occupier housing debt
Investment housing debt
car, personal and other debt
Source: RBA
A Housing Strategy for NSW – Fact book
NSW Department of Planning, Industry and Environment | 30
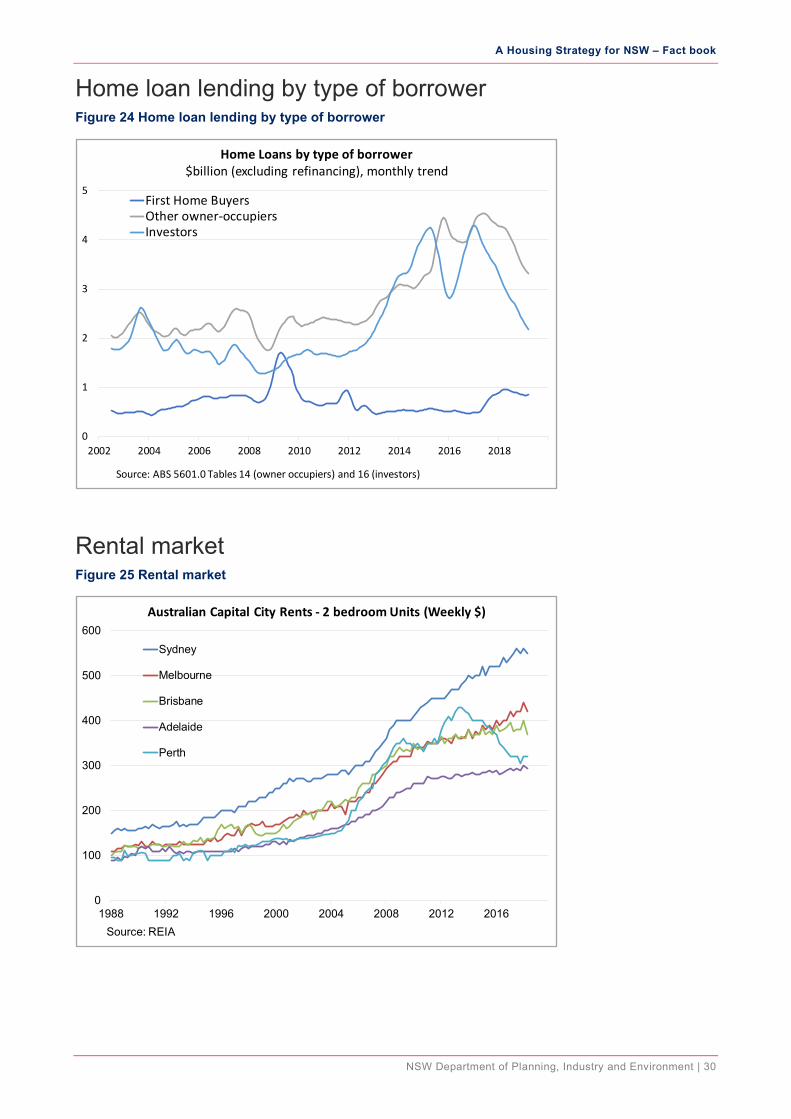
Home loan lending by type of borrower Figure 24 Home loan lending by type of borrower
Rental market Figure 25 Rental market
0
1
2
3
4
5
2002 2004 2006 2008 2010 2012 2014 2016 2018
Home Loans by type of borrower$billion (excluding refinancing), monthly trend
First Home BuyersOther owner-occupiersInvestors
Source: ABS 5601.0 Tables 14 (owner occupiers) and 16 (investors)
0
100
200
300
400
500
600
1988 1992 1996 2000 2004 2008 2012 2016
Australian Capital City Rents - 2 bedroom Units (Weekly $)
Sydney
Melbourne
Brisbane
Adelaide
Perth
Source: REIA
A Housing Strategy for NSW – Fact book
NSW Department of Planning, Industry and Environment | 31
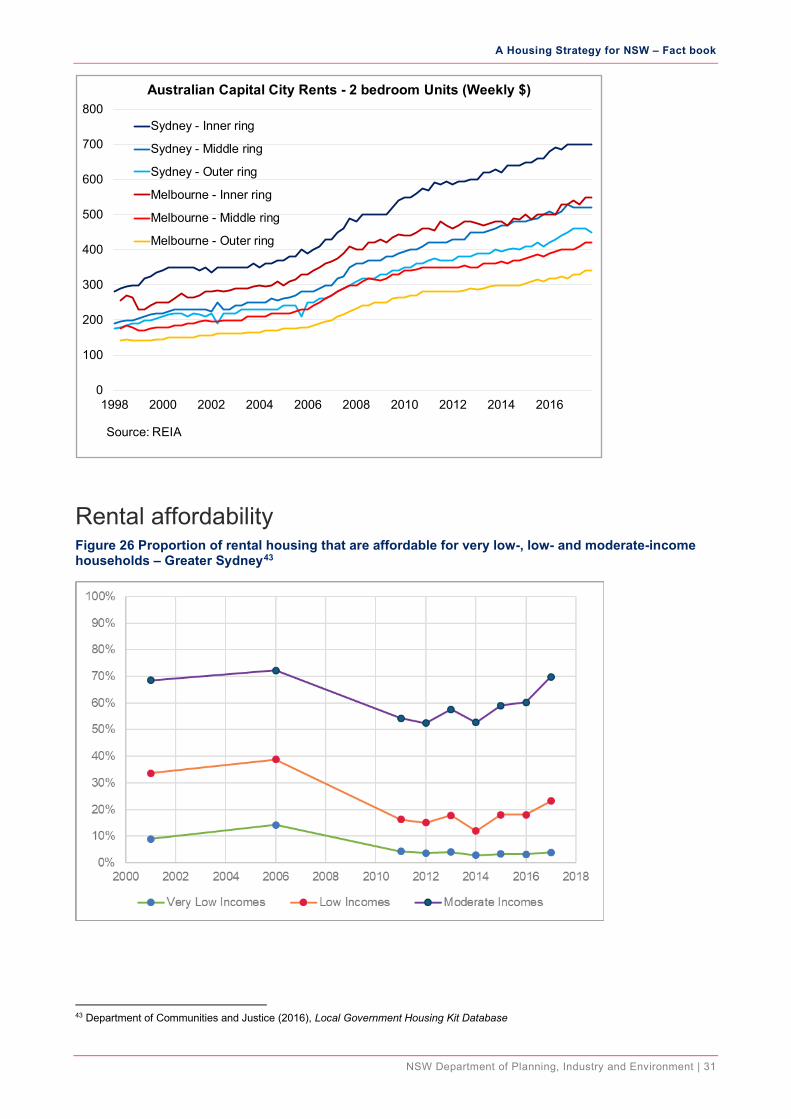
Rental affordability Figure 26 Proportion of rental housing that are affordable for very low-, low- and moderate-income households – Greater Sydney43
43 Department of Communities and Justice (2016), Local Government Housing Kit Database
0
100
200
300
400
500
600
700
800
1998 2000 2002 2004 2006 2008 2010 2012 2014 2016
Australian Capital City Rents - 2 bedroom Units (Weekly $)
Sydney - Inner ring
Sydney - Middle ring
Sydney - Outer ring
Melbourne - Inner ring
Melbourne - Middle ring
Melbourne - Outer ring
Source: REIA
A Housing Strategy for NSW – Fact book
NSW Department of Planning, Industry and Environment | 32
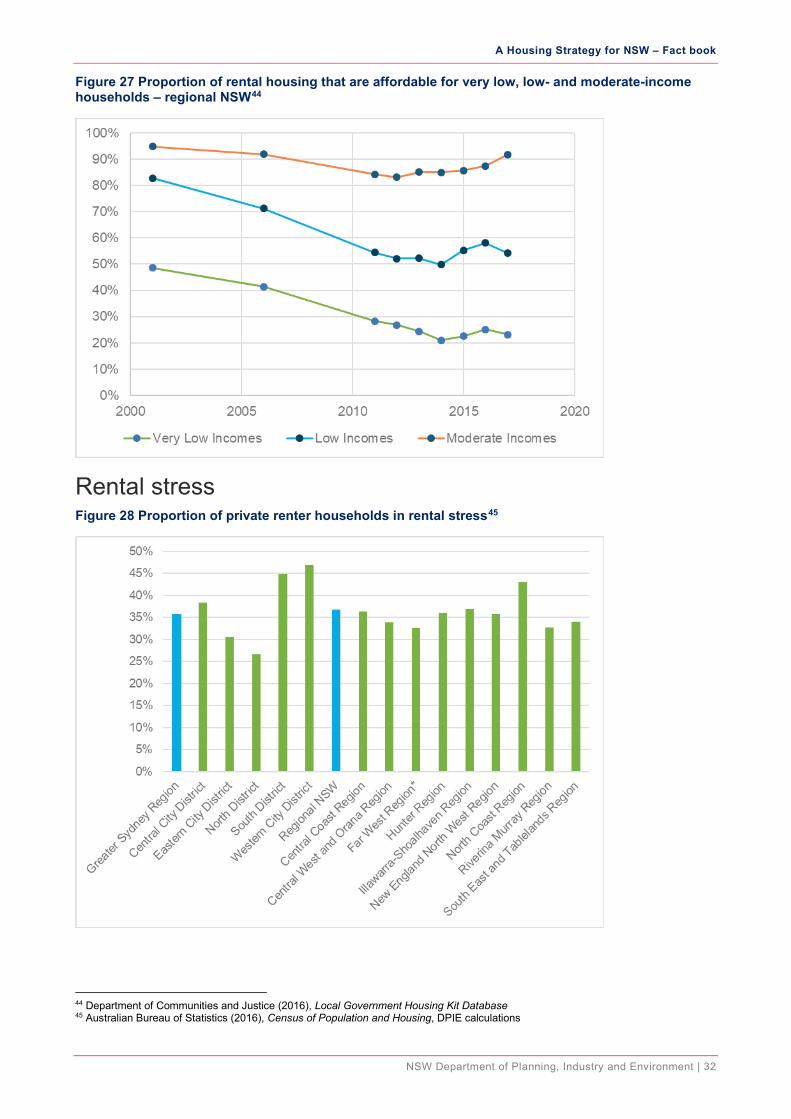
Figure 27 Proportion of rental housing that are affordable for very low, low- and moderate-income households – regional NSW44
Rental stress Figure 28 Proportion of private renter households in rental stress45
44 Department of Communities and Justice (2016), Local Government Housing Kit Database 45 Australian Bureau of Statistics (2016), Census of Population and Housing, DPIE calculations
A Housing Strategy for NSW – Fact book
NSW Department of Planning, Industry and Environment | 33
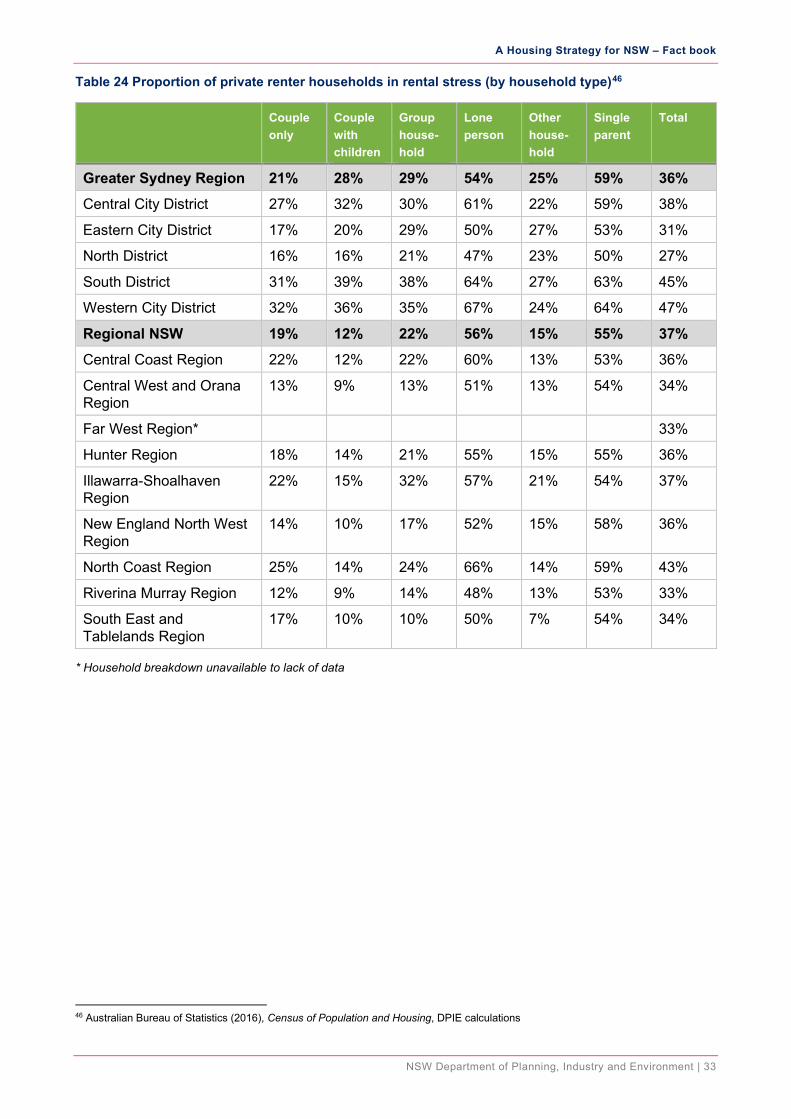
Table 24 Proportion of private renter households in rental stress (by household type)46
Couple only
Couple with children
Group house-hold
Lone person
Other house-hold
Single parent
Total
Greater Sydney Region 21% 28% 29% 54% 25% 59% 36% Central City District 27% 32% 30% 61% 22% 59% 38%
Eastern City District 17% 20% 29% 50% 27% 53% 31%
North District 16% 16% 21% 47% 23% 50% 27%
South District 31% 39% 38% 64% 27% 63% 45%
Western City District 32% 36% 35% 67% 24% 64% 47%
Regional NSW 19% 12% 22% 56% 15% 55% 37% Central Coast Region 22% 12% 22% 60% 13% 53% 36%
Central West and Orana Region
13% 9% 13% 51% 13% 54% 34%
Far West Region*
33%
Hunter Region 18% 14% 21% 55% 15% 55% 36%
Illawarra-Shoalhaven Region
22% 15% 32% 57% 21% 54% 37%
New England North West Region
14% 10% 17% 52% 15% 58% 36%
North Coast Region 25% 14% 24% 66% 14% 59% 43%
Riverina Murray Region 12% 9% 14% 48% 13% 53% 33%
South East and Tablelands Region
17% 10% 10% 50% 7% 54% 34%
* Household breakdown unavailable to lack of data
46 Australian Bureau of Statistics (2016), Census of Population and Housing, DPIE calculations
A Housing Strategy for NSW – Fact book
NSW Department of Planning, Industry and Environment | 34
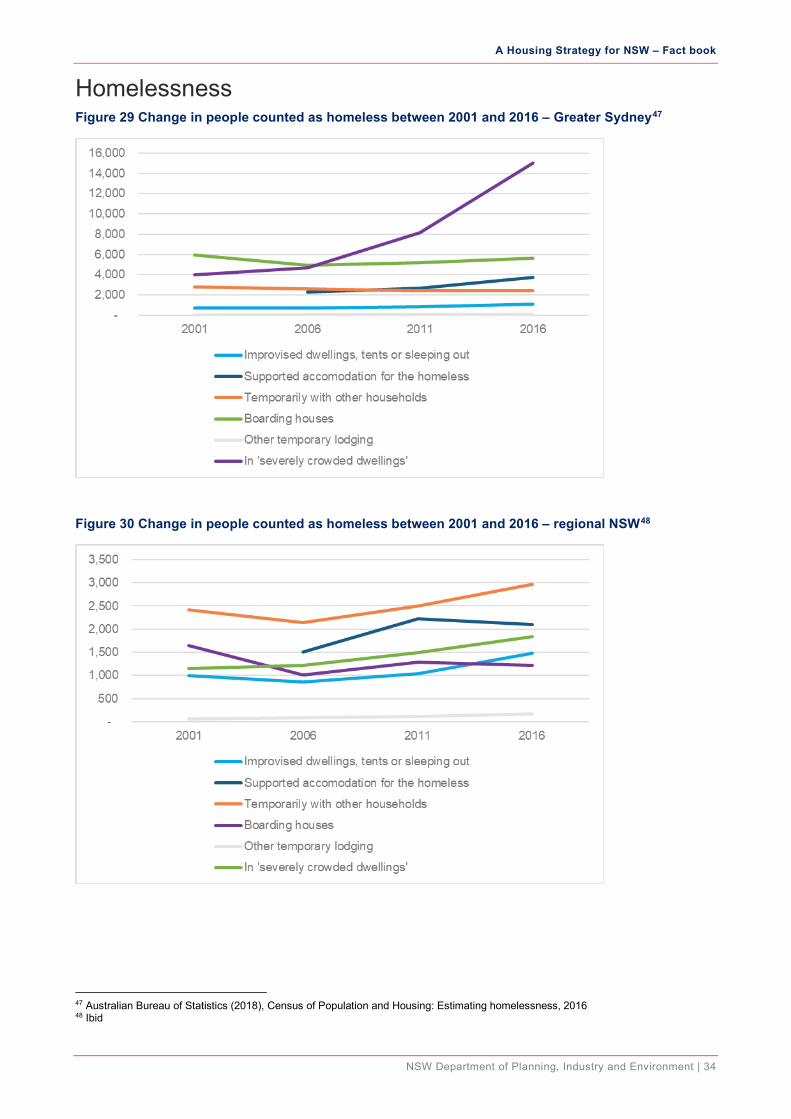
Homelessness Figure 29 Change in people counted as homeless between 2001 and 2016 – Greater Sydney47
Figure 30 Change in people counted as homeless between 2001 and 2016 – regional NSW48
47 Australian Bureau of Statistics (2018), Census of Population and Housing: Estimating homelessness, 2016 48 Ibid
A Housing Strategy for NSW – Fact book
NSW Department of Planning, Industry and Environment | 35
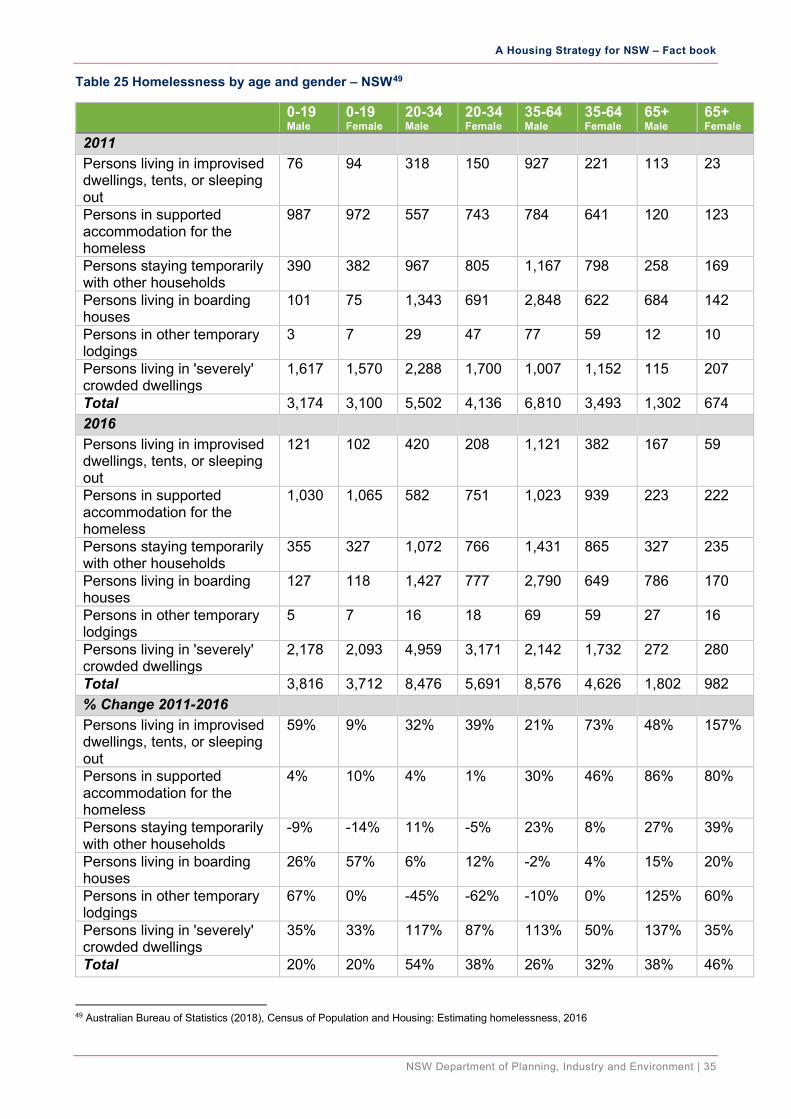
Table 25 Homelessness by age and gender – NSW49
0-19 Male
0-19 Female
20-34 Male
20-34 Female
35-64 Male
35-64 Female
65+ Male
65+ Female
2011 Persons living in improvised dwellings, tents, or sleeping out
76 94 318 150 927 221 113 23
Persons in supported accommodation for the homeless
987 972 557 743 784 641 120 123
Persons staying temporarily with other households
390 382 967 805 1,167 798 258 169
Persons living in boarding houses
101 75 1,343 691 2,848 622 684 142
Persons in other temporary lodgings
3 7 29 47 77 59 12 10
Persons living in 'severely' crowded dwellings
1,617 1,570 2,288 1,700 1,007 1,152 115 207
Total 3,174 3,100 5,502 4,136 6,810 3,493 1,302 674 2016 Persons living in improvised dwellings, tents, or sleeping out
121 102 420 208 1,121 382 167 59
Persons in supported accommodation for the homeless
1,030 1,065 582 751 1,023 939 223 222
Persons staying temporarily with other households
355 327 1,072 766 1,431 865 327 235
Persons living in boarding houses
127 118 1,427 777 2,790 649 786 170
Persons in other temporary lodgings
5 7 16 18 69 59 27 16
Persons living in 'severely' crowded dwellings
2,178 2,093 4,959 3,171 2,142 1,732 272 280
Total 3,816 3,712 8,476 5,691 8,576 4,626 1,802 982 % Change 2011-2016 Persons living in improvised dwellings, tents, or sleeping out
59% 9% 32% 39% 21% 73% 48% 157%
Persons in supported accommodation for the homeless
4% 10% 4% 1% 30% 46% 86% 80%
Persons staying temporarily with other households
-9% -14% 11% -5% 23% 8% 27% 39%
Persons living in boarding houses
26% 57% 6% 12% -2% 4% 15% 20%
Persons in other temporary lodgings
67% 0% -45% -62% -10% 0% 125% 60%
Persons living in 'severely' crowded dwellings
35% 33% 117% 87% 113% 50% 137% 35%
Total 20% 20% 54% 38% 26% 32% 38% 46%
49 Australian Bureau of Statistics (2018), Census of Population and Housing: Estimating homelessness, 2016
A Housing Strategy for NSW – Fact book
NSW Department of Planning, Industry and Environment | 36
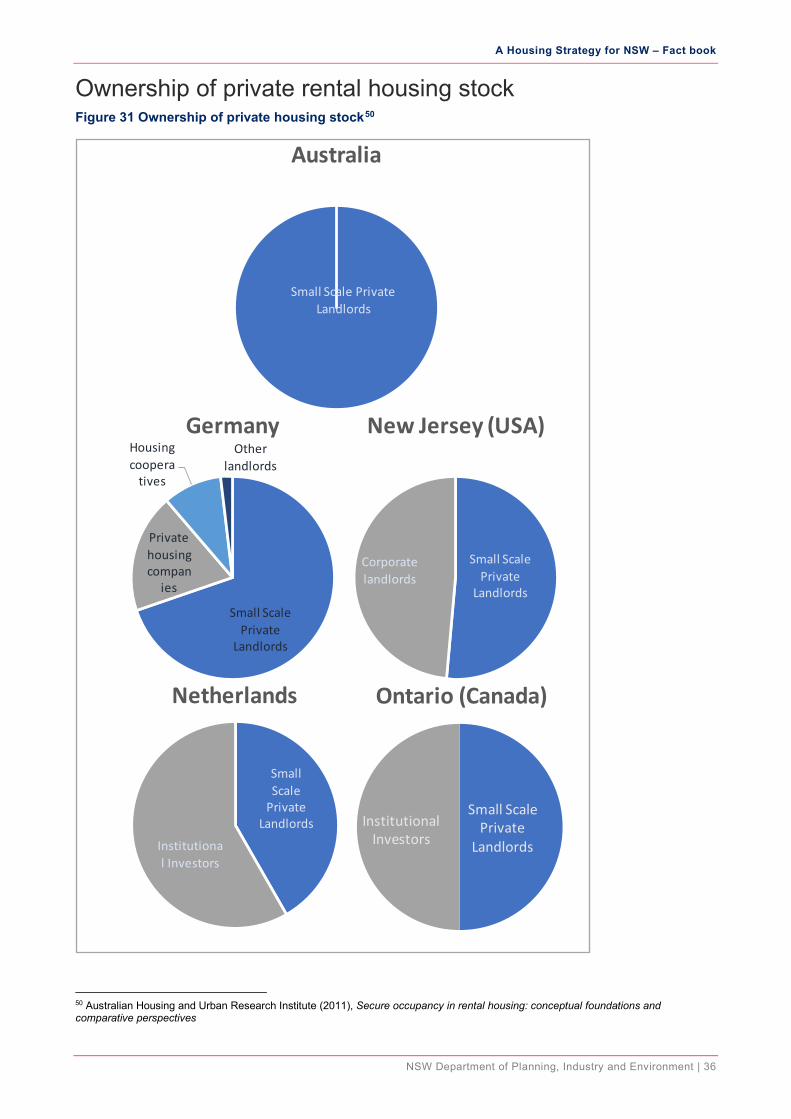
Ownership of private rental housing stock Figure 31 Ownership of private housing stock50
50 Australian Housing and Urban Research Institute (2011), Secure occupancy in rental housing: conceptual foundations and comparative perspectives
Small Scale Private Landlords
Australia
Small Scale Private
Landlords
Private housing compan
ies
Housing coopera
tives
Other landlords
Germany
Small Scale Private
Landlords
Corporate landlords
New Jersey (USA)
Small Scale Private
Landlords
Institutional Investors
Ontario (Canada)
Small Scale
Private Landlords
Institutional Investors
Netherlands
A Housing Strategy for NSW – Fact book
NSW Department of Planning, Industry and Environment | 37
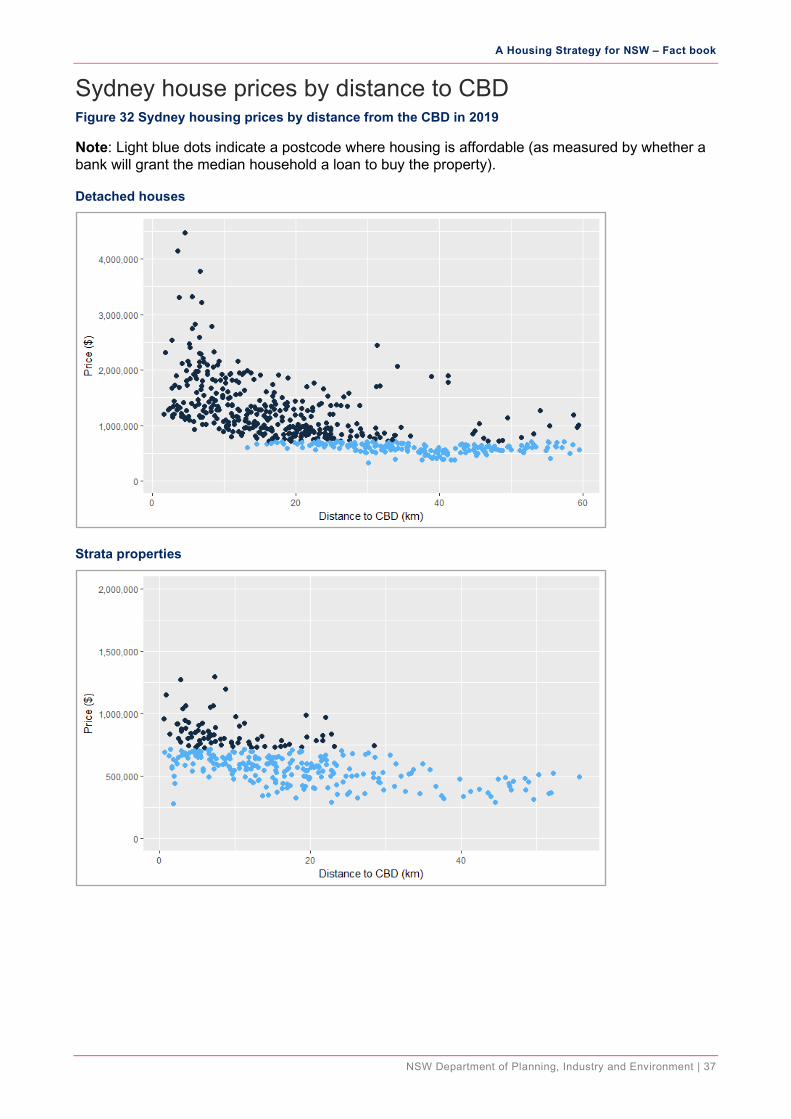
Sydney house prices by distance to CBD Figure 32 Sydney housing prices by distance from the CBD in 2019
Note: Light blue dots indicate a postcode where housing is affordable (as measured by whether a bank will grant the median household a loan to buy the property).
Detached houses
Strata properties
![Housing Act 2001 - NSW legislation · Housing Act 2001 No 52 [NSW] Part 1 Preliminary Historical version valid from 1.1.2014 to 4.11.2015 (generated on 16.11.2015 at 14:36) Part 1](https://img.pdfslide.net/doc/110x75/5f3caf94fd84d03299563e73/housing-act-2001-nsw-legislation-housing-act-2001-no-52-nsw-part-1-preliminary.jpg)


![Aboriginal Housing Act 1998 - NSW legislation · Aboriginal Housing Act 1998 No 47 [NSW] Part 3 Functions of Aboriginal Housing Office Historical version valid from 30.11.2009 to](https://img.pdfslide.net/doc/110x75/5f3cafd6b2ef901af847fd72/aboriginal-housing-act-1998-nsw-legislation-aboriginal-housing-act-1998-no-47.jpg)