Embed Size (px)
Citation preview
RESEARCH ARTICLE
A human pluripotent stem cell model of catecholaminergicpolymorphic ventricular tachycardia recapitulates patient-specificdrug responsesMarcela K. Preininger1,2, Rajneesh Jha1, Joshua T. Maxwell1,2, Qingling Wu1,2, Monalisa Singh1, Bo Wang1,Aarti Dalal1, Zachary T. Mceachin2,3,4, Wilfried Rossoll3,4, Chadwick M. Hales5, Peter S. Fischbach1,Mary B. Wagner1,2 and Chunhui Xu1,2,*
ABSTRACTAlthough β-blockers can be used to eliminate stress-induced ventriculararrhythmias in patients with catecholaminergic polymorphic ventriculartachycardia (CPVT), this treatment is unsuccessful in ∼25% of cases.Induced pluripotent stem cell-derived cardiomyocytes (iPSC-CMs)generated from these patients have potential for use in investigatingthe phenomenon, but it remains unknown whether they can recapitulatepatient-specific drug responses to β-blockers. This study assessedwhether the inadequacy of β-blocker therapy in an individual can beobserved in vitro using patient-derived CPVT iPSC-CMs. An individualwith CPVT harboring a novel mutation in the type 2 cardiac ryanodinereceptor (RyR2) was identified whose persistent ventricular arrhythmiasduring β-blockade with nadolol were abolished during flecainidetreatment. iPSC-CMs generated from this patient and two controlindividuals expressed comparable levels of excitation-contractiongenes, but assessment of the sarcoplasmic reticulum Ca2+ leak andload relationship revealed intracellular Ca2+ homeostasis was altered intheCPVT iPSC-CMs. β-adrenergic stimulation potentiated spontaneousCa2+ waves and unduly frequent, large and prolonged Ca2+ sparks inCPVT compared with control iPSC-CMs, validating the diseasephenotype. Pursuant to the patient’s in vivo responses, nadololtreatment during β-adrenergic stimulation achieved negligible reductionof Ca2+wave frequencyand failed to rescueCa2+ spark defects in CPVTiPSC-CMs. In contrast, flecainide reducedboth frequencyandamplitudeof Ca2+ waves and restored the frequency, width and duration of Ca2+
sparks to baseline levels. By recapitulating the improved response of anindividual with CPVT to flecainide compared with β-blocker therapy invitro, these data provide newevidence that iPSC-CMs can capture basiccomponents of patient-specific drug responses.
KEY WORDS: Arrhythmia models, Cardiomyocytes, Ca2+ handling,CPVT, iPSCs
INTRODUCTIONCatecholaminergic polymorphic ventricular tachycardia (CPVT) isa life-threatening inherited arrhythmia that predisposes youngindividuals with structurally normal hearts to cardiac arrest. Theautosomal dominant form of CPVT is linked to mutations in thegene encoding the type 2 ryanodine receptor (RyR2) (Priori et al.,2001), an ion channel responsible for the coordinated release ofintracellular Ca2+ from the sarcoplasmic reticulum (SR) to thecytosol during systole. Evidence suggests that the majority of RyR2mutations promote catecholamine-driven spontaneous Ca2+ releasefrom the SR during diastole by reducing the threshold for storeoverload-induced Ca2+ release (Jiang et al., 2005). In turn, thesediastolic Ca2+-release events generate an electrogenic, depolarizingtransient inward current that leads to delayed afterdepolarizations(DADs) and triggered arrhythmias in CPVT (Paavola et al., 2007).
As catecholaminergic stress is key in eliciting CPVT symptoms,drugs that impede the action of endogenous catecholamines byblocking β-adrenergic receptors (β-AR) are the foundation ofpharmacological CPVT therapy. However, for unknown reasons,∼25% of CPVT patients are inadequately protected by β-blockers(Roston et al., 2015; Smith and MacQuaide, 2015). In the event thatventricular ectopy persists under β-blockade, the sodium channelblocker flecainide has emerged as an effective secondary agent forsuppressing arrhythmias in CPVT (Watanabe et al., 2009; van derWerf et al., 2011). Ideally, clinicians would be able to anticipate anindividual’s receptivity to β-blocker therapy based on somemolecular signature, and use the data to inform point-of-caretreatment decisions. Patient-specific induced pluripotent stemcell (iPSC)-derived cardiomyocytes (CMs) offer an auspiciousplatform for achieving this aim (Sinnecker et al., 2013; Wilsonand Wu, 2015). Although several reports have demonstratedpharmacological rescue of mutant RyR2 function in humanCPVT iPSC-CMs (Itzhaki et al., 2012; Jung et al., 2012; DiPasquale et al., 2013; Zhang et al., 2013), few studies directlycorrelate in vitro patient-specific drug response differentials toin vivo clinical data. A notable proof-of-principle study for thisparadigm demonstrated that CPVT patient-derived iPSC-CMs canreplicate in vivo individual drug responses to dantrolene in amutation-specific manner (Penttinen et al., 2015). However, beforepatient-derived iPSC-CMs can be widely utilized for precisionmedicine, their capacity to model in vivo therapeutic idiosyncrasiesmust be comprehensively established.
The present study sought to determine whether a patient-specificresponse to therapeutic β-blockade can be observed in vitro inCPVT iPSC-CMs. To this end, iPSC lines were derived from anindividual with CPVT harboring a novel RyR2-L3741P mutationwhose ventricular ectopy was not abolished by the widelyReceived 4 July 2016; Accepted 13 July 2016
1Division of Pediatric Cardiology, Department of Pediatrics, Emory UniversitySchool of Medicine and Children’s Healthcare of Atlanta, Atlanta, GA 30322, USA.2Wallace H. Coulter Department of Biomedical Engineering, Georgia Institute ofTechnology and Emory University, Atlanta, GA 30322, USA. 3Department of CellBiology, Emory University School of Medicine, Atlanta, GA 30322, USA. 4Laboratoryof Translational Cell Biology, Emory University School of Medicine, Atlanta, GA30322, USA. 5Department of Neurology, Emory University School of Medicine,Atlanta, GA 30322, USA.
*Author for correspondence ([email protected])
B.W., 0000-0003-0673-6548; C.X., 0000-0003-1748-0648
This is an Open Access article distributed under the terms of the Creative Commons AttributionLicense (http://creativecommons.org/licenses/by/3.0), which permits unrestricted use,distribution and reproduction in any medium provided that the original work is properly attributed.
927
© 2016. Published by The Company of Biologists Ltd | Disease Models & Mechanisms (2016) 9, 927-939 doi:10.1242/dmm.026823
Disea
seModels&Mechan
isms
prescribed β-blocker nadolol, but was resolved with flecainide. Ascontrols, iPSC lines were derived from two unrelated healthyindividuals with no history of cardiac disease. iPSC-CMsdifferentiated from the two CPVT lines displayed Ca2+-handlingdefects generally associated with CPVT CMs, including increasedspontaneous Ca2+ release during β-AR stimulation and reduced SRCa2+ content compared with control cells. Consistent with thepatient’s in vivo outcomes, flecainide proved more effective thannadolol in reducing potentially arrhythmogenic Ca2+ release iniPSC-CMs derived from the individual during β-AR agonism.Further investigation of the therapeutic effects of flecainide onCPVT CMs following β-AR stimulation showed that it successfullyimproved Ca2+ homeostasis and mitigated electrical instability byreducing the incidence of DADs and asymmetrical beat periods.These results support the hypothesis that iPSC-CMs can capture
key components of patient-specific drug responses, and imply thatCM-specific factors play a role in determining a patient’sreceptiveness to β-blocker therapy.
RESULTSFlecainide preferentially resolves ventricular arrhythmias inCPVT patientThe pedigree of the 12-year-old male individual with CPVT (III-2)selected for this study shows several affected family members
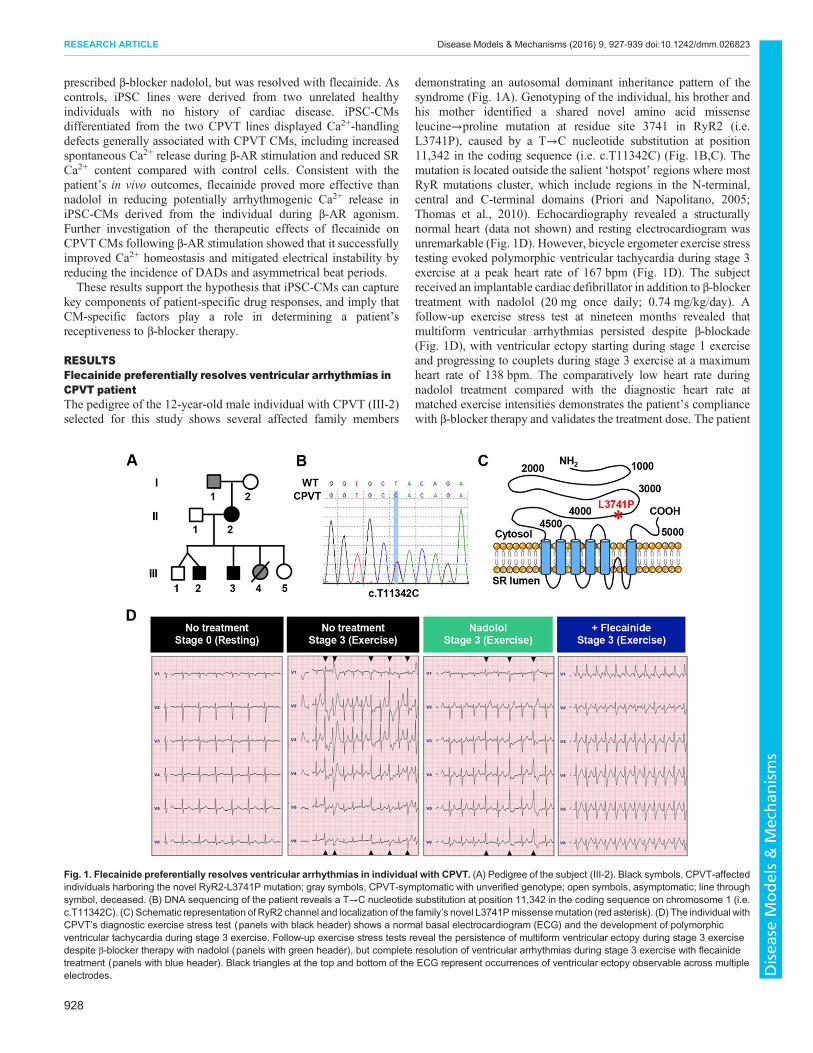
demonstrating an autosomal dominant inheritance pattern of thesyndrome (Fig. 1A). Genotyping of the individual, his brother andhis mother identified a shared novel amino acid missenseleucine→proline mutation at residue site 3741 in RyR2 (i.e.L3741P), caused by a T→C nucleotide substitution at position11,342 in the coding sequence (i.e. c.T11342C) (Fig. 1B,C). Themutation is located outside the salient ‘hotspot’ regions where mostRyR mutations cluster, which include regions in the N-terminal,central and C-terminal domains (Priori and Napolitano, 2005;Thomas et al., 2010). Echocardiography revealed a structurallynormal heart (data not shown) and resting electrocardiogram wasunremarkable (Fig. 1D). However, bicycle ergometer exercise stresstesting evoked polymorphic ventricular tachycardia during stage 3exercise at a peak heart rate of 167 bpm (Fig. 1D). The subjectreceived an implantable cardiac defibrillator in addition to β-blockertreatment with nadolol (20 mg once daily; 0.74 mg/kg/day). Afollow-up exercise stress test at nineteen months revealed thatmultiform ventricular arrhythmias persisted despite β-blockade(Fig. 1D), with ventricular ectopy starting during stage 1 exerciseand progressing to couplets during stage 3 exercise at a maximumheart rate of 138 bpm. The comparatively low heart rate duringnadolol treatment compared with the diagnostic heart rate atmatched exercise intensities demonstrates the patient’s compliancewith β-blocker therapy and validates the treatment dose. The patient
Fig. 1. Flecainide preferentially resolves ventricular arrhythmias in individual with CPVT. (A) Pedigree of the subject (III-2). Black symbols, CPVT-affectedindividuals harboring the novel RyR2-L3741P mutation; gray symbols, CPVT-symptomatic with unverified genotype; open symbols, asymptomatic; line throughsymbol, deceased. (B) DNA sequencing of the patient reveals a T→C nucleotide substitution at position 11,342 in the coding sequence on chromosome 1 (i.e.c.T11342C). (C) Schematic representation of RyR2 channel and localization of the family’s novel L3741Pmissensemutation (red asterisk). (D) The individual withCPVT’s diagnostic exercise stress test (panels with black header) shows a normal basal electrocardiogram (ECG) and the development of polymorphicventricular tachycardia during stage 3 exercise. Follow-up exercise stress tests reveal the persistence of multiform ventricular ectopy during stage 3 exercisedespite β-blocker therapy with nadolol (panels with green header), but complete resolution of ventricular arrhythmias during stage 3 exercise with flecainidetreatment (panels with blue header). Black triangles at the top and bottom of the ECG represent occurrences of ventricular ectopy observable across multipleelectrodes.
928
RESEARCH ARTICLE Disease Models & Mechanisms (2016) 9, 927-939 doi:10.1242/dmm.026823
Disea
seModels&Mechan
isms
was then started on flecainide (50 mg twice daily; 2.7 mg/kg/day).In a follow-up stress test three weeks after starting flecainide, thepatient was able to exercise to exhaustion with a peak heart rateduring stage 3 exercise of 168 bpm and no ventricular ectopy(Fig. 1D).
Patient-derived cells express lineage-specific markersTwo clonal iPSC lines were derived from the individual with CPVT(CPVT-A and CPVT-B), and two control lines (control A andcontrol B) were derived from two unrelated healthy adult males withdistinct genetic backgrounds. All four lines displayed typical iPSCcolony morphology and normal 46, XY karyotypes (Fig. S1).
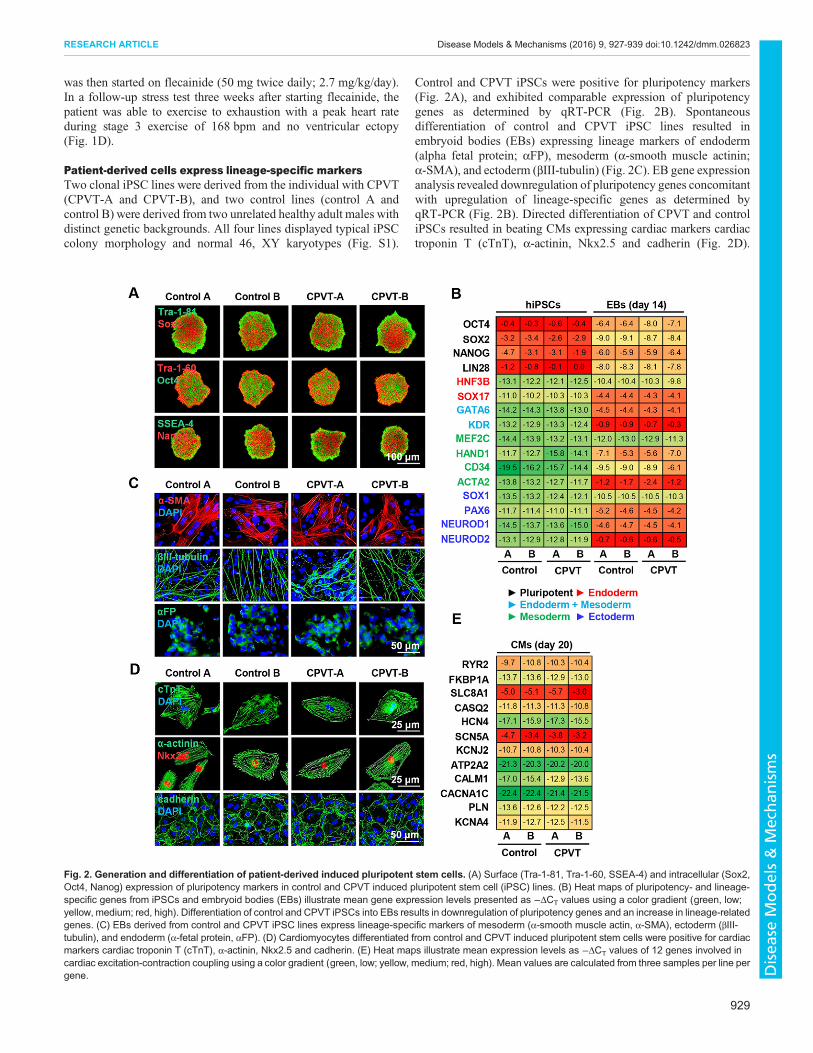
Control and CPVT iPSCs were positive for pluripotency markers(Fig. 2A), and exhibited comparable expression of pluripotencygenes as determined by qRT-PCR (Fig. 2B). Spontaneousdifferentiation of control and CPVT iPSC lines resulted inembryoid bodies (EBs) expressing lineage markers of endoderm(alpha fetal protein; αFP), mesoderm (α-smooth muscle actinin;α-SMA), and ectoderm (βIII-tubulin) (Fig. 2C). EB gene expressionanalysis revealed downregulation of pluripotency genes concomitantwith upregulation of lineage-specific genes as determined byqRT-PCR (Fig. 2B). Directed differentiation of CPVT and controliPSCs resulted in beating CMs expressing cardiac markers cardiactroponin T (cTnT), α-actinin, Nkx2.5 and cadherin (Fig. 2D).
Fig. 2. Generation and differentiation of patient-derived induced pluripotent stem cells. (A) Surface (Tra-1-81, Tra-1-60, SSEA-4) and intracellular (Sox2,Oct4, Nanog) expression of pluripotency markers in control and CPVT induced pluripotent stem cell (iPSC) lines. (B) Heat maps of pluripotency- and lineage-specific genes from iPSCs and embryoid bodies (EBs) illustrate mean gene expression levels presented as −ΔCT values using a color gradient (green, low;yellow, medium; red, high). Differentiation of control and CPVT iPSCs into EBs results in downregulation of pluripotency genes and an increase in lineage-relatedgenes. (C) EBs derived from control and CPVT iPSC lines express lineage-specific markers of mesoderm (α-smooth muscle actin, α-SMA), ectoderm (βIII-tubulin), and endoderm (α-fetal protein, αFP). (D) Cardiomyocytes differentiated from control and CPVT induced pluripotent stem cells were positive for cardiacmarkers cardiac troponin T (cTnT), α-actinin, Nkx2.5 and cadherin. (E) Heat maps illustrate mean expression levels as −ΔCT values of 12 genes involved incardiac excitation-contraction coupling using a color gradient (green, low; yellow, medium; red, high). Mean values are calculated from three samples per line pergene.
929
RESEARCH ARTICLE Disease Models & Mechanisms (2016) 9, 927-939 doi:10.1242/dmm.026823
Disea
seModels&Mechan
isms
qRT-PCR analysis was performed on 12 key genes involved in CMexcitation-contraction coupling, and revealed similar levels of geneexpression (Fig. 2E), consistent with existing reports (Jung et al.,2012; Kujala et al., 2012).
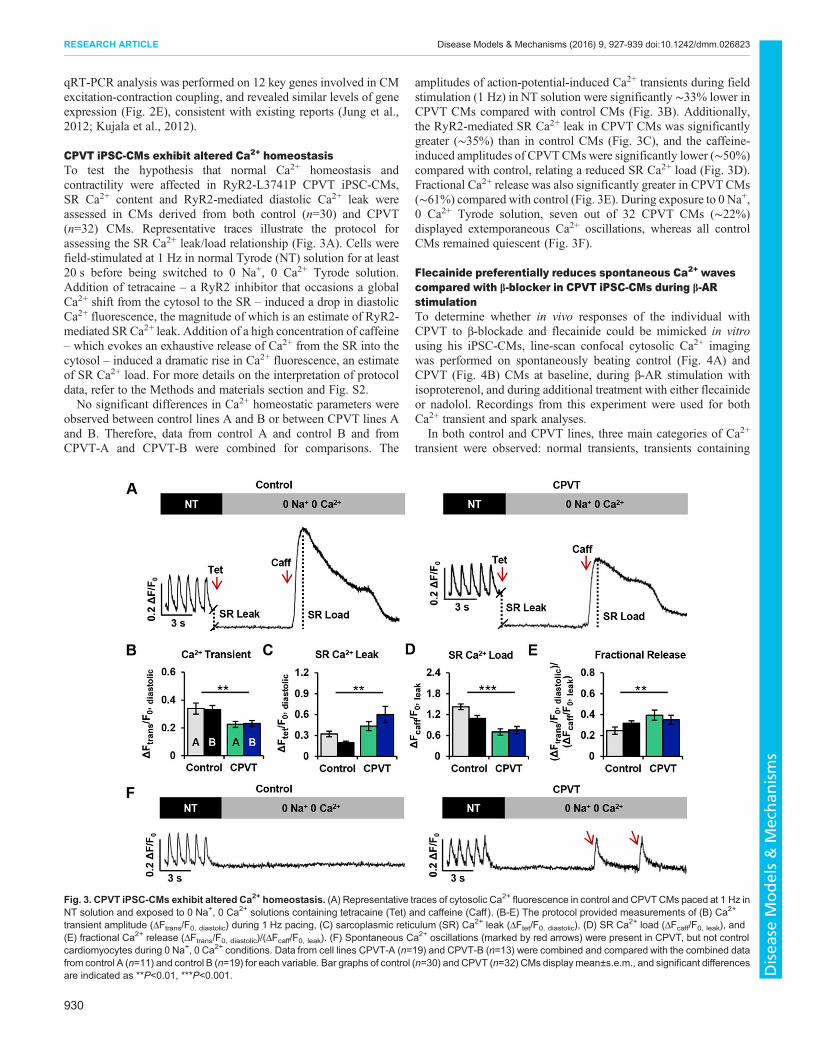
CPVT iPSC-CMs exhibit altered Ca2+ homeostasisTo test the hypothesis that normal Ca2+ homeostasis andcontractility were affected in RyR2-L3741P CPVT iPSC-CMs,SR Ca2+ content and RyR2-mediated diastolic Ca2+ leak wereassessed in CMs derived from both control (n=30) and CPVT(n=32) CMs. Representative traces illustrate the protocol forassessing the SR Ca2+ leak/load relationship (Fig. 3A). Cells werefield-stimulated at 1 Hz in normal Tyrode (NT) solution for at least20 s before being switched to 0 Na+, 0 Ca2+ Tyrode solution.Addition of tetracaine – a RyR2 inhibitor that occasions a globalCa2+ shift from the cytosol to the SR – induced a drop in diastolicCa2+ fluorescence, the magnitude of which is an estimate of RyR2-mediated SR Ca2+ leak. Addition of a high concentration of caffeine– which evokes an exhaustive release of Ca2+ from the SR into thecytosol – induced a dramatic rise in Ca2+ fluorescence, an estimateof SR Ca2+ load. For more details on the interpretation of protocoldata, refer to the Methods and materials section and Fig. S2.No significant differences in Ca2+ homeostatic parameters were
observed between control lines A and B or between CPVT lines Aand B. Therefore, data from control A and control B and fromCPVT-A and CPVT-B were combined for comparisons. The
amplitudes of action-potential-induced Ca2+ transients during fieldstimulation (1 Hz) in NT solution were significantly ∼33% lower inCPVT CMs compared with control CMs (Fig. 3B). Additionally,the RyR2-mediated SR Ca2+ leak in CPVT CMs was significantlygreater (∼35%) than in control CMs (Fig. 3C), and the caffeine-induced amplitudes of CPVTCMs were significantly lower (∼50%)compared with control, relating a reduced SR Ca2+ load (Fig. 3D).Fractional Ca2+ release was also significantly greater in CPVT CMs(∼61%) compared with control (Fig. 3E). During exposure to 0 Na+,0 Ca2+ Tyrode solution, seven out of 32 CPVT CMs (∼22%)displayed extemporaneous Ca2+ oscillations, whereas all controlCMs remained quiescent (Fig. 3F).
Flecainide preferentially reduces spontaneous Ca2+ wavescompared with β-blocker in CPVT iPSC-CMs during β-ARstimulationTo determine whether in vivo responses of the individual withCPVT to β-blockade and flecainide could be mimicked in vitrousing his iPSC-CMs, line-scan confocal cytosolic Ca2+ imagingwas performed on spontaneously beating control (Fig. 4A) andCPVT (Fig. 4B) CMs at baseline, during β-AR stimulation withisoproterenol, and during additional treatment with either flecainideor nadolol. Recordings from this experiment were used for bothCa2+ transient and spark analyses.
In both control and CPVT lines, three main categories of Ca2+
transient were observed: normal transients, transients containing
Fig. 3. CPVT iPSC-CMs exhibit altered Ca2+ homeostasis. (A) Representative traces of cytosolic Ca2+ fluorescence in control and CPVTCMs paced at 1 Hz inNT solution and exposed to 0 Na+, 0 Ca2+ solutions containing tetracaine (Tet) and caffeine (Caff ). (B-E) The protocol provided measurements of (B) Ca2+
transient amplitude (ΔFtrans/F0, diastolic) during 1 Hz pacing, (C) sarcoplasmic reticulum (SR) Ca2+ leak (ΔFtet/F0, diastolic), (D) SR Ca2+ load (ΔFcaff/F0, leak), and(E) fractional Ca2+ release (ΔFtrans/F0, diastolic)/(ΔFcaff/F0, leak). (F) Spontaneous Ca2+ oscillations (marked by red arrows) were present in CPVT, but not controlcardiomyocytes during 0 Na+, 0 Ca2+ conditions. Data from cell lines CPVT-A (n=19) and CPVT-B (n=13) were combined and compared with the combined datafrom control A (n=11) and control B (n=19) for each variable. Bar graphs of control (n=30) and CPVT (n=32) CMs display mean±s.e.m., and significant differencesare indicated as **P<0.01, ***P<0.001.
930
RESEARCH ARTICLE Disease Models & Mechanisms (2016) 9, 927-939 doi:10.1242/dmm.026823
Disea
seModels&Mechan
isms
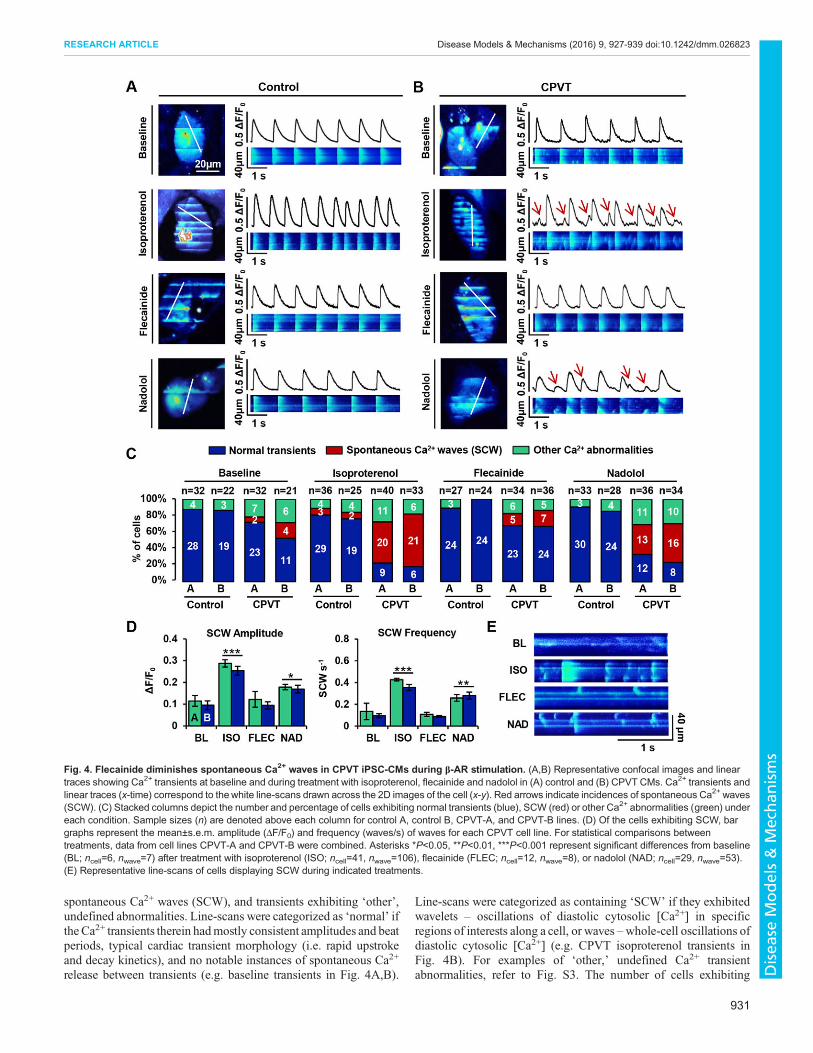
spontaneous Ca2+ waves (SCW), and transients exhibiting ‘other’,undefined abnormalities. Line-scans were categorized as ‘normal’ ifthe Ca2+ transients therein hadmostly consistent amplitudes and beatperiods, typical cardiac transient morphology (i.e. rapid upstrokeand decay kinetics), and no notable instances of spontaneous Ca2+
release between transients (e.g. baseline transients in Fig. 4A,B).
Line-scans were categorized as containing ‘SCW’ if they exhibitedwavelets – oscillations of diastolic cytosolic [Ca2+] in specificregions of interests along a cell, or waves –whole-cell oscillations ofdiastolic cytosolic [Ca2+] (e.g. CPVT isoproterenol transients inFig. 4B). For examples of ‘other,’ undefined Ca2+ transientabnormalities, refer to Fig. S3. The number of cells exhibiting
Fig. 4. Flecainide diminishes spontaneous Ca2+ waves in CPVT iPSC-CMs during β-AR stimulation. (A,B) Representative confocal images and lineartraces showing Ca2+ transients at baseline and during treatment with isoproterenol, flecainide and nadolol in (A) control and (B) CPVT CMs. Ca2+ transients andlinear traces (x-time) correspond to thewhite line-scans drawn across the 2D images of the cell (x-y). Red arrows indicate incidences of spontaneous Ca2+ waves(SCW). (C) Stacked columns depict the number and percentage of cells exhibiting normal transients (blue), SCW (red) or other Ca2+ abnormalities (green) undereach condition. Sample sizes (n) are denoted above each column for control A, control B, CPVT-A, and CPVT-B lines. (D) Of the cells exhibiting SCW, bargraphs represent the mean±s.e.m. amplitude (ΔF/F0) and frequency (waves/s) of waves for each CPVT cell line. For statistical comparisons betweentreatments, data from cell lines CPVT-A and CPVT-B were combined. Asterisks *P<0.05, **P<0.01, ***P<0.001 represent significant differences from baseline(BL; ncell=6, nwave=7) after treatment with isoproterenol (ISO; ncell=41, nwave=106), flecainide (FLEC; ncell=12, nwave=8), or nadolol (NAD; ncell=29, nwave=53).(E) Representative line-scans of cells displaying SCW during indicated treatments.
931
RESEARCH ARTICLE Disease Models & Mechanisms (2016) 9, 927-939 doi:10.1242/dmm.026823
Disea
seModels&Mechan
isms
each of these three transient classes during each condition wascounted, and percentageswere calculated for each cell line (Fig. 4C).At baseline, the vast majority of control cells beat regularly, withonly a minor percentage of cells containing undefined transientabnormalities (∼13%) and none containing SCW. A greaterincidence of undefined transient abnormalities was observedamong CPVT cells (∼19%), with a few cells exhibiting SCW(∼11%). Isoproterenol treatment elicited a marked gain in Ca2+
cycling in both groups; however, the abundance of SCW in CPVTCMs precluded reliable quantification of the beating frequency.β-agonism induced SCW in ∼56% of CPVT CMs, but onlyminimally increased the percentage of control CMs with SCW to∼8%. Upon treatment with flecainide or nadolol, control CMsexhibited negligible differences from baseline, and no incidents ofSCWwere observed. In CPVTCMs, flecainide and nadolol reducedthe incidence of SCW by ∼70% and ∼27%, respectively.No significant differences in SCW parameters were observed
between CPVT lines A and B. Therefore, data from CPVT-A andCPVT-B were combined for comparisons between conditions.Compared with baseline, β-agonism dramatically increased both theamplitude (∼150%, P<0.0001) and frequency (∼260%, P<0.0001)of SCW (Fig. 4D). Compared with isoproterenol-treated CPVTCMs, flecainide-treated cells exhibited substantial reductions inSCW amplitude (∼58%, P<0.0001) and frequency (∼75%,P<0.0001). Although cells treated with nadolol during β-agonismalso showed reductions in the amplitude (∼30%, P<0.0001) andfrequency (∼30%, P<0.0001) of SCW, the drug was less effectivethan flecainide. Flecainide successfully rescued Ca2+ cycling duringβ-agonism, as there were no significant differences in SCWamplitude or frequency in flecainide-treated cells compared withbaseline (Fig. 4D). In contrast, nadolol did not restore Ca2+ cyclingto basal conditions, as SCW amplitude and frequency remained∼70% (P<0.05) and ∼150% higher (P<0.01), respectively, innadolol-treated cells compared with baseline (Fig. 4D). Confocalline-scans of cells displaying SCW under treatment conditionsprovide examples of this trend (Fig. 4E).
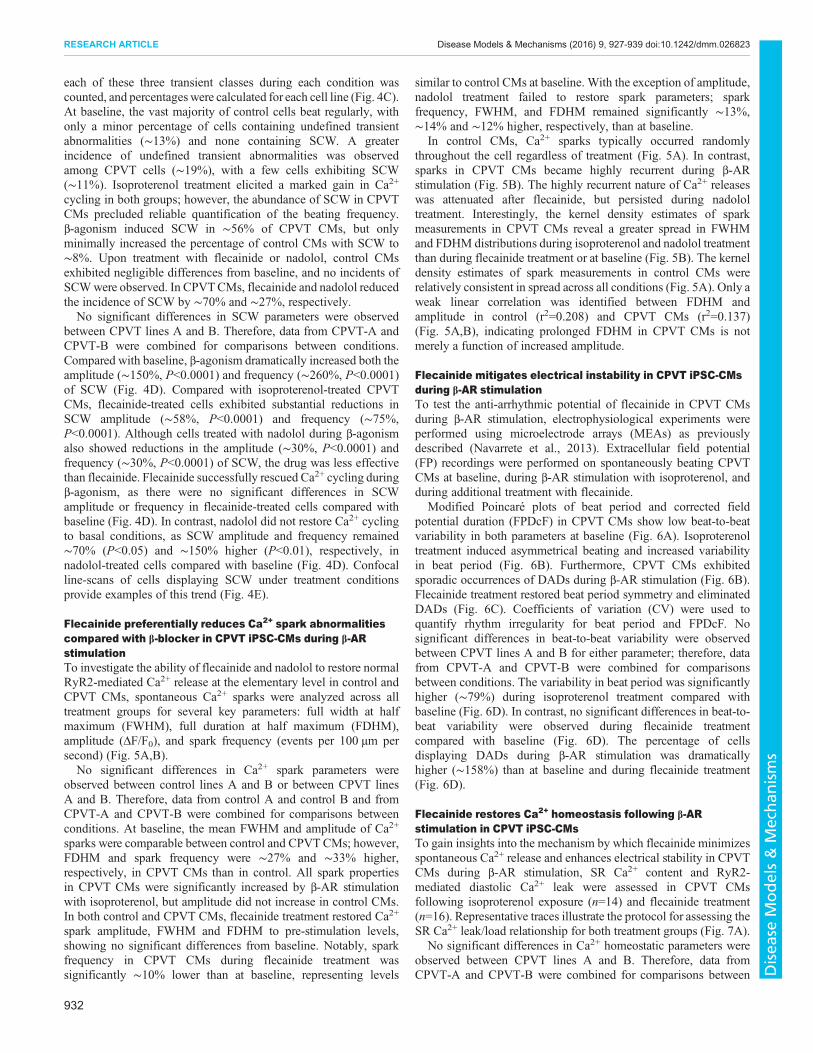
Flecainide preferentially reduces Ca2+ spark abnormalitiescompared with β-blocker in CPVT iPSC-CMs during β-ARstimulationTo investigate the ability of flecainide and nadolol to restore normalRyR2-mediated Ca2+ release at the elementary level in control andCPVT CMs, spontaneous Ca2+ sparks were analyzed across alltreatment groups for several key parameters: full width at halfmaximum (FWHM), full duration at half maximum (FDHM),amplitude (ΔF/F0), and spark frequency (events per 100 µm persecond) (Fig. 5A,B).No significant differences in Ca2+ spark parameters were
observed between control lines A and B or between CPVT linesA and B. Therefore, data from control A and control B and fromCPVT-A and CPVT-B were combined for comparisons betweenconditions. At baseline, the mean FWHM and amplitude of Ca2+
sparks were comparable between control and CPVT CMs; however,FDHM and spark frequency were ∼27% and ∼33% higher,respectively, in CPVT CMs than in control. All spark propertiesin CPVT CMs were significantly increased by β-AR stimulationwith isoproterenol, but amplitude did not increase in control CMs.In both control and CPVT CMs, flecainide treatment restored Ca2+
spark amplitude, FWHM and FDHM to pre-stimulation levels,showing no significant differences from baseline. Notably, sparkfrequency in CPVT CMs during flecainide treatment wassignificantly ∼10% lower than at baseline, representing levels
similar to control CMs at baseline. With the exception of amplitude,nadolol treatment failed to restore spark parameters; sparkfrequency, FWHM, and FDHM remained significantly ∼13%,∼14% and ∼12% higher, respectively, than at baseline.
In control CMs, Ca2+ sparks typically occurred randomlythroughout the cell regardless of treatment (Fig. 5A). In contrast,sparks in CPVT CMs became highly recurrent during β-ARstimulation (Fig. 5B). The highly recurrent nature of Ca2+ releaseswas attenuated after flecainide, but persisted during nadololtreatment. Interestingly, the kernel density estimates of sparkmeasurements in CPVT CMs reveal a greater spread in FWHMand FDHM distributions during isoproterenol and nadolol treatmentthan during flecainide treatment or at baseline (Fig. 5B). The kerneldensity estimates of spark measurements in control CMs wererelatively consistent in spread across all conditions (Fig. 5A). Only aweak linear correlation was identified between FDHM andamplitude in control (r2=0.208) and CPVT CMs (r2=0.137)(Fig. 5A,B), indicating prolonged FDHM in CPVT CMs is notmerely a function of increased amplitude.
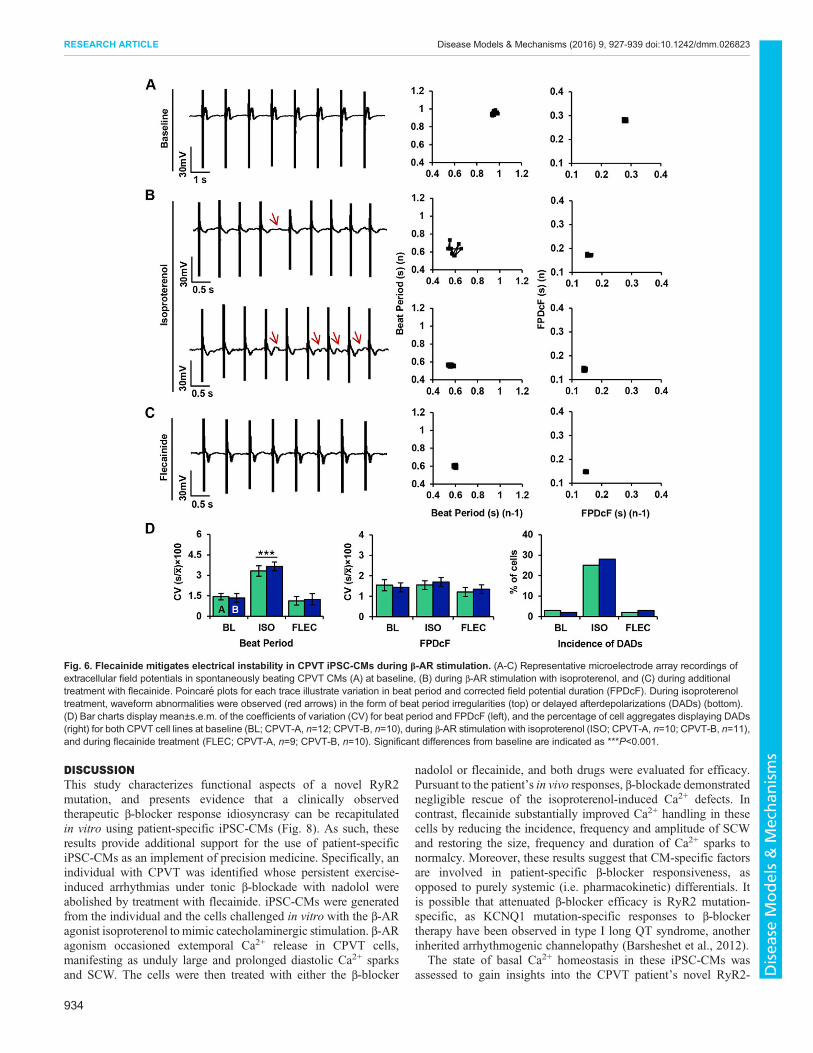
Flecainide mitigates electrical instability in CPVT iPSC-CMsduring β-AR stimulationTo test the anti-arrhythmic potential of flecainide in CPVT CMsduring β-AR stimulation, electrophysiological experiments wereperformed using microelectrode arrays (MEAs) as previouslydescribed (Navarrete et al., 2013). Extracellular field potential(FP) recordings were performed on spontaneously beating CPVTCMs at baseline, during β-AR stimulation with isoproterenol, andduring additional treatment with flecainide.
Modified Poincaré plots of beat period and corrected fieldpotential duration (FPDcF) in CPVT CMs show low beat-to-beatvariability in both parameters at baseline (Fig. 6A). Isoproterenoltreatment induced asymmetrical beating and increased variabilityin beat period (Fig. 6B). Furthermore, CPVT CMs exhibitedsporadic occurrences of DADs during β-AR stimulation (Fig. 6B).Flecainide treatment restored beat period symmetry and eliminatedDADs (Fig. 6C). Coefficients of variation (CV) were used toquantify rhythm irregularity for beat period and FPDcF. Nosignificant differences in beat-to-beat variability were observedbetween CPVT lines A and B for either parameter; therefore, datafrom CPVT-A and CPVT-B were combined for comparisonsbetween conditions. The variability in beat period was significantlyhigher (∼79%) during isoproterenol treatment compared withbaseline (Fig. 6D). In contrast, no significant differences in beat-to-beat variability were observed during flecainide treatmentcompared with baseline (Fig. 6D). The percentage of cellsdisplaying DADs during β-AR stimulation was dramaticallyhigher (∼158%) than at baseline and during flecainide treatment(Fig. 6D).
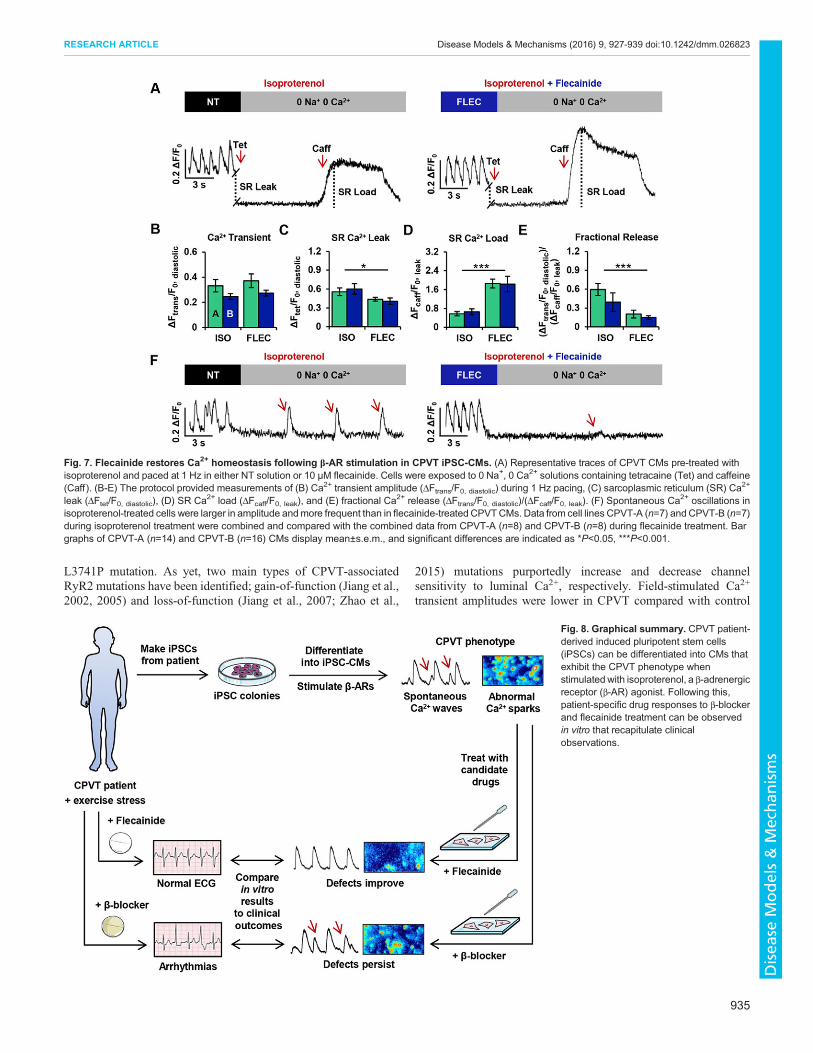
Flecainide restores Ca2+ homeostasis following β-ARstimulation in CPVT iPSC-CMsTo gain insights into the mechanism by which flecainide minimizesspontaneous Ca2+ release and enhances electrical stability in CPVTCMs during β-AR stimulation, SR Ca2+ content and RyR2-mediated diastolic Ca2+ leak were assessed in CPVT CMsfollowing isoproterenol exposure (n=14) and flecainide treatment(n=16). Representative traces illustrate the protocol for assessing theSR Ca2+ leak/load relationship for both treatment groups (Fig. 7A).
No significant differences in Ca2+ homeostatic parameters wereobserved between CPVT lines A and B. Therefore, data fromCPVT-A and CPVT-B were combined for comparisons between
932
RESEARCH ARTICLE Disease Models & Mechanisms (2016) 9, 927-939 doi:10.1242/dmm.026823
Disea
seModels&Mechan
isms
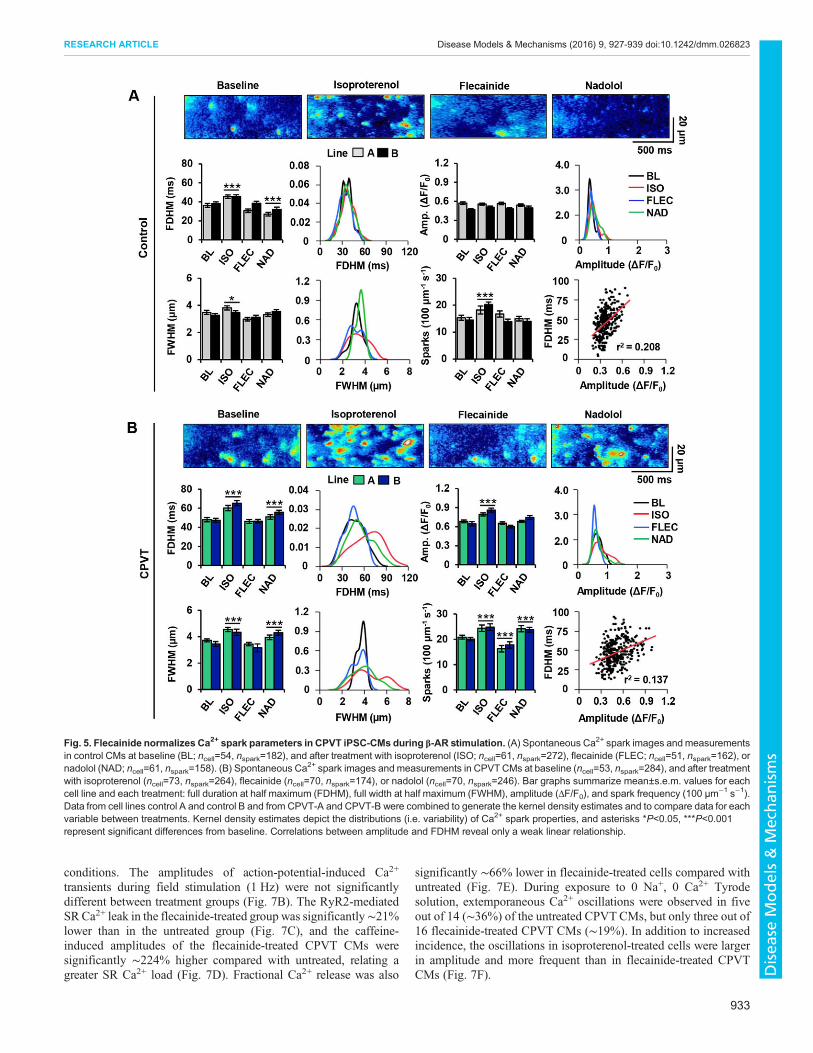
conditions. The amplitudes of action-potential-induced Ca2+
transients during field stimulation (1 Hz) were not significantlydifferent between treatment groups (Fig. 7B). The RyR2-mediatedSRCa2+ leak in the flecainide-treated group was significantly∼21%lower than in the untreated group (Fig. 7C), and the caffeine-induced amplitudes of the flecainide-treated CPVT CMs weresignificantly ∼224% higher compared with untreated, relating agreater SR Ca2+ load (Fig. 7D). Fractional Ca2+ release was also
significantly ∼66% lower in flecainide-treated cells compared withuntreated (Fig. 7E). During exposure to 0 Na+, 0 Ca2+ Tyrodesolution, extemporaneous Ca2+ oscillations were observed in fiveout of 14 (∼36%) of the untreated CPVTCMs, but only three out of16 flecainide-treated CPVT CMs (∼19%). In addition to increasedincidence, the oscillations in isoproterenol-treated cells were largerin amplitude and more frequent than in flecainide-treated CPVTCMs (Fig. 7F).
Fig. 5. Flecainide normalizes Ca2+ spark parameters in CPVT iPSC-CMs during β-AR stimulation. (A) Spontaneous Ca2+ spark images andmeasurementsin control CMs at baseline (BL; ncell=54, nspark=182), and after treatment with isoproterenol (ISO; ncell=61, nspark=272), flecainide (FLEC; ncell=51, nspark=162), ornadolol (NAD; ncell=61, nspark=158). (B) Spontaneous Ca
2+ spark images and measurements in CPVTCMs at baseline (ncell=53, nspark=284), and after treatmentwith isoproterenol (ncell=73, nspark=264), flecainide (ncell=70, nspark=174), or nadolol (ncell=70, nspark=246). Bar graphs summarize mean±s.e.m. values for eachcell line and each treatment: full duration at half maximum (FDHM), full width at half maximum (FWHM), amplitude (ΔF/F0), and spark frequency (100 µm−1 s−1).Data from cell lines control A and control B and from CPVT-A and CPVT-B were combined to generate the kernel density estimates and to compare data for eachvariable between treatments. Kernel density estimates depict the distributions (i.e. variability) of Ca2+ spark properties, and asterisks *P<0.05, ***P<0.001represent significant differences from baseline. Correlations between amplitude and FDHM reveal only a weak linear relationship.
933
RESEARCH ARTICLE Disease Models & Mechanisms (2016) 9, 927-939 doi:10.1242/dmm.026823
Disea
seModels&Mechan
isms
DISCUSSIONThis study characterizes functional aspects of a novel RyR2mutation, and presents evidence that a clinically observedtherapeutic β-blocker response idiosyncrasy can be recapitulatedin vitro using patient-specific iPSC-CMs (Fig. 8). As such, theseresults provide additional support for the use of patient-specificiPSC-CMs as an implement of precision medicine. Specifically, anindividual with CPVT was identified whose persistent exercise-induced arrhythmias under tonic β-blockade with nadolol wereabolished by treatment with flecainide. iPSC-CMs were generatedfrom the individual and the cells challenged in vitro with the β-ARagonist isoproterenol to mimic catecholaminergic stimulation. β-ARagonism occasioned extemporal Ca2+ release in CPVT cells,manifesting as unduly large and prolonged diastolic Ca2+ sparksand SCW. The cells were then treated with either the β-blocker
nadolol or flecainide, and both drugs were evaluated for efficacy.Pursuant to the patient’s in vivo responses, β-blockade demonstratednegligible rescue of the isoproterenol-induced Ca2+ defects. Incontrast, flecainide substantially improved Ca2+ handling in thesecells by reducing the incidence, frequency and amplitude of SCWand restoring the size, frequency and duration of Ca2+ sparks tonormalcy. Moreover, these results suggest that CM-specific factorsare involved in patient-specific β-blocker responsiveness, asopposed to purely systemic (i.e. pharmacokinetic) differentials. Itis possible that attenuated β-blocker efficacy is RyR2 mutation-specific, as KCNQ1 mutation-specific responses to β-blockertherapy have been observed in type I long QT syndrome, anotherinherited arrhythmogenic channelopathy (Barsheshet et al., 2012).
The state of basal Ca2+ homeostasis in these iPSC-CMs wasassessed to gain insights into the CPVT patient’s novel RyR2-
Fig. 6. Flecainide mitigates electrical instability in CPVT iPSC-CMs during β-AR stimulation. (A-C) Representative microelectrode array recordings ofextracellular field potentials in spontaneously beating CPVT CMs (A) at baseline, (B) during β-AR stimulation with isoproterenol, and (C) during additionaltreatment with flecainide. Poincare plots for each trace illustrate variation in beat period and corrected field potential duration (FPDcF). During isoproterenoltreatment, waveform abnormalities were observed (red arrows) in the form of beat period irregularities (top) or delayed afterdepolarizations (DADs) (bottom).(D) Bar charts display mean±s.e.m. of the coefficients of variation (CV) for beat period and FPDcF (left), and the percentage of cell aggregates displaying DADs(right) for both CPVT cell lines at baseline (BL; CPVT-A, n=12; CPVT-B, n=10), during β-AR stimulation with isoproterenol (ISO; CPVT-A, n=10; CPVT-B, n=11),and during flecainide treatment (FLEC; CPVT-A, n=9; CPVT-B, n=10). Significant differences from baseline are indicated as ***P<0.001.
934
RESEARCH ARTICLE Disease Models & Mechanisms (2016) 9, 927-939 doi:10.1242/dmm.026823
Disea
seModels&Mechan
isms
L3741P mutation. As yet, two main types of CPVT-associatedRyR2 mutations have been identified; gain-of-function (Jiang et al.,2002, 2005) and loss-of-function (Jiang et al., 2007; Zhao et al.,
2015) mutations purportedly increase and decrease channelsensitivity to luminal Ca2+, respectively. Field-stimulated Ca2+
transient amplitudes were lower in CPVT compared with control
Fig. 7. Flecainide restores Ca2+ homeostasis following β-AR stimulation in CPVT iPSC-CMs. (A) Representative traces of CPVT CMs pre-treated withisoproterenol and paced at 1 Hz in either NT solution or 10 µM flecainide. Cells were exposed to 0 Na+, 0 Ca2+ solutions containing tetracaine (Tet) and caffeine(Caff ). (B-E) The protocol provided measurements of (B) Ca2+ transient amplitude (ΔFtrans/F0, diastolic) during 1 Hz pacing, (C) sarcoplasmic reticulum (SR) Ca2+
leak (ΔFtet/F0, diastolic), (D) SR Ca2+ load (ΔFcaff/F0, leak), and (E) fractional Ca2+ release (ΔFtrans/F0, diastolic)/(ΔFcaff/F0, leak). (F) Spontaneous Ca2+ oscillations inisoproterenol-treated cells were larger in amplitude andmore frequent than in flecainide-treated CPVTCMs. Data from cell lines CPVT-A (n=7) andCPVT-B (n=7)during isoproterenol treatment were combined and compared with the combined data from CPVT-A (n=8) and CPVT-B (n=8) during flecainide treatment. Bargraphs of CPVT-A (n=14) and CPVT-B (n=16) CMs display mean±s.e.m., and significant differences are indicated as *P<0.05, ***P<0.001.
Fig. 8. Graphical summary. CPVT patient-derived induced pluripotent stem cells(iPSCs) can be differentiated into CMs thatexhibit the CPVT phenotype whenstimulated with isoproterenol, a β-adrenergicreceptor (β-AR) agonist. Following this,patient-specific drug responses to β-blockerand flecainide treatment can be observedin vitro that recapitulate clinicalobservations.
935
RESEARCH ARTICLE Disease Models & Mechanisms (2016) 9, 927-939 doi:10.1242/dmm.026823
Disea
seModels&Mechan
isms
CMs, indicating that Ca2+-induced Ca2+ release (CICR)competence is diminished in RyR2-L3741P CPVT CMs.Measurement of SR Ca2+ load and RyR2-mediated diastolic Ca2+
leak revealed mean SR Ca2+ load was significantly decreased inCPVT CMs, concomitant with significantly increased diastolicCa2+ leak and enhanced fractional Ca2+ release. Moreover, in theabsence of transsarcolemmal fluxes (0 Na+, 0 Ca2+), only CPVTCMs displayed Ca2+ oscillations. These oscillations ostensiblydenote undue RyR2 channel activation during diastole, given thatthey were abolished upon RyR2 inhibition with tetracaine. As theseproperties have been associated with electrical instability andincreased RyR2 sensitivity to luminal Ca2+ (Gonzalez et al., 2007;Iyer et al., 2007), we suspect that the RyR2-L3741P mutation is again-of-function mutation, although single-channel studies will berequired to substantiate this claim.Although cardiac arrhythmias are not exclusively Ca2+-
dependent, intense or prolonged SR Ca2+ releases at the cellularlevel might be responsible for the distorted FP waveformsand premature depolarizations observed in our CPVT CMs.The emergence of arrhythmogenic SCW is contingent uponperturbations in the random activation, refractoriness andrecruitment of RyR2 clusters (Weiss et al., 2011). Therefore, wetheorize that these elements are disturbed during β-AR stimulationand are preferentially rescued by flecainide in our CPVT CMs.Firstly, Ca2+ sparks and other release events became significantlylonger and highly recurrent in CPVT CMs during isoproterenoltreatment compared with the brief and sporadic nature of Ca2+
sparks in controls, suggesting a disruption in the random activationof RyR2 channels and potentially elevated CICR gain (Zhang et al.,2013). Secondly, the higher frequency and amplitude of sparks andwhole-cell SCW in CPVT CMs compared with controls isconsistent with a previous study that reported accelerated Ca2+
release restitution in CPVT CMs attributed to abbreviated RyR2refractoriness (Brunello et al., 2013). Thirdly, the increase inspatially large dyadic Ca2+ release in CPVT compared with controlCMs during β-AR stimulation suggests enhanced recruitment ofneighboring RyR2s. The greater mean and variability in Ca2+ sparkduration observed in these CPVT CMs during β-AR stimulationcompared with control could possibly be explained by impairedfunctional coordination (‘coupled gating’) of RyR2s (Marx et al.,2001), as mathematical models have demonstrated that even modestreductions in RyR2 coupling greatly increase the mean andvariability of Ca2+ spark duration (Sobie et al., 2002). Notably,considerable reductions in both the mean and variability of Ca2+
spark duration were observed during flecainide, but not β-blocker,treatment.Despite this, the exact mechanism of flecainide’s salubrious
effects in CPVT CMs remains a point of contention as highlightedin a recent review (Smith and MacQuaide, 2015). Given thatflecainide significantly diminished RyR2-mediated SR Ca2+ leakand fractional release while increasing SR Ca2+ stores in CPVTCMs after β-agonism, one might be tempted to conclude thatflecainide directly stabilizes RyR2, as has been previously reported(Hilliard et al., 2010; Galimberti and Knollmann, 2011). However,this premise has been brought into question by studies in wild-typeanimal CMs that suggest flecainide’s inhibitory effects on the Na+
current (INa) indirectly mitigate electrical instability through NCX(Sikkel et al., 2013) and Na+ channel-mediated rebalancing ofintracellular Ca2+ homeostasis (Bannister et al., 2015). As weobserved integrally disturbed Ca2+ homeostasis in RyR2-L3741PCPVT CMs, we speculate that flecainide’s Ca2+-rebalancingmechanism of action could account for superior rescue of Ca2+-
handling defects compared with the non-homeostatic effects ofnadolol in these cells. Another possibility is that flecainide mightadditionally act by binding to one of the many cytoplasmicmodulators of RyR2, such as FKBP12.6, calmodulin or S100A1(Smith and MacQuaide, 2015).
Further patient-specific drug-response studies are needed thatdirectly compare in vitro data from iPSC-CM experiments withclinical observations. Because iPSC-CMs express only fetal-likelevels of Ca2+-buffering molecules (Yang et al., 2014), their relativeimmaturity could provide either an exaggerated or attenuated viewof drug response differentials. Improved phenotypic data and accessto patient genomic information will be important to elucidate ifspecific mutations or other genetic variants are predictive of β-blocker efficacy in CPVT, which could inform point-of-caretreatment decisions. In conclusion, fundamental aspects ofclinically observed patient-specific drug responses to β-blockertherapy in CPVT can be modeled in vitro using iPSC-CMs, and theefficacy of other drugs such as flecainide can be comparativelyevaluated (Fig. 8). These findings advance proof-of-principle forpatient-derived iPSC-CMs as an implement of precision medicine,and propound iPSC-CMs as a platform for exploring the molecularunderpinnings of β-blocker treatment failure in CPVT.
MATERIALS AND METHODSPatient identification and recruitmentDiagnosis of the CPVT-affected subject was determined after cardiacechocardiography, 24-h Holter monitoring, exercise stress testing (Jameset al., 1980), and electrocardiogram (ECG). Genotyping of the individualand his family was performed with the GeneDx genetic testing service usingthe CPVT sequencing panel. Control subjects were recruited voluntarily ashealthy spouses of individuals affected with adult-onset neurologicaldisorders. Control A in this study was a 59-year-old male and control B wasa 62-year-old male. Both control individuals had no history of cardiacabnormalities or neurological disorders at the time of biopsy. Recent workhas shown that reprogramming largely resets the biological age of donorsomatic cells (Miller et al., 2013), obviating the need for age-matchedcontrols. Informed consent was attained from all participants, and the studywas approved as safe and ethical by the Emory University InstitutionalReview Board (IRB) in accordance with the principles expressed in theDeclaration of Helsinki.
Generation of cell lines, cell culture and cardiac differentiationFor CPVT lines, primary human dermal fibroblasts (hDFs) werereprogrammed into iPSC lines using integration-free episomal vectors aspreviously described (Okita et al., 2011). Low-passage (≤5) hDFs wereused, as they exhibit enhanced reprogramming efficiency (Su et al., 2012).Approximately 5×10⁵ cells were transfected in 100 µl Amaxa nucleofectionsolution V (Lonza) with 1 µg each of Addgene plasmids 27077 (pCXLE-hOCT3/4-shp53-F), 27078 (pCXLE-hSK), and 27080 (pCXLE-hUL) usingthe Amaxa Nucleofector II/2b Device (program U-023). Transfected cellswere cultured in fibroblast medium containing 10 µM ROCK inhibitorY27632 (Stemgent) for one day. For the next 6 days, fibroblast mediumwas changed daily. On post-transfection day 6, the cells were dissociatedand 1×10⁵ cells were re-plated onto irradiated mouse embryonic fibroblasts(MEF), and cultured in human pluripotent stem cell (hPSC) medium[KnockOut DMEM, 20% KnockOut SR, 2 mM L-glutamine, 0.1 mM non-essential amino acids, 0.1 mM β-mercaptoethanol (Sigma)] supplementedwith 8 ng/ml human basic fibroblast growth factor (bFGF; Thermo Fisher)and Human iPS Reprogramming Boost Supplement II (EMDMillipore). Allmedium components were obtained from Thermo Fisher unless otherwisespecified. The boost supplement was withdrawn on day 11. On post-transfection day 14, iPSC colonies were picked and re-plated at one colonyper well. iPSCs were then cultured in ‘feeder-free’ conditions as previouslydescribed (Xu et al., 2001). Control lines were reprogrammed using theCytoTune iPS 2.0 Sendai Reprogramming Kit (Thermo Fisher) in
936
RESEARCH ARTICLE Disease Models & Mechanisms (2016) 9, 927-939 doi:10.1242/dmm.026823
Disea
seModels&Mechan
isms
accordance with manufacturer’s instructions. For all lines, g-bandedkaryotyping was performed on live mitotic cell cultures (passages 10-20)using cytogenetics services (CPVT lines, Children’s Hospital OaklandResearch Institute; control lines, WiCell Research Institute). iPSCs weredifferentiated into cardiomyocytes using a growth-factor method andsubsequently cultured in serum-free conditions as previously described(Jha et al., 2015).
Immunocytochemical analysisAdherent cells were rinsed with cold 1× PBS and fixed with 2%paraformaldehyde solution for 10-15 min at room temperature (RT),permeabilized with ice-cold 100% ethanol for 5 min, rinsed again with 1×PBS, and blocked overnight at 4°C with 5% normal goat serum (NGS;Thermo Fisher). Cells were incubated for 2 h at RTwith primary antibodies,then rinsed three times with 1× PBS to remove excess antibody. Cells wereincubated with fluorescently conjugated secondary antibodies for 1 h at RTin the dark. Cells were washed three more times with 1× PBS. Nuclearcounterstaining was performed using Vectashield mounting media withDAPI (Vector Laboratories). For more information on the antibodiesused, please refer to Tables S1 and S2. Cells were imaged with a phasecontrast and fluorescence AxioVert A1 inverted microscope (Zeiss)equipped with AxioCam digital camera system (Zeiss). Images wereexported using AxioVision LE (Zeiss) and merging was performed inAdobe Photoshop.
Embryoid body pluripotency assayThe embryoid body (EB) assay for pluripotency was performed aspreviously described (Xu et al., 2001). Undifferentiated hiPSCs wereharvested in clusters after incubation for 5 min at 37°C with collagenase IV(Life Technologies). Suspended colonies were then transferred to low-attachment plates in serum-containing differentiation medium [DMEM,20% FBS, 1 mM L-glutamine, 0.1 mM β-mercaptoethanol (Sigma) and 1%non-essential amino acids]. All medium components were obtained fromThermo Fisher unless otherwise specified. Cell aggregates were maintainedin suspension for 5 days before being transferred to 0.5% gelatin-coatedplates. Attached EBs were maintained in differentiation medium for anadditional 10 days to allow for random differentiation and the formationof outgrowths. On day 15, differentiated outgrowths were eitherharvested for RNA extraction or fixed with 2% paraformaldehyde forimmunocytochemical analysis. Cultures were assessed for the presence ofdevelopmental germ layer markers via immunocytochemistry: α-smoothmuscle actin (mesoderm), α-fetal protein (endoderm), and β-tubulin III(ectoderm). Gene expression levels for lineage-specific genes were assessedvia qRT-PCR.
Real-time polymerase chain reactionTotal RNA was extracted from iPSCs, 15-day-old EBs, and 20-day-oldiPSC-CMs using Aurum total RNA mini kit (Bio-Rad). cDNAs wereprepared from individual 1 µg RNA samples using the SuperScript VILOcDNA Synthesis Kit (Life Technologies), and incubations were performedusing a C1000 touch thermal cycler (Bio-Rad). Gene expression levels werequantified using the 7500 Real-Time PCR System (Applied Biosystems).PCR amplifications were performed in skirted 96-well PCR plates(GeneMate) with iTaq Universal SYBR Green PCR Supermix (Bio-Rad).For each sample, mRNA levels were normalized to GAPDH mRNA levels.Data for each gene are presented in color-coded heatmaps of inverse ΔCT
values (corrected for GAPDH) as previously described (Schmittgen andLivak, 2008) on a scale of green (low) to medium (yellow) to red (high).Primer sequences were obtained from the NCI/NIH qPrimerDepot. Formore information on the genes and primers selected, please refer toTables S3 and S4.
Assessment of Ca2+ homeostasisCardiomyocyte SR Ca2+ load and RyR2-mediated diastolic Ca2+ leakagewere assayed using fluo-4 fluorescence and the Shannon–Bers technique(Shannon et al., 2002). Cardiomyocytes (25±5 days old) were incubated for30 min at 37°C in cell culture medium containing 10 μM of the cytosolicCa2+ dye fluo-4 AM (Life Technologies) to load the indicator into the
cytosol. Following incubation, the indicator-containing medium wasremoved; cells were washed once, and incubated in cell culture mediumfor an additional 30 min at 37°C to allow for de-esterification of theindicator. Recordings were captured using an epifluorescence microscope(Olympus® IX51) equipped with the IonOptix calcium and contractilitysystem. Cells were bathed in 37°C NT solution (140 mM NaCl, 5.4 mMKCl, 0.53 mM MgCl2, 0.33 mM NaH2PO, 5 mM HEPES, 1.8 mM CaCl2,10 mM glucose, pH 7.4 with NaOH) and field-stimulated at 1 Hz(30 V cm−1, 10 ms) for at least 20 s to bring the intracellular Ca2+ contentto a steady state. Once achieved, stimulation was turned off, and the bathingsuperfusate was rapidly switched to a 0 Na+, 0 Ca2+ Tyrode buffer (140 mMLiCl, 5.4 mM KCl, 0.53 mM MgCl2, 5 mM HEPES, 10 mM glucose,10 mM EGTA, pH 7.4 with LiOH) for 10 s to abolish transsarcolemmal Ca2+ fluxes through the Na+/Ca2+ exchanger (NCX). Tetracaine and caffeinesolutions were added dropwise using a temperature-controlled needledirectly above each cell. RyR2 channels were inhibited by adding a 1 mMtetracaine (0 Na+, 0 Ca2+) solution dropwise for ∼10 s. At this time,tetracaine was stopped, and SR Ca2+ stores were depleted by adding a30 mM caffeine (0 Na+, 0 Ca2+) solution dropwise for ∼10 s. At this time,caffeine was stopped, and the bathing solution was rapidly switched from 0Na+, 0 Ca2+ Tyrode buffer back to NT solution. Data files were exported andmonotonic transient analysis was performed with IonWizard® 6.5 software.
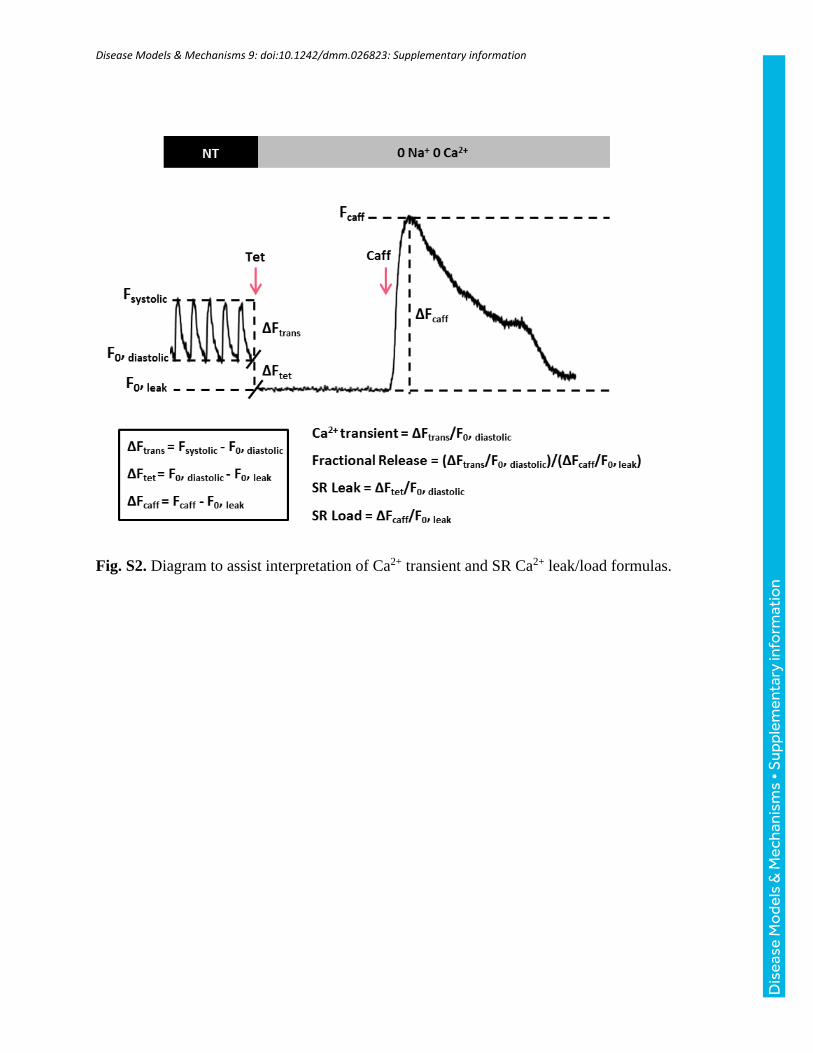
When cells were field stimulated at 1 Hz in NT solution, the actionpotential-induced Ca2+ transient amplitudewas defined as ΔFtrans/F0, diastolic,where ΔFtrans is the change in signal between the peak fluorescence and theminimum diastolic fluorescence (F0, diastolic). The tetracaine-induced drop influorescence was defined as ΔFtet/F0, diastolic, where ΔFtet is the change insignal between the diastolic fluorescence preceding the addition oftetracaine (F0, diastolic), and the minimum fluorescence after tetracaine(F0, leak) under 0 Na+, 0 Ca2+ conditions. The caffeine-induced Ca2+
transient amplitude was defined as ΔFcaff/F0, leak, where ΔFcaff is thedifference between peak fluorescence after caffeine and the minimumfluorescence preceding the addition of caffeine (F0, leak) under 0 Na
+, 0 Ca2+
conditions. Fractional Ca2+ release was defined as the ratio of the actionpotential-induced Ca2+ transient amplitude to the caffeine-induced Ca2+
transient amplitude (ΔFtrans/F0, diastolic)/(ΔFcaff/F0, leak). For a diagram thatassists interpretation of these formulas, refer to Fig. S2.
Imaging of intracellular Ca2+ dynamics and drug treatmentsSpontaneously beating cardiomyocytes (30±2 days old) differentiated fromcontrol and CPVT iPSC lines were incubated with 10 μM of fluo-4 AM(30 min loading, 30 min de-esterification) at 37°C in culture medium, thentransferred to an inverted laser confocal scanning microscope (OlympusFV1000) equipped with FluoView software (Olympus), where they wereperfused with NT solution. For each pharmacological agent, cells wereallowed to perfuse for 10 min with drug-containing NT before initiatingrecording. Fluo-4 was excited by the 488 nm line of an argon laser andemitted fluorescence was captured at >505 nm. Recordings of fluo-4fluorescence were acquired in line-scan mode, where line-scans werepreferentially positioned in the center of the cell (as opposed to theperiphery) along the longitudinal axis (Guatimosim et al., 2011). Regionswith densely accumulated fluo-4 were avoided, so as to exclude artifacts(e.g. endoplasmic reticulum, mitochondria, vesicles, etc.). Images wereacquired in line-scan (X-T) mode at a sampling rate of≥500 lines per secondand a pixel size of 0.155 µm. Data was exported and analyzed withClampFit® 10.0 software (Molecular Devices).
As differentials in fluo-4 loading efficiency between cell lines caninfluence observed fluorescence intensities, loading and acquisitionconditions were kept as consistent as possible, and all absolutefluorescence (F) measurements were normalized to inherent basal (i.e.background) fluorescence (F0). Estimates of intracellular Ca2+ are presentedas changes in ΔF/F0, where ΔF=F−F0. Isoproterenol (100 nM), nadolol(10 µM), and flecainide (10 µM) dosages (Sigma) and incubation time(10 min) were initially selected according to previous literature reports(Audigane et al., 2009; Itzhaki et al., 2012; Mehta et al., 2014), but werevalidated by serial dilution in preliminary experiments based on theirchronotropic effects (Fig. S4). The nadolol dosage was chosen as theconcentration that returned the beating frequency approximately to baseline
937
RESEARCH ARTICLE Disease Models & Mechanisms (2016) 9, 927-939 doi:10.1242/dmm.026823
Disea
seModels&Mechan
isms
levels. The flecainide dosage was limited to 10 µM, as the two higherconcentrations tested (25 µM and 50 µM) caused both control and CPVTcells to arrest beating.
Ca2+ sparks analysisQuantification of Ca2+ sparks was performed on line-scans using theSparkMaster plugin (Picht et al., 2007) for ImageJ (NIH). Regions foranalysis were selected from the portions outside the action potential-inducedtransient. Fluorescence amplitudes were measured, normalized to basalfluorescence, and expressed as ΔF/F0. As recommended by the SparkMasteralgorithm developers (Picht et al., 2007), a detection criteria threshold of 3.8was selected in which the detection of events was 3.8 times the standarddeviation of the background noise divided by the mean. Representativeoutput images were generated using the ‘F/F0’ setting available in theplugin. P-values are reported for significant differences between treatment(e.g. isoproterenol) and baseline (i.e. no treatment), not for differencesbetween CPVT and control CMs. Kernel density estimates of Ca2+ sparkparameter distributions were generated for each condition using JMP fromStatistical Analysis Software.
Microelectrode array recordings and analysisMicroelectrode array (MEA) recordings were performed using the 64-channel Muse MEA system (Axion Biosystems). M64-GL (SU-8/Pt)MEA chambers (Axion Biosystems) were coated with matrigel (1:30dilution) overnight before being seeded with 200 µl containing 6-12CPVT iPSC-CM cell aggregates (day 20±5) per array. Spontaneouslybeating CPVT CMs were recorded at baseline and following 5 minincubation with 100 nM isoproterenol, and later 10 µM flecainide.Recording times were at least 1 min per sample per condition, andchambers were maintained at 37°C during recording. Analog fieldpotential signals were acquired through a 0.1 Hz high-pass filter and a2 kHz low-pass filter at a sampling frequency of 12.5 kHz. Data files wereexported and analyzed using Axion Integrated Studio (AxIS) 2.3 software.Field potential parameters were analyzed, and waveforms were evaluatedfor the presence of DADs. Low-amplitude depolarizations occurringafter completion of repolarization were considered DADs. Beat period(BP) was defined as the time in seconds between two successivedepolarization spikes. Field potential duration (FPD) was defined as thetime in milliseconds between a depolarization spike and the subsequentT-wave, and was corrected for beating rate using Fridericia’s formula:
FPDcF ¼ FPDffiffiffiffiffiffi
BP3p (Nakamura et al., 2014). Modified Poincaré plots (Zhao
et al., 2015) were generated by plotting the beat period time orFPDcF (converted to seconds) of beat n against that of beat n–1 for60 beats. Coefficients of variation (CV) for beat period and FPDcFwere calculated for each cell aggregate as the standard deviation (s.d.) ofeach parameter recorded in 60 s divided by the mean (x), multiplied by100. Large CV values are indicative of beat irregularity and potentialarrhythmia.
Assessment of Ca2+ homeostasis in response to drug treatmentsTo determine the effects of β-agonism on SR Ca2+ leak and load, CPVTCMswere incubated for 10 min with 100 nM isoproterenol in NT solution at37°C. After 10 min, the coverslips pre-treated with isoproterenol wereperfused with NT solution for an additional 5 min before initiating the SRCa2+ leak/load protocol. To assess the ability of flecainide to improve Ca2+
homeostasis in CPVT CMs during β-AR stimulation, cells were again pre-treated for 10 min with 100 nM isoproterenol, but were then perfused with10 µM flecainide (rather than NT solution) for an additional 5 min beforebeginning the protocol.
Statistical analysisAcross all data sets, significant differences between control lines A and Band between CPVT lines A and Bwere assessed by two-sample t-test. As nosignificant differences were observed, data from cell lines control A andcontrol B and fromCPVT-A and CPVT-Bwere combined, where necessary,for comparisons between conditions. For SR Ca2+ leak/load, significancewas assessed by two-sample test. For Ca2+ spark analyses, spontaneous
Ca2+ wave analyses, and MEA analyses, significance was assessed usingone-way ANOVA, and post-hoc individual comparisons for each variablewere performed using Tukey’s HSD test.
AcknowledgementsThe authors thank the study participants and the Children’s Miracle Network gift toChildren’s Healthcare of Atlanta. They also thank Dr Edward Balog for valuablediscussions, Dr Kevin Maher for IRB support, and Dr Doan Nguyen for assistanceisolating fibroblasts. Images from Servier Medical Art were used in the graphicalsummary.
Competing interestsThe authors declare no competing or financial interests.
Author contributionsM.K.P. designed and performed experiments, analyzed and interpreted data, andwrote the manuscript. C.X., M.B.W., and P.S.F. conceived and developed the study.R.J., Q.W., J.T.M., M.S., B.W., and M.B.W. performed experiments and/or analyzeddata. Z.T.M., W.R., and C.M.H. contributed biological materials. P.S.F. and A.D.managed patient recruitment and clinical characterization. All authors discussedand reviewed the manuscript.
FundingThis work was supported in part by the Center for Pediatrics Nanomedicine at theEmory • Children’s • GT Pediatric Research Alliance and grants to C.X. from theCenter for the Advancement of Science in Space [grant number GA-2014-126],National Institutes of Health (NIH) – National Heart, Lung, and Blood Institute [grantnumber R21HL123928], and the NIH – National Heart, Lung, and Blood InstituteProgram of Excellence in Nanotechnology award [Contract No.HHSN268201000043C].
Supplementary informationSupplementary information available online athttp://dmm.biologists.org/lookup/doi/10.1242/dmm.026823.supplemental
ReferencesAudigane, L., Kerfant, B.-G., El Harchi, A., Lorenzen-Schmidt, I., Toumaniantz,
G., Cantereau, A., Potreau, D., Charpentier, F., Noireaud, J. and Gauthier, C.(2009). Rabbit, a relevant model for the study of cardiac beta 3-adrenoceptors.Exp. Physiol. 94, 400-411.
Bannister, M. L., Thomas, N. L., Sikkel, M. B., Mukherjee, S., Maxwell, C.,MacLeod, K. T., George, C. H. and Williams, A. J. (2015). The mechanism offlecainide action in CPVT does not involve a direct effect on RyR2. Circ. Res. 116,1324-1335.
Barsheshet, A., Goldenberg, I., O-Uchi, J., Moss, A. J., Jons, C., Shimizu, W.,Wilde, A. A., McNitt, S., Peterson, D. R., Zareba, W. et al. (2012). Mutations incytoplasmic loops of the KCNQ1 channel and the risk of life-threatening events:implications for mutation-specific response to beta-blocker therapy in type 1 long-QT syndrome. Circulation 125, 1988-1996.
Brunello, L., Slabaugh, J. L., Radwanski, P. B., Ho, H.-T., Belevych, A. E., Lou,Q.,Chen, H., Napolitano, C., Lodola, F., Priori, S. G. et al. (2013). Decreased RyR2refractoriness determinesmyocardial synchronization of aberrant Ca2+ release in agenetic model of arrhythmia. Proc. Natl. Acad. Sci. USA 110, 10312-10317.
Di Pasquale, E., Lodola, F., Miragoli, M., Denegri, M., Avelino-Cruz, J. E.,Buonocore, M., Nakahama, H., Portararo, P., Bloise, R., Napolitano, C. et al.(2013). CaMKII inhibition rectifies arrhythmic phenotype in a patient-specific modelof catecholaminergic polymorphic ventricular tachycardia. Cell Death Dis. 4, e843.
Galimberti, E. S. and Knollmann, B. C. (2011). Efficacy and potency of class Iantiarrhythmic drugs for suppression of Ca2+ waves in permeabilized myocyteslacking calsequestrin. J. Mol. Cell. Cardiol. 51, 760-768.
Gonzalez, D. R., Beigi, F., Treuer, A. V. andHare, J. M. (2007). Deficient ryanodinereceptor S-nitrosylation increases sarcoplasmic reticulum calcium leak andarrhythmogenesis in cardiomyocytes. Proc. Natl. Acad. Sci. USA 104,20612-20617.
Guatimosim, S., Guatimosim, C. and Song, L.-S. (2011). Imaging calcium sparksin cardiac myocytes. Methods Mol. Biol. 689, 205-214.
Hilliard, F. A., Steele, D. S., Laver, D., Yang, Z., Le Marchand, S. J., Chopra, N.,Piston, D. W., Huke, S. and Knollmann, B. C. (2010). Flecainide inhibitsarrhythmogenic Ca2+ waves by open state block of ryanodine receptor Ca2+release channels and reduction of Ca2+ spark mass. J. Mol. Cell. Cardiol. 48,293-301.
Itzhaki, I., Maizels, L., Huber, I., Gepstein, A., Arbel, G., Caspi, O., Miller, L.,Belhassen, B., Nof, E., Glikson, M. et al. (2012). Modeling of catecholaminergicpolymorphic ventricular tachycardia with patient-specific human-inducedpluripotent stem cells. J. Am. Coll. Cardiol. 60, 990-1000.
938
RESEARCH ARTICLE Disease Models & Mechanisms (2016) 9, 927-939 doi:10.1242/dmm.026823
Disea
seModels&Mechan
isms
Iyer, V., Hajjar, R. J. and Armoundas, A. A. (2007). Mechanisms of abnormalcalcium homeostasis in mutations responsible for catecholaminergic polymorphicventricular tachycardia. Circ. Res. 100, e22-e31.
James, F. W., Kaplan, S., Glueck, C. J., Tsay, J. Y., Knight, M. J. and Sarwar,C. J. (1980). Responses of normal children and young adults to controlled bicycleexercise. Circulation 61, 902-912.
Jha, R., Xu, R.-H. and Xu, C. (2015). Efficient differentiation of cardiomyocytes fromhumanpluripotent stem cells with growth factors.MethodsMol. Biol. 1299, 115-131.
Jiang, D., Xiao, B., Zhang, L. andChen, S. R.W. (2002). Enhanced basal activity ofa cardiac Ca2+ release channel (ryanodine receptor) mutant associated withventricular tachycardia and sudden death. Circ. Res. 91, 218-225.
Jiang, D., Xiao, B., Zhang, L. andChen, S. R.W. (2005). Enhanced store overload-induced Ca2+ release and channel sensitivity to luminal Ca2+ activation arecommon defects of RyR2 mutations linked to ventricular tachycardia and suddendeath. Circ. Res. 97, 1173-1181.
Jiang, D., Chen, W., Wang, R., Zhang, L. and Chen, S. R. W. (2007). Loss ofluminal Ca2+ activation in the cardiac ryanodine receptor is associated withventricular fibrillation and sudden death. Proc. Natl. Acad. Sci. USA 104,18309-18314.
Jung, C. B., Moretti, A., Mederos y Schnitzler, M., Iop, L., Storch, U., Bellin, M.,Dorn, T., Ruppenthal, S., Pfeiffer, S., Goedel, A. et al. (2012). Dantrolenerescues arrhythmogenic RYR2 defect in a patient-specific stem cell model ofcatecholaminergic polymorphic ventricular tachycardia. EMBO Mol. Med. 4,180-191.
Kujala, K., Paavola, J., Lahti, A., Larsson, K., Pekkanen-Mattila, M., Viitasalo,M., Lahtinen, A. M., Toivonen, L., Kontula, K., Swan, H. et al. (2012). Cell modelof catecholaminergic polymorphic ventricular tachycardia reveals early anddelayed afterdepolarizations. PLoS ONE 7, e44660.
Marx, S. O., Gaburjakova, J., Gaburjakova, M., Henrikson, C., Ondrias, K. andMarks, A. R. (2001). Coupled gating between cardiac calcium release channels(ryanodine receptors). Circ. Res. 88, 1151-1158.
Mehta, A., Verma, V., Nandihalli, M., Ramachandra, C. J. A., Sequiera, G. L.,Sudibyo, Y., Chung, Y., Sun, W. and Shim, W. (2014). A systemic evaluation ofcardiac differentiation from mRNA reprogrammed human induced pluripotentstem cells. PLoS ONE 9, e103485.
Miller, J. D., Ganat, Y. M., Kishinevsky, S., Bowman,R. L., Liu, B., Tu, E. Y., Mandal,P. K., Vera, E., Shim, J.-W., Kriks, S. et al. (2013). Human iPSC-based modeling oflate-onset disease via progerin-induced aging. Cell Stem Cell 13, 691-705.
Nakamura, Y., Matsuo, J., Miyamoto, N., Ojima, A., Ando, K., Kanda, Y., Sawada,K., Sugiyama, A. and Sekino, Y. (2014). Assessment of testing methods for drug-induced repolarization delay and arrhythmias in an iPS cell-derived cardiomyocytesheet: multi-site validation study. J. Pharmacol. Sci. 124, 494-501.
Navarrete, E. G., Liang, P., Lan, F., Sanchez-Freire, V., Simmons, C., Gong, T.,Sharma, A., Burridge, P. W., Patlolla, B., Lee, A. S. et al. (2013). Screening drug-induced arrhythmia using human induced pluripotent stem cell-derivedcardiomyocytes and low-impedancemicroelectrode arrays. Circulation 128, S3-S13.
Okita, K., Matsumura, Y., Sato, Y., Okada, A., Morizane, A., Okamoto, S., Hong,H., Nakagawa, M., Tanabe, K., Tezuka, K.-I. et al. (2011). A more efficientmethod to generate integration-free human iPS cells. Nat. Methods 8, 409-412.
Paavola, J., Viitasalo, M., Laitinen-Forsblom, P. J., Pasternack, M., Swan, H.,Tikkanen, I., Toivonen, L., Kontula, K. and Laine, M. (2007). Mutant ryanodinereceptors in catecholaminergic polymorphic ventricular tachycardia generatedelayed afterdepolarizations due to increased propensity to Ca2+ waves. Eur.Heart J. 28, 1135-1142.
Penttinen, K., Swan, H., Vanninen, S., Paavola, J., Lahtinen, A. M., Kontula, K.and Aalto-Setala, K. (2015). Antiarrhythmic effects of dantrolene in patients withcatecholaminergic polymorphic ventricular tachycardia and replication of theresponses using iPSC models. PLoS ONE 10, e0125366.
Picht, E., Zima, A. V., Blatter, L. A. and Bers, D. M. (2007). SparkMaster:automated calcium spark analysis with ImageJ. Am. J. Physiol. Cell Physiol. 293,C1073-C1081.
Priori, S. G. and Napolitano, C. (2005). Cardiac and skeletal muscle disorderscaused by mutations in the intracellular Ca2+ release channels. J. Clin. Invest.115, 2033-2038.
Priori, S. G., Napolitano, C., Tiso, N., Memmi, M., Vignati, G., Bloise, R.,Sorrentino, V. and Danieli, G. A. (2001). Mutations in the cardiac ryanodinereceptor gene (hRyR2) underlie catecholaminergic polymorphic ventriculartachycardia. Circulation 103, 196-200.
Roston, T. M., Vinocur, J. M., Maginot, K. R., Mohammed, S., Salerno, J. C.,Etheridge, S. P., Cohen, M., Hamilton, R. M., Pflaumer, A., Kanter, R. J. et al.(2015). Catecholaminergic polymorphic ventricular tachycardia in children:analysis of therapeutic strategies and outcomes from an internationalmulticenter registry. Circ. Arrhythm. Electrophysiol. 8, 633-642.
Schmittgen, T. D. and Livak, K. J. (2008). Analyzing real-time PCR data by thecomparative CT method. Nat. Protocols 3, 1101-1108.
Shannon, T. R., Ginsburg, K. S. and Bers, D. M. (2002). Quantitative assessmentof the SR Ca2+ leak-load relationship. Circ. Res. 91, 594-600.
Sikkel, M. B., Collins, T. P., Rowlands, C., Shah, M., O’Gara, P., Williams, A. J.,Harding, S. E., Lyon, A. R. and MacLeod, K. T. (2013). Flecainide reducesCa(2+) spark and wave frequency via inhibition of the sarcolemmal sodiumcurrent. Cardiovasc. Res. 98, 286-296.
Sinnecker, D., Goedel, A., Laugwitz, K.-L. and Moretti, A. (2013). Inducedpluripotent stem cell-derived cardiomyocytes: a versatile tool for arrhythmiaresearch. Circ. Res. 112, 961-968.
Smith, G. L. and MacQuaide, N. (2015). The direct actions of flecainide on thehuman cardiac ryanodine receptor: keeping open the debate on themechanism ofaction of local anesthetics in CPVT. Circ. Res. 116, 1284-1286.
Sobie, E. A., Dilly, K. W., dos Santos Cruz, J., Lederer, W. J. and Jafri, M. S.(2002). Termination of cardiac Ca(2+) sparks: an investigative mathematicalmodel of calcium-induced calcium release. Biophys. J. 83, 59-78.
Su, E. J., Downing, T. and Li, S. (2012). Changes in adult fibroblast populationswith passaging reduce reprogramming efficiency. FASEB J. 26, 913.911.
Thomas, N. L., Maxwell, C., Mukherjee, S. andWilliams, A. J. (2010). Ryanodinereceptor mutations in arrhythmia: the continuing mystery of channel dysfunction.FEBS Lett. 584, 2153-2160.
van der Werf, C., Kannankeril, P. J., Sacher, F., Krahn, A. D., Viskin, S.,Leenhardt, A., Shimizu, W., Sumitomo, N., Fish, F. A., Bhuiyan, Z. A. et al.(2011). Flecainide therapy reduces exercise-induced ventricular arrhythmias inpatients with catecholaminergic polymorphic ventricular tachycardia. J. Am. Coll.Cardiol. 57, 2244-2254.
Watanabe, H., Chopra, N., Laver, D., Hwang, H. S., Davies, S. S., Roach, D. E.,Duff, H. J., Roden, D. M., Wilde, A. A. M. and Knollmann, B. C. (2009).Flecainide prevents catecholaminergic polymorphic ventricular tachycardia inmice and humans. Nat. Med. 15, 380-383.
Weiss, J. N., Nivala, M., Garfinkel, A. and Qu, Z. (2011). Alternans andarrhythmias: from cell to heart. Circ. Res. 108, 98-112.
Wilson, K. D. and Wu, J. C. (2015). Induced pluripotent stem cells. JAMA 313,1613-1614.
Xu, C., Inokuma, M. S., Denham, J., Golds, K., Kundu, P., Gold, J. D. andCarpenter, M. K. (2001). Feeder-free growth of undifferentiated humanembryonic stem cells. Nat. Biotechnol. 19, 971-974.
Yang, X., Pabon, L. and Murry, C. E. (2014). Engineering adolescence: maturationof human pluripotent stem cell-derived cardiomyocytes. Circ. Res. 114, 511-523.
Zhang, X.-H., Haviland, S., Wei, H., Saric, T., Fatima, A., Hescheler, J.,Cleemann, L. and Morad, M. (2013). Ca2+ signaling in human inducedpluripotent stem cell-derived cardiomyocytes (iPS-CM) from normal andcatecholaminergic polymorphic ventricular tachycardia (CPVT)-afflictedsubjects. Cell Calcium 54, 57-70.
Zhao, Y.-T., Valdivia, C. R., Gurrola, G. B., Powers, P. P., Willis, B. C., Moss, R. L.and Jalife, J. (2015). Arrhythmogenesis in a catecholaminergic polymorphicventricular tachycardia mutation that depresses ryanodine receptor function.Proc. Natl. Acad. Sci. USA 112, E1669-E1677.
939
RESEARCH ARTICLE Disease Models & Mechanisms (2016) 9, 927-939 doi:10.1242/dmm.026823
Disea
seModels&Mechan
isms
Disease Models & Mechanisms 9: doi:10.1242/dmm.026823: Supplementary information
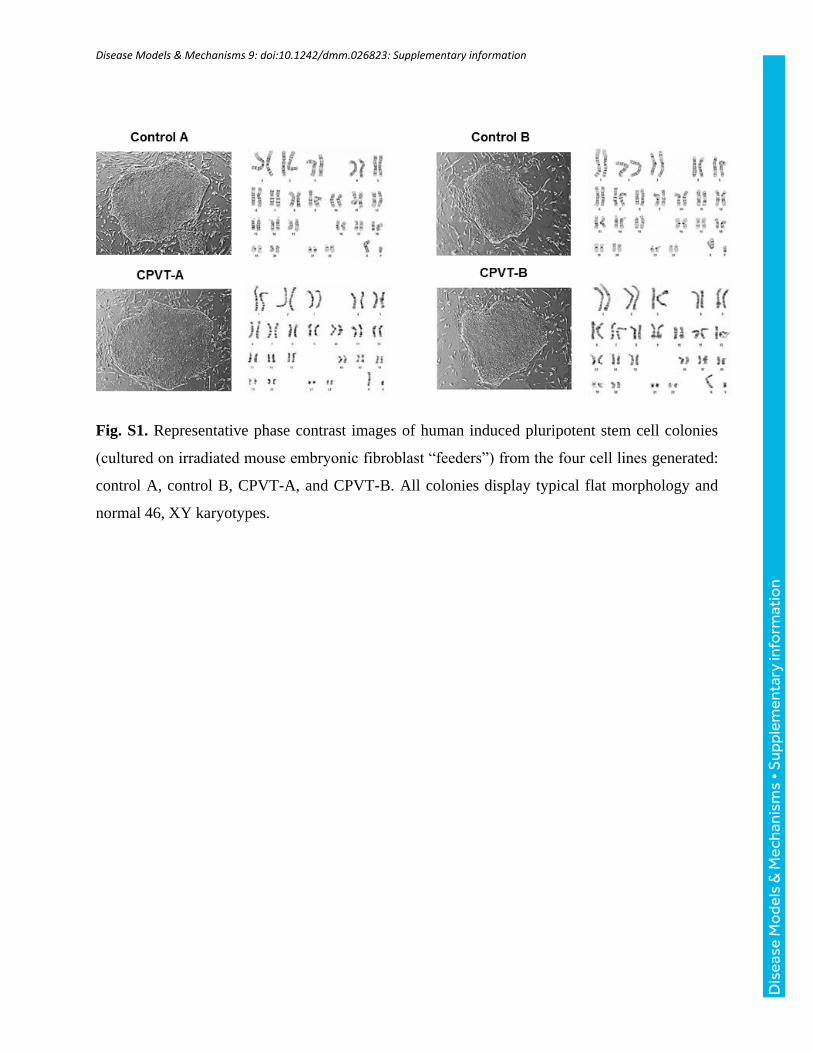
Fig. S1. Representative phase contrast images of human induced pluripotent stem cell colonies
(cultured on irradiated mouse embryonic fibroblast “feeders”) from the four cell lines generated:
control A, control B, CPVT-A, and CPVT-B. All colonies display typical flat morphology and
normal 46, XY karyotypes.
Dis
ease
Mo
dels
& M
echa
nism
s •
Sup
plem
enta
ry in
form
atio
n
Disease Models & Mechanisms 9: doi:10.1242/dmm.026823: Supplementary information
Fig. S2. Diagram to assist interpretation of Ca2+ transient and SR Ca2+ leak/load formulas.
Dis
ease
Mo
dels
& M
echa
nism
s •
Sup
plem
enta
ry in
form
atio
n
Disease Models & Mechanisms 9: doi:10.1242/dmm.026823: Supplementary information
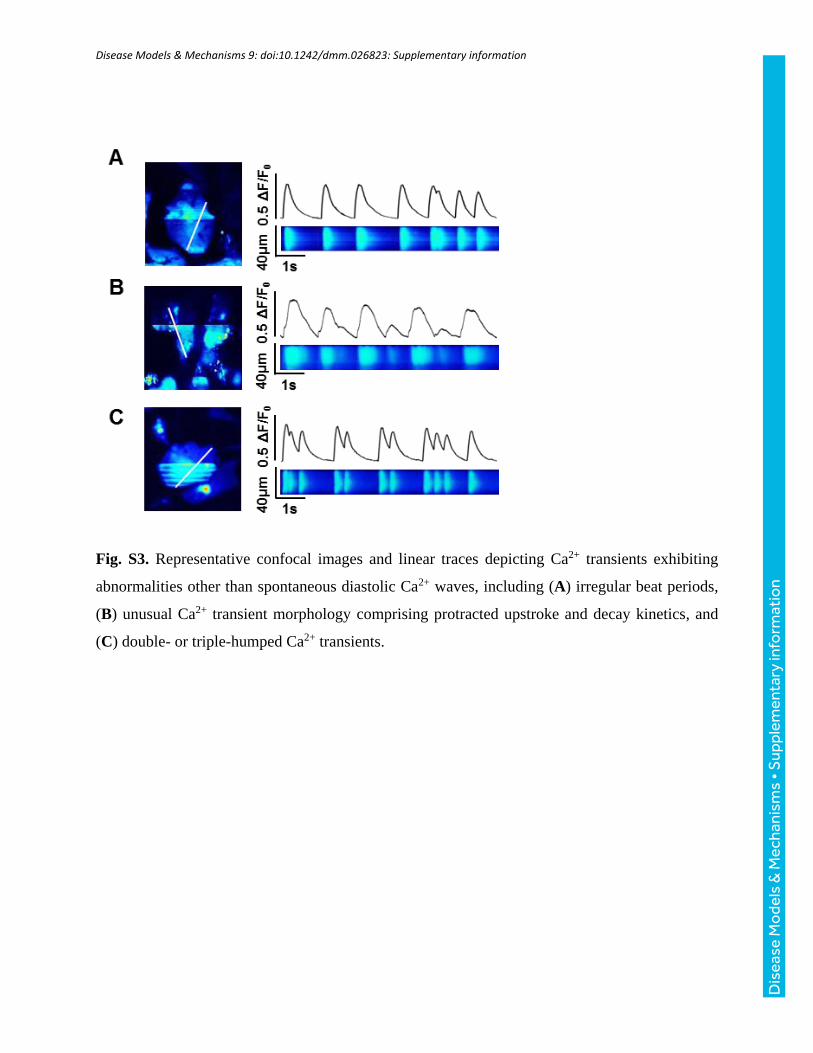
Fig. S3. Representative confocal images and linear traces depicting Ca2+ transients exhibiting
abnormalities other than spontaneous diastolic Ca2+ waves, including (A) irregular beat periods,
(B) unusual Ca2+ transient morphology comprising protracted upstroke and decay kinetics, and
(C) double- or triple-humped Ca2+ transients.
Dis
ease
Mo
dels
& M
echa
nism
s •
Sup
plem
enta
ry in
form
atio
n
Disease Models & Mechanisms 9: doi:10.1242/dmm.026823: Supplementary information
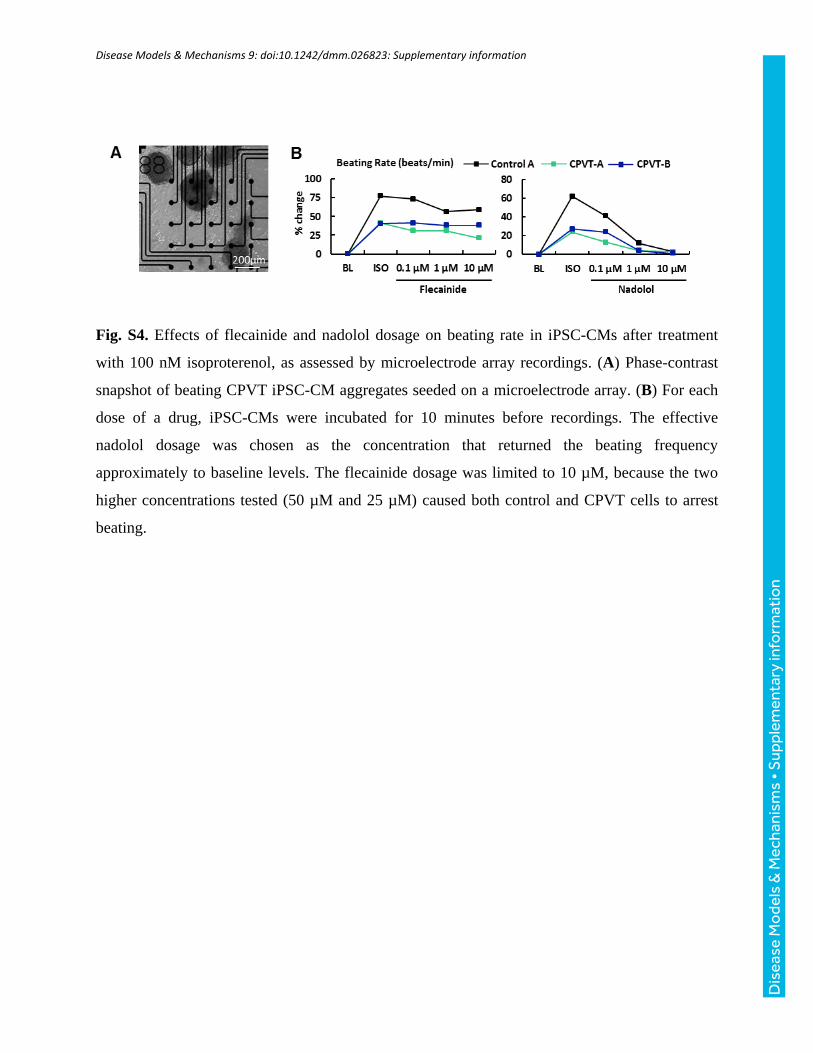
Fig. S4. Effects of flecainide and nadolol dosage on beating rate in iPSC-CMs after treatment
with 100 nM isoproterenol, as assessed by microelectrode array recordings. (A) Phase-contrast
snapshot of beating CPVT iPSC-CM aggregates seeded on a microelectrode array. (B) For each
dose of a drug, iPSC-CMs were incubated for 10 minutes before recordings. The effective
nadolol dosage was chosen as the concentration that returned the beating frequency
approximately to baseline levels. The flecainide dosage was limited to 10 µM, because the two
higher concentrations tested (50 µM and 25 µM) caused both control and CPVT cells to arrest
beating.
Dis
ease
Mo
dels
& M
echa
nism
s •
Sup
plem
enta
ry in
form
atio
n
Disease Models & Mechanisms 9: doi:10.1242/dmm.026823: Supplementary information
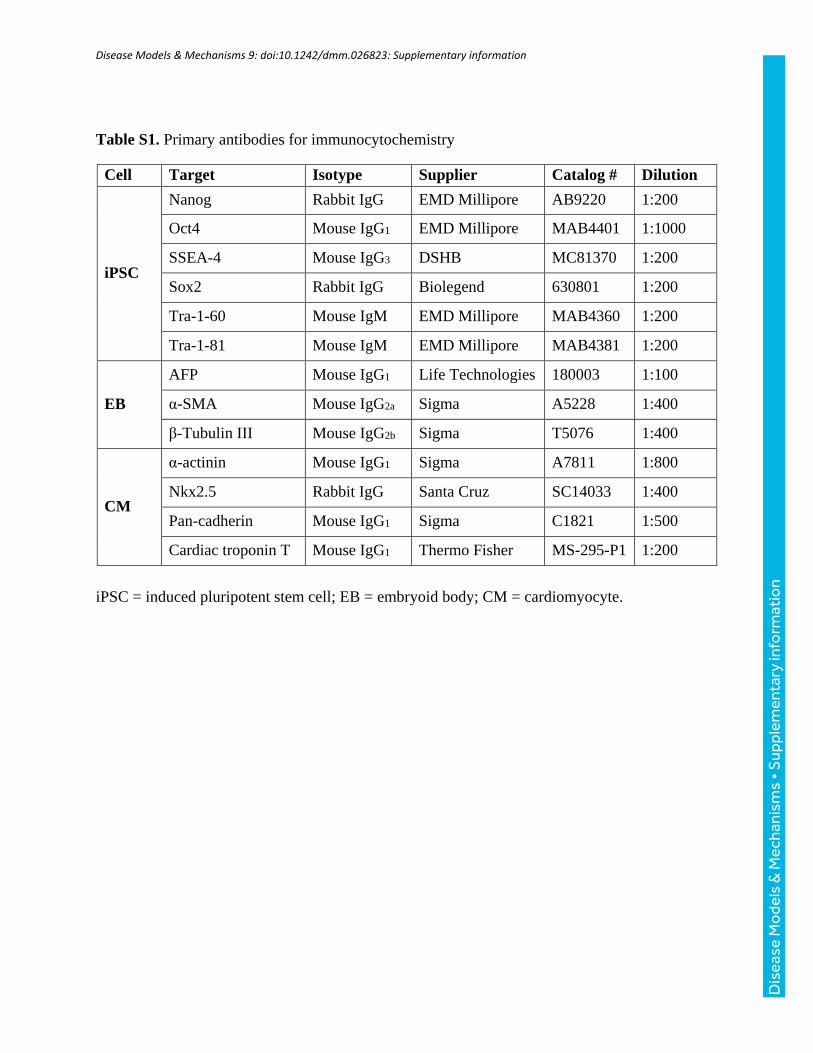
Table S1. Primary antibodies for immunocytochemistry
Cell Target Isotype Supplier Catalog # Dilution
iPSC
Nanog Rabbit IgG EMD Millipore AB9220 1:200
Oct4 Mouse IgG1 EMD Millipore MAB4401 1:1000
SSEA-4 Mouse IgG3 DSHB MC81370 1:200
Sox2 Rabbit IgG Biolegend 630801 1:200
Tra-1-60 Mouse IgM EMD Millipore MAB4360 1:200
Tra-1-81 Mouse IgM EMD Millipore MAB4381 1:200
EB
AFP Mouse IgG1 Life Technologies 180003 1:100
α-SMA Mouse IgG2a Sigma A5228 1:400
β-Tubulin III Mouse IgG2b Sigma T5076 1:400
CM
α-actinin Mouse IgG1 Sigma A7811 1:800
Nkx2.5 Rabbit IgG Santa Cruz SC14033 1:400
Pan-cadherin Mouse IgG1 Sigma C1821 1:500
Cardiac troponin T Mouse IgG1 Thermo Fisher MS-295-P1 1:200
iPSC = induced pluripotent stem cell; EB = embryoid body; CM = cardiomyocyte.
Dis
ease
Mo
dels
& M
echa
nism
s •
Sup
plem
enta
ry in
form
atio
n
Disease Models & Mechanisms 9: doi:10.1242/dmm.026823: Supplementary information
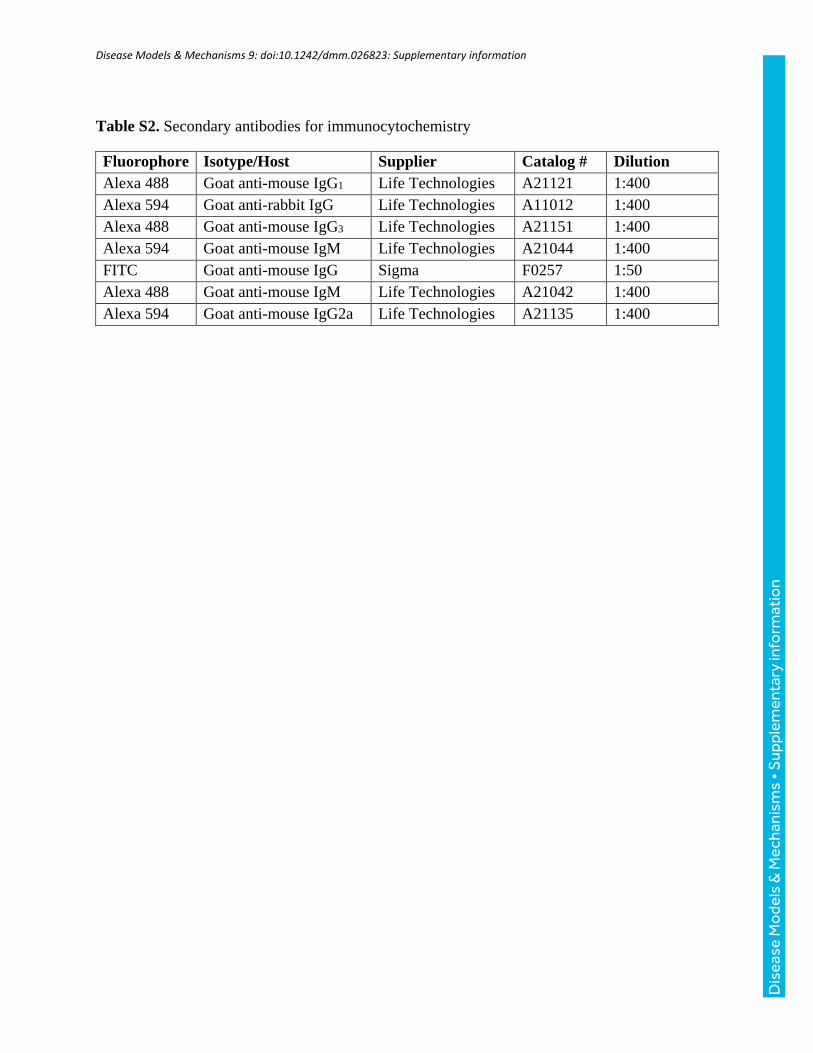
Table S2. Secondary antibodies for immunocytochemistry
Fluorophore Isotype/Host Supplier Catalog # Dilution
Alexa 488 Goat anti-mouse IgG1 Life Technologies A21121 1:400
Alexa 594 Goat anti-rabbit IgG Life Technologies A11012 1:400
Alexa 488 Goat anti-mouse IgG3 Life Technologies A21151 1:400
Alexa 594 Goat anti-mouse IgM Life Technologies A21044 1:400
FITC Goat anti-mouse IgG Sigma F0257 1:50
Alexa 488 Goat anti-mouse IgM Life Technologies A21042 1:400
Alexa 594 Goat anti-mouse IgG2a Life Technologies A21135 1:400
Dis
ease
Mo
dels
& M
echa
nism
s •
Sup
plem
enta
ry in
form
atio
n
Disease Models & Mechanisms 9: doi:10.1242/dmm.026823: Supplementary information
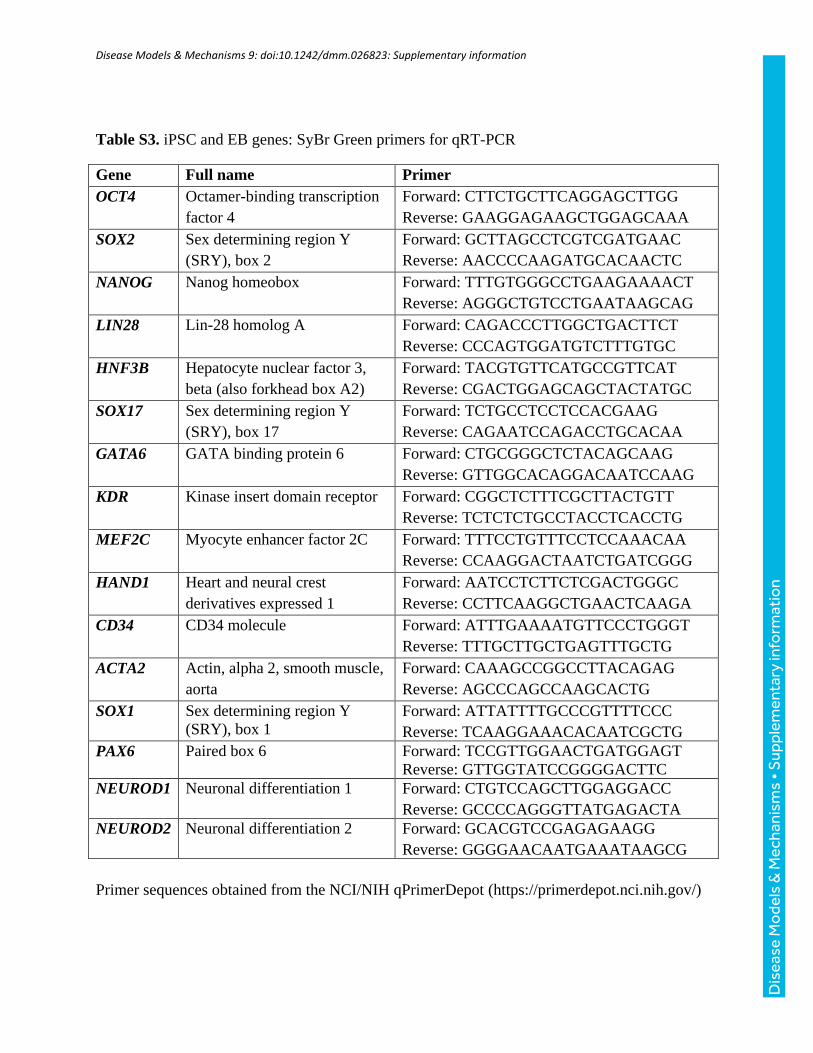
Table S3. iPSC and EB genes: SyBr Green primers for qRT-PCR
Gene Full name Primer
OCT4 Octamer-binding transcription
factor 4
Forward: CTTCTGCTTCAGGAGCTTGG
Reverse: GAAGGAGAAGCTGGAGCAAA
SOX2 Sex determining region Y
(SRY), box 2
Forward: GCTTAGCCTCGTCGATGAAC
Reverse: AACCCCAAGATGCACAACTC
NANOG Nanog homeobox Forward: TTTGTGGGCCTGAAGAAAACT
Reverse: AGGGCTGTCCTGAATAAGCAG
LIN28 Lin-28 homolog A Forward: CAGACCCTTGGCTGACTTCT
Reverse: CCCAGTGGATGTCTTTGTGC
HNF3B Hepatocyte nuclear factor 3,
beta (also forkhead box A2)
Forward: TACGTGTTCATGCCGTTCAT
Reverse: CGACTGGAGCAGCTACTATGC
SOX17 Sex determining region Y
(SRY), box 17
Forward: TCTGCCTCCTCCACGAAG
Reverse: CAGAATCCAGACCTGCACAA
GATA6 GATA binding protein 6 Forward: CTGCGGGCTCTACAGCAAG
Reverse: GTTGGCACAGGACAATCCAAG
KDR Kinase insert domain receptor Forward: CGGCTCTTTCGCTTACTGTT
Reverse: TCTCTCTGCCTACCTCACCTG
MEF2C Myocyte enhancer factor 2C Forward: TTTCCTGTTTCCTCCAAACAA
Reverse: CCAAGGACTAATCTGATCGGG
HAND1 Heart and neural crest
derivatives expressed 1
Forward: AATCCTCTTCTCGACTGGGC
Reverse: CCTTCAAGGCTGAACTCAAGA
CD34 CD34 molecule Forward: ATTTGAAAATGTTCCCTGGGT
Reverse: TTTGCTTGCTGAGTTTGCTG
ACTA2 Actin, alpha 2, smooth muscle,
aorta
Forward: CAAAGCCGGCCTTACAGAG
Reverse: AGCCCAGCCAAGCACTG
SOX1 Sex determining region Y
(SRY), box 1
Forward: ATTATTTTGCCCGTTTTCCC
Reverse: TCAAGGAAACACAATCGCTG
PAX6 Paired box 6 Forward: TCCGTTGGAACTGATGGAGT
Reverse: GTTGGTATCCGGGGACTTC
NEUROD1 Neuronal differentiation 1 Forward: CTGTCCAGCTTGGAGGACC
Reverse: GCCCCAGGGTTATGAGACTA
NEUROD2 Neuronal differentiation 2 Forward: GCACGTCCGAGAGAAGG
Reverse: GGGGAACAATGAAATAAGCG
Primer sequences obtained from the NCI/NIH qPrimerDepot (https://primerdepot.nci.nih.gov/)
Dis
ease
Mo
dels
& M
echa
nism
s •
Sup
plem
enta
ry in
form
atio
n
Disease Models & Mechanisms 9: doi:10.1242/dmm.026823: Supplementary information
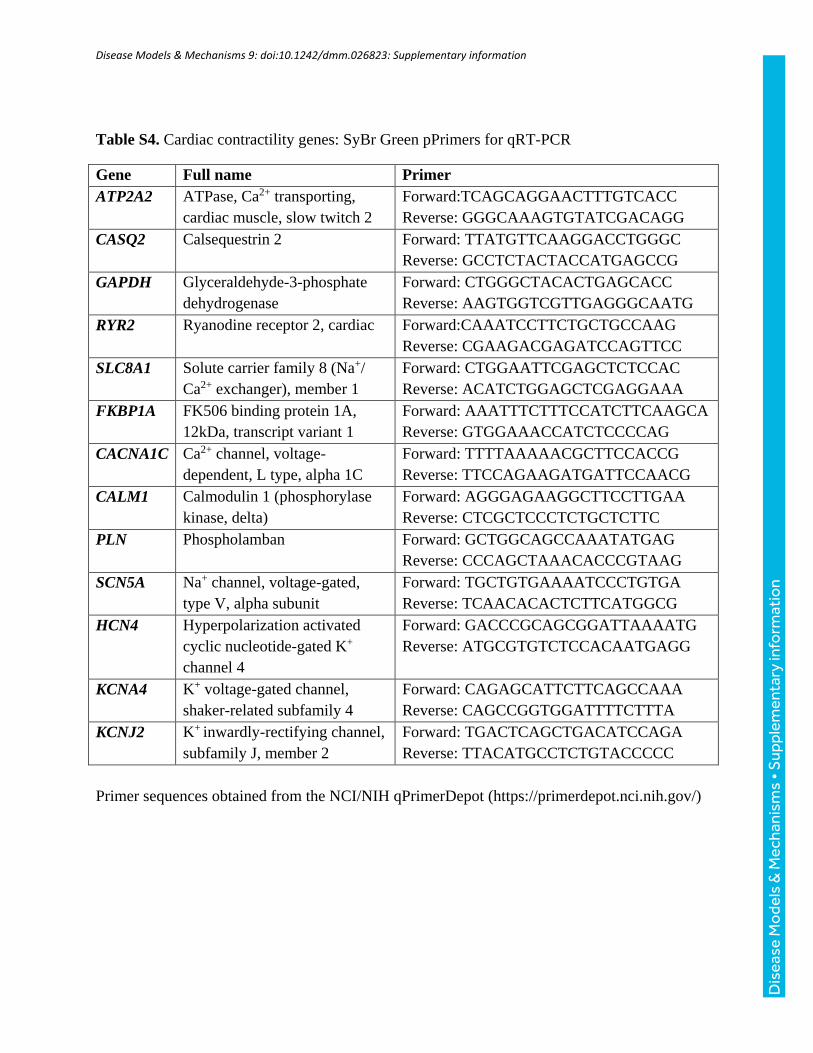
Table S4. Cardiac contractility genes: SyBr Green pPrimers for qRT-PCR
Gene Full name Primer
ATP2A2 ATPase, Ca2+ transporting,
cardiac muscle, slow twitch 2
Forward:TCAGCAGGAACTTTGTCACC
Reverse: GGGCAAAGTGTATCGACAGG
CASQ2 Calsequestrin 2 Forward: TTATGTTCAAGGACCTGGGC
Reverse: GCCTCTACTACCATGAGCCG
GAPDH Glyceraldehyde-3-phosphate
dehydrogenase
Forward: CTGGGCTACACTGAGCACC
Reverse: AAGTGGTCGTTGAGGGCAATG
RYR2 Ryanodine receptor 2, cardiac Forward:CAAATCCTTCTGCTGCCAAG
Reverse: CGAAGACGAGATCCAGTTCC
SLC8A1 Solute carrier family 8 (Na+/
Ca2+ exchanger), member 1
Forward: CTGGAATTCGAGCTCTCCAC
Reverse: ACATCTGGAGCTCGAGGAAA
FKBP1A FK506 binding protein 1A,
12kDa, transcript variant 1
Forward: AAATTTCTTTCCATCTTCAAGCA
Reverse: GTGGAAACCATCTCCCCAG
CACNA1C Ca2+ channel, voltage-
dependent, L type, alpha 1C
Forward: TTTTAAAAACGCTTCCACCG
Reverse: TTCCAGAAGATGATTCCAACG
CALM1 Calmodulin 1 (phosphorylase
kinase, delta)
Forward: AGGGAGAAGGCTTCCTTGAA
Reverse: CTCGCTCCCTCTGCTCTTC
PLN Phospholamban Forward: GCTGGCAGCCAAATATGAG
Reverse: CCCAGCTAAACACCCGTAAG
SCN5A Na+ channel, voltage-gated,
type V, alpha subunit
Forward: TGCTGTGAAAATCCCTGTGA
Reverse: TCAACACACTCTTCATGGCG
HCN4 Hyperpolarization activated
cyclic nucleotide-gated K+
channel 4
Forward: GACCCGCAGCGGATTAAAATG
Reverse: ATGCGTGTCTCCACAATGAGG
KCNA4 K+ voltage-gated channel,
shaker-related subfamily 4
Forward: CAGAGCATTCTTCAGCCAAA
Reverse: CAGCCGGTGGATTTTCTTTA
KCNJ2 K+ inwardly-rectifying channel,
subfamily J, member 2
Forward: TGACTCAGCTGACATCCAGA
Reverse: TTACATGCCTCTGTACCCCC
Primer sequences obtained from the NCI/NIH qPrimerDepot (https://primerdepot.nci.nih.gov/)
Dis
ease
Mo
dels
& M
echa
nism
s •
Sup
plem
enta
ry in
form
atio
n