Embed Size (px)
Citation preview
A Hybrid System That Supports Public Reporting in Pennsylvania
RS Johannes, MD, MSCardinal HealthJune 19, 2007
2
© 2007 Cardinal Health, Inc.or one of its subsidiaries. All rights reserved.
Serendipity & History• In the mid 1980s, three people met
– Dr. Allen Brewster, MediQual Founder– Dr. Donald Fetterolf, Highmark BC/BS– Ernie Sessa, NAHDO founder, 1st Exec Dir PHC4
• They all shared a single belief, namely that the precision and face validity of risk adjustment depended upon use of clinical data beyond claims data
• Pennsylvania Health Care Cost Countainment Council– Only state to perform uninterrupted annual public reporting of
hospital performance data for 20 years– Pennsylvania publicly reports 50+ diseases– Cardinal Health has provided the data collection and risk
adjustment methods over the entire period.
3
© 2007 Cardinal Health, Inc.or one of its subsidiaries. All rights reserved.
Four important themes
• Timing of clinical data is important to admission based severity stratification
• Laboratory data is both objective and powerful as a predictor
• Laboratory data is electronically available• The face value of clinical data should not be
underestimated
4
© 2007 Cardinal Health, Inc.or one of its subsidiaries. All rights reserved.
Clinical data and timing• Provides for models that can better identify risk in the
peri-admission period.– Frees the models from the criticism that late hospital stay
events are used for adjustment– Better separation of comorbidities from complications– Position upheld by other published studies
• Is Admission (POA) coding the solution?– In order to add a POA flag, the code must first be present– How might this work in a situation such as hyponatremia?
5
© 2007 Cardinal Health, Inc.or one of its subsidiaries. All rights reserved.
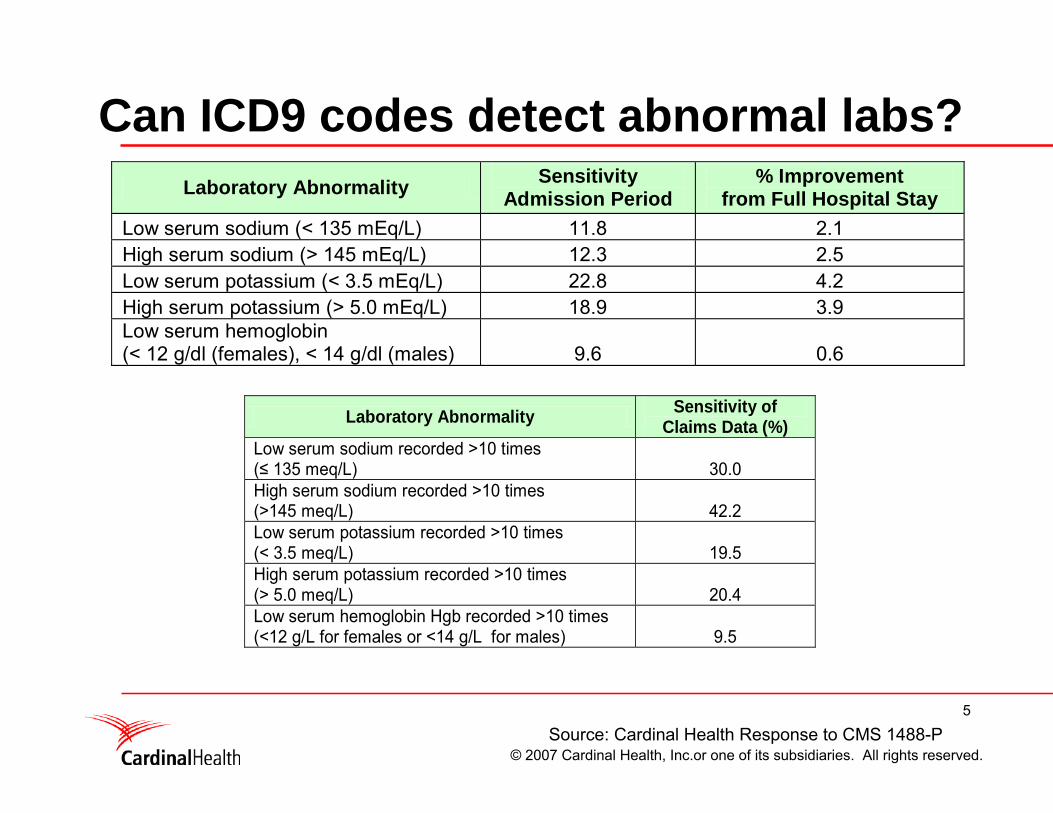
Can ICD9 codes detect abnormal labs?Laboratory Abnormality Sensitivity
Admission Period % Improvement
from Full Hospital Stay Low serum sodium (< 135 mEq/L) 11.8 2.1 High serum sodium (> 145 mEq/L) 12.3 2.5 Low serum potassium (< 3.5 mEq/L) 22.8 4.2 High serum potassium (> 5.0 mEq/L) 18.9 3.9 Low serum hemoglobin (< 12 g/dl (females), < 14 g/dl (males) 9.6 0.6
Laboratory Abnormality Sensitivity of
Claims Data (%) Low serum sodium recorded >10 times (≤ 135 meq/L) 30.0 High serum sodium recorded >10 times (>145 meq/L) 42.2 Low serum potassium recorded >10 times (< 3.5 meq/L) 19.5 High serum potassium recorded >10 times (> 5.0 meq/L) 20.4 Low serum hemoglobin Hgb recorded >10 times (<12 g/L for females or <14 g/L for males) 9.5
Source: Cardinal Health Response to CMS 1488-P
6
© 2007 Cardinal Health, Inc.or one of its subsidiaries. All rights reserved.
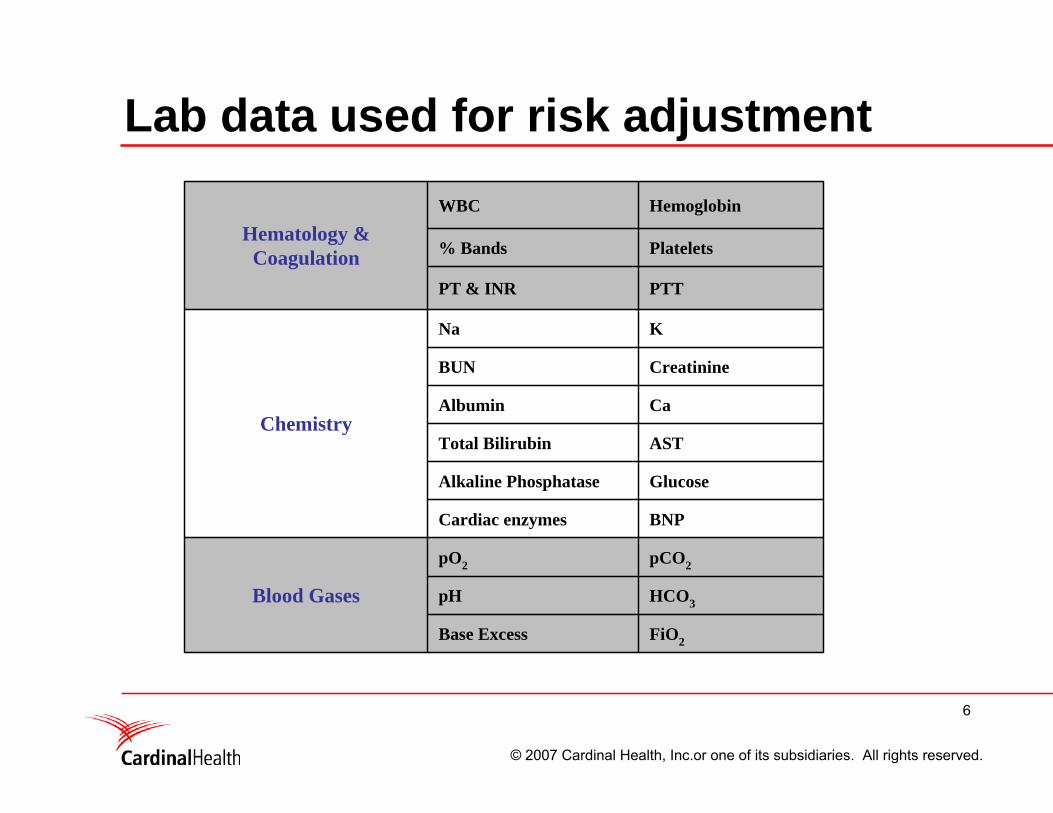
Lab data used for risk adjustment
FiO2Base Excess
HCO3pH
pCO2pO2
Blood Gases
BNPCardiac enzymes
GlucoseAlkaline Phosphatase
ASTTotal Bilirubin
CaAlbumin
CreatinineBUN
KNa
Chemistry
PTTPT & INR
Platelets% Bands
HemoglobinWBC
Hematology &Coagulation
7
© 2007 Cardinal Health, Inc.or one of its subsidiaries. All rights reserved.
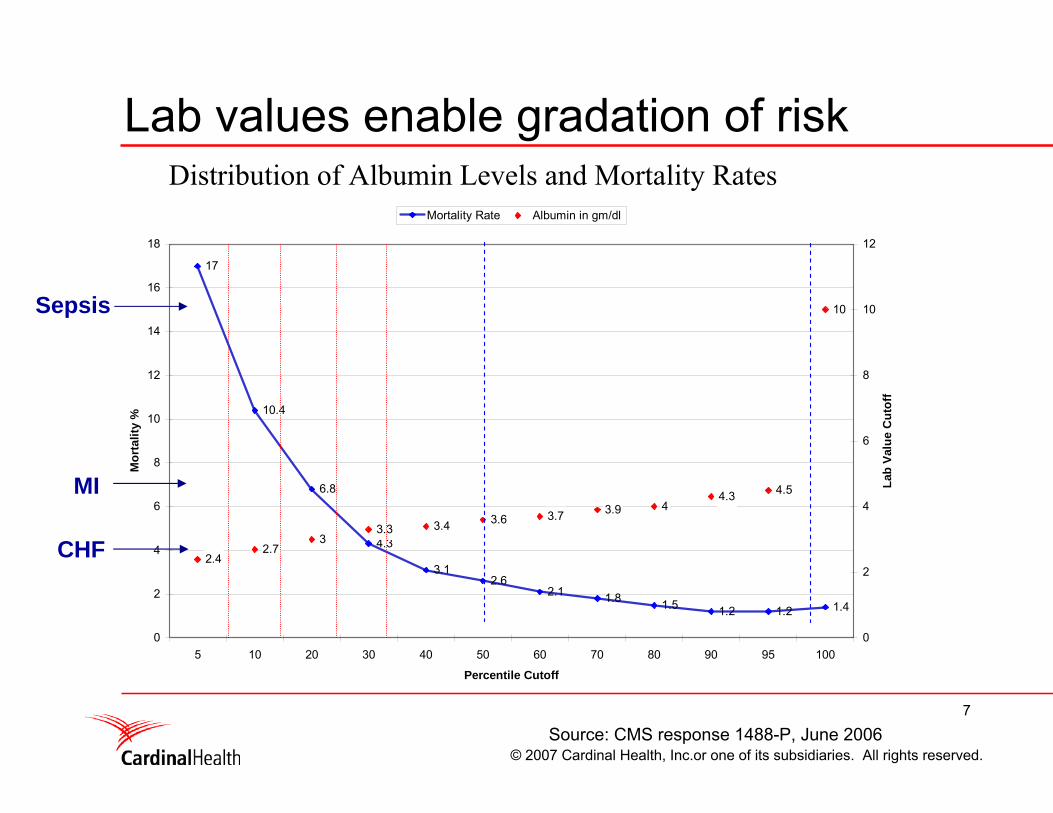
Lab values enable gradation of riskMortality Risk & Serum Albumin
17
10.4
6.8
4.3
3.12.6
2.1 1.8 1.5 1.2 1.2 1.4
2.42.7
33.3 3.4 3.6 3.7 3.9 4
4.3 4.5
10
0
2
4
6
8
10
12
14
16
18
5 10 20 30 40 50 60 70 80 90 95 100
Percentile Cutoff
Mor
talit
y %
0
2
4
6
8
10
12
Lab
Valu
e C
utof
f
Mortality Rate Albumin in gm/dl
CHF
MI
Sepsis
Source: CMS response 1488-P, June 2006
Distribution of Albumin Levels and Mortality Rates
8
© 2007 Cardinal Health, Inc.or one of its subsidiaries. All rights reserved.
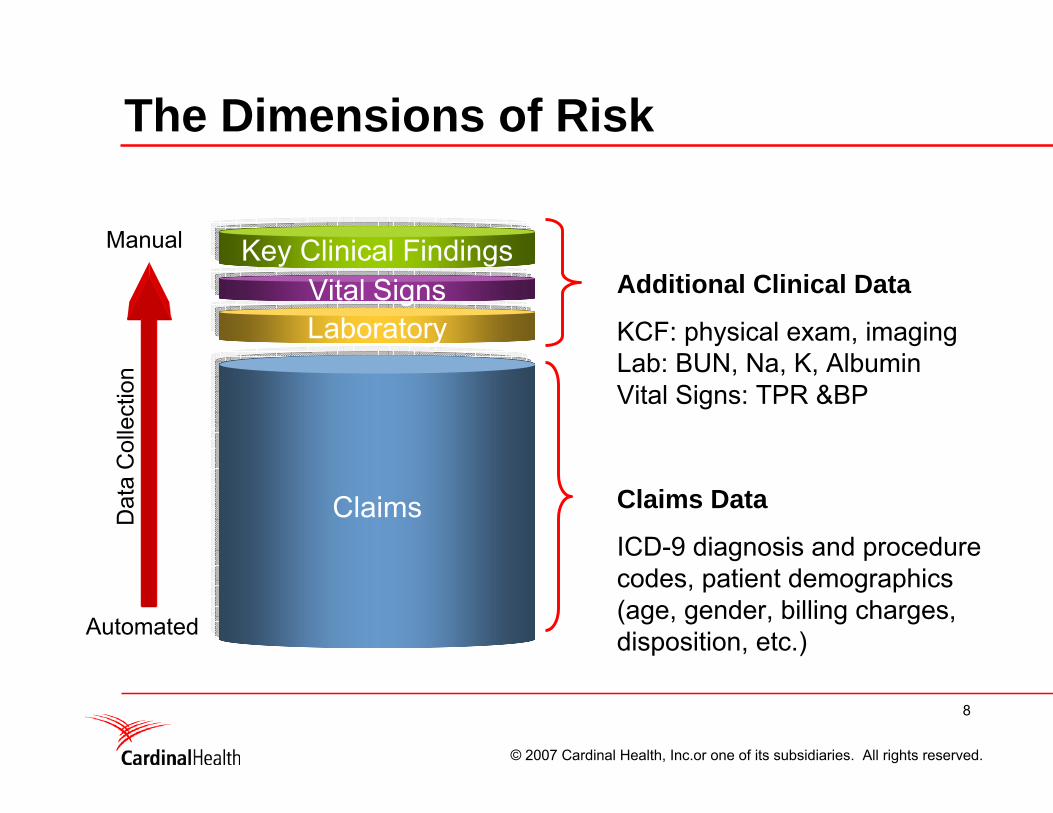
The Dimensions of Risk
Claims
LaboratoryVital Signs
Key Clinical FindingsAdditional Clinical Data
KCF: physical exam, imagingLab: BUN, Na, K, AlbuminVital Signs: TPR &BP
Claims Data
ICD-9 diagnosis and procedure codes, patient demographics (age, gender, billing charges, disposition, etc.)
Manual
Automated
Dat
a C
olle
ctio
n
9
© 2007 Cardinal Health, Inc.or one of its subsidiaries. All rights reserved.
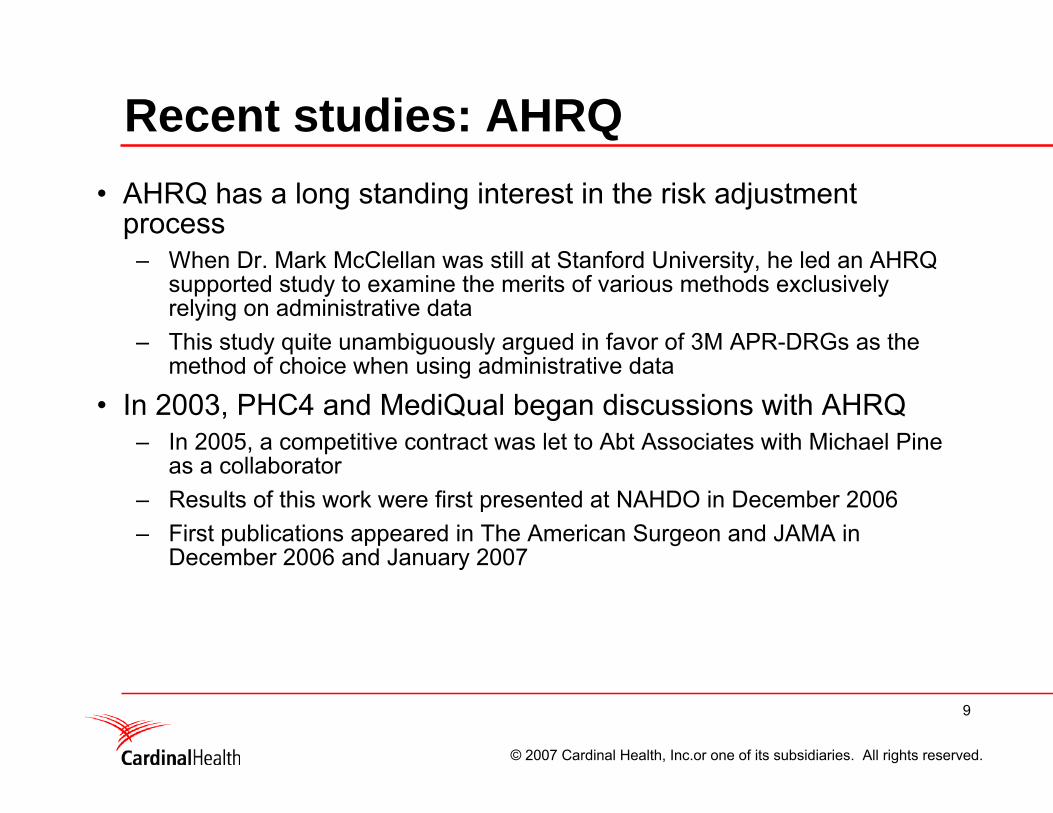
Recent studies: AHRQ• AHRQ has a long standing interest in the risk adjustment
process– When Dr. Mark McClellan was still at Stanford University, he led an AHRQ
supported study to examine the merits of various methods exclusively relying on administrative data
– This study quite unambiguously argued in favor of 3M APR-DRGs as the method of choice when using administrative data
• In 2003, PHC4 and MediQual began discussions with AHRQ– In 2005, a competitive contract was let to Abt Associates with Michael Pine
as a collaborator– Results of this work were first presented at NAHDO in December 2006– First publications appeared in The American Surgeon and JAMA in
December 2006 and January 2007
10
© 2007 Cardinal Health, Inc.or one of its subsidiaries. All rights reserved.
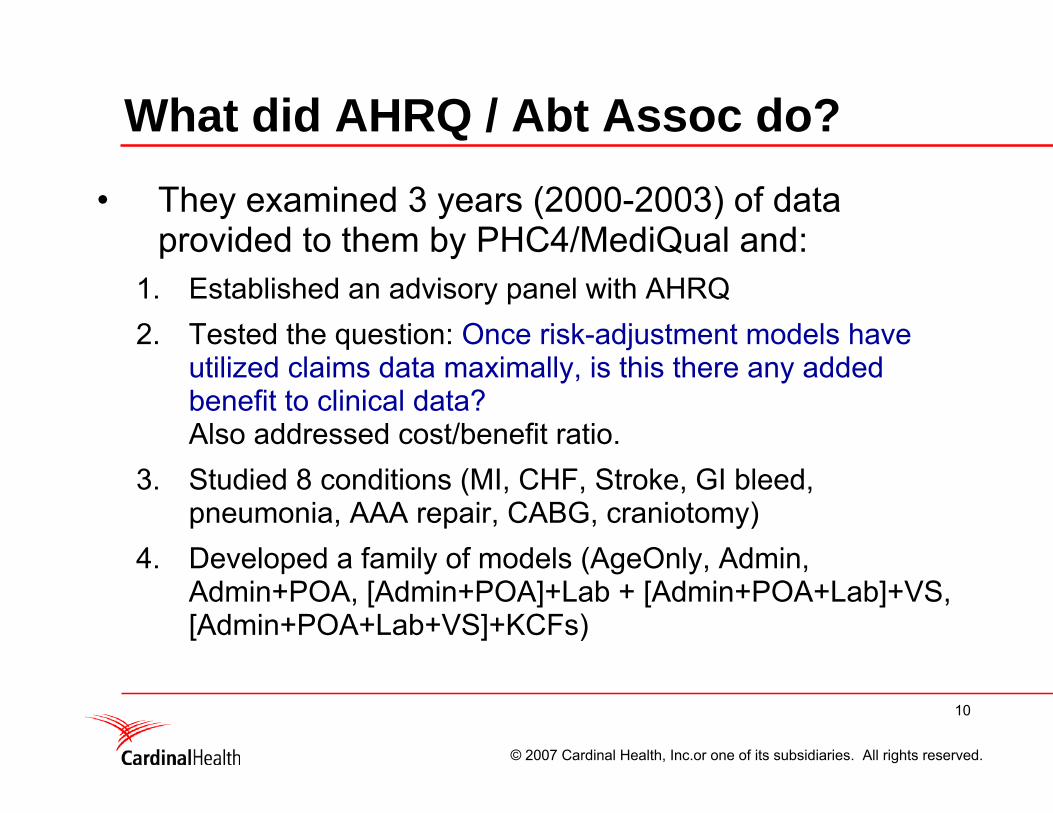
What did AHRQ / Abt Assoc do?• They examined 3 years (2000-2003) of data
provided to them by PHC4/MediQual and:1. Established an advisory panel with AHRQ2. Tested the question: Once risk-adjustment models have
utilized claims data maximally, is this there any added benefit to clinical data?Also addressed cost/benefit ratio.
3. Studied 8 conditions (MI, CHF, Stroke, GI bleed, pneumonia, AAA repair, CABG, craniotomy)
4. Developed a family of models (AgeOnly, Admin, Admin+POA, [Admin+POA]+Lab + [Admin+POA+Lab]+VS, [Admin+POA+Lab+VS]+KCFs)
11
© 2007 Cardinal Health, Inc.or one of its subsidiaries. All rights reserved.
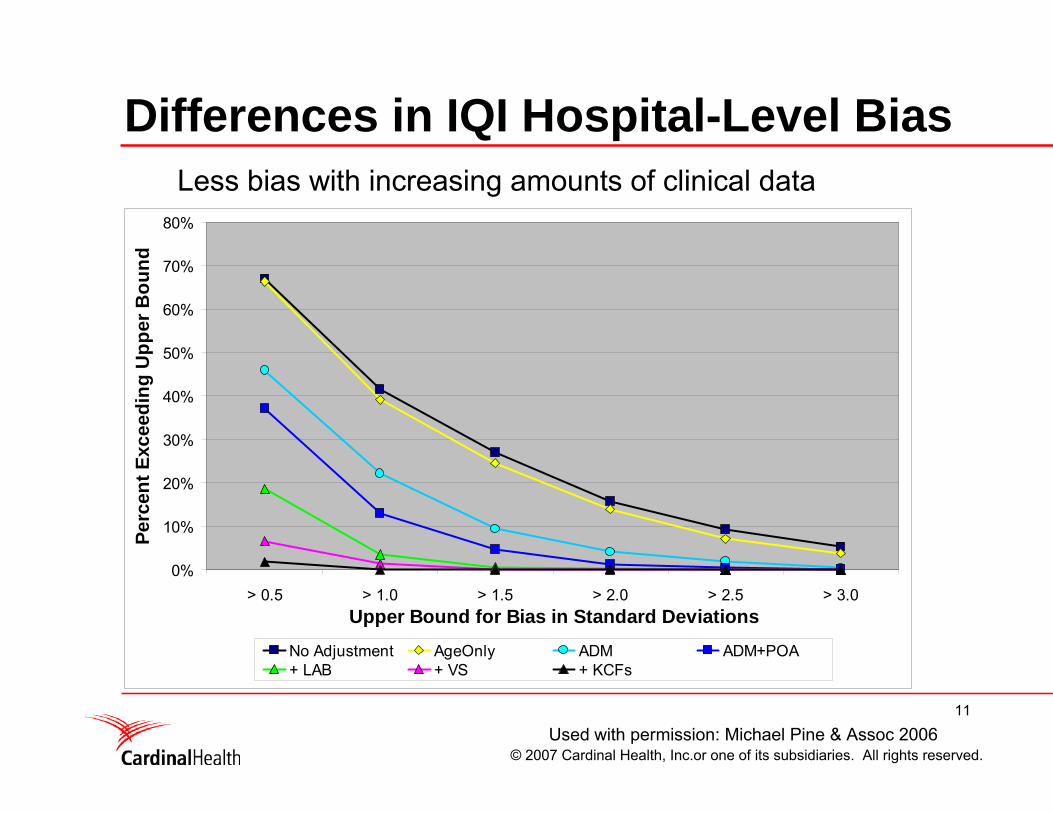
Differences in IQI Hospital-Level Bias
0%
10%
20%
30%
40%
50%
60%
70%
80%
> 0.5 > 1.0 > 1.5 > 2.0 > 2.5 > 3.0Upper Bound for Bias in Standard Deviations
Perc
ent E
xcee
ding
Upp
er B
ound
No Adjustment AgeOnly ADM ADM+POA+ LAB + VS + KCFs
Used with permission: Michael Pine & Assoc 2006
Less bias with increasing amounts of clinical data
12
© 2007 Cardinal Health, Inc.or one of its subsidiaries. All rights reserved.
Recent studies: Cardinal Health• Examined 3 years of data from 2000-2003 but
divided the population into those hospitals that collected data electronically from those that did not.
• Tested the question: What are the relative merits of the types of data used for risk adjustment?
• Studied 6 conditions: (ischemic and hemorrhagic stroke, pneumonia, MI, CHF, and septicemia)
• This study has been accepted to Medical Care(Using Automated Clinical Data for Risk Adjustment: Development and Validation of Six Disease-Specific Mortality Predictive Models for Pay-For-Performance. Ying P Tabak, RS Johannes, Jeffrey H Silber)
13
© 2007 Cardinal Health, Inc.or one of its subsidiaries. All rights reserved.
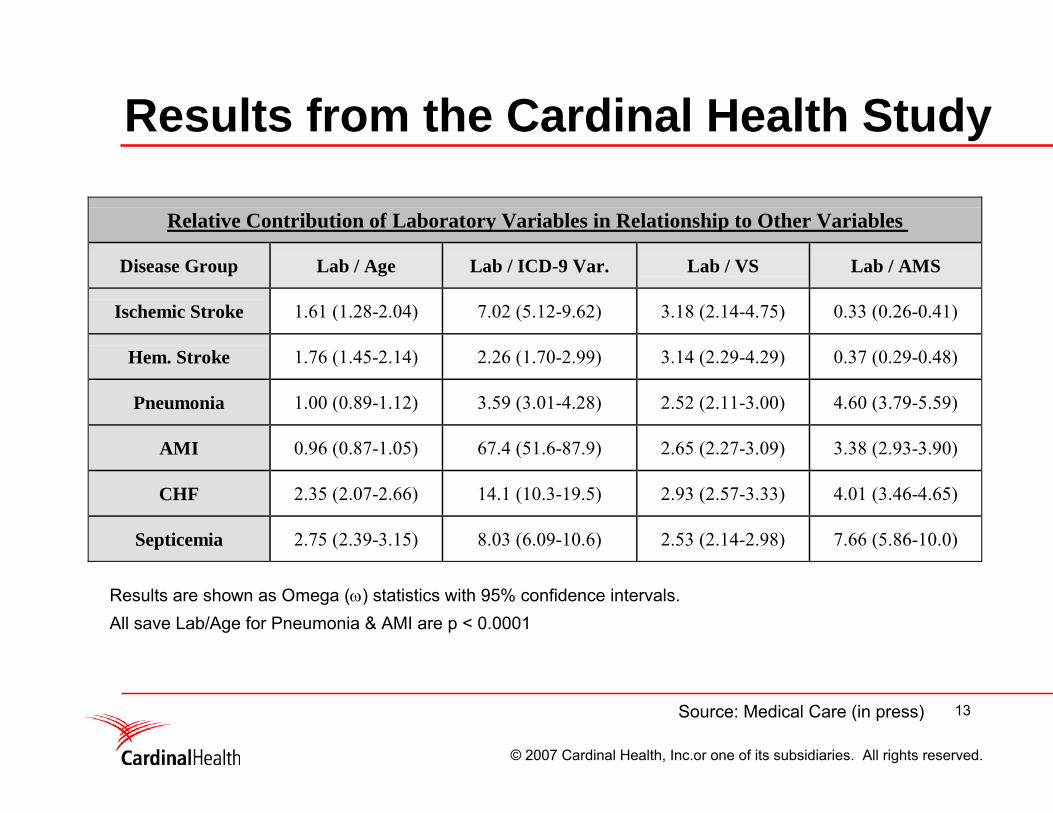
Results from the Cardinal Health Study
Relative Contribution of Laboratory Variables in Relationship to Other Variables
Disease Group Lab / Age Lab / ICD-9 Var. Lab / VS Lab / AMS
Ischemic Stroke 1.61 (1.28-2.04) 7.02 (5.12-9.62) 3.18 (2.14-4.75) 0.33 (0.26-0.41)
Hem. Stroke 1.76 (1.45-2.14) 2.26 (1.70-2.99) 3.14 (2.29-4.29) 0.37 (0.29-0.48)
Pneumonia 1.00 (0.89-1.12) 3.59 (3.01-4.28) 2.52 (2.11-3.00) 4.60 (3.79-5.59)
AMI 0.96 (0.87-1.05) 67.4 (51.6-87.9) 2.65 (2.27-3.09) 3.38 (2.93-3.90)
CHF 2.35 (2.07-2.66) 14.1 (10.3-19.5) 2.93 (2.57-3.33) 4.01 (3.46-4.65)
Septicemia 2.75 (2.39-3.15) 8.03 (6.09-10.6) 2.53 (2.14-2.98) 7.66 (5.86-10.0)
Source: Medical Care (in press)
Results are shown as Omega (ω) statistics with 95% confidence intervals. All save Lab/Age for Pneumonia & AMI are p < 0.0001
14
© 2007 Cardinal Health, Inc.or one of its subsidiaries. All rights reserved.
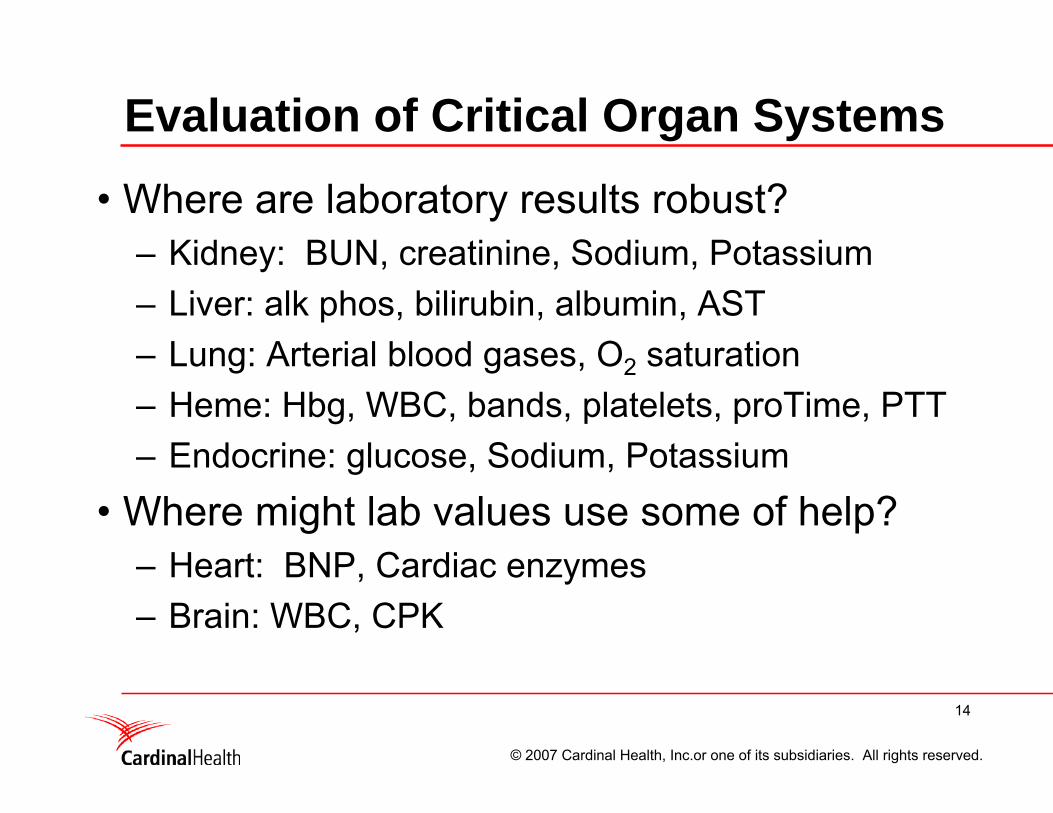
Evaluation of Critical Organ Systems
• Where are laboratory results robust?– Kidney: BUN, creatinine, Sodium, Potassium– Liver: alk phos, bilirubin, albumin, AST– Lung: Arterial blood gases, O2 saturation– Heme: Hbg, WBC, bands, platelets, proTime, PTT– Endocrine: glucose, Sodium, Potassium
• Where might lab values use some of help?– Heart: BNP, Cardiac enzymes– Brain: WBC, CPK
15
© 2007 Cardinal Health, Inc.or one of its subsidiaries. All rights reserved.
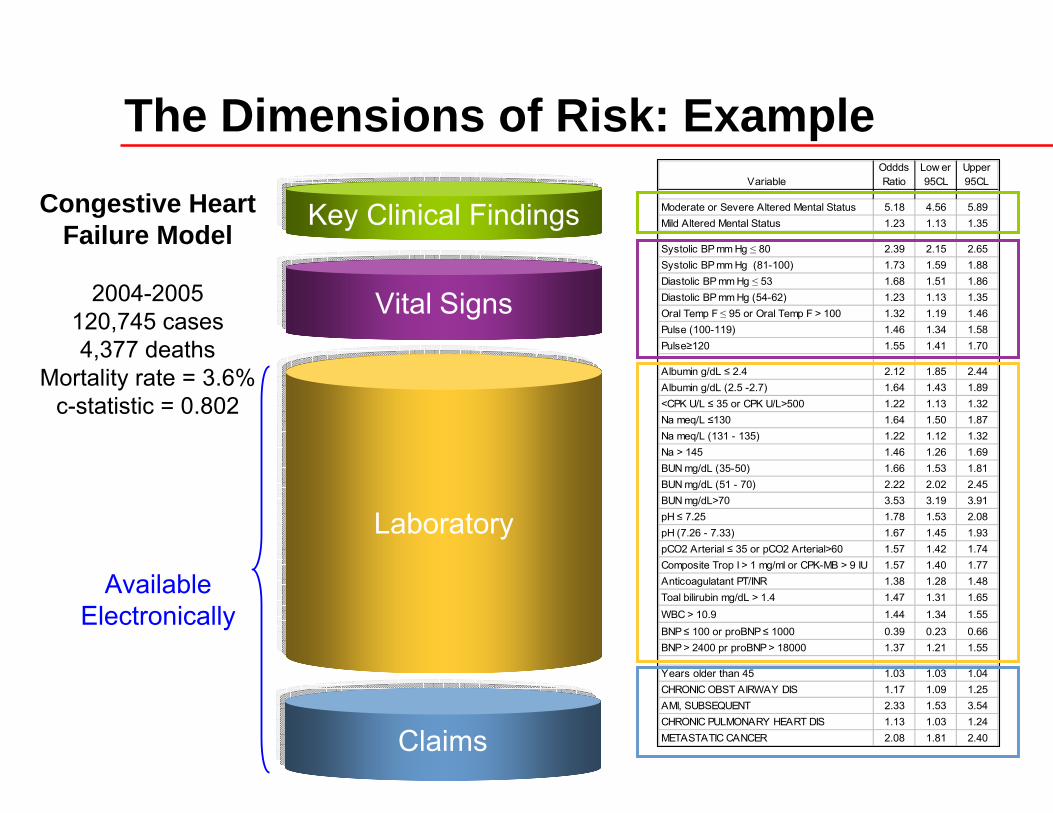
The Dimensions of Risk: Example
Key Clinical Findings
Claims
Laboratory
VariableOddds Ratio
Low er 95CL
Upper 95CL
Moderate or Severe Altered Mental Status 5.18 4.56 5.89Mild Altered Mental Status 1.23 1.13 1.35
Systolic BP mm Hg ≤ 80 2.39 2.15 2.65Systolic BP mm Hg (81-100) 1.73 1.59 1.88Diastolic BP mm Hg ≤ 53 1.68 1.51 1.86Diastolic BP mm Hg (54-62) 1.23 1.13 1.35Oral Temp F ≤ 95 or Oral Temp F > 100 1.32 1.19 1.46Pulse (100-119) 1.46 1.34 1.58Pulse≥120 1.55 1.41 1.70
Albumin g/dL ≤ 2.4 2.12 1.85 2.44Albumin g/dL (2.5 -2.7) 1.64 1.43 1.89<CPK U/L ≤ 35 or CPK U/L>500 1.22 1.13 1.32Na meq/L ≤130 1.64 1.50 1.87Na meq/L (131 - 135) 1.22 1.12 1.32Na > 145 1.46 1.26 1.69BUN mg/dL (35-50) 1.66 1.53 1.81BUN mg/dL (51 - 70) 2.22 2.02 2.45BUN mg/dL>70 3.53 3.19 3.91pH ≤ 7.25 1.78 1.53 2.08pH (7.26 - 7.33) 1.67 1.45 1.93pCO2 Arterial ≤ 35 or pCO2 Arterial>60 1.57 1.42 1.74Composite Trop I > 1 mg/ml or CPK-MB > 9 IU 1.57 1.40 1.77Anticoagulatant PT/INR 1.38 1.28 1.48Toal bilirubin mg/dL > 1.4 1.47 1.31 1.65WBC > 10.9 1.44 1.34 1.55BNP ≤ 100 or proBNP ≤ 1000 0.39 0.23 0.66BNP > 2400 pr proBNP > 18000 1.37 1.21 1.55
Years older than 45 1.03 1.03 1.04CHRONIC OBST AIRWAY DIS 1.17 1.09 1.25AMI, SUBSEQUENT 2.33 1.53 3.54CHRONIC PULMONARY HEART DIS 1.13 1.03 1.24METASTATIC CANCER 2.08 1.81 2.40
Congestive Heart Failure Model
2004-2005120,745 cases4,377 deaths
Mortality rate = 3.6%c-statistic = 0.802
Available Electronically
Vital Signs
16
© 2007 Cardinal Health, Inc.or one of its subsidiaries. All rights reserved.
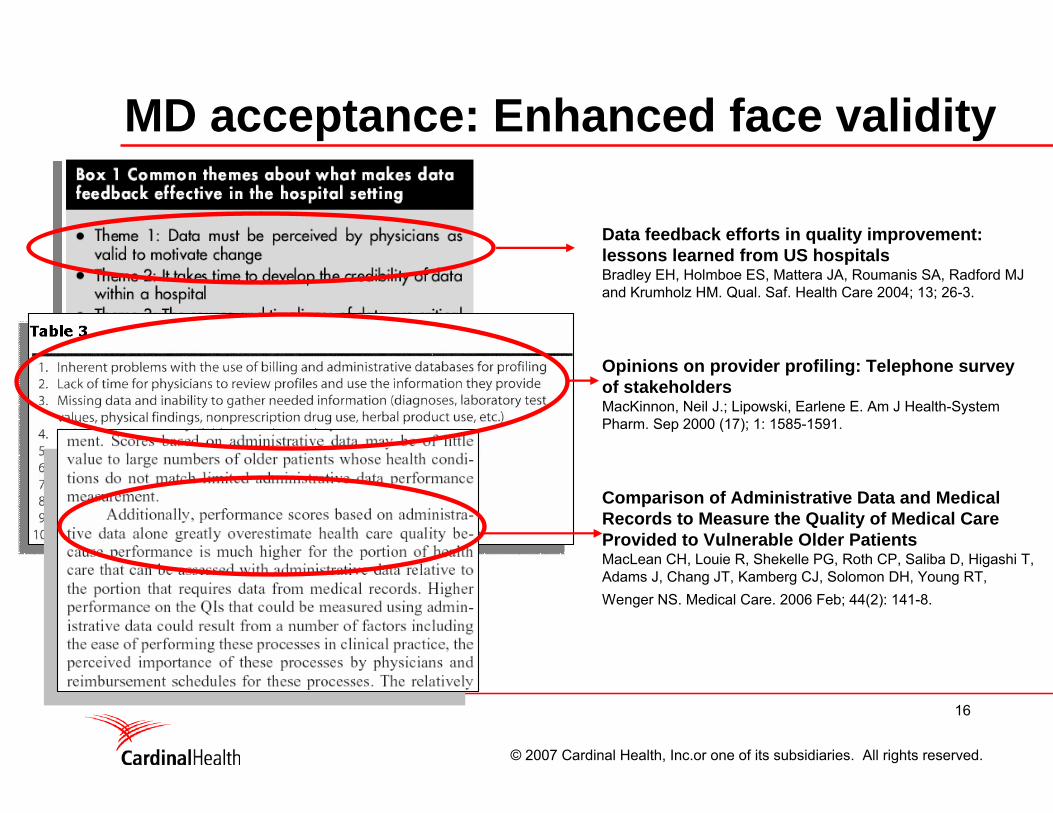
MD acceptance: Enhanced face validity
Data feedback efforts in quality improvement: lessons learned from US hospitalsBradley EH, Holmboe ES, Mattera JA, Roumanis SA, Radford MJ and Krumholz HM. Qual. Saf. Health Care 2004; 13; 26-3.
Opinions on provider profiling: Telephone survey of stakeholdersMacKinnon, Neil J.; Lipowski, Earlene E. Am J Health-System Pharm. Sep 2000 (17); 1: 1585-1591.
Comparison of Administrative Data and Medical Records to Measure the Quality of Medical Care Provided to Vulnerable Older PatientsMacLean CH, Louie R, Shekelle PG, Roth CP, Saliba D, Higashi T, Adams J, Chang JT, Kamberg CJ, Solomon DH, Young RT, Wenger NS. Medical Care. 2006 Feb; 44(2): 141-8.
17
© 2007 Cardinal Health, Inc.or one of its subsidiaries. All rights reserved.
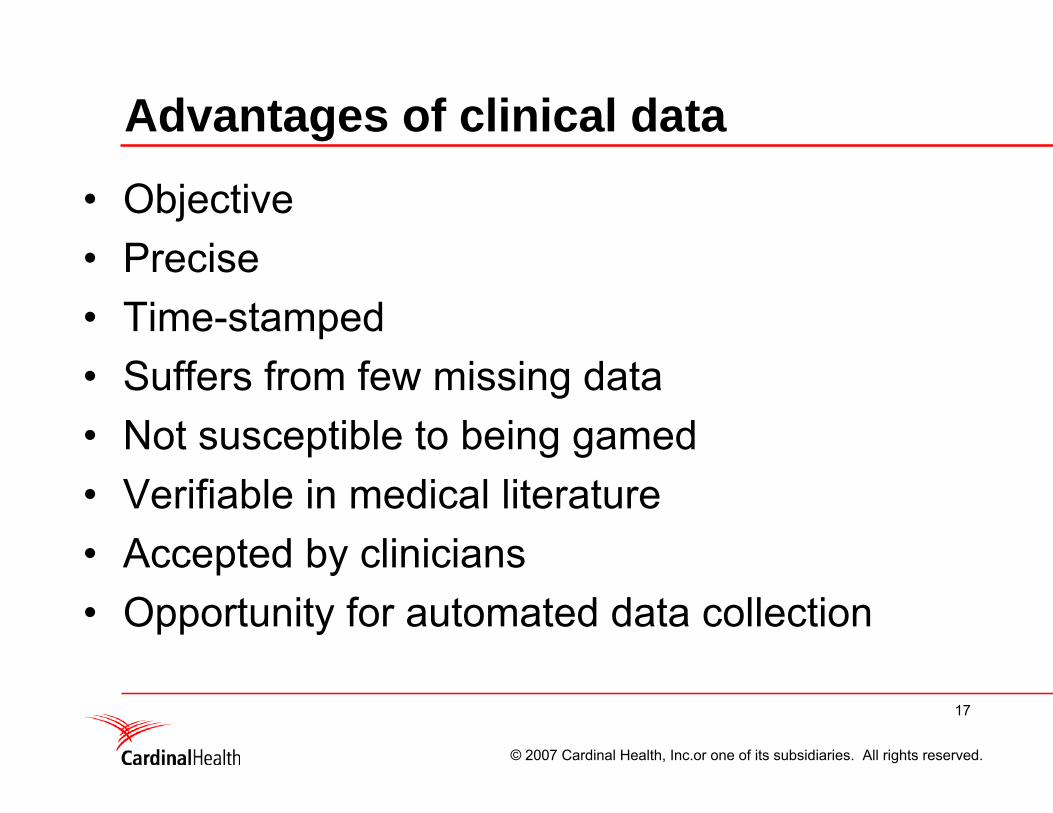
Advantages of clinical data
• Objective• Precise• Time-stamped• Suffers from few missing data• Not susceptible to being gamed• Verifiable in medical literature• Accepted by clinicians• Opportunity for automated data collection
18
© 2007 Cardinal Health, Inc.or one of its subsidiaries. All rights reserved.
Thank You for Your Attention
19
© 2007 Cardinal Health, Inc.or one of its subsidiaries. All rights reserved.
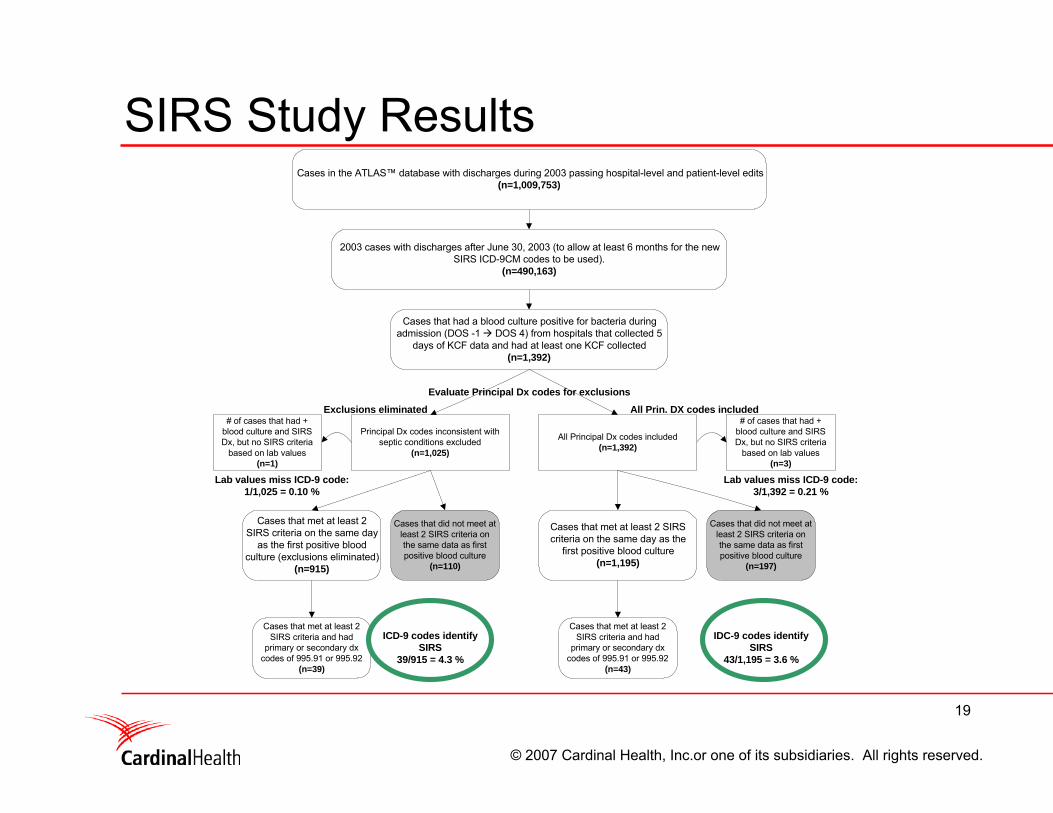
SIRS Study ResultsCases in the ATLAS™ database with discharges during 2003 passing hospital-level and patient-level edits
(n=1,009,753)
2003 cases with discharges after June 30, 2003 (to allow at least 6 months for the newSIRS ICD-9CM codes to be used).
(n=490,163)
Cases that had a blood culture positive for bacteria duringadmission (DOS -1 DOS 4) from hospitals that collected 5
days of KCF data and had at least one KCF collected(n=1,392)
Cases that met at least 2 SIRScriteria on the same day as the
first positive blood culture(n=1,195)
Cases that met at least 2SIRS criteria and had
primary or secondary dxcodes of 995.91 or 995.92
(n=43)
# of cases that had +blood culture and SIRSDx, but no SIRS criteria
based on lab values(n=3)
Cases that met at least 2SIRS criteria on the same day
as the first positive bloodculture (exclusions eliminated)
(n=915)
Cases that met at least 2SIRS criteria and had
primary or secondary dxcodes of 995.91 or 995.92
(n=39)
Evaluate Principal Dx codes for exclusions
Exclusions eliminated All Prin. DX codes included
Principal Dx codes inconsistent withseptic conditions excluded
(n=1,025)
All Principal Dx codes included(n=1,392)
Cases that did not meet atleast 2 SIRS criteria onthe same data as firstpositive blood culture
(n=110)
Cases that did not meet atleast 2 SIRS criteria onthe same data as firstpositive blood culture
(n=197)
# of cases that had +blood culture and SIRSDx, but no SIRS criteria
based on lab values(n=1)
ICD-9 codes identifySIRS
39/915 = 4.3 %
IDC-9 codes identifySIRS
43/1,195 = 3.6 %
Lab values miss ICD-9 code:1/1,025 = 0.10 %
Lab values miss ICD-9 code:3/1,392 = 0.21 %
20
© 2007 Cardinal Health, Inc.or one of its subsidiaries. All rights reserved.
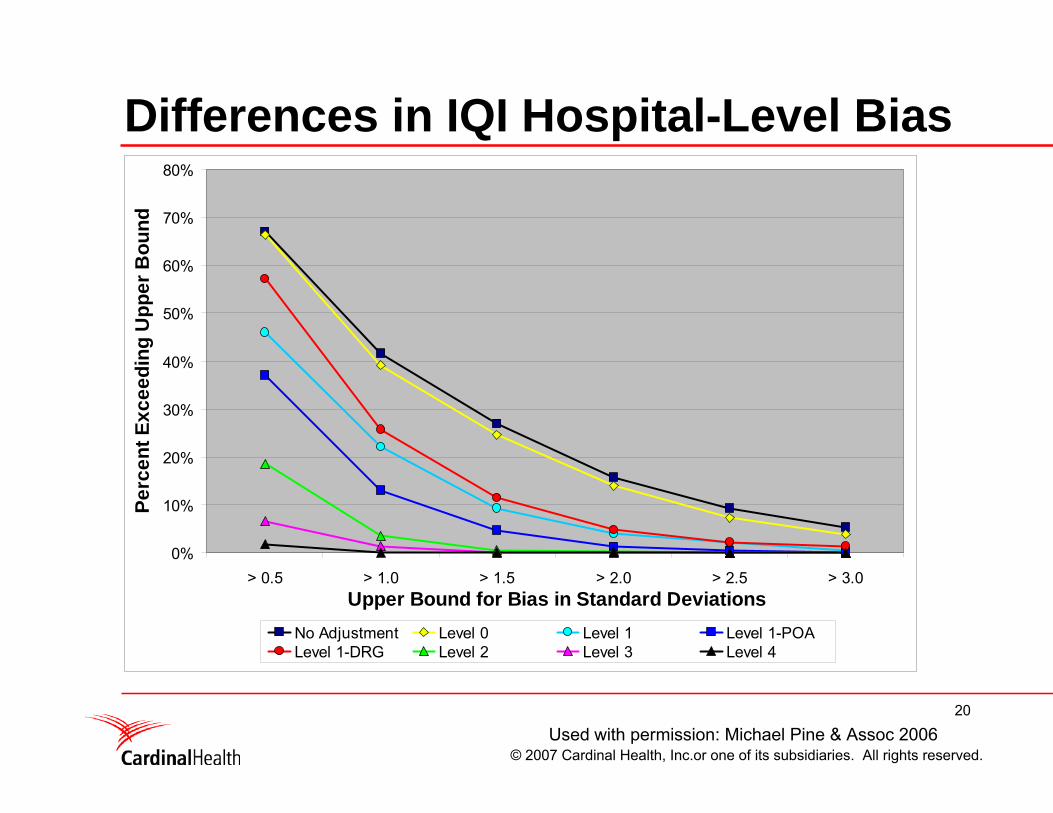
Differences in IQI Hospital-Level Bias
0%
10%
20%
30%
40%
50%
60%
70%
80%
> 0.5 > 1.0 > 1.5 > 2.0 > 2.5 > 3.0Upper Bound for Bias in Standard Deviations
Perc
ent E
xcee
ding
Upp
er B
ound
No Adjustment Level 0 Level 1 Level 1-POALevel 1-DRG Level 2 Level 3 Level 4
Used with permission: Michael Pine & Assoc 2006