Embed Size (px)
Citation preview
13. Power
A. IntroductionB. Example CalculationsC. Factors Affecting PowerD. Exercises
448
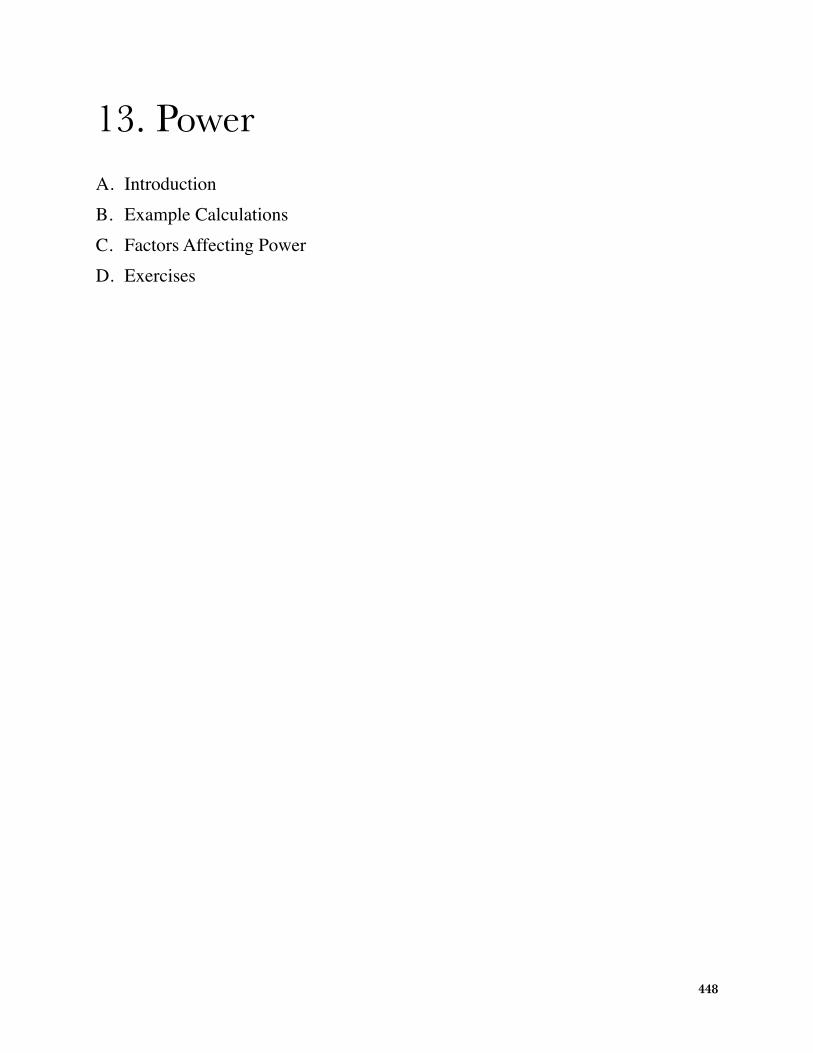
Introduction to Powerby David M. Lane
Prerequisites• Chapter 11: Significance Testing• Chapter 11: Type I and Type II Errors• Chapter 11: Misconceptions
Learning Objectives1. Define power2. Identify situations in which it is important to estimate powerSuppose you work for a foundation whose mission is to support researchers in mathematics education and your role is to evaluate grant proposals and decide which ones to fund. You receive a proposal to evaluate a new method of teaching high-school algebra. The research plan is to compare the achievement of students taught by the new method with the achievement of students taught by the traditional method. The proposal contains good theoretical arguments why the new method should be superior and the proposed methodology is sound. In addition to these positive elements, there is one important question still to be answered: Does the experiment have a high probability of providing strong evidence that the new method is better than the standard method if, in fact, the new method is actually better? It is possible, for example, that the proposed sample size is so small that even a fairly large population difference would be difficult to detect. That is, if the sample size is small, then even a fairly large difference in sample means might not be significant. If the difference is not significant, then no strong conclusions can be drawn about the population means. It is not justified to conclude that the null hypothesis that the population means are equal is true just because the difference is not significant. Of course, it is not justified to conclude that this null hypothesis is false. Therefore, when an effect is not significant, the result is inconclusive. You may prefer that your foundation's money be used to fund a project that has a higher probability of being able to make a strong conclusion.
Power is defined as the probability of correctly rejecting a false null hypothesis. In terms of our example, it is the probability that given there is a difference between the population means of the new method and the standard method, the sample means will be significantly different. The probability of failing
449

to reject a false null hypothesis is often referred to as β (the Greek letter beta). Therefore power can be defined as:
power = 1 - β.
It is very important to consider power while designing an experiment. You should avoid spending a lot of time and/or money on an experiment that has little chance of finding a significant effect.
450

Example Calculationsby David M. Lane
Prerequisites• Chapter 5: Binomial Distribution• Chapter 12: Testing a Single Mean• Chapter 13: Introduction to Power
Learning Objectives1. Compute power using the binomial distribution2. Compute power using the normal distribution3. Use a power calculator to compute power for the t distributionIn the “Shaking and Stirring Martinis” case study, the question was whether Mr. Bond could tell the difference between martinis that were stirred and martinis that were shaken. For the sake of this example, assume he can tell the difference and is able to correctly state whether a martini had been shaken or stirred 0.75 of the time. Now, suppose an experiment is being conducted to investigate whether Mr. Bond can tell the difference. Specifically, is Mr. Bond correct more than 0.50 of the time? We know that he is (that's an assumption of the example). However, the experimenter does not know and asks Mr. Bond to judge 16 martinis. The experimenter will do a significance test based on the binomial distribution. Specifically, if a one tailed test is significant at the 0.05 level, then he or she will conclude that Mr. Bond can tell the difference. The probability value is computed assuming the null hypothesis is true (π = 0.50). Therefore, the experimenter will determine how many times Mr. Bond is correct, and compute the probability of being correct that many or more times given that the null hypothesis is true. The question is: what is the probability the experimenter will correctly reject the null hypothesis that π = 0.50? In other words, what is the power of this experiment?
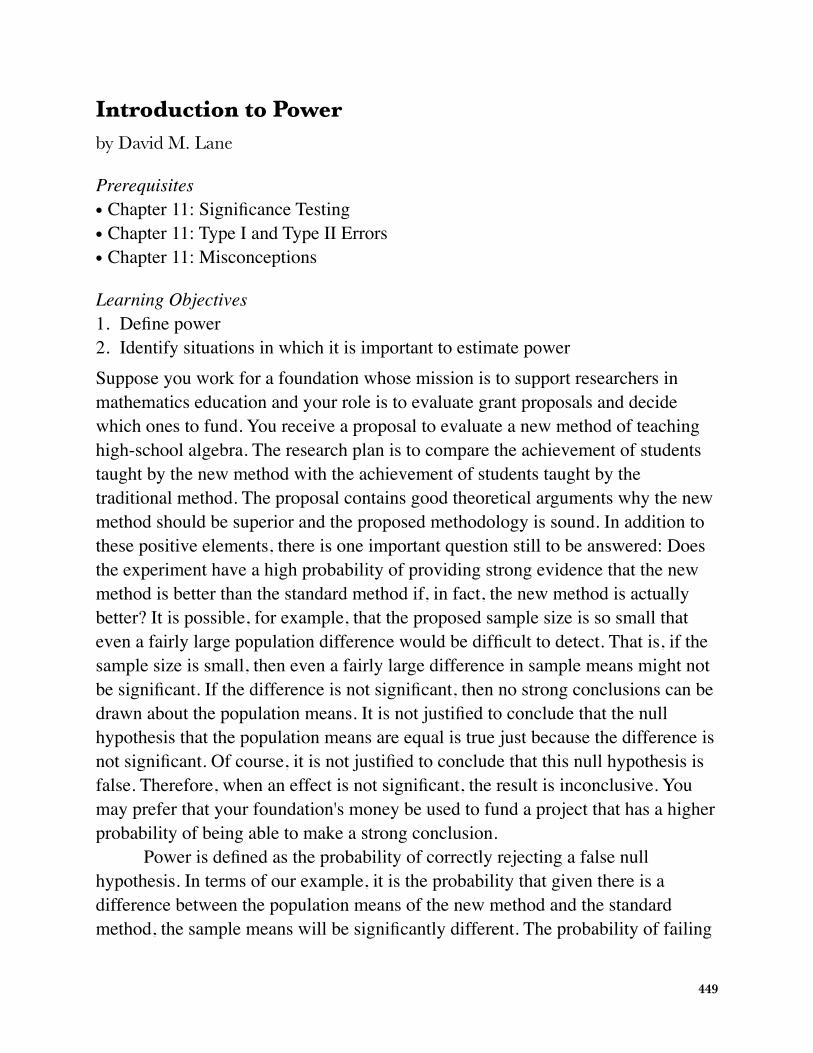
The binomial distribution for N = 16 and π = 0.50 is shown in Figure 1. The probability of being correct on 11 or more trials is 0.105 and the probability of being correct on 12 or more trials is 0.038. Therefore, the probability of being correct on 12 or more trials is less than 0.05. This means that the null hypothesis will be rejected if Mr. Bond is correct on 12 or more trials and will not be rejected otherwise.
451
0
0.05
0.1
0.15
0.2
0.25
0 2 4 6 8 10 12 14 16
Prob
ability
Figure 1. The binomial distribution for N = 16 and π = 0.50.
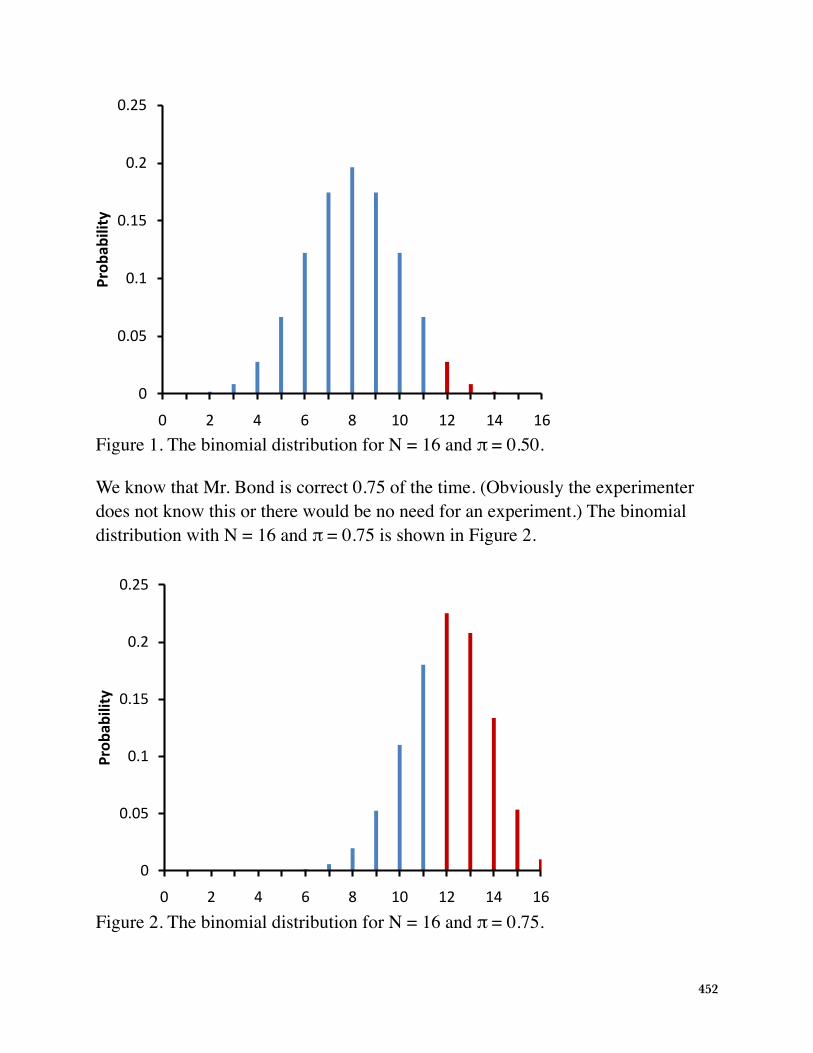
We know that Mr. Bond is correct 0.75 of the time. (Obviously the experimenter does not know this or there would be no need for an experiment.) The binomial distribution with N = 16 and π = 0.75 is shown in Figure 2.
0
0.05
0.1
0.15
0.2
0.25
0 2 4 6 8 10 12 14 16
Prob
ability
Figure 2. The binomial distribution for N = 16 and π = 0.75.
452

The probability of being correct on 12 or more trials is 0.63. Therefore, the power of the experiment is 0.63.
To sum up, the probability of being correct on 12 or more trials given that the null hypothesis is true is less than 0.05. Therefore, if Mr. Bond is correct on 12 or more trials, the null hypothesis will be rejected. Given Mr. Bond's true ability to be correct on 0.75 of the trials, the probability he will be correct on 12 or more trials is 0.63. Therefore power is 0.63.
In the section on testing a single mean for significance in Chapter 12, the first example was based on the assumption that the experimenter knew the population variance. Although this is rarely true in practice, the example is very useful for pedagogical purposes. For the same reason, the following example assumes the experimenter knows the population variance. Power calculators are available for situations in which the experimenter does not know the population variance.
Suppose a math achievement test were known to have a mean of 75 and a standard deviation of 10. A researcher is interested in whether a new method of teaching results in a higher mean. Assume that although the experimenter does not know it, the population mean for the new method is 80. The researcher plans to sample 25 subjects and do a one-tailed test of whether the sample mean is significantly higher than 75. What is the probability that the researcher will correctly reject the false null hypothesis that the population mean for the new method is 75 or lower? The following shows how this probability is computed.
The researcher assumes that the population standard deviation with the new method is the same as with the old method (10) and that the distribution is normal. Since the population standard deviation is assumed to be known, the researcher can use the normal distribution rather than the t distribution to compute the p value. Recall that the standard error of the mean (σM) is
Example Calculations
�� =���
which is equal to 10/5 = 2 in this example. As can be seen in Figure 3, if the null hypothesis that the population mean equals 75 is true, then the probability of a sample mean being greater than or equal to 78.29 is 0.05. Therefore, the experimenter will reject the null hypothesis if the sample mean, M, is 78.29 or larger.
453

0.05
Figure 3. The sampling distribution of the mean if the null hypothesis is true.
The question, then, is what is the probability the experimenter gets a sample mean greater than 78.29 given that the population mean is 80? Figure 4 shows that this probability is 0.80.
0.05
0.8037
Figure 4. The sampling distribution of the mean if the population mean is 80. The test is significant if the sample mean is 78.29 or higher.
Therefore, the probability that the experimenter will reject the null hypothesis that the population mean for the new method is 75 or lower is 0.80. In other words, power = 0.80.
Calculation of power is more complex for t tests and for Analysis of Variance. There are many programs that compute power.
454

Factors Affecting Powerby David M. Lane
Prerequisites• Chapter 11: Significance Testing• Chapter 11: Type I and Type II Errors• Chapter 11: One- and Two-Tailed Tests• Chapter 13: Introduction to Power• Chapter 13: Example Calculations
Learning Objectives1. State five factors affecting power2. State what the effect of each of the factors isSeveral factors affect the power of a statistical test. Some of the factors are under the control of the experimenter, whereas others are not. The following example will be used to illustrate the various factors.
Suppose a math achievement test were known to be normally distributed with a mean of 75 and a standard deviation of σ. A researcher is interested in whether a new method of teaching results in a higher mean. Assume that although the experimenter does not know it, the population mean μ for the new method is larger than 75. The researcher plans to sample N subjects and do a one-tailed test of whether the sample mean is significantly higher than 75. In this section, we consider factors that affect the probability that the researcher will correctly reject the false null hypothesis that the population mean is 75. In other words, factors that affect power.
Sample SizeFigure 1 shows that the larger the sample size, the higher the power. Since sample size is typically under an experimenter's control, increasing sample size is one way to increase power. However, it is sometimes difficult and/or expensive to use a large sample size.
455

11/10/10 10:45 PMhttp://onlinestatbook.com/2/power/factors.html
Page 2 of 4
SSTANDARDTANDARD D DEVIATIONEVIATION
Figure 1 also shows that power is higher when the standard deviation is small thanwhen it is large. For all values of N, power is higher for the standard deviation of 10than for the standard deviation of 15 (except, of course, when N = 0). Experimenterscan sometimes control the standard deviation by sampling from a homogeneouspopulation of subjects, by reducing random measurement error, and/or by making surethe experimental procedures are applied very consistently.
DDIFFERENCEIFFERENCE BETWEENBETWEEN H HYPOTHESIZEDYPOTHESIZED ANDAND T TRUERUE M MEANEAN
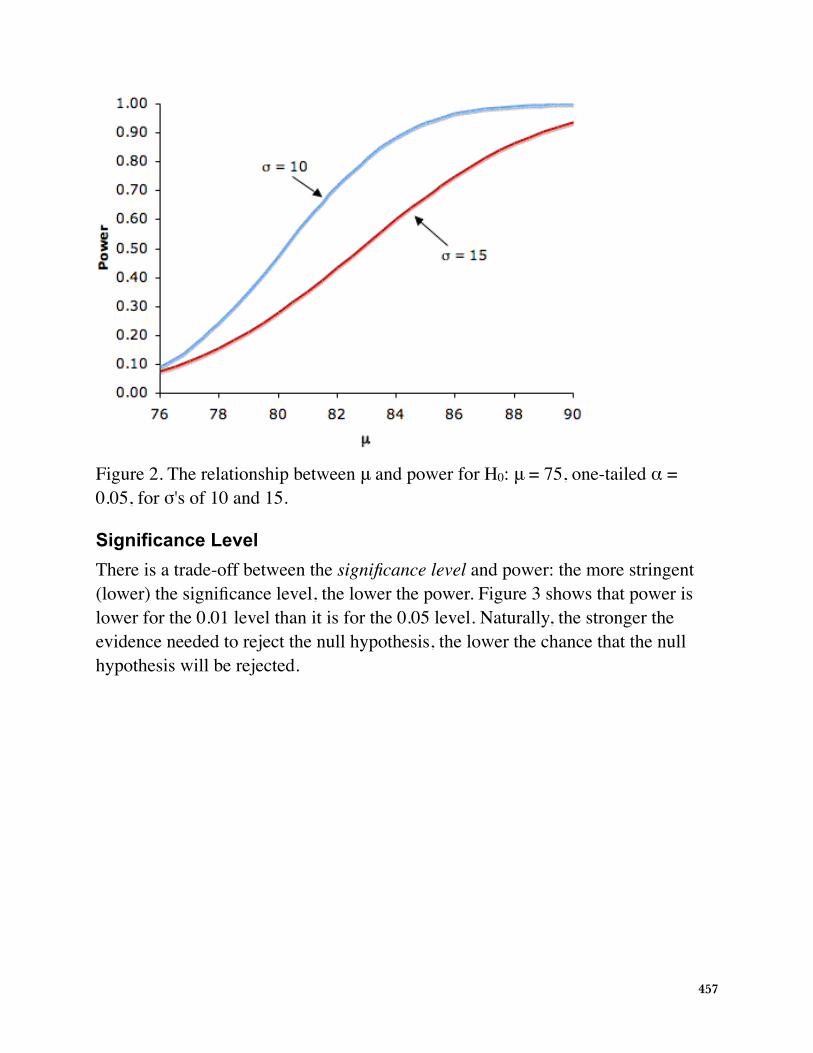
Naturally, the larger the effect size, the more likely it is that an experiment would find asignificant effect. Figure 2 shows the effect of increasing the difference between themean specified by the null hypothesis (75) and the population mean μ for standarddeviations of 10 and 15.
Figure 2. The relationship between power and μ withH0: μ = 75, one-tailed α = 0.05, for σ's of 10 and 15.
Figure 1. The relationship between sample size and power for H0: μ = 75, real μ = 80, one-tailed α = 0.05, for σ's of 10 and 15.
Standard DeviationFigure 1 also shows that power is higher when the standard deviation is small than when it is large. For all values of N, power is higher for the standard deviation of 10 than for the standard deviation of 15 (except, of course, when N = 0). Experimenters can sometimes control the standard deviation by sampling from a homogeneous population of subjects, by reducing random measurement error, and/or by making sure the experimental procedures are applied very consistently.
Difference between Hypothesized and True MeanNaturally, the larger the effect size, the more likely it is that an experiment would find a significant effect. Figure 2 shows the effect of increasing the difference between the mean specified by the null hypothesis (75) and the population mean μ for standard deviations of 10 and 15.
456
11/10/10 10:45 PMhttp://onlinestatbook.com/2/power/factors.html
Page 3 of 4
SSIGNIFICANCEIGNIFICANCE L LEVELEVEL
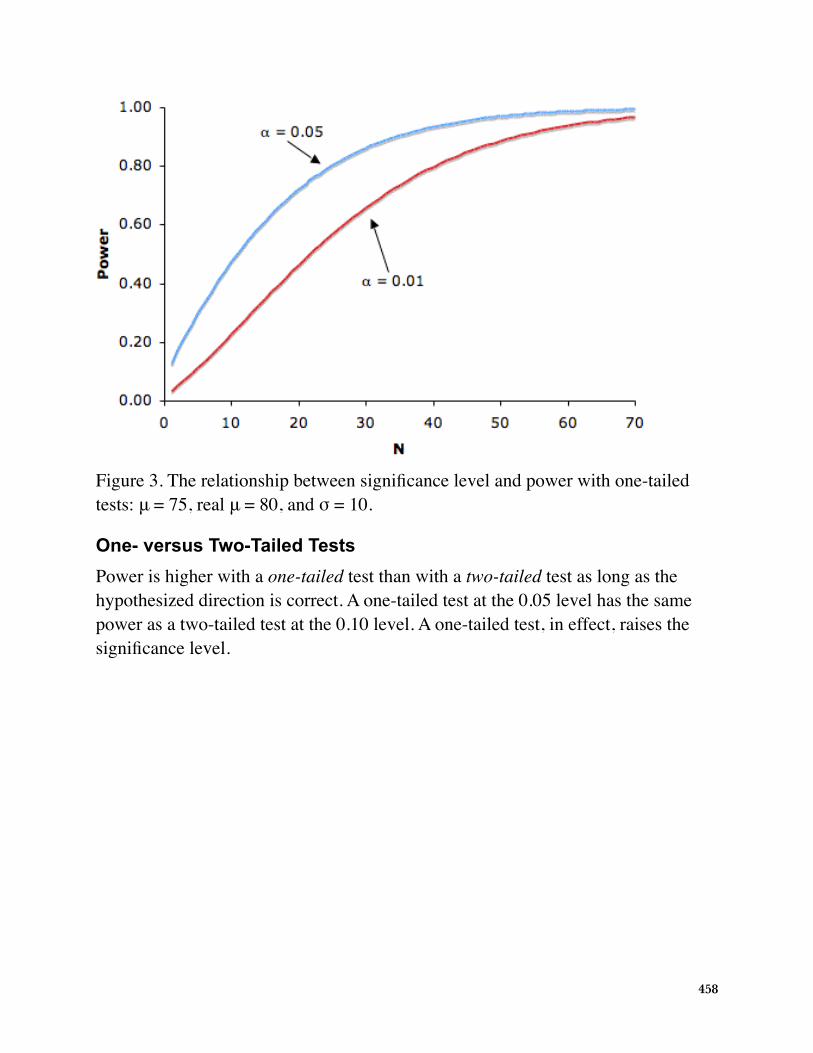
There is a tradeoff between the significance level and power: the more stringent (lower)the significance level, the lower the power. Figure 3 shows that power is lower for the0.01 level than it is for the 0.05 level. Naturally, the stronger the evidence needed toreject the null hypothesis, the lower the chance that the null hypothesis will berejected.
Figure 3. The relationship between power and significancelevel with one-tailed tests: μ = 75, real μ = 80, and σ = 10.
OONENE- - VERSUSVERSUS T TWOWO-T-TAILEDAILED T TESTSESTS
Power is higher with a one-tailed test than with a two-tailed test as long as the
Figure 2. The relationship between μ and power for H0: μ = 75, one-tailed α = 0.05, for σ's of 10 and 15.
Significance LevelThere is a trade-off between the significance level and power: the more stringent (lower) the significance level, the lower the power. Figure 3 shows that power is lower for the 0.01 level than it is for the 0.05 level. Naturally, the stronger the evidence needed to reject the null hypothesis, the lower the chance that the null hypothesis will be rejected.
457
11/10/10 10:45 PMhttp://onlinestatbook.com/2/power/factors.html
Page 3 of 4
SSIGNIFICANCEIGNIFICANCE L LEVELEVEL
There is a tradeoff between the significance level and power: the more stringent (lower)the significance level, the lower the power. Figure 3 shows that power is lower for the0.01 level than it is for the 0.05 level. Naturally, the stronger the evidence needed toreject the null hypothesis, the lower the chance that the null hypothesis will berejected.
Figure 3. The relationship between power and significancelevel with one-tailed tests: μ = 75, real μ = 80, and σ = 10.
OONENE- - VERSUSVERSUS T TWOWO-T-TAILEDAILED T TESTSESTS
Power is higher with a one-tailed test than with a two-tailed test as long as the
Figure 3. The relationship between significance level and power with one-tailed tests: μ = 75, real μ = 80, and σ = 10.
One- versus Two-Tailed TestsPower is higher with a one-tailed test than with a two-tailed test as long as the hypothesized direction is correct. A one-tailed test at the 0.05 level has the same power as a two-tailed test at the 0.10 level. A one-tailed test, in effect, raises the significance level.
458

Statistical Literacyby David M. Lane
Prerequisites• Chapter 13:
A research design to compare three drugs for the treatment of Alzheimer's disease is described here. For the first two years of the study, researchers will follow the subjects with scans and memory tests.
What do you think?The data could be analyzed as a between-subjects design or as a within-subjects design. What type of analysis would be done for each type of design and how would the choice of designs affect power?
For a between-subjects design, the subjects in the different conditions would be compared after two years. For a within-subjects design, the change in subjects' scores in the different conditions would be compared. The latter would be more powerful.
459
Exercises
Prerequisites
1. Define power in your own words.
2. List 3 measures one can take to increase the power of an experiment. Explain why your measures result in greater power.
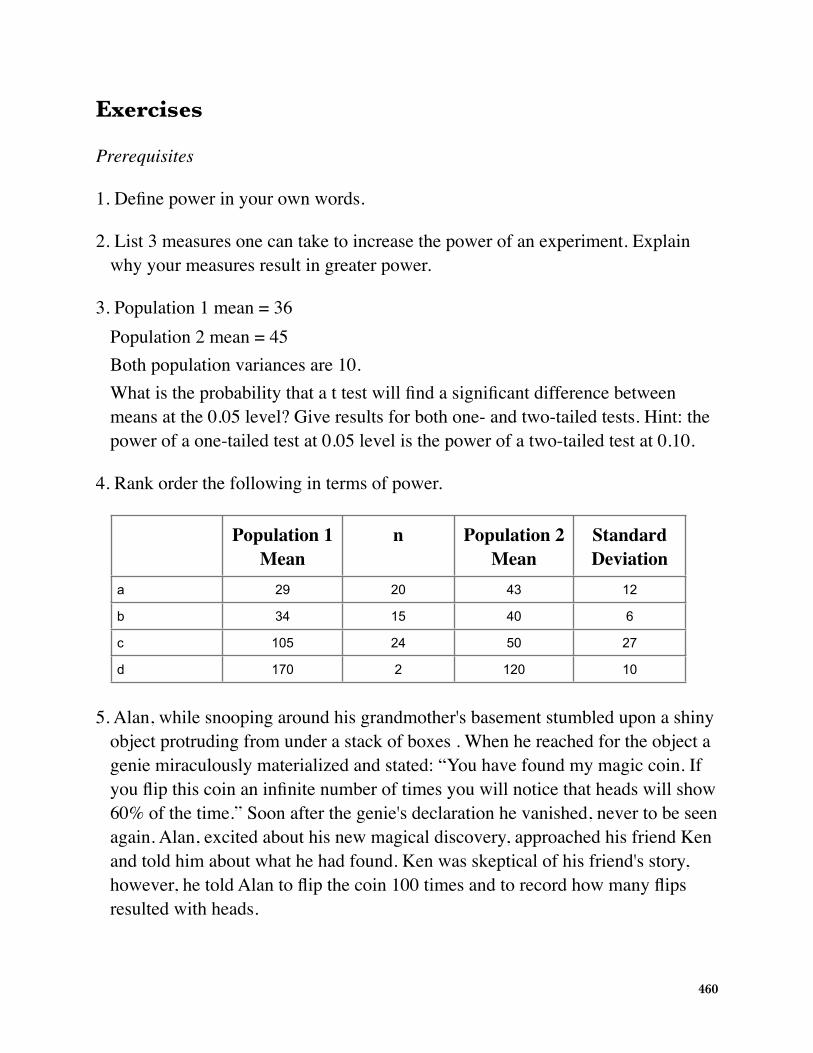
3. Population 1 mean = 36 Population 2 mean = 45 Both population variances are 10.What is the probability that a t test will find a significant difference between means at the 0.05 level? Give results for both one- and two-tailed tests. Hint: the power of a one-tailed test at 0.05 level is the power of a two-tailed test at 0.10.
4. Rank order the following in terms of power.
Population 1 Mean
n Population 2 Mean
Standard Deviation
a 29 20 43 12
b 34 15 40 6
c 105 24 50 27
d 170 2 120 10
5. Alan, while snooping around his grandmother's basement stumbled upon a shiny object protruding from under a stack of boxes . When he reached for the object a genie miraculously materialized and stated: “You have found my magic coin. If you flip this coin an infinite number of times you will notice that heads will show 60% of the time.” Soon after the genie's declaration he vanished, never to be seen again. Alan, excited about his new magical discovery, approached his friend Ken and told him about what he had found. Ken was skeptical of his friend's story, however, he told Alan to flip the coin 100 times and to record how many flips resulted with heads.
460
(a) What is the probability that Alan will be able convince Ken that his coin has special powers by finding a p value below 0.05 (one tailed).Use the Binomial Calculator (and some trial and error)(b) If Ken told Alan to flip the coin only 20 times, what is the probability that Alan will not be able to convince Ken (by failing to reject the null hypothesis at the 0.05 level)?
461