Embed Size (px)
Citation preview
STABLE ISOTOPE EVIDENCE OF HETEROGENEOUS FLUIDINFILTRATION AT THE UBEHEBE PEAK CONTACT AUREOLE,
DEATH VALLEY NATIONAL PARK, CALIFORNIA
GREGORY T. ROSELLE*, LUKAS P. BAUMGARTNER**,and JOHN W. VALLEY
Department of Geology and Geophysics,University of Wisconsin, Madison, Wisconsin 53706
ABSTRACT. Stable isotope ratios of carbon and oxygen are used to definequantitatively the effects of magmatic fluid infiltration in marbles contact meta-morphosed by the 173 Ma Ubehebe Peak quartz monzonite, Death ValleyNational Park, California. In previous studies of fluid infiltration, quantitativeinterpretation of aureole-wide isotopic data has been difficult due to small datasets. For this study, sampling strategies were developed to obtain a data set thatwas large and unbiased enough to be statistically representative of the carbonatesnorth of the Ubehebe Peak intrusion.
A total of 357 samples of marble were analyzed for bulk carbonate isotopicratios. Separate analyses of coexisting calcite and dolomite were also obtained foran additional 31 samples. Unmetamorphosed samples (1900-3000 m from theintrusion) have �18O (permil SMOW) values of 25.5 � 0.8 (1�) and �13C (permilPDB) values of �0.4 � 0.6 (1�). Samples in the tremolite zone (750-1900 m) have�18O values ranging from 19.4 to 27.7 permil with a median value of 25.2 permil;and �13C ranges from �5.1 to 0.5 permil with a median value of �0.9 permil.Forsterite zone samples (0-750 m) have isotopic ratios shifted to values as low as11.1 permil (�18O) and �9.1 permil (�13C). Despite this shift, most forsterite zonesamples retain sedimentary isotopic compositions with median �18O values of25.0 permil and �13C values of �1.2 permil. �18O values for igneous minerals showno evidence for interaction with heated meteoric or metamorphic fluids.
The shifts in isotopic compositions within the marbles are interpreted to bethe result of magmatic infiltration. The effects of this infiltration were quantifiedby identifying samples with isotopic alteration that can only be attributed toinfiltration. The results show that magmatic fluid infiltration was limited in extentand very heterogeneous. There is no evidence for infiltration of isotopicallyreactive fluids beyond 850 m from the intrusive contact, and within this 850 mzone only 28 percent of the samples have been infiltratively altered with respectto �18O, and 20 percent are depleted in �13C compositions. The isotopic data,when evaluated in conjunction with geostatistical and petrologic data, indicatethat the geometry of the hydrothermal flow system was mainly vertical and awayfrom the pluton. Infiltration was restricted to large, nearly vertical, ‘‘tube-like’’zones of increased permeability. These higher permeability zones likely reflectan initial heterogeneity of the host rocks and show no significant evidence forreaction enhanced permeability.
Given the heterogeneity of the system and a lack of knowledge about manybasic parameters controlling fluid infiltration, it is shown that the best method ofcalculating the amount and composition of the infiltrating fluid may be a massbalance approach (fluid/rock ratio). The application of mass balance models isdiscussed and shown to be valid only under limited conditions. Since infiltrationat Ubehebe Peak was largely vertical, the observed isotope alteration patternsrepresent an infiltration side and not a front. Because this precludes the use oftraditional mass balance calculations, a new infiltration side (InSide) model isproposed that allows the isotopic data to be evaluated. The InSide model uses theratio of the areal amounts of infiltrative alteration to calculate a fluid composi-tion. Fluid amounts cannot be obtained from this model. Results for the Ubehebe
* Present address: Mineralogisch-Petrographisches Institut Universitat Bern, Baltzer-Strasse 1, CH-3012Bern, Switzerland.
** Present address: Institut fur Geowissenschaften, Johannes Gutenberg Universitat, Becherweg 21,D-55099 Mainz, Germany.
[AMERICAN JOURNAL OF SCIENCE, VOL. 299, FEBRUARY, 1999, P. 93–138]
93
Peak data show that the infiltrating fluid had an average XCO2of 0.3. Although
not in agreement with estimates based on phase petrology (XCO2F 0.05),
such discrepancy in the carbon mass balance is not limited to the Ubehebe Peakaureole and is a common problem in many other aureoles.
The statistically representative Ubehebe Peak data set provides the mostaccurate picture of aureole-scale fluid infiltration presently available. Althoughin many ways this study quantifies the heterogeneous nature of contact metamor-phic fluid infiltration, it also highlights some serious problems in predicting theamount and composition of infiltrating fluids. Data gained from studies such asthis, however, will lead to an increased understanding of fluid infiltration andcontribute to the development of more accurate models.
INTRODUCTION
Over the last several decades it has been recognized that fluids are a major drivingforce in the metamorphism of many rock types (Rice and Ferry, 1982; Ferry, 1986). Thisrecognition has been the stimulus for many of the significant advances that have beenmade in understanding the fundamental physical and chemical parameters that governcrustal fluid flow and fluid-induced mass transfer. Many of these advances have come instudies of contact metamorphism. Nevertheless, numerous basic questions about thetiming, extent, and style of metamorphic fluid flow have yet to be adequately addressed.The significance of fluid infiltration on the development of thermal profiles, positions ofmineral isograds, and mineral compositions (isotopic and trace element) in contactaureoles remains relatively unknown. Studies show that fluids can be highly channelizedat outcrop scale (Valley and O’Neil, 1984; Baumgartner and others, 1989; Cartwright,1994; Gerdes and Valley, 1994; Gerdes and others, 1995a), yet infiltration is generallyconsidered pervasive when viewed at the aureole scale. Fluid infiltration could becontinuous throughout the duration of metamorphism or the result of pulses of fluidsfrom one or more sources. The answers to such questions, if at all possible, will have tocome from observations of the time-integrated effects of fluid infiltration in contactaureoles.
In addition to field-based studies, fluid flow models have the potential to providesignificant insight into the importance of the various factors that control fluid infiltrationwithin an aureole (Norton and Knight, 1977; Cathles, 1977; Norton and Taylor, 1979;Baumgartner and Rumble, 1988; Bickle and Baker, 1990a, b; Baumgartner and Ferry,1991; Ferry and Dipple, 1991, 1992; Dipple and Ferry, 1992; Hanson, 1992a, b; Lasagaand Rye, 1993; Gerdes, Baumgartner and Person, 1995; Gerdes, and others, 1995). Alimitation of these fluid flow models, however, is that their solutions are non-uniquebecause the outcomes are highly dependent upon the parameters that influence fluidflow. For example, the distribution of permeability in the host rock will have apronounced effect on fluid flow patterns. Recent modeling by Gerdes, Baumgartner, andPerson (1995) indicates that heterogeneous permeability fields will have a profoundeffect on predicted stable isotope depletion patterns due to fluid focusing. Aureole-scalestudies of stable isotope patterns typically exhibit such heterogeneity in the degree ofisotopic alteration across the aureole (Taylor and Forester, 1979; Criss and Taylor, 1983;Bowman and others, 1994). This scatter has been interpreted to be the result of fluidfocusing due to heterogeneous permeability (Bowman, Willett, and Cook, 1994; Gerdes,Baumgartner, and Person, 1995b). Thus a realistic picture of this heterogeneity may beuseful in gaining a better understanding of the nature of metamorphic permeability.
Given the complex nature of fluid infiltration in contact aureoles an accurateunderstanding of its effects can only come through data sets that are representative of anentire aureole. A problem inherent in any aureole-scale study is that the results can bebiased due to preferential sampling. Although unintentional, this bias can occur whensamples are collected solely to provide the most petrologic information. Such samples
Gregory T. Roselle and others—Stable isotope94
are most likely to have interacted with fluids, and using their isotopic values to modelfluid infiltration on an aureole-wide scale will result in an overestimation of the degree offluid-rock interaction. Sampling bias is further compounded by a lack of adequatenumbers of samples to be representative of an aureole. This type of prejudice can be aresult of insufficient sample collection or limited outcrop exposure available for sam-pling.
The aim of this study is to define quantitatively the extent and style of �18O and �13Cdepletion due to fluid infiltration in marbles of the Ubehebe Peak contact aureole,California. An important aspect of this study was to try and collect a data set that waslarge and unbiased enough to be statistically representative of the entire study area. Fromthis unique data set a greater understanding of some of the parameters controlling fluidinfiltration can hopefully be obtained.
THE UBEHEBE PEAK CONTACT AUREOLE
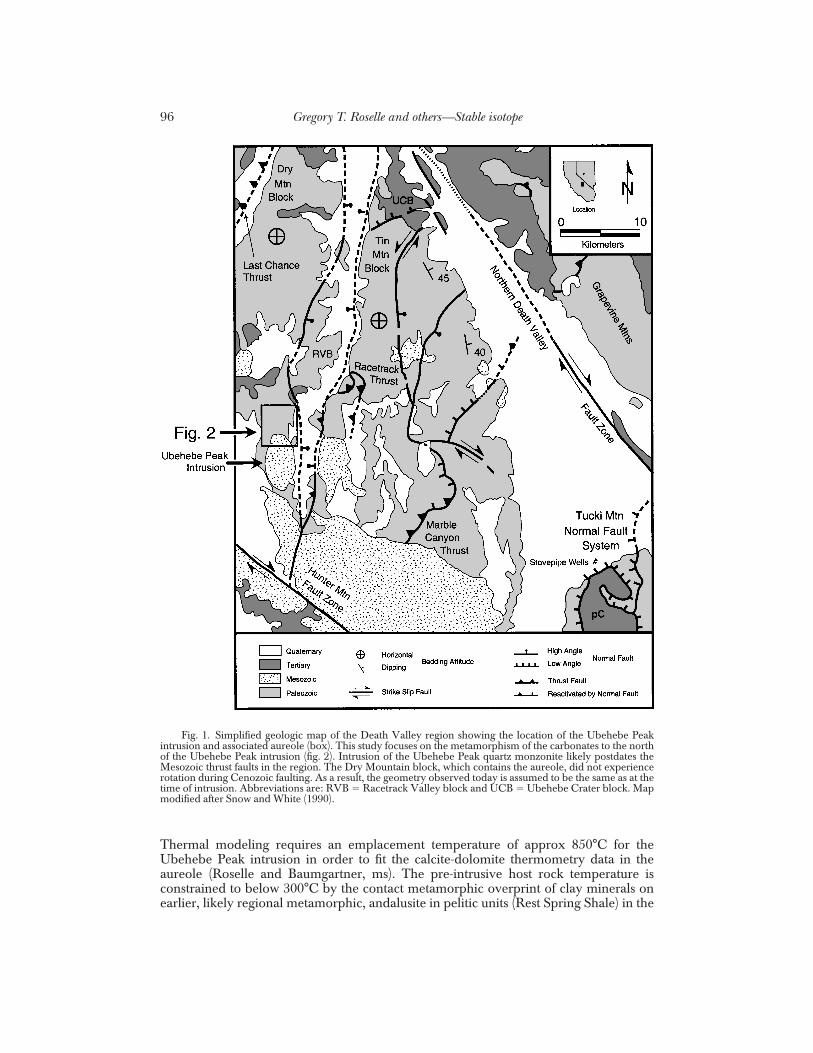
Geology of the study area.—The Ubehebe Peak aureole is located in Death ValleyNational Park, California, at the southern end of the Last Chance Mountains (McAllister,1955, 1956) (fig. 1). The aureole formed 173 � 1 Ma by intrusion of a quartz monzoniteinto a thick sequence of steeply-dipping Ordovician to Pennsylvanian strata (fig. 2). Thepetrology, mineral reaction isograds, prograde reaction path, and metamorphic pressureand temperature conditions for the aureole are discussed in detail by Roselle andBaumgartner (ms). The current study focuses on the metamorphism of dolomites northof the intrusion which have compositions ranging from quartz-poor dolomite to dolo-mitic sandstone with some minor layers of limestone. These units north of the UbehebePeak intrusion generally strike N20°E and dip approx 50° to the west. As the contact isapproached, the dip changes to near vertical, and the rocks are folded. This folding islikely related to the intrusion of the quartz monzonite. The west side of the study areaexhibits a topographic relief of approx 1000 m. Over this entire distance the hostrock-intrusion contact is nearly vertical. Important for this study is the excellentexposure that allows tracing of individual units for over 3000 m away from the contact.In addition, Cenozoic faulting in the area (fig. 1) appears to have had very little effect onthe orientation of the structural block containing the Ubehebe Peak aureole (Snow andWhite, 1990). A more complete description of the regional and local geologic history ofthe area is given in Roselle (1997).
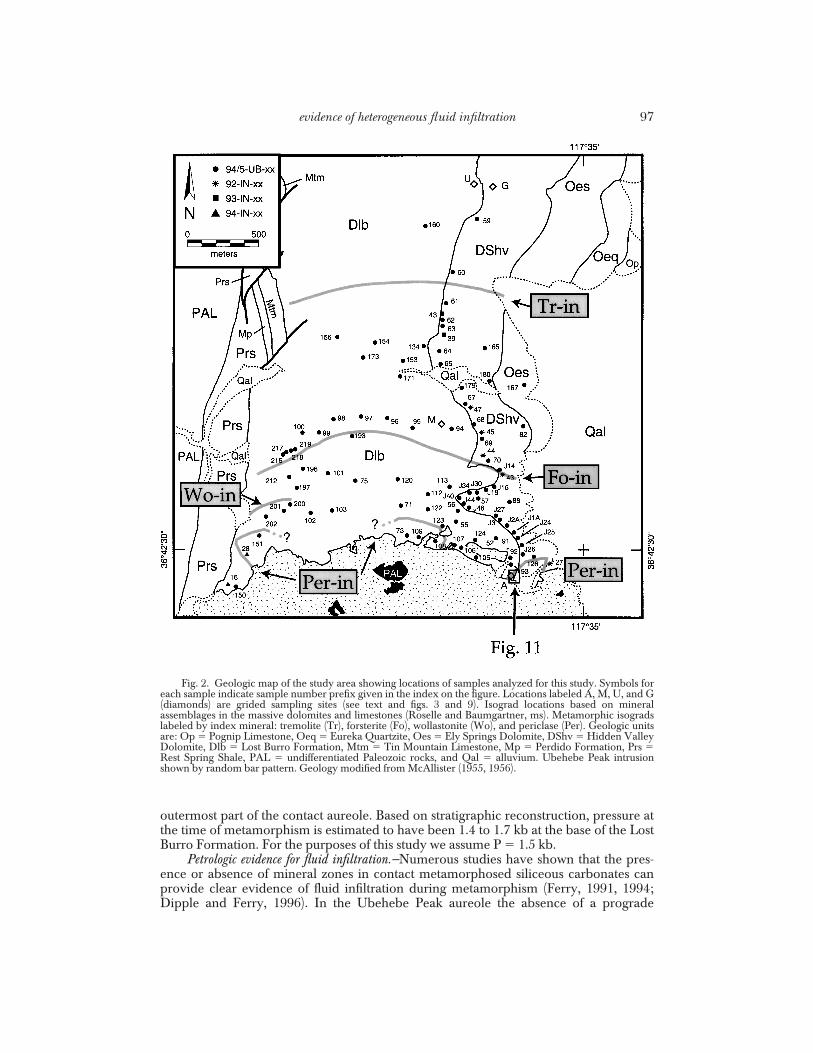
Contact metamorphism of the siliceous dolomites.—Mineral zones for the study area aredefined based primarily on prograde metamorphism of massive dolomites that containvariable amounts of disseminated quartz (2-15 percent). Siliceous limestone layers andnodular dolomites consisting of chert nodules in a matrix of massive dolomite are alsopresent but represent a minor portion of the aureole. In the massive dolomites a typicalsequence of index minerals: tremolite, forsterite, and periclase (now replaced by brucite)is observed (fig. 2). Only 5 of approx 280 samples in the massive dolomites contain theprograde assemblage diopside � dolomite despite generally abundant quartz (2-15percent) in these units (Roselle and Baumgartner, ms). Talc occurs only as an occasionalretrograde replacement of tremolite. Prograde metamorphism of siliceous limestonesalso produced tremolite and wollastonite. In the study area, the tremolite isograd occursapprox 1900 m from the intrusive contact, the forsterite isograd approx 750 m from thecontact, and the wollastonite isograd approx 190 m from the contact (only within thelimestone layers). The distribution of periclase within the dolomite units is extremelyheterogeneous with the periclase isograde ranging from nonexistent to as far as 140 mfrom the contact (fig. 2).
Calcite-dolomite solvus thermometry yields temperatures of 410° to 440°C in thelower to middle tremolite zone, 475° to 525°C in the lower to middle forsterite zone, ashigh as 610°C in the upper forsterite zone, and 620° to 665°C at the periclase-in isograd.
evidence of heterogeneous fluid infiltration 95
Thermal modeling requires an emplacement temperature of approx 850°C for theUbehebe Peak intrusion in order to fit the calcite-dolomite thermometry data in theaureole (Roselle and Baumgartner, ms). The pre-intrusive host rock temperature isconstrained to below 300°C by the contact metamorphic overprint of clay minerals onearlier, likely regional metamorphic, andalusite in pelitic units (Rest Spring Shale) in the
Fig. 1. Simplified geologic map of the Death Valley region showing the location of the Ubehebe Peakintrusion and associated aureole (box). This study focuses on the metamorphism of the carbonates to the northof the Ubehebe Peak intrusion (fig. 2). Intrusion of the Ubehebe Peak quartz monzonite likely postdates theMesozoic thrust faults in the region. The Dry Mountain block, which contains the aureole, did not experiencerotation during Cenozoic faulting. As a result, the geometry observed today is assumed to be the same as at thetime of intrusion. Abbreviations are: RVB � Racetrack Valley block and UCB � Ubehebe Crater block. Mapmodified after Snow and White (1990).
Gregory T. Roselle and others—Stable isotope96
outermost part of the contact aureole. Based on stratigraphic reconstruction, pressure atthe time of metamorphism is estimated to have been 1.4 to 1.7 kb at the base of the LostBurro Formation. For the purposes of this study we assume P � 1.5 kb.
Petrologic evidence for fluid infiltration.—Numerous studies have shown that the pres-ence or absence of mineral zones in contact metamorphosed siliceous carbonates canprovide clear evidence of fluid infiltration during metamorphism (Ferry, 1991, 1994;Dipple and Ferry, 1996). In the Ubehebe Peak aureole the absence of a prograde
Fig. 2. Geologic map of the study area showing locations of samples analyzed for this study. Symbols foreach sample indicate sample number prefix given in the index on the figure. Locations labeled A, M, U, and G(diamonds) are grided sampling sites (see text and figs. 3 and 9). Isograd locations based on mineralassemblages in the massive dolomites and limestones (Roselle and Baumgartner, ms). Metamorphic isogradslabeled by index mineral: tremolite (Tr), forsterite (Fo), wollastonite (Wo), and periclase (Per). Geologic unitsare: Op � Pognip Limestone, Oeq � Eureka Quartzite, Oes � Ely Springs Dolomite, DShv � Hidden ValleyDolomite, Dlb � Lost Burro Formation, Mtm � Tin Mountain Limestone, Mp � Perdido Formation, Prs �Rest Spring Shale, PAL � undifferentiated Paleozoic rocks, and Qal � alluvium. Ubehebe Peak intrusionshown by random bar pattern. Geology modified from McAllister (1955, 1956).
evidence of heterogeneous fluid infiltration 97
diopside isograd and the presence of periclase and wollastonite isograds indicate that theaureole experienced some degree of fluid infiltration. Ferry (1991, 1994) has shown thatan internally buffered (closed system) reaction path for a silica-rich dolomite, with aporosity less than 1 percent at the start of reaction, will result in a well-developeddiopside zone. The formation of diopside under closed system conditions, however, ishighly dependent on both the bulk composition of the host rock and the initial amountand composition of the fluid phase. There are some combinations of these factors underwhich diopside will not form in an internally buffered system. Roselle and Baumgartner(ms) have shown that for siliceous dolomites with initial porosities of less than 1 percentdiopside will always form in a closed system if there is more than approx 1 modal percentquartz in the rock. In contrast to internally buffered rocks, the infiltration of largeamounts of an externally buffered water-rich fluid into rocks containing excess dolomiteprevents the formation of a diopside zone (Ferry, 1991, 1994; Dipple and Ferry, 1996).Because metamorphic porosities are generally considered to be less than 1 percent andsiliceous dolomites in the Ubehebe Peak aureole contain an average of 5 to 10 percentquartz, the absence of a diopside zone in the massive siliceous dolomites provides clearevidence that externally-derived fluids infiltrated these rocks during metamorphism. Therare occurrence of rocks containing the assemblage dolomite � diopside suggests,however, that the infiltration was not pervasive.
The local development of periclase marbles as far as 140 m away from the contact(estimated isograde temperature 630°C) and the wollastonite isograde at approx 190 mfrom the contact provide additional evidence for fluid infiltration within the inneraureole. The irregular trace of the periclase isograde is another indication of heteroge-neous infiltration (fig. 2). The presence of wollastonite � garnet � diopside � idocraseskarns at the contact is also indicative of water-rich fluid infiltration (Valley and others,1985). Based on the observed metamorphic assemblages and geothermometry, theinfiltrating fluid likely had an initial XCO2
value much less than 0.05 (Roselle andBaumgartner, ms).
SAMPLING AND ANALYTICAL TECHNIQUES
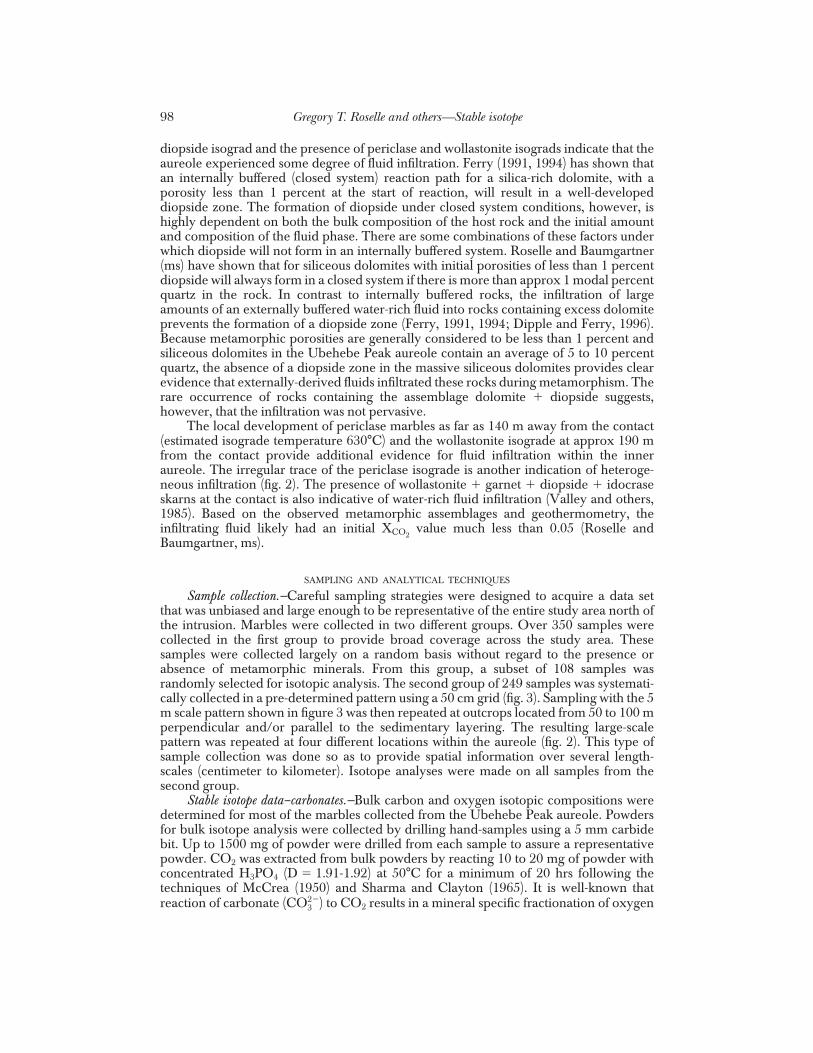
Sample collection.—Careful sampling strategies were designed to acquire a data setthat was unbiased and large enough to be representative of the entire study area north ofthe intrusion. Marbles were collected in two different groups. Over 350 samples werecollected in the first group to provide broad coverage across the study area. Thesesamples were collected largely on a random basis without regard to the presence orabsence of metamorphic minerals. From this group, a subset of 108 samples wasrandomly selected for isotopic analysis. The second group of 249 samples was systemati-cally collected in a pre-determined pattern using a 50 cm grid (fig. 3). Sampling with the 5m scale pattern shown in figure 3 was then repeated at outcrops located from 50 to 100 mperpendicular and/or parallel to the sedimentary layering. The resulting large-scalepattern was repeated at four different locations within the aureole (fig. 2). This type ofsample collection was done so as to provide spatial information over several length-scales (centimeter to kilometer). Isotope analyses were made on all samples from thesecond group.
Stable isotope data–carbonates.—Bulk carbon and oxygen isotopic compositions weredetermined for most of the marbles collected from the Ubehebe Peak aureole. Powdersfor bulk isotope analysis were collected by drilling hand-samples using a 5 mm carbidebit. Up to 1500 mg of powder were drilled from each sample to assure a representativepowder. CO2 was extracted from bulk powders by reacting 10 to 20 mg of powder withconcentrated H3PO4 (D � 1.91-1.92) at 50°C for a minimum of 20 hrs following thetechniques of McCrea (1950) and Sharma and Clayton (1965). It is well-known thatreaction of carbonate (CO3
2�) to CO2 results in a mineral specific fractionation of oxygen
Gregory T. Roselle and others—Stable isotope98
isotopes (Sharma and Clayton, 1965). Thus it is necessary to correct the measured �18Ovalues in the bulk powders for varying amounts of calcite and dolomite. Based on themodal percentage of calcite and dolomite observed in thin sections, the mole fractioncalcite in the bulk sample was estimated. The mole fraction calcite was then used tocorrect the �18O values through a linear mixing relationship.
Separate carbon and oxygen isotopic ratios of coexisting calcite and dolomite wereobtained for a subset of 31 of the grided samples using the differential reaction techniqueas described by Epstein and others (1964) and Al-Aasm and others (1990). Samples wereprepared by crushing several cm3 of sample to a uniformly-sized sand (100-140 meshfraction) which was then washed to remove fine particles. The carbonate sands werereacted with concentrated H3PO4 to release CO2. After the samples reacted at 25°C for1.5 hrs the released CO2 was collected and assumed to represent calcite. The sampleswere then reacted for an additional 22.5 hrs at 25°C to remove all calcite, and theresulting CO2 was discarded. The last step was to react the samples at 50°C for anadditional 24 hrs. The CO2 released in this step was assumed to represent dolomite.
Two samples collected within 10 m of the intrusive contact were sampled atcentimeter-scale to investigate the range in isotopic heterogeneity on the scale of a handsample. This sampling was accomplished by dividing a centimeter-thick slab of the
Fig. 3. Schematic map showing the ideal layout of the gridded sampling. Systematic sampling was doneby placing a 50 cm grid on an outcrop and collecting 29 samples at the preselected points shown on thediagram (where each diamond represents a single sample). This 5 m scale pattern was then moved to 2 or 3other outcrops located approx 50 to 100 m perpendicular and/or parallel to the sedimentary layering, and anadditional 29 samples were collected in the same pattern (see fig. 9). Samples were collected in this large-scale(50-100 m) pattern at the four different locations within the aureole as shown in figure 2.
evidence of heterogeneous fluid infiltration 99
sample into cubes of approx 1 cm3. Separate calcite and dolomite analyses were thenperformed on these samples using the differential reaction techniques described above.
Carbon and oxygen isotopic analyses of CO2 extracted from the samples weremade with a Finnigan MAT 251 mass spectrometer. All oxygen isotopic ratios are givenin standard permil format relative to SMOW (Standard Mean Ocean Water), and allcarbon isotopic ratios are given relative to PDB (PeeDee Belemnite). Eight analyses ofNBS 19 calcite at the time of this study resulted in mean values of 28.72 permil � 0.03(1�) for �18O and 1.91 permil � 0.04 (1�) for �13C. Twenty-six analyses of the Universityof Wisconsin calcite standard yielded mean deviations of �0.16 permil (2�) for �18O and�0.06 permil (2�) for �13C. Mean values of �18O and �13C were within error of theaccepted values as given by Graham and others (1998).
Stable isotope data–Silicates.—Values of �18O were also determined for mineralseparates (quartz, magnetite, clinopyroxene, feldspar) from a single sample of the quartzmonzonite intrusion. The sample was coarsely crushed in a jaw crusher, further reducedto a medium sand in a disk grinder, and washed to remove fine particles. Approx 5 to 20mg of each mineral were separated by hand-picking under a binocular microscope,avoiding fragments containing visible inclusions and alteration products. Mineral sepa-rates were analyzed by laser fluorination at the University of Wisconsin, Madison, asdescribed by Valley and others (1995). The Gore Mountain garnet standard (UWG-2),previously analyzed conventionally and calibrated by laser fluorination against NBS-28quartz, was run concurrently with the samples and was within analytical uncertainty ofthe accepted value of 5.8 permil.
RESULTS
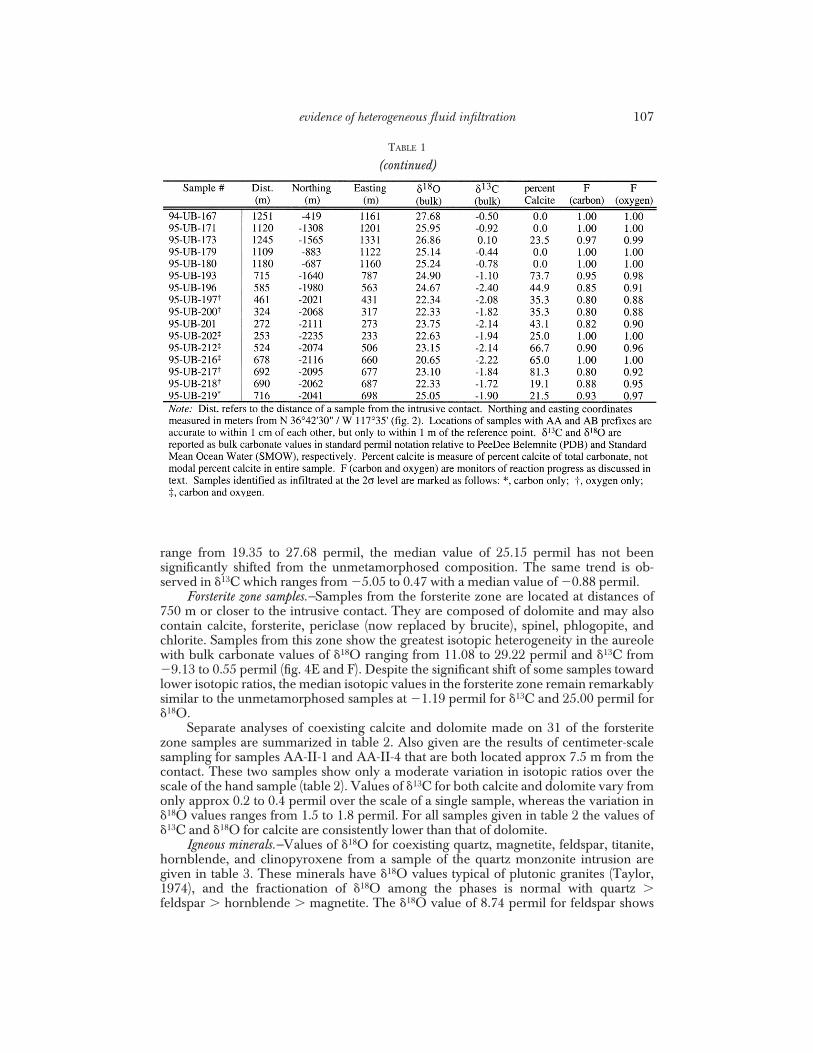
Nearly 400 analyses of �13C and �18O have been made on samples of marble fromthe Ubehebe Peak aureole (table 1). Bulk carbonate values range from 29.22 to 11.08permil (SMOW) for �18O and from 0.55 to �9.13 permil (PDB) for �13C. The sampleshave been divided into three groups: (A) unmetamorphosed zone; (B) tremolite zone;and (C) forsterite zone. The results for each of these groups and the igenous minerals arediscussed below. Previous studies generally consider periclase-bearing samples sepa-rately from the forsterite zone. That is not done in this study because the randomsampling that was used to get a representative picture of the entire aureole resulted inonly 6 periclase-bearing samples being selected for analyses. This is not surprising giventhat periclase-bearing samples represent only a very minor proportion of the aureole,even within a few hundred meters of the contact.
Unmetamorphosed samples.—Samples from the unmetamorphosed zone are located atdistances greater than 1900 m from the intrusive contact. They are composed mainly ofdolomite but may also contain quartz, calcite, phlogopite, chlorite, and K-feldspar. Thesamples exhibit a narrow range of �13C and �18O values as seen in the histograms infigure 4A and B. Values of �18O range from 22.92 to 28.07 permil with a median value of25.49 � 0.82 permil (1�); �13C values range from �2.02 to 0.51 with a median value of�0.38 � 0.55 permil (1�). These median isotopic values for carbon and oxygen areconsistent with measurements of �13C and �18O in Silurian to Devonian age dolomitesworldwide (Veizer and Hoefs, 1976). The 2.5 and 5.2 permil total range in �13C and �18Ovalues, respectively, are typical of the spatial variations in isotopic values observed inother unmetamorphosed carbonates (Land, Salem, and Morrow, 1975; Lohmann, 1988).
Tremolite zone samples.—Tremolite zone samples are located at distances of approx750 to 1900 m from the intrusive contact. In addition to dolomite, they may also containcalcite, tremolite, quartz, phlogopite, chlorite, and minor retrograde talc or diopside.While the tremolite zone samples exhibit a relatively narrow range of bulk carbonate�13C and �18O values similar to the unmetamorphosed dolomites, some samples haveclearly been shifted to lower isotopic values (fig. 4C and D). Although values of �18O
Gregory T. Roselle and others—Stable isotope100
TABLE 1
evidence of heterogeneous fluid infiltration 101
TABLE 1
(continued)
Gregory T. Roselle and others—Stable isotope102
TABLE 1
(continued)
evidence of heterogeneous fluid infiltration 103
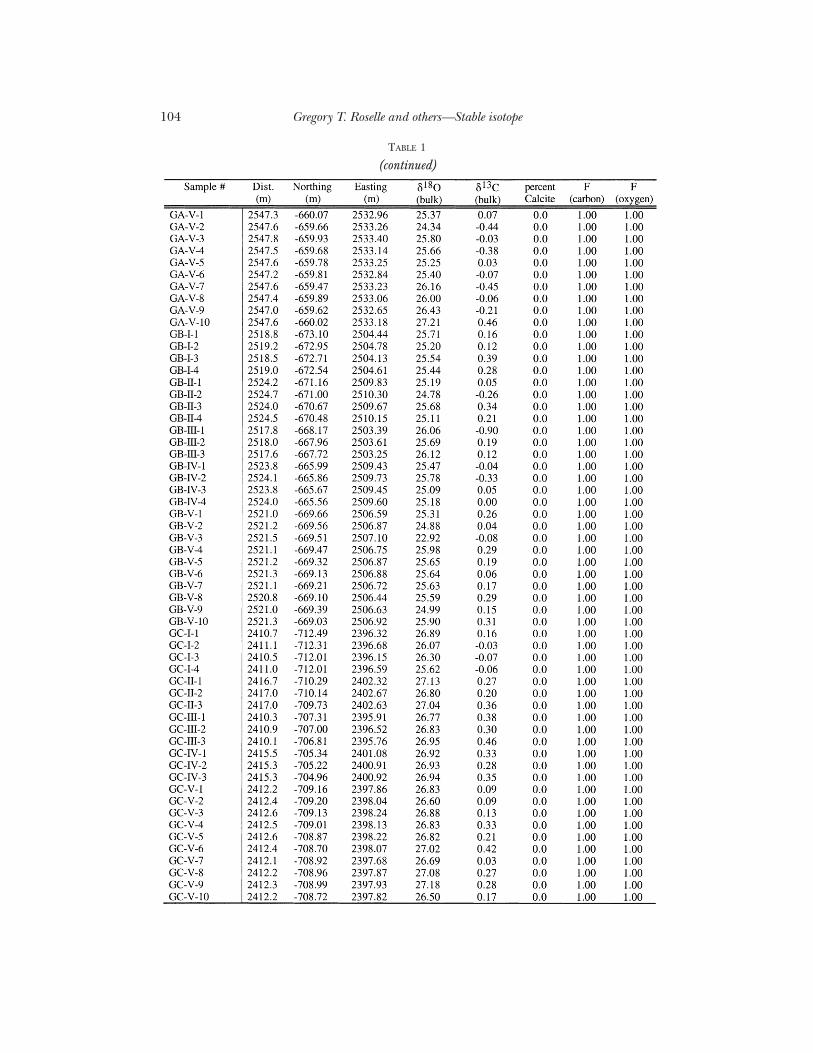
TABLE 1
(continued)
Gregory T. Roselle and others—Stable isotope104
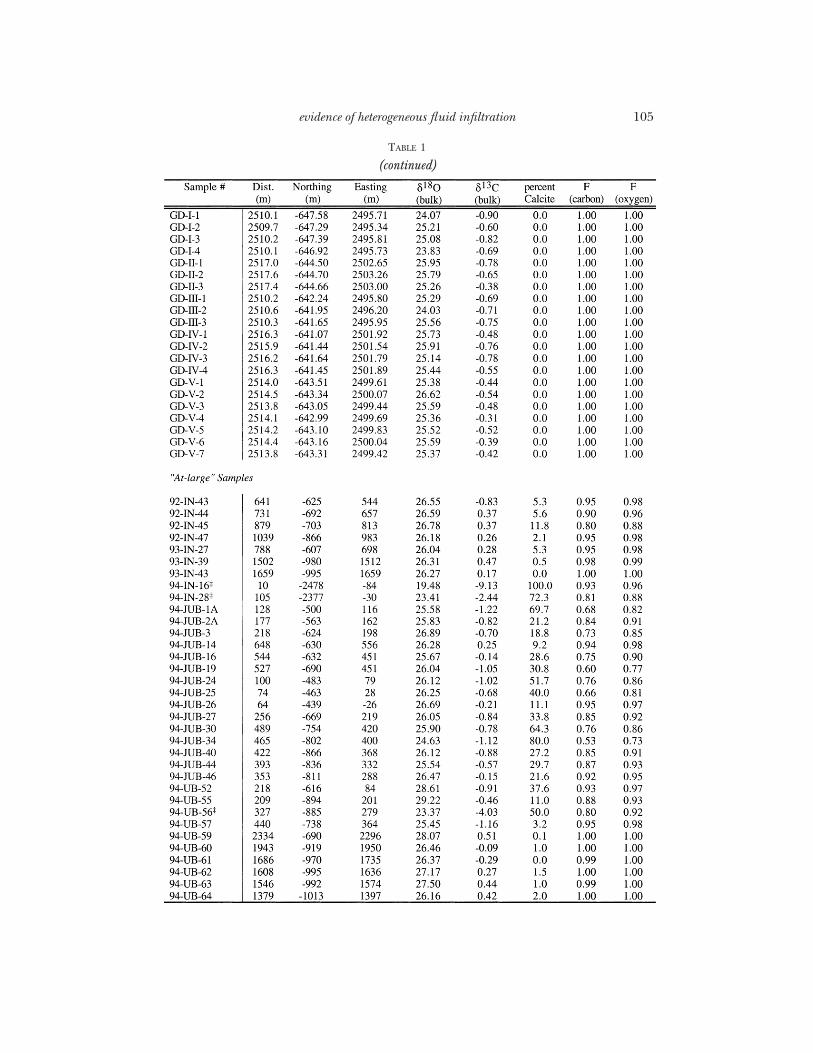
TABLE 1
(continued)
evidence of heterogeneous fluid infiltration 105
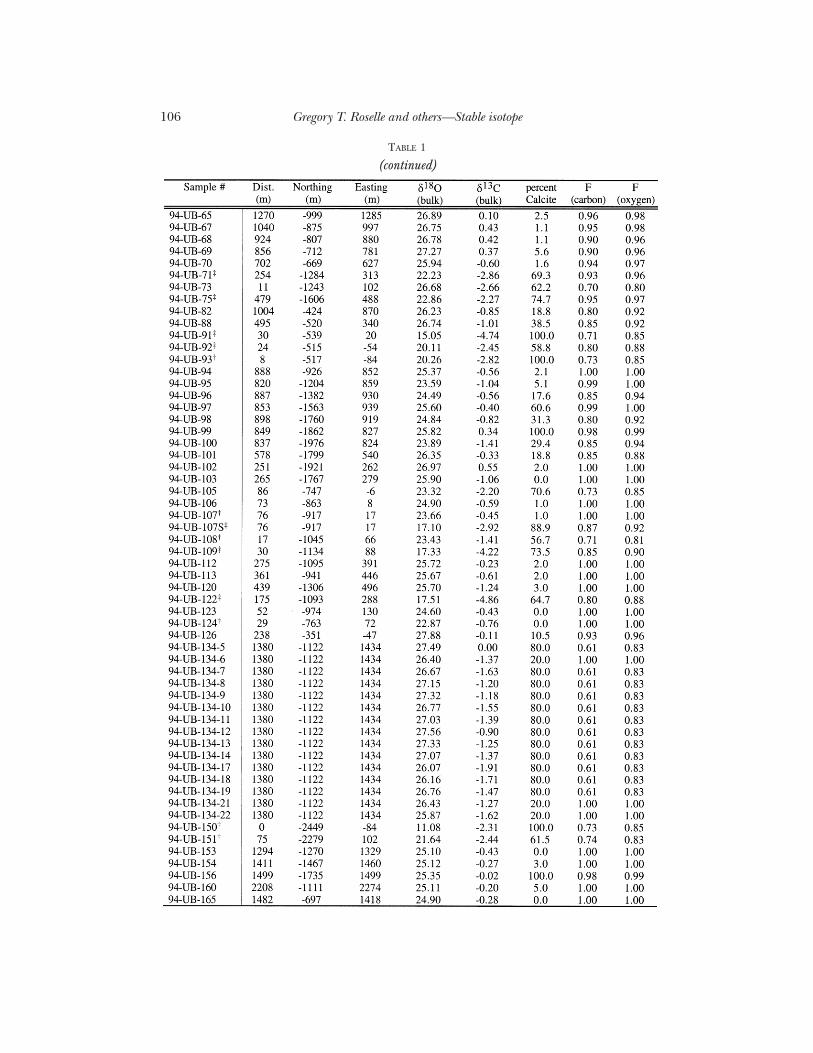
TABLE 1
(continued)
Gregory T. Roselle and others—Stable isotope106
range from 19.35 to 27.68 permil, the median value of 25.15 permil has not beensignificantly shifted from the unmetamorphosed composition. The same trend is ob-served in �13C which ranges from �5.05 to 0.47 with a median value of �0.88 permil.
Forsterite zone samples.—Samples from the forsterite zone are located at distances of750 m or closer to the intrusive contact. They are composed of dolomite and may alsocontain calcite, forsterite, periclase (now replaced by brucite), spinel, phlogopite, andchlorite. Samples from this zone show the greatest isotopic heterogeneity in the aureolewith bulk carbonate values of �18O ranging from 11.08 to 29.22 permil and �13C from�9.13 to 0.55 permil (fig. 4E and F). Despite the significant shift of some samples towardlower isotopic ratios, the median isotopic values in the forsterite zone remain remarkablysimilar to the unmetamorphosed samples at �1.19 permil for �13C and 25.00 permil for�18O.
Separate analyses of coexisting calcite and dolomite made on 31 of the forsteritezone samples are summarized in table 2. Also given are the results of centimeter-scalesampling for samples AA-II-1 and AA-II-4 that are both located approx 7.5 m from thecontact. These two samples show only a moderate variation in isotopic ratios over thescale of the hand sample (table 2). Values of �13C for both calcite and dolomite vary fromonly approx 0.2 to 0.4 permil over the scale of a single sample, whereas the variation in�18O values ranges from 1.5 to 1.8 permil. For all samples given in table 2 the values of�13C and �18O for calcite are consistently lower than that of dolomite.
Igneous minerals.—Values of �18O for coexisting quartz, magnetite, feldspar, titanite,hornblende, and clinopyroxene from a sample of the quartz monzonite intrusion aregiven in table 3. These minerals have �18O values typical of plutonic granites (Taylor,1974), and the fractionation of �18O among the phases is normal with quartz �feldspar � hornblende � magnetite. The �18O value of 8.74 permil for feldspar shows
TABLE 1
(continued)
evidence of heterogeneous fluid infiltration 107
Fig. 4. Histograms of �13C and �18O values for three groups divided according to metamorphic grade.Unmetamorphosed samples (A and B) occur more than 1900 m from the intrusive contact; tremolite zonesamples (C and D) are located approx 750 to 1900 m from the contact; and forsterite zone samples (E and F) arefound closer than 750 m to the contact. The unmetamorphosed data show a narrow range in isotopiccomposition with median values of �13C � �0.38 � 0.55 permil (1�) and �18O � 25.49 � 0.82 permil (1�).Histograms for the tremolite zone are slightly skewed toward lower values, but the median values of �13C and�18O are not significantly different from the unmetamorphosed samples. In the forsterite zone, samples havebeen isotopically shifted to even lower values. However, most samples still retain their sedimentary isotopicsignature. The isotopic shifts toward lower values with increasing proximity to the intrusion are likely due toinfiltration of magmatic fluids.
this sample did not experience any significant interaction with heated meteoric water(Taylor, 1974). The �18O fractionation between magnetite, clinopyroxene, potassiumfeldspar, and quartz yields a well-constrained temperature of 675°C (fig. 5) using thefractionation data reported by Chiba and others (1989) and Matthews (1994). Thistemperature is inconsistent with the thermal models of the aureole calibrated againstcalcite-dolomite thermometry and likely represents a sub-solidus temperature due todiffusive isotopic exchange on cooling of the pluton (Eiler, Valley, and Baumgartner,1993).
TABLE 2
�13C and �18O values of coexisting calcite and dolomite for marbles from the Ubehebe Peakcontact aureole
Gregory T. Roselle and others 109
DISCUSSION
Source of isotopic alteration.—The shift toward lower carbon and oxygen isotopicvalues within the aureole can be the result of a number of different processes. Mostmetamorphic reactions occurring in siliceous dolomites release volatiles (H2O and CO2)as reaction products. The process of devolatilization fractionates carbon and oxygenisotopes between the host rock and volatile phase, and, as a result, the �13C and �18Ovalues of the host rock are lowered (Rumble, 1982; Valley, 1986). The �13C of carbonates
Fig. 5. Near-equilibrium fractionation of �18O among coexisting igneous minerals from the Ubehebe Peakquartz monzonite defines a temperature of approx 675°C. The fractionation likely represents a sub-solidustemperature due to diffusive exchange upon cooling of the pluton (Eiler, Valley, and Baumgartner, 1993). Therelationship between mineral-pair fractionations and temperature is given by the equation: 1000 ln �mineral�mt �A 106/T2 (K), where the coefficient A is obtained from experimental data. The value for the coefficientAfsp�mt is taken from the formulation of Matthews (1994); all other A coefficients are from Chiba and others(1989). Legend: Mt - magnetite; Cpx - clinopyroxene; Fsp - feldspar; Qtz - quartz.
TABLE 3
�18O values for mineral separates from the Ubehebe Peak intrusion
Mineral �18O
Quartz 9.99Magnetite 2.73Feldspar 8.74Clinopyroxene 6.61Titanite 6.16Hornblende 6.84
Note: All values of �18O in units of permil relative to SMOW. UWG-2 �5.75 � 0.09 permil (1�), n � 8; calibrated value � 5.8 � 0.1 permil.
Gregory T. Roselle and others—Stable isotope110
can also be lowered by exchange with graphite or organic matter. Because of the highcarbon content and low initial �13C values (��25 permil) of organic matter, exchangewith only minor amounts of graphite or organics can have a pronounced effect on theisotopic composition of the host carbonates (Valley, 1986). Values of �13C and �18O canalso be lowered by infiltration and exchange with externally derived fluids having aisotopic composition different from the host rocks.
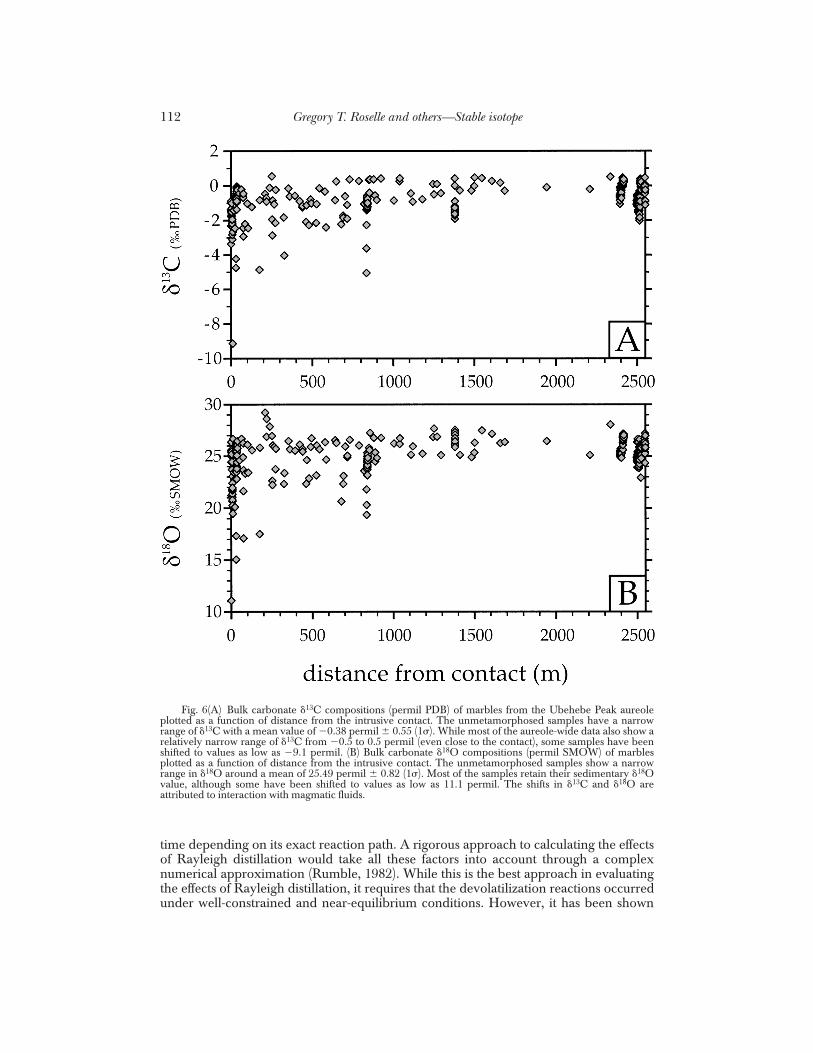
Bulk carbonate values of �13C and �18O in the Ubehebe Peak aureole show cleartrends toward lower values with increasing proximity to the intrusive contact (fig. 6Aand B). While the reaction progress of devolatilization reactions increases toward theintrusion, these reactions cannot produce an isotopic depletion of 14 permil in �18O asobserved at Ubehebe Peak (Valley, 1986). Because graphite does not occur in the highgrade carbonates at Ubehebe Peak, the lowering of the �13C values by as much as 9permil cannot be attributed to exchange between the carbonates and graphite. There-fore, much of the observed isotopic depletion likely resulted from the infiltration ofexternally derived fluids. A meteoric source for these fluids is unlikely since the �18Ovalues of the igneous minerals show no evidence of interaction with meteoric fluid(table 3). The absence of a meteoric source and the proximity of the infiltrated samples tothe intrusive contact (fig. 6A and B) suggest that magmatic fluids were most likelyresponsible for the observed isotopic depletion in the host marbles at Ubehebe Peak. Amagmatic fluid in equilibrium with the measured isotopic composition of the igneousminerals (table 3) would have had a �18O value of 9.18 permil at a temperature of 700°C(O’Neil and Taylor, 1967). The value of �13C in the magmatic fluid is not well-constrained by the igneous mineralogy, but typical values of �7.0 to �10.0 permil canbe assumed (Valley, 1986). Infiltration of a magmatic fluid with this isotopic compositionwould explain the observed shift in isotopic values of the host carbonates at UbehebePeak.
Extent of infiltration.—The heterogeneous distribution of isotopic values across theaureole (figs. 4 and 6) shows that while some samples have clearly been infiltrativelyaltered, many experienced little or no infiltration and exchange. An accurate understand-ing of the nature of the magmatic infiltration in the host marbles requires identification ofthe samples that have been infiltratively altered. Although samples with isotopiccompositions lower than the unmetamorphosed host rock could be considered infiltra-tively altered, fractionation due to devolatilization reactions must also account for someof the observed isotopic depletion. As a result, the first step in evaluating the nature of thefluid infiltration is to discount any samples whose isotopic shifts can be solely attributedto devolatilization reactions. This approach allows the minimum number of infiltrativelyaltered samples to be identified.
Two endmember devolatilization models, batch and Rayleigh distillation, thatpredict changes in the isotopic composition of the host rock and released volatiles as afunction of increasing reaction progress (Valley, 1986), have been prescribed. Inpractice, a monitor of reaction progress known as the F value is used. It is defined as themole fraction of the element of interest that remains in the rock after devolatilization. Forthis study the Rayleigh distillation model (Broecker and Oversby, 1971) was chosenbecause it will provide a maximum estimate of the effects of devolatilization and thus aconservative estimate of the effects of fluid infiltration. The F value for each of thesamples from Ubehebe Peak was determined from the modal abundance of reactionproducts based on visual estimates or point counting of thin sections. The resulting Fvalues range from 1.0 to 0.53 for carbon and from 1.0 to 0.73 for oxygen (table 1).
A potential limitation in using the Rayleigh distillation model arises because it isonly valid for constant values of the fluid-rock fractionation factor, �. In reality, � is afunction of many variables such as temperature, mineral assemblage, reaction progress,and fluid composition. As a result the value of � for each sample will change through
evidence of heterogeneous fluid infiltration 111
time depending on its exact reaction path. A rigorous approach to calculating the effectsof Rayleigh distillation would take all these factors into account through a complexnumerical approximation (Rumble, 1982). While this is the best approach in evaluatingthe effects of Rayleigh distillation, it requires that the devolatilization reactions occurredunder well-constrained and near-equilibrium conditions. However, it has been shown
Fig. 6(A) Bulk carbonate �13C compositions (permil PDB) of marbles from the Ubehebe Peak aureoleplotted as a function of distance from the intrusive contact. The unmetamorphosed samples have a narrowrange of �13C with a mean value of �0.38 permil � 0.55 (1�). While most of the aureole-wide data also show arelatively narrow range of �13C from �0.5 to 0.5 permil (even close to the contact), some samples have beenshifted to values as low as �9.1 permil. (B) Bulk carbonate �18O compositions (permil SMOW) of marblesplotted as a function of distance from the intrusive contact. The unmetamorphosed samples show a narrowrange in �18O around a mean of 25.49 permil � 0.82 (1�). Most of the samples retain their sedimentary �18Ovalue, although some have been shifted to values as low as 11.1 permil. The shifts in �13C and �18O areattributed to interaction with magmatic fluids.
Gregory T. Roselle and others—Stable isotope112
that mineral growth (especially forsterite) during metamorphism at Ubehebe Peak waslikely not close to equilibrium (Roselle, Barmgartner, and Chapman, 1997). Thereforethe use of a more simplistic approach which assumes a constant value of � is warranted.
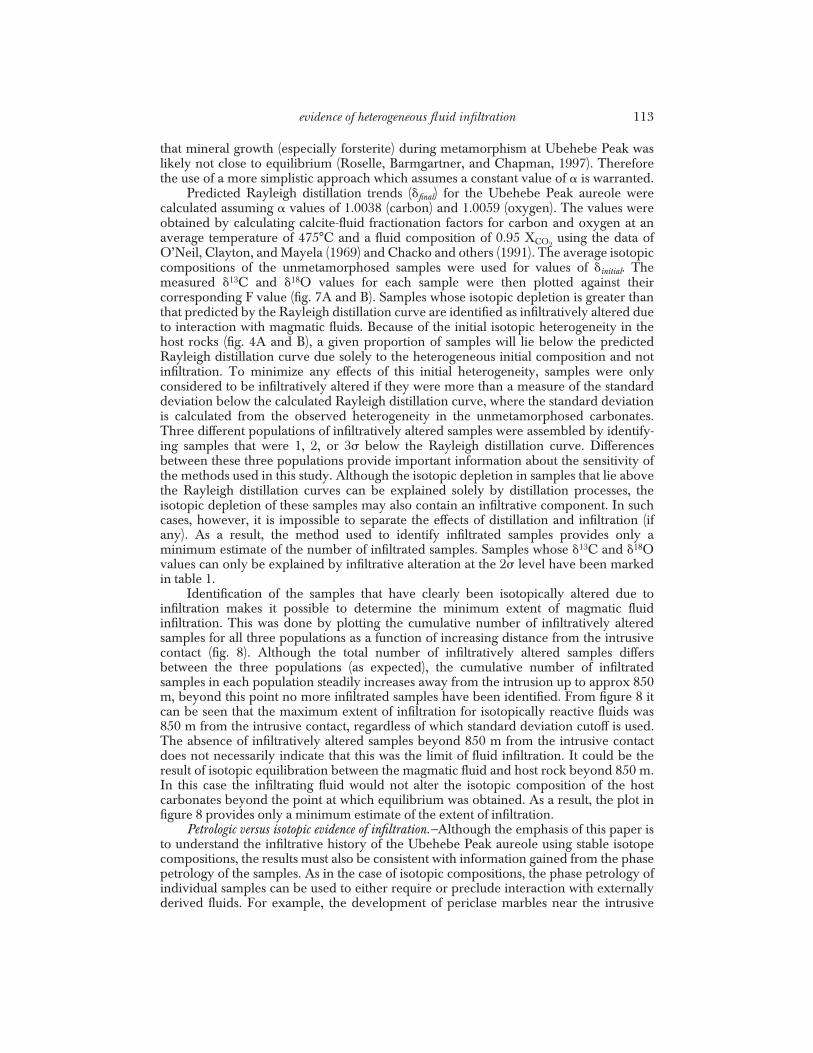
Predicted Rayleigh distillation trends (�final) for the Ubehebe Peak aureole werecalculated assuming � values of 1.0038 (carbon) and 1.0059 (oxygen). The values wereobtained by calculating calcite-fluid fractionation factors for carbon and oxygen at anaverage temperature of 475°C and a fluid composition of 0.95 XCO2
using the data ofO’Neil, Clayton, and Mayela (1969) and Chacko and others (1991). The average isotopiccompositions of the unmetamorphosed samples were used for values of �initial. Themeasured �13C and �18O values for each sample were then plotted against theircorresponding F value (fig. 7A and B). Samples whose isotopic depletion is greater thanthat predicted by the Rayleigh distillation curve are identified as infiltratively altered dueto interaction with magmatic fluids. Because of the initial isotopic heterogeneity in thehost rocks (fig. 4A and B), a given proportion of samples will lie below the predictedRayleigh distillation curve due solely to the heterogeneous initial composition and notinfiltration. To minimize any effects of this initial heterogeneity, samples were onlyconsidered to be infiltratively altered if they were more than a measure of the standarddeviation below the calculated Rayleigh distillation curve, where the standard deviationis calculated from the observed heterogeneity in the unmetamorphosed carbonates.Three different populations of infiltratively altered samples were assembled by identify-ing samples that were 1, 2, or 3� below the Rayleigh distillation curve. Differencesbetween these three populations provide important information about the sensitivity ofthe methods used in this study. Although the isotopic depletion in samples that lie abovethe Rayleigh distillation curves can be explained solely by distillation processes, theisotopic depletion of these samples may also contain an infiltrative component. In suchcases, however, it is impossible to separate the effects of distillation and infiltration (ifany). As a result, the method used to identify infiltrated samples provides only aminimum estimate of the number of infiltrated samples. Samples whose �13C and �18Ovalues can only be explained by infiltrative alteration at the 2� level have been markedin table 1.
Identification of the samples that have clearly been isotopically altered due toinfiltration makes it possible to determine the minimum extent of magmatic fluidinfiltration. This was done by plotting the cumulative number of infiltratively alteredsamples for all three populations as a function of increasing distance from the intrusivecontact (fig. 8). Although the total number of infiltratively altered samples differsbetween the three populations (as expected), the cumulative number of infiltratedsamples in each population steadily increases away from the intrusion up to approx 850m, beyond this point no more infiltrated samples have been identified. From figure 8 itcan be seen that the maximum extent of infiltration for isotopically reactive fluids was850 m from the intrusive contact, regardless of which standard deviation cutoff is used.The absence of infiltratively altered samples beyond 850 m from the intrusive contactdoes not necessarily indicate that this was the limit of fluid infiltration. It could be theresult of isotopic equilibration between the magmatic fluid and host rock beyond 850 m.In this case the infiltrating fluid would not alter the isotopic composition of the hostcarbonates beyond the point at which equilibrium was obtained. As a result, the plot infigure 8 provides only a minimum estimate of the extent of infiltration.
Petrologic versus isotopic evidence of infiltration.—Although the emphasis of this paper isto understand the infiltrative history of the Ubehebe Peak aureole using stable isotopecompositions, the results must also be consistent with information gained from the phasepetrology of the samples. As in the case of isotopic compositions, the phase petrology ofindividual samples can be used to either require or preclude interaction with externallyderived fluids. For example, the development of periclase marbles near the intrusive
evidence of heterogeneous fluid infiltration 113
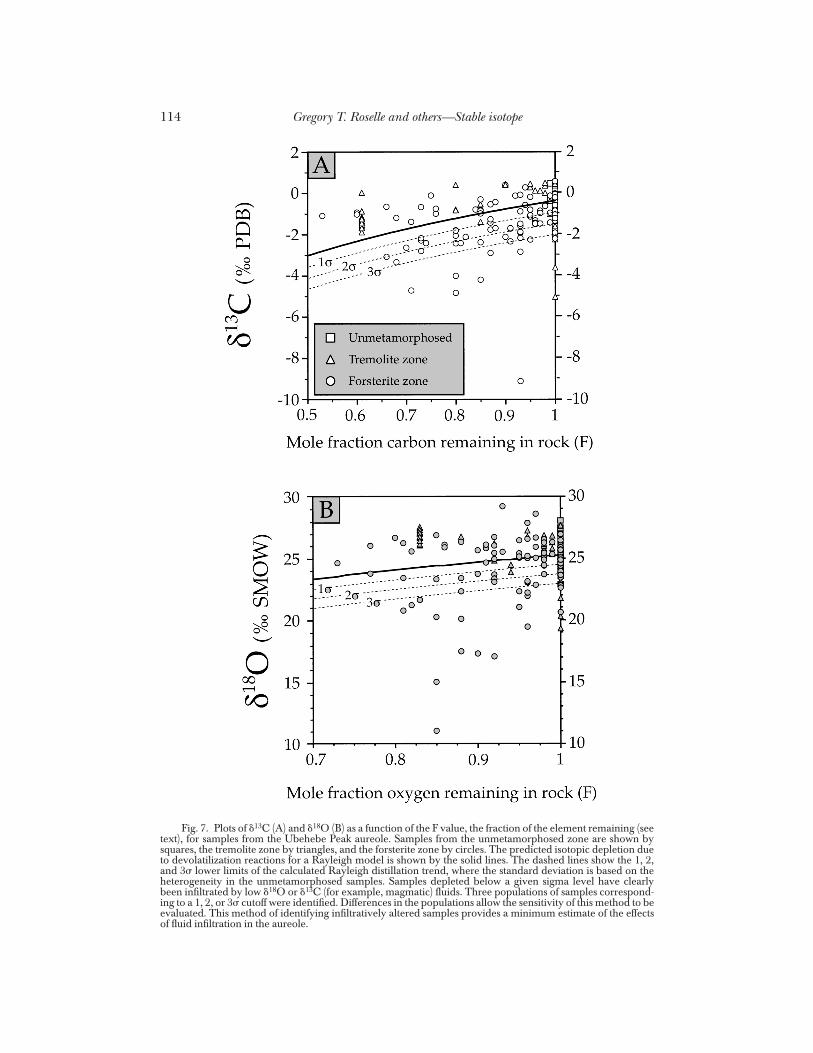
Fig. 7. Plots of �13C (A) and �18O (B) as a function of the F value, the fraction of the element remaining (seetext), for samples from the Ubehebe Peak aureole. Samples from the unmetamorphosed zone are shown bysquares, the tremolite zone by triangles, and the forsterite zone by circles. The predicted isotopic depletion dueto devolatilization reactions for a Rayleigh model is shown by the solid lines. The dashed lines show the 1, 2,and 3� lower limits of the calculated Rayleigh distillation trend, where the standard deviation is based on theheterogeneity in the unmetamorphosed samples. Samples depleted below a given sigma level have clearlybeen infiltrated by low �18O or �13C (for example, magmatic) fluids. Three populations of samples correspond-ing to a 1, 2, or 3� cutoff were identified. Differences in the populations allow the sensitivity of this method to beevaluated. This method of identifying infiltratively altered samples provides a minimum estimate of the effectsof fluid infiltration in the aureole.
Gregory T. Roselle and others—Stable isotope114
contact provides ubiquitous evidence for the infiltration of water-rich fluids into the hostrocks. The distribution of periclase-bearing samples at Ubehebe Peak is, however, veryheterogeneous with the periclase isograd ranging from being nonexistent to 140 m fromthe contact (fig. 2). Just as periclase-bearing samples require fluid infiltration, thepresence of periclase-free dolomites immediately adjacent to the intrusion generallyprecludes infiltration of water-rich fluids into those samples. This evidence for heteroge-neous fluid infiltration, as deduced from the phase petrology, provides an excellent caseto test the consistency of the isotopic and petrologic data.
For the infiltration of a water-rich fluid into siliceous dolomites, transport theorypredicts that a periclase reaction front should move through the host rock significantlyfaster than an oxygen isotope alteration front (Ferry and Rumble, 1997). Thus theexistence of periclase-bearing samples that show no isotopic evidence of infiltrationwould not be unusual. Periclase-free dolomites within the periclase zone that show
Fig. 8. The cumulative number of infiltratively altered samples for the 1� (open symbols), 2� (light gray),and 3� (dark gray) populations plotted as a function of increasing distance away from the intrusive contact.Approximate locations of the tremolite (Tr), forsterite (Fo), and periclase (Per) isograds are also shown. Foreach of the populations the number of infiltratively altered samples steadily increases as a function of distancefrom the intrusion. However, beyond approx 850 m no more infiltratively altered samples are observed,regardless of the standard deviation cutoff. This plot indicates that the maximum extent of infiltration forisotopically distinct magmatic fluids is approx 850 m from the intrusive contact.
evidence of heterogeneous fluid infiltration 115
isotopic evidence for infiltration would, on the other hand, be very surprising. Given theheterogeneity of the periclase isograd at Ubehebe Peak it is difficult to define a distinctpericlase zone. For the purposes of this comparison, the ‘‘periclase zone’’ is defined asbeing all samples which are less than 140 m (the farthest extent of periclase-bearingsamples) from the intrusive contact. There are 70 samples within this ‘‘periclase zone’’only 6 of which contain periclase (now replaced by brucite). The rest of the samples arecomposed either entirely of dolomite (25 samples), the assemblage calcite � forsterite �dolomite (35 samples), the assemblage calcite � forsterite (2 samples), or represent skarncalcite (2 samples). The isotopic compositions of the periclase-bearing samples rangefrom 17.33 to 26.68 permil (oxygen) and �4.22 to �1.41 permil (carbon). Five of thesesamples can be considered as infiltratively altered. The compositions of the 25 puredolomite samples range from 22.80 to 26.42 permil for oxygen and �1.36 to �0.05permil for carbon, well within the initial heterogeneity of the host rocks (fig. 4A and B).Of the 60 dolomite-bearing, periclase-free samples, 3 can be considered infiltrativelyaltered with respect to oxygen and carbon at the 2� level while 7 are altered only inoxygen composition. The samples with only oxygen alteration all lie very near the limitof Rayleigh distillation effects, and when the more restrictive 3� criteria is used none ofthese samples would be considered infiltratively altered. The three samples that exhibitalteration in both carbon and oxygen are, however, below even the 3� limit. For thesesamples to have been infiltrated and still not develop periclase, the infiltrating fluidwould have to be relatively CO2-rich. Since these three samples are the only dolomite-bearing, periclase-free samples that exhibit alteration in both carbon and oxygen, this islikely the best explanation. The necessary CO2-rich fluids probably originated from thedestruction of carbonate at the contact during skarn formation. Thus the isotopiccompositions of samples within the ‘‘periclase zone’’ at Ubehebe Peak are in agreementwith predictions based on the phase petrology.
Another assemblage within the massive dolomites that places restrictions on fluidinfiltration is diopside � dolomite. As discussed above, the formation of diopside in themassive dolomites is indicative of either closed system conditions or very small amountsof fluid infiltration. There are only 5 of approx 280 samples from the massive dolomitesthat contain the assemblage diopside � dolomite. Isotopic compositions were measuredfor 3 of these samples (94-UB-98, 92-IN-43, 92-IN-45), and, consistent with the petrol-ogy, none of them shows evidence of infiltrative alteration. A final petrologic criterion forfluid infiltration is the assemblage tremolite � calcite. Except for very small modaltremolite contents, the formation of tremolite � calcite at expense of dolomite � quartzrequires fluid infiltration. In the outermost tremolite zone of the Ubehebe Peak aureoletremolite contents are generally less than 3 modal percent, suggestive of a closed system.Large tremolite modal contents and textures that are clearly indicative of fluid infiltration(Baumgartner and others, 1996) appear at distances as far as approx 1400 m from thecontact. This highlights the fact that the 850 m limit of infiltrative isotopic alteration doesnot necessarily reflect the farthest extent of fluid infiltration. The fluids required atdistances of 850 to 1400 m were either locally derived or, more likely, in isotopeexchange equilibrium with the dolomites but not in chemical equilibrium. Although theisotopic and petrologic data are generally in agreement regarding which samplesexperienced fluid infiltration, the tremolite zone data emphasize that the limits placed onfluid infiltration in this study can only be taken as minimum estimates.
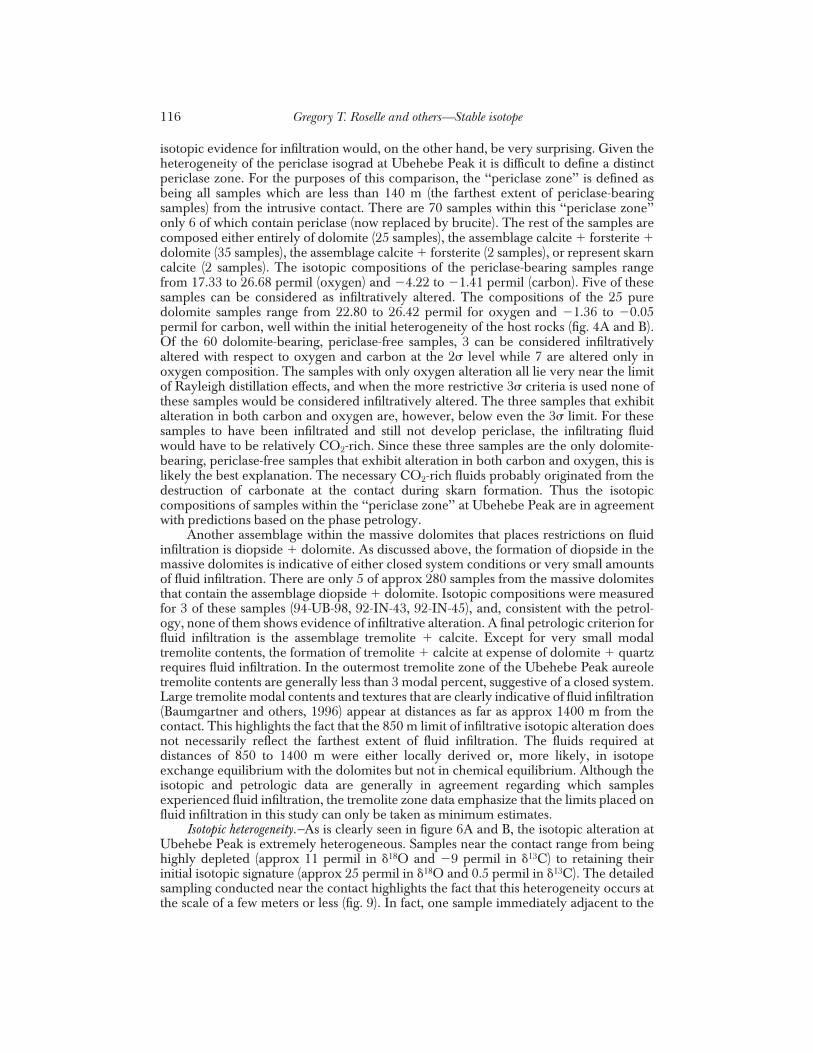
Isotopic heterogeneity.—As is clearly seen in figure 6A and B, the isotopic alteration atUbehebe Peak is extremely heterogeneous. Samples near the contact range from beinghighly depleted (approx 11 permil in �18O and �9 permil in �13C) to retaining theirinitial isotopic signature (approx 25 permil in �18O and 0.5 permil in �13C). The detailedsampling conducted near the contact highlights the fact that this heterogeneity occurs atthe scale of a few meters or less (fig. 9). In fact, one sample immediately adjacent to the
Gregory T. Roselle and others—Stable isotope116
intrusion retains its sedimentary isotopic composition (AA-I-4) while another sample lessthan a meter away shows clear evidence of infiltration (AA-I-2). A similar scale inheterogeneity is also observed in sample group AA-II (fig. 9).
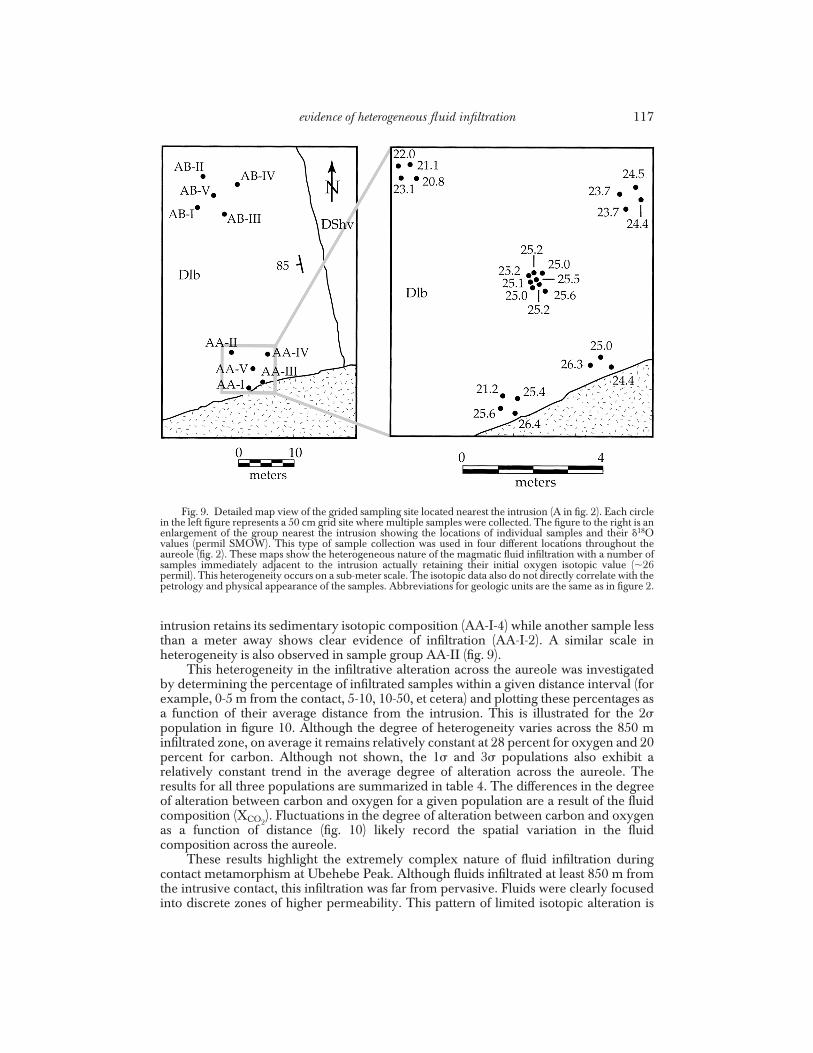
This heterogeneity in the infiltrative alteration across the aureole was investigatedby determining the percentage of infiltrated samples within a given distance interval (forexample, 0-5 m from the contact, 5-10, 10-50, et cetera) and plotting these percentages asa function of their average distance from the intrusion. This is illustrated for the 2�population in figure 10. Although the degree of heterogeneity varies across the 850 minfiltrated zone, on average it remains relatively constant at 28 percent for oxygen and 20percent for carbon. Although not shown, the 1� and 3� populations also exhibit arelatively constant trend in the average degree of alteration across the aureole. Theresults for all three populations are summarized in table 4. The differences in the degreeof alteration between carbon and oxygen for a given population are a result of the fluidcomposition (XCO2
). Fluctuations in the degree of alteration between carbon and oxygenas a function of distance (fig. 10) likely record the spatial variation in the fluidcomposition across the aureole.
These results highlight the extremely complex nature of fluid infiltration duringcontact metamorphism at Ubehebe Peak. Although fluids infiltrated at least 850 m fromthe intrusive contact, this infiltration was far from pervasive. Fluids were clearly focusedinto discrete zones of higher permeability. This pattern of limited isotopic alteration is
Fig. 9. Detailed map view of the grided sampling site located nearest the intrusion (A in fig. 2). Each circlein the left figure represents a 50 cm grid site where multiple samples were collected. The figure to the right is anenlargement of the group nearest the intrusion showing the locations of individual samples and their �18Ovalues (permil SMOW). This type of sample collection was used in four different locations throughout theaureole (fig. 2). These maps show the heterogeneous nature of the magmatic fluid infiltration with a number ofsamples immediately adjacent to the intrusion actually retaining their initial oxygen isotopic value (�26permil). This heterogeneity occurs on a sub-meter scale. The isotopic data also do not directly correlate with thepetrology and physical appearance of the samples. Abbreviations for geologic units are the same as in figure 2.
evidence of heterogeneous fluid infiltration 117
consistent with the results of stable isotope transport modeling which assumes aheterogeneous permeability distribution in the host rocks (Gerdes, Baumgartner, andPerson, 1995b). While this focusing is suggestive of fluid flow along open fractures, noclear large-scale vein systems have been observed in the field. Instead it appears that theinfiltrating fluids were focused into relatively diffuse (as compared to an open fracture)yet limited zones of higher permeability. These higher permeability zones may reflectthe original heterogeneous permeability of the unmetamorphosed carbonates. Suchprimary control of fluid infiltration by the host rock may also explain why the degree ofalteration remains relatively constant across the aureole.
Fig. 10. The degree of heterogeneity in isotopic alteration across the aureole was evaluated by dividingthe aureole into bins defined by a given distance interval from the intrusion (for example, 0-25m, 25-50m,100-200m, et cetera). The percentage of infiltratively altered samples within each bin can then be plotted as afunction of the distance of the bin from the intrusive contact. A three point moving average of data from the 2�level is plotted above as a function of the average distance from the intrusive contact. A distance interval of 25m was used within the first 100 m from the intrusive contact and thereafter an interval of 100 m. Although thereis scatter in the values across the aureole, on average the degree of heterogeneity remains relatively constant atonly 20 percent for carbon and 28 percent for oxygen. The differences in the degree of alteration betweenoxygen and carbon are a result of the XCO2
composition of the infiltrating fluid. The 1 and 3� populationsexhibit the same trend of having an approximately constant degree of heterogeneity (see table 4 for values).
TABLE 4
Average percentage of samples within the 850 m zone considered to be infiltratively altered
Population
1� 2� 3�
�13C 31.9 20.2 13.5�18O 43.2 27.8 16.5
Gregory T. Roselle and others—Stable isotope118
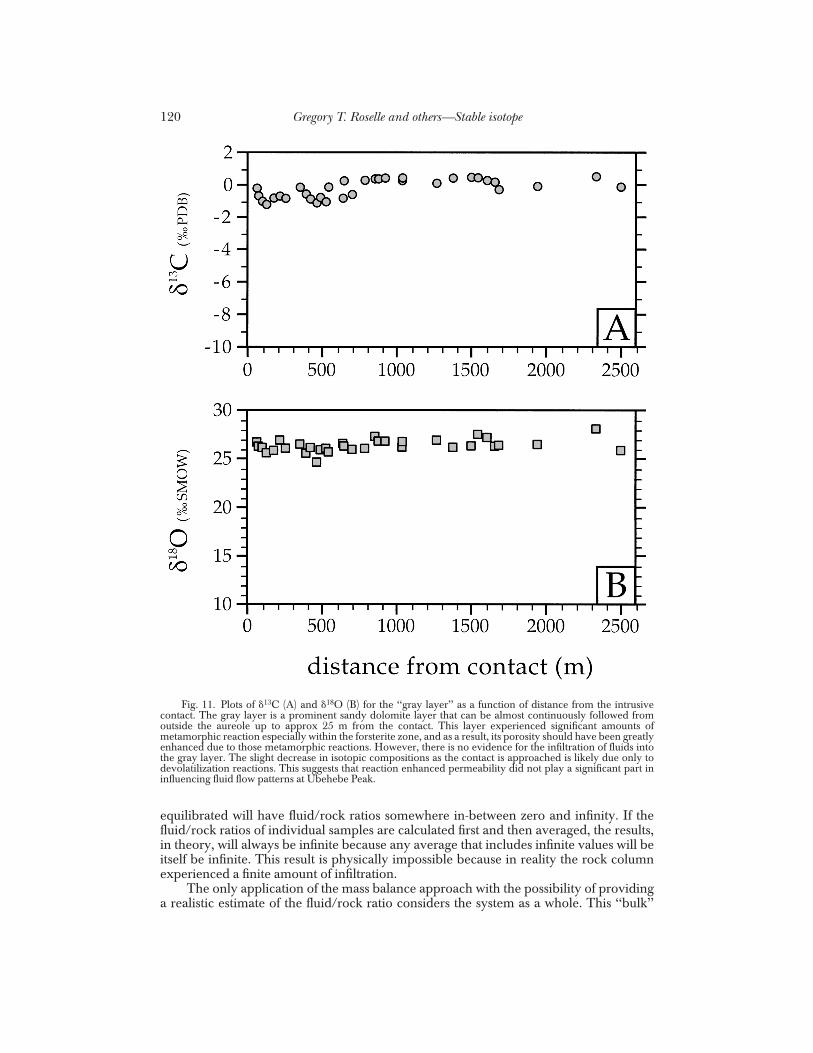
Another possibility is that these infiltration zones are the result of reaction enhancedpermeability due to the heterogeneous distribution of quartz in the massive dolomites atUbehebe Peak. Zones with higher quartz contents likely experienced higher amounts ofreaction which resulted in increased permeabilities due to the negative volume change ofsolids for most metamorphic reactions in siliceous dolomites. If reaction enhancedpermeability were a significant factor in the development of metamorphic permeabilitythen a correlation between isotope values and reaction progress would be expected.From figure 7A and B it can be seen, however, that there is no clear correlation betweenthe F value (reaction progress) and the amount of isotopic depletion. Additional evidenceagainst significant reaction enhanced permeability comes from a horizon at the top of theHidden Valley Dolomite known as the ‘‘gray layer.’’ This unit is a prominent mediumgray, sandy dolomite layer that contains 5 to 10 percent quartz. It can be followed fromoutside the aureole up to approx 25 m from the contact with over 90 percent exposure.Because of its quartz content the ‘‘gray layer’’ experienced significant amounts ofreaction with an average of 15 modal percent forsterite in the forsterite zone and 5percent tremolite in the tremolite zone. If reaction enhanced permeability were impor-tant this layer should have experienced significant amounts of fluid infiltration. How-ever, none of the samples analyzed from the gray layer shows any isotopic evidence forfluid infiltration (fig. 11 A and B). The only isotopic shifts observed in the data are likelydue to devolatilization processes. This suggests that enhancement of permeability bydevolatilization reactions did not significantly influence fluid flow patterns at UbehebePeak. Regardless of the source of the permeability, the Ubehebe Peak data clearlydocument the importance of heterogeneous permeability in contact metamorphic fluidflow.
Amount and composition of infiltrating fluid.—With the information on the extent anddegree of isotopic alteration within the Ubehebe Peak marbles, estimates can be made asto the amount and composition of the fluid that infiltrated the aureole. The lack of a clearinfiltration front due to heterogeneous permeability precludes the use of one-dimensional models (Bickle and McKenzie, 1987; Baumgartner and Rumble, 1988;Dipple and Ferry, 1992; and Bowman, Willett, and Cook, 1994), and a two-dimensionalapproach would only be useful with an accurate knowledge of the permeability distribu-tion and flow direction (Gerdes and others, 1995). Until quantitative information on thespatial distribution and range of permeability values is known, the best way to estimatethe amount of infiltrating fluid may be through a mass balance approach (Taylor, 1977).Although this method is frequently used in fluid infiltration studies, it can be shown thatthe application of the mass balance approach is valid only under very restrictedconditions (Baumgartner, 1987).
The use of mass balance models in understanding fluid infiltration has beencriticized for a number of reasons (Baumgartner, 1987; Baumgartner and Rumble, 1988;Baumgartner and Ferry, 1991). The most important of these criticisms is that fluid/rockratios are meaningless unless applied under very specific conditions. This can beillustrated using the example of a one-dimensional model of fluid infiltration into ahomogeneous column of rock (fig. 12A). The infiltrating fluid has an isotopic composi-tion lower than that of the host rock resulting in the development of a clear infiltrationfront. This system can be divided into three parts: (i ) rocks which have completelyequilibrated with the fluid; (ii ) rocks that have partially equilibrated with the infiltratingfluid; and (iii ) rocks which remain unchanged (fig. 12A). Traditionally, the fluid/rockratio of the system would now be estimated by calculating a fluid/rock ratio for eachsample collected from the system and then taking the average of the resulting fluid/rockratios. The problem with this type of approach is illustrated in figure 12B. Calculatedfluid/rock ratios will range from infinity for rocks completely equilibrated with the fluid(part i ) to zero for rocks yet to be infiltrated (part iii ). Rocks in part (ii ) which are partially
evidence of heterogeneous fluid infiltration 119
equilibrated will have fluid/rock ratios somewhere in-between zero and infinity. If thefluid/rock ratios of individual samples are calculated first and then averaged, the results,in theory, will always be infinite because any average that includes infinite values will beitself be infinite. This result is physically impossible because in reality the rock columnexperienced a finite amount of infiltration.
The only application of the mass balance approach with the possibility of providinga realistic estimate of the fluid/rock ratio considers the system as a whole. This ‘‘bulk’’
Fig. 11. Plots of �13C (A) and �18O (B) for the ‘‘gray layer’’ as a function of distance from the intrusivecontact. The gray layer is a prominent sandy dolomite layer that can be almost continuously followed fromoutside the aureole up to approx 25 m from the contact. This layer experienced significant amounts ofmetamorphic reaction especially within the forsterite zone, and as a result, its porosity should have been greatlyenhanced due to those metamorphic reactions. However, there is no evidence for the infiltration of fluids intothe gray layer. The slight decrease in isotopic compositions as the contact is approached is likely due only todevolatilization reactions. This suggests that reaction enhanced permeability did not play a significant part ininfluencing fluid flow patterns at Ubehebe Peak.
Gregory T. Roselle and others—Stable isotope120
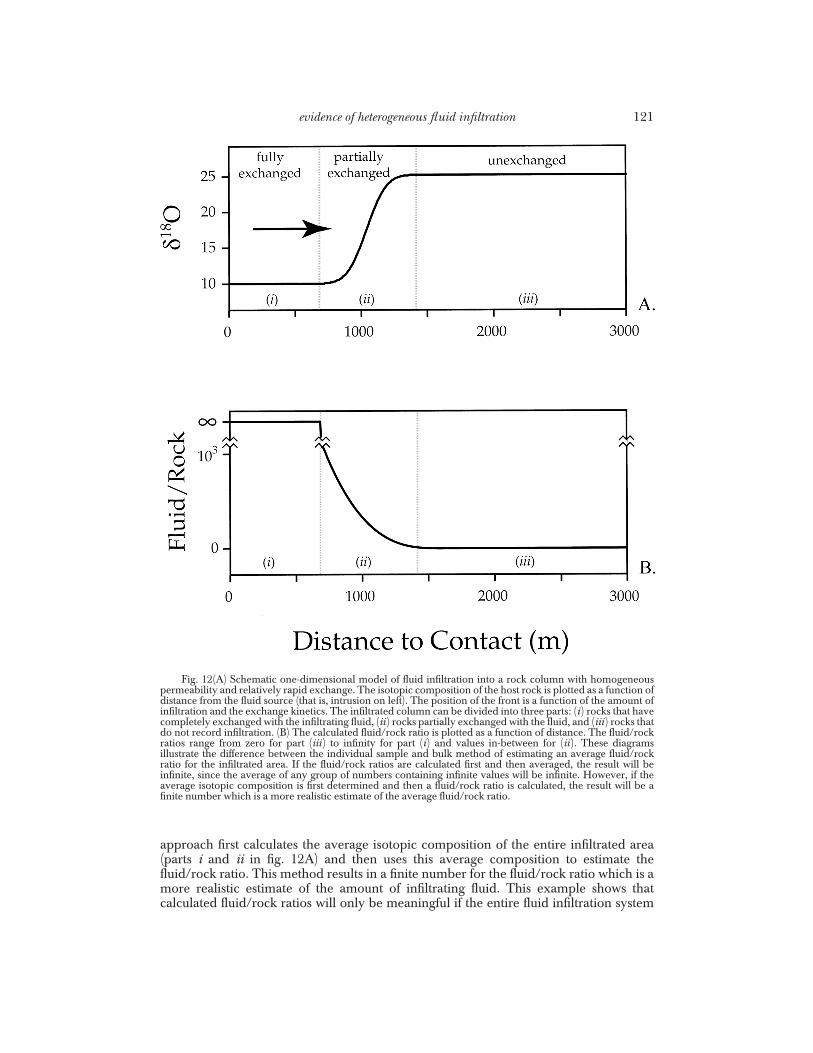
approach first calculates the average isotopic composition of the entire infiltrated area(parts i and ii in fig. 12A) and then uses this average composition to estimate thefluid/rock ratio. This method results in a finite number for the fluid/rock ratio which is amore realistic estimate of the amount of infiltrating fluid. This example shows thatcalculated fluid/rock ratios will only be meaningful if the entire fluid infiltration system
Fig. 12(A) Schematic one-dimensional model of fluid infiltration into a rock column with homogeneouspermeability and relatively rapid exchange. The isotopic composition of the host rock is plotted as a function ofdistance from the fluid source (that is, intrusion on left). The position of the front is a function of the amount ofinfiltration and the exchange kinetics. The infiltrated column can be divided into three parts: (i ) rocks that havecompletely exchanged with the infiltrating fluid, (ii ) rocks partially exchanged with the fluid, and (iii ) rocks thatdo not record infiltration. (B) The calculated fluid/rock ratio is plotted as a function of distance. The fluid/rockratios range from zero for part (iii ) to infinity for part (i ) and values in-between for (ii ). These diagramsillustrate the difference between the individual sample and bulk method of estimating an average fluid/rockratio for the infiltrated area. If the fluid/rock ratios are calculated first and then averaged, the result will beinfinite, since the average of any group of numbers containing infinite values will be infinite. However, if theaverage isotopic composition is first determined and then a fluid/rock ratio is calculated, the result will be afinite number which is a more realistic estimate of the average fluid/rock ratio.
evidence of heterogeneous fluid infiltration 121
can be characterized. Attempts to estimate fluid amounts based only on a few sampleswill result in fluid/rock ratios that are significantly biased toward unrealistic values.
Appropriate fluid/rock ratios can be calculated for the Ubehebe Peak aureolebecause the isotopic data set is unbiased and large enough to be representative of theentire aureole within the carbonates north of the intrusion. This unique data set allowsthe bulk isotopic composition of the infiltrated area to be accurately estimated. Becausethe Ubehebe Peak aureole was clearly infiltrated by externally derived magmatic fluids,the open system model given by Taylor (1977) was used to estimate fluid/rock ratios.The use of the open system model is also supported by the petrologic evidence, whichrequires the infiltration of externally buffered fluids.
The average isotopic composition of the infiltratively altered samples was used tocalculate fluid/rock ratios for each of the three populations of altered samples. Becausethe infiltrated samples represent only a percentage of all the samples within the 850 mzone, the fluid/rock ratios based on these samples had to be integrated over the entire850 m zone. This was accomplished by multiplying the bulk fluid/rock ratios calculatedfor carbon and oxygen by the appropriate percentage of alteration (table 4) for eachpopulation of infiltratively altered samples. Values for the initial isotopic composition ofthe host rock were taken from the mean �18O and �13C values observed in theunmetamorphosed samples (fig. 4). The magmatic fluid was assumed to have an initial�18O value of 9.18 permil which was obtained by calculating the �18O of water inequilibrium with the igneous feldspar (table 3) at a temperature of 700°C (O’Neil andTaylor, 1967). Because the initial �13C value of the fluid is not well-constrained by theigneous mineralogy, fluid/rock ratios were calculated assuming �13C (CO2) values of�7.0, �8.5, and �10.0 permil based on previous estimates of igenous carbon values(Valley, 1986). The difference in the final isotopic compositions of the fluid and rock, the value, was calculated for the bulk method assuming an average temperature of 500°Cfor the 850 m infiltrated zone. In addition to temperature, the value is dependent onthe specific fractionation factors between the fluid and various minerals in the host rock.Because the system was considered as a whole, the average modal mineralogy of theinfiltrated zone was used to calculate bulk fractionation factors (�fluid-whole rock) of 1.0027for oxygen and 1.0036 for carbon. The sources of the fractionation factors used tocalculate the fluid-whole rock value are listed in the note to table 5.
Two different fluid/rock ratios were calculated for each population within theaureole. The first is based on the average composition of the infiltrated samples withoutconsidering the possible effects due to devolatilization reactions. Since some of theisotopic depletion in the infiltrated samples could be the result of devolatilizationreactions, the possible effects of devolatilization on the calculated fluid/rock ratio werealso evaluated. This was done by calculating the amount of isotopic depletion potentiallydue to Rayleigh distillation from the average F value of the infiltrated samples. Thisamount of depletion is then subtracted from the average isotopic composition and thefluid/rock ratio is recalculated. Assuming a binary H2O-CO2 fluid, the above massbalance calculations can also be used to estimate the composition of the infiltrating fluid.Calculated fluid/rock ratios and fluid compositions with and without considering theeffects of devolatilization for all three populations are summarized in table 5.
The results of the mass balance calculations show that the fluid/rock ratios arerelatively insensitive to the standard deviation used to identify infiltrated samples. Thereis also little significant difference in the fluid/rock ratios and fluid compositions calcu-lated with and without considering the effects of Rayleigh distillation. In contrast,estimates of the fluid composition show a more pronounced dependence on the differentpopulations and initial �13C values of the fluid. Because the 2� population excludes 95percent of the initial isotopic heterogeneity it provides a good estimate of the amount andcomposition of the infiltrating fluid. The results from the 2� data indicate that the 850 m
Gregory T. Roselle and others—Stable isotope122
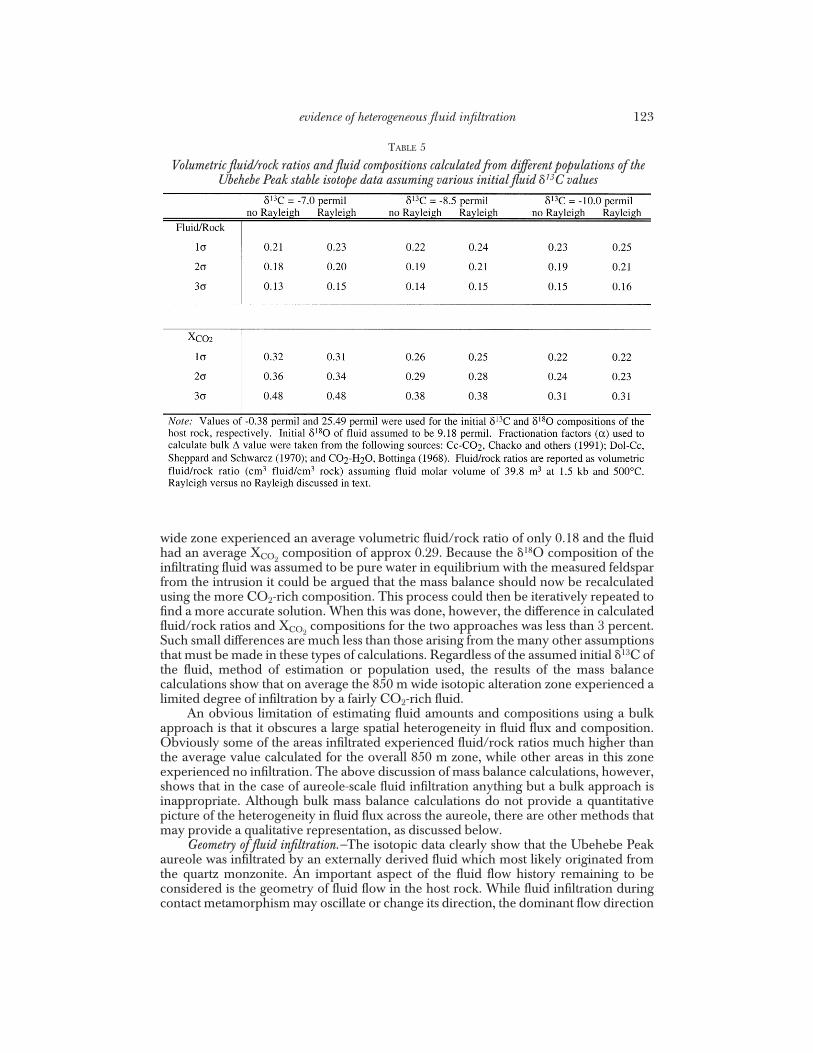
wide zone experienced an average volumetric fluid/rock ratio of only 0.18 and the fluidhad an average XCO2
composition of approx 0.29. Because the �18O composition of theinfiltrating fluid was assumed to be pure water in equilibrium with the measured feldsparfrom the intrusion it could be argued that the mass balance should now be recalculatedusing the more CO2-rich composition. This process could then be iteratively repeated tofind a more accurate solution. When this was done, however, the difference in calculatedfluid/rock ratios and XCO2
compositions for the two approaches was less than 3 percent.Such small differences are much less than those arising from the many other assumptionsthat must be made in these types of calculations. Regardless of the assumed initial �13C ofthe fluid, method of estimation or population used, the results of the mass balancecalculations show that on average the 850 m wide isotopic alteration zone experienced alimited degree of infiltration by a fairly CO2-rich fluid.
An obvious limitation of estimating fluid amounts and compositions using a bulkapproach is that it obscures a large spatial heterogeneity in fluid flux and composition.Obviously some of the areas infiltrated experienced fluid/rock ratios much higher thanthe average value calculated for the overall 850 m zone, while other areas in this zoneexperienced no infiltration. The above discussion of mass balance calculations, however,shows that in the case of aureole-scale fluid infiltration anything but a bulk approach isinappropriate. Although bulk mass balance calculations do not provide a quantitativepicture of the heterogeneity in fluid flux across the aureole, there are other methods thatmay provide a qualitative representation, as discussed below.
Geometry of fluid infiltration.—The isotopic data clearly show that the Ubehebe Peakaureole was infiltrated by an externally derived fluid which most likely originated fromthe quartz monzonite. An important aspect of the fluid flow history remaining to beconsidered is the geometry of fluid flow in the host rock. While fluid infiltration duringcontact metamorphism may oscillate or change its direction, the dominant flow direction
TABLE 5
Volumetric fluid/rock ratios and fluid compositions calculated from different populations of theUbehebe Peak stable isotope data assuming various initial fluid �13C values
evidence of heterogeneous fluid infiltration 123
can be considered in terms of three endmember geometries: horizontal flow toward theintrusion, horizontal flow away from the intrusion, and vertical flow. Isotopic andpetrologic data have been used in numerous studies as evidence for each of thesegeometries (Nabelek and others, 1984; Valley, 1986; Baumgartner and Ferry, 1991;Bowman, Willett, and Cook, 1994; Gerdes and Valley, 1994; Ferry, 1995, 1996; andFerry and Rumble, 1997).
Horizontal fluid flow toward the Ubehebe Peak intrusion is unlikely because theisotopic evidence indicates that the fluids originated from the intrusion itself. In addition,the isotopic compositions of the igneous minerals (table 3) show no evidence forinteraction with fluids that were in equilibrium with the host carbonates, as would beexpected if fluids were flowing from the aureole toward the intrusion. The phasepetrology documented in the aureole is also not consistent with fluid flow in the directionof increasing temperature (Roselle and Baumgartner, ms). Up temperature flow towardthe intrusion should result in a widespread coexistence of mineral reactants and products(Baumgartner and Ferry, 1991; Dipple and Ferry, 1996), which is not observed in theUbehebe Peak aureole.
Clearly fluid flow in the Ubehebe Peak aureole was down temperature, away fromthe intrusive contact but not necessarily horizontal. Numerical simulations of metamor-phic fluid flow in contact aureoles that allow for production of magmatic or metamorphicfluids (Hanson, 1992a,b) predict a large upward directed vertical component of flow, atleast close to the intrusion. Numerous empirical studies (Gerdes and Valley, 1994; Ferry,1995, 1996; Ferry and Rumble, 1997; Ferry, Sorensen, and Rumble, 1998) also presentevidence for a significant vertical component for fluid flow in contact aureoles. Thesestudies show that horizontal flow away from an intrusive contact should result in awollastonite (Gerdes and Valley, 1994) or a periclase (Ferry and Rumble, 1997) reactionfront which is many times farther from the intrusive contact than the 18O depletion front.Because all the wollastonite or periclase samples in these studies show a depletion in�18O, they concluded that fluid flow was directed vertically away from the intrusion andnot horizontally. Since most periclase-bearing (now replaced by brucite) samples in theUbehebe Peak aureole have been isotopically depleted, fluid flow in the Ubehebe Peakaureole is also inferred to have had a significant vertical component.
Given the amount of data collected for this study, it seems appropriate to create atwo-dimensional aureole scale map of the isotopic heterogeneity. This would providesome visualization of the fluid infiltration patterns within the aureole. Unfortunately, anaccurate contouring of the data requires sample collection to be at the same scale as theheterogeneity. The meter-scale isotopic heterogeneity in the Ubehebe Peak aureolewould require on the order of 50,000 samples for an accurate contouring. For this reason,geostatistical methods were used to obtain a realistic picture of the spatial distribution ofthe data (Roselle and others, ms). The results show the isotope distributions in theinnermost 100 m of the aureole correlated over a length of approx 15 to 30 m, whereasthe outer portions of the infiltrated zone have correlation lengths of 5 to 10 m.Correlation lengths in both groups were also isotropic. Fluid infiltration that was largelyhorizontal and away from the contact should result is anisotropic length scales. Thegeostatistical analysis is thus consistent with the interpretation that fluid flow had a strongvertical component and was restricted to discrete zones. Additionally it appears thatthese fluid pathways can broadly be considered ‘‘tube-like.’’
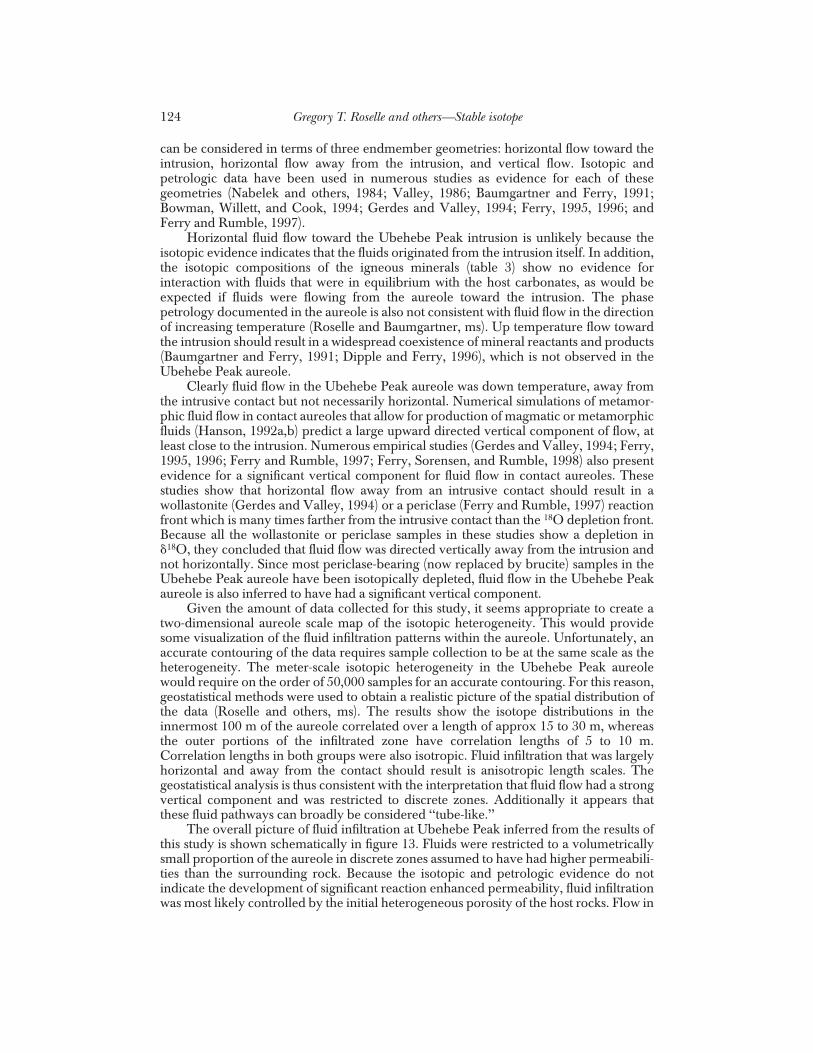
The overall picture of fluid infiltration at Ubehebe Peak inferred from the results ofthis study is shown schematically in figure 13. Fluids were restricted to a volumetricallysmall proportion of the aureole in discrete zones assumed to have had higher permeabili-ties than the surrounding rock. Because the isotopic and petrologic evidence do notindicate the development of significant reaction enhanced permeability, fluid infiltrationwas most likely controlled by the initial heterogeneous porosity of the host rocks. Flow in
Gregory T. Roselle and others—Stable isotope124
these zones of higher permeability was down temperature, away from the intrusion,however, with a significant vertical upward component. Although there is no isotopicevidence for fluid flow beyond 850 m from the intrusive contact, petrologic evidencerequires some amount of infiltration of a fluid in isotopic equilibrium but not chemicalequilibrium with the host rock.
Effect of vertical flow on mass balance calculations.—If fluid infiltration in the aureole wasdominantly vertical, then the outer limit of isotopic alteration at 850 m from the intrusion
Fig. 13. Schematic block diagram of the Ubehebe Peak contact aureole showing the inferred geometry offluid infiltration. The limit of isotopic alteration is shown by the heavy dashed line. The thin dashed lines mimicthe nearly vertical layering in the carbonate host rocks. Isotopic and petrologic evidence indicate that thedirection of fluid flow was down temperature away from the intrusion, likely with a significant verticalcomponent (arrows). The result of this type of infiltration geometry is that the exposed surface of the aureolerepresents a plane that is perpendicular to the infiltration. Therefore, the limit of isotopic alteration, seen at 850m from the intrusive contact, represents an infiltration side and not a front. Fluid pathways within the 850 mzone are inferred to be ‘‘tube-like’’ channels based on field observations and a geostatistical analysis of theisotope data (Roselle, Baumgartner, and Person, ms).
evidence of heterogeneous fluid infiltration 125
does not represent an infiltration front but rather an infiltration side. In this case, it isquestionable to estimate fluid/rock ratios and fluid compositions using the mass balancecalculations discussed above. A new infiltration side (InSide) model has been developedto allow the quantification of fluid-rock interaction based on the evaluation of infiltrationsides (see app. A). The InSide model assumes that fluid infiltration occurs vertically alongthin planes (veins) or lines (tubes). Geochemical exchange fronts associated with thisvertical infiltration then migrate laterally into the host rock through diffusion and/orinfiltration. Based on the areal amount of alteration surrounding a vein or tube for twodifferent tracers (�13C and �18O), the composition of the infiltrating fluid can bedetermined using the equations derived in app. A. One limitation of examining fluidsides is that the amount of vertically-directed fluid infiltration cannot be determined.This is not a failure of the InSide model, but rather a consequence of the data being takenfrom a plane that is cut nearly perpendicular to the flow direction. The observeddifferences in amounts of alteration for the two tracers are due only to the lateralmovement of the tracer fronts perpendicular to the main flow direction. As a result theexposed plane contains no information about the amount of vertical flow.
Although the equations in app. A were derived for a single vein or tube, with carefulevaluation of the data they can be applied to an aggregate of tubes or veins. The maincriterion is that the spacing of the tubes and veins in an area be large enough so there isno overlap between the individual alteration zones. If no overlap occurs, then thepercent of alteration for two tracers within a large area can be used to determine anaverage fluid composition. The proper application of the InSide model also requires anassumption of the location of the observed side with respect to the fluid source. Becausethe alteration fronts for carbon and oxygen move at different rates (Korzhinskii, 1970;Hofmann, 1972; Fletcher and Hofmann, 1975; Lichtner, 1985; Bickle and McKenzie,1987; Baumgartner and Rumble, 1988), there are three different principle planes that canbe envisioned through the flow system: (A) a plane far from the source, (B) a plane closeto the fluid source, and (C) a plane in-between (A) and (B). A plane far from theinfiltration source is likely to record only significant amounts of the fastest moving tracerfront (for example, oxygen). The evaluation of the isotope data from such a plane willgreatly overestimate the amount of oxygen relative to carbon resulting in a minimumestimate of fluid composition (XCO2
). For a slice close to the fluid source, one or both ofthe tracers are likely to have completely exchanged with the host rock. In addition, thereis a high probability of overlap between the areas of alteration for the different veins andtubes. Application of this model to such data will overestimate the concentration of theisotope ratio which has not fully equilibrated with the host rock. As a result, calculatedfluid compositions will have XCO2
values that are too high. The best strategy is to apply thismodel to an infiltration side that represents a slice in the middle of the flow system.
Before the InSide model can be applied to the Ubehebe Peak aureole it must bedetermined whether the data represent an appropriate plane through the flow system.Because there is clear isotopic alteration with respect to both carbon and oxygen, theUbehebe Peak data do not represent a plane far from the fluid source. Evidence that thedata do not represent a plane very close to the source is the fact that none of the alteredsamples is completely exchanged with respect to carbon or oxygen. In addition, theobserved heterogeneity and geostatistical analysis of the data (Roselle and others, ms)indicate there is no obvious overlap between the flow paths. Based on this, it wasconcluded that the Ubehebe Peak data represent an intermediate plane through theoverall flow system. Analysis of the data was carried out using the equation for infiltrationfrom a tube (app. A):
�if
�jf��Ai
Aj1�r�f
i
�r�fj 2 1�i
r
�jr 2 (1)
Gregory T. Roselle and others—Stable isotope126
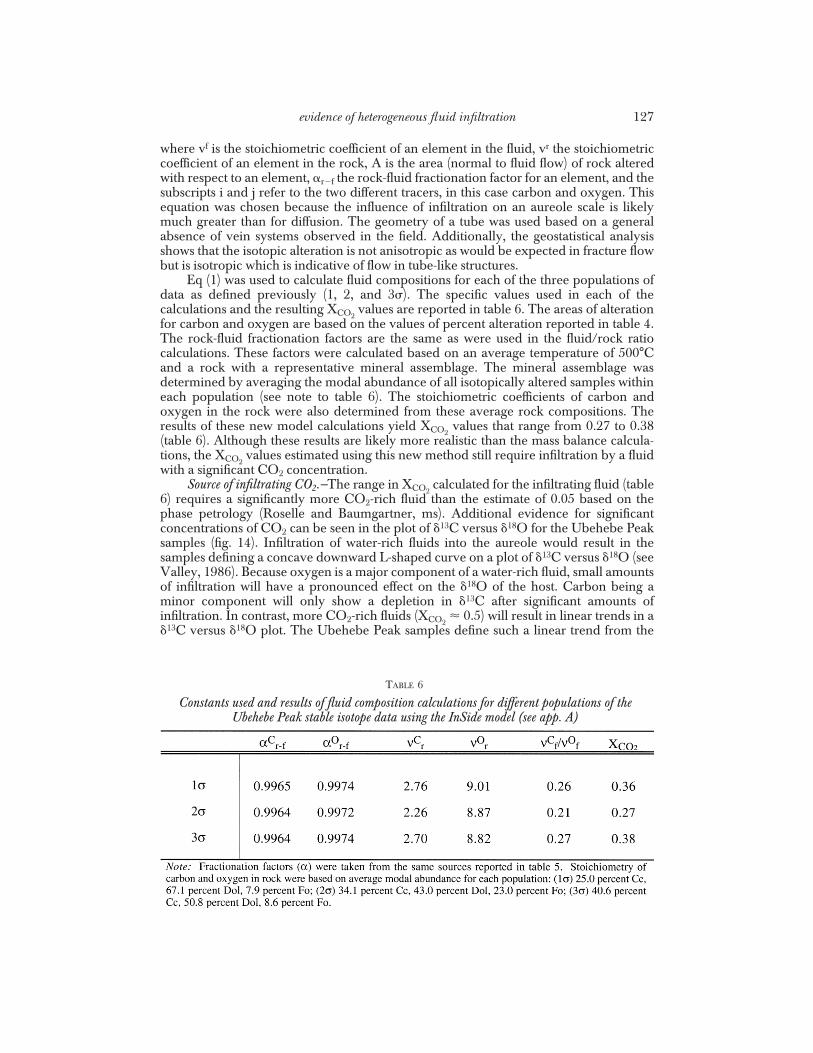
where vf is the stoichiometric coefficient of an element in the fluid, vr the stoichiometriccoefficient of an element in the rock, A is the area (normal to fluid flow) of rock alteredwith respect to an element, �r�f the rock-fluid fractionation factor for an element, and thesubscripts i and j refer to the two different tracers, in this case carbon and oxygen. Thisequation was chosen because the influence of infiltration on an aureole scale is likelymuch greater than for diffusion. The geometry of a tube was used based on a generalabsence of vein systems observed in the field. Additionally, the geostatistical analysisshows that the isotopic alteration is not anisotropic as would be expected in fracture flowbut is isotropic which is indicative of flow in tube-like structures.
Eq (1) was used to calculate fluid compositions for each of the three populations ofdata as defined previously (1, 2, and 3�). The specific values used in each of thecalculations and the resulting XCO2
values are reported in table 6. The areas of alterationfor carbon and oxygen are based on the values of percent alteration reported in table 4.The rock-fluid fractionation factors are the same as were used in the fluid/rock ratiocalculations. These factors were calculated based on an average temperature of 500°Cand a rock with a representative mineral assemblage. The mineral assemblage wasdetermined by averaging the modal abundance of all isotopically altered samples withineach population (see note to table 6). The stoichiometric coefficients of carbon andoxygen in the rock were also determined from these average rock compositions. Theresults of these new model calculations yield XCO2
values that range from 0.27 to 0.38(table 6). Although these results are likely more realistic than the mass balance calcula-tions, the XCO2
values estimated using this new method still require infiltration by a fluidwith a significant CO2 concentration.
Source of infiltrating CO2.—The range in XCO2calculated for the infiltrating fluid (table
6) requires a significantly more CO2-rich fluid than the estimate of 0.05 based on thephase petrology (Roselle and Baumgartner, ms). Additional evidence for significantconcentrations of CO2 can be seen in the plot of �13C versus �18O for the Ubehebe Peaksamples (fig. 14). Infiltration of water-rich fluids into the aureole would result in thesamples defining a concave downward L-shaped curve on a plot of �13C versus �18O (seeValley, 1986). Because oxygen is a major component of a water-rich fluid, small amountsof infiltration will have a pronounced effect on the �18O of the host. Carbon being aminor component will only show a depletion in �13C after significant amounts ofinfiltration. In contrast, more CO2-rich fluids (XCO2
� 0.5) will result in linear trends in a�13C versus �18O plot. The Ubehebe Peak samples define such a linear trend from the
TABLE 6
Constants used and results of fluid composition calculations for different populations of theUbehebe Peak stable isotope data using the InSide model (see app. A)
evidence of heterogeneous fluid infiltration 127
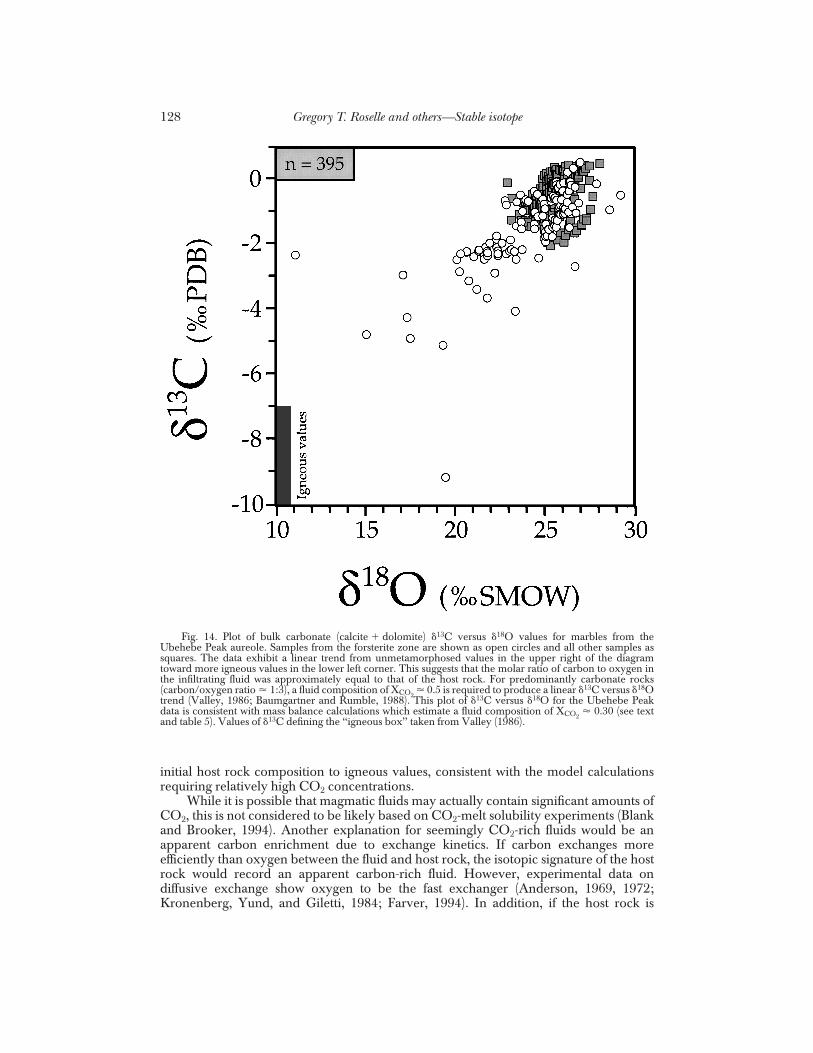
initial host rock composition to igneous values, consistent with the model calculationsrequiring relatively high CO2 concentrations.
While it is possible that magmatic fluids may actually contain significant amounts ofCO2, this is not considered to be likely based on CO2-melt solubility experiments (Blankand Brooker, 1994). Another explanation for seemingly CO2-rich fluids would be anapparent carbon enrichment due to exchange kinetics. If carbon exchanges moreefficiently than oxygen between the fluid and host rock, the isotopic signature of the hostrock would record an apparent carbon-rich fluid. However, experimental data ondiffusive exchange show oxygen to be the fast exchanger (Anderson, 1969, 1972;Kronenberg, Yund, and Giletti, 1984; Farver, 1994). In addition, if the host rock is
Fig. 14. Plot of bulk carbonate (calcite � dolomite) �13C versus �18O values for marbles from theUbehebe Peak aureole. Samples from the forsterite zone are shown as open circles and all other samples assquares. The data exhibit a linear trend from unmetamorphosed values in the upper right of the diagramtoward more igneous values in the lower left corner. This suggests that the molar ratio of carbon to oxygen inthe infiltrating fluid was approximately equal to that of the host rock. For predominantly carbonate rocks(carbon/oxygen ratio � 1:3), a fluid composition of XCO2
� 0.5 is required to produce a linear �13C versus �18Otrend (Valley, 1986; Baumgartner and Rumble, 1988). This plot of �13C versus �18O for the Ubehebe Peakdata is consistent with mass balance calculations which estimate a fluid composition of XCO2
� 0.30 (see textand table 5). Values of �13C defining the ‘‘igneous box’’ taken from Valley (1986).
Gregory T. Roselle and others—Stable isotope128
recrystallizing, then the isotopic exchange kinetics are likely to be equal for oxygen andcarbon. For these reasons it seems unlikely that isotope exchange kinetics caused anapparent enrichment in the carbon concentration of the fluid.
The apparent concentration of CO2 in the aureole may also be overestimated due tosampling problems or the mechanism of fluid flow. Although the Ubehebe Peak datawere collected to be statistically representative of the study area, the application of theInSide model (app. A) is dependent on the position of the infiltration side relative to thefluid source. If the fluid side exposed at Ubehebe Peak is at a level where both the carbonand oxygen have significantly exchanged with the host rock, then it is possible that theimportance of carbon is overestimated. The fact that there are differences in the amountsof �13C and �18O alteration suggest that this is not the case. However, the sensitivity of theInSide model to the location of the fluid side within the flow system has not been fullyevaluated. Additional problems may also arise from the mechanism of flow in theaureole. The geostatistical analysis of the Ubehebe Peak data suggest that fluid flowoccurred in relatively large diameter (25 m) tube-like structures (Roselle and others, ms).If fluid flow were restricted to such large tubes with little or no leakage perpendicular tothe main flow direction, it would appear as if the infiltration side were much closer to thefluid source. The result would be an overestimation of carbon concentrations in the fluid.
Whatever mechanism is responsible for creating the (real or apparent) CO2-richfluids in contact metamorphism, it is not restricted to the Ubehebe Peak aureole. Anexamination of stable isotope studies from numerous other contact metamorphosedcarbonates consistently suggests that these aureoles were infiltrated by fluids containingsignificant concentrations of a carbon species with an igneous isotopic signature. Valuesof �13C versus �18O for carbonates in many of these studies show linear, coupledoxygen-carbon trends ranging from sedimentary to near igneous values (Valley, 1986;Roselle, Baumgartner, and Valley, 1996). At this point the solution to the carbon massbalance problem and whether it is the same for each aureole remains unknown. Clearlythere is need for further study of the various mechanisms suggested here and in otherstudies (Baumgartner, Valley, and Olson, 1992; Roselle, Baumgartner, and Valley,1996). Future work is planned to investigate the InSide model derived in this paper. Thiswork will include coupled infiltration/stable isotope exchange modeling to evaluate theeffects of flow geometry and sampling on the fluid composition calculations.
CONCLUSIONS
In the past, quantitative interpretation of aureole-scale isotopic data has beendifficult due to heterogeneity in the degree of isotopic alteration. While such isotopicpatterns are acknowledged to be the result of focused fluid flow, existing data sets do notprovide enough information to assess accurately the nature of fluid infiltration withinaureoles. Many of these studies are based on a small number of samples which may alsobe plagued by biased sampling techniques. Using such isotopic data to model fluidinfiltration on an aureole-wide scale results in an inaccurate perception of the infiltrativehistory of an aureole. The aim of the present study is to provide a data set that is unbiasedand large enough to be statistically representative of the study area. This has beenachieved by collecting a large number of samples using statistically-based samplingtechniques. As with previous studies, the picture emerging from the stable isotopealteration patterns at Ubehebe Peak is that fluid infiltration in contact aureoles is anextremely complex process. Unlike the previous studies, this research has been able toquantify much of this aureole-scale complexity for the first time because of the statisti-cally representative data set.
Although the Ubehebe Peak isotope data show a complex pattern of isotopicalteration, there is a clear trend toward lower values near the intrusive contact. Thisalteration can be attributed to the infiltration of magmatic fluids into the host carbonates.
evidence of heterogeneous fluid infiltration 129
Because there is no clear infiltration front exhibited by the isotopic alteration patterns,the extent and style of magmatic infiltration were evaluated by identifying the sampleswith isotopic compositions that were clearly altered by exchange with magmatic fluids.From these data, it is apparent that magmatic fluid infiltration into the marbles waslimited in extent and very heterogeneous. Evidence of infiltrative �13C and �18Oalteration does not occur beyond 850 m from the intrusive contact. In addition, withinthis 850 m zone only 28 percent of the samples have �18O ratios which show anyevidence for infiltration, and 20 percent are infiltratively altered with respect to �13C.
From these isotope data and additional evidence from petrologic and geostatisticalstudies (Roselle and Baumgartner, ms; Roselle and others, ms) a complex picture of thehydrothermal system in the Ubehebe Peak contact aureole begins to emerge. Magmaticfluid infiltration into the carbonate host rocks was down temperature and away from theintrusion. Based on petrologic and isotopic data the infiltration is assumed to have had asignificant vertical component. The most important consequence of this conclusion isthat the 850 m limit of isotopic alteration does not represent an infiltration front but israther the side of the flow system. The surface exposed at Ubehebe Peak represents aplane nearly perpendicular to the main direction of fluid flow. It is clear from the isotopepatterns that this infiltration was not pervasive. The geostatistical analysis of the isotopedata (Roselle and others, ms) shows an isotropic correlation for both carbon and oxygen.This analysis and the absence of significant vein systems in the field suggest that fluidflow was contained to 5 to 30 m diameter ‘‘tube-like’’ structures. Such tube structures donot represent large open spaces within the aureole but are simply interconnected zonesof relatively high porosity. These higher porosity zones may be the result of primarystructures within the carbonates (such as sandy layers) or reaction enhanced permeabil-ity (Fyfe, Price, and Thompson, 1978; Rumble and Spear, 1983; Manning and Bird,1991; Baumgartner and others, 1996). The lack of a strong correlation between isotopicdepletion and reaction progress, however, suggests that enhancement of permeability bymetamorphic reactions did not significantly affect the fluid flow system. The higherpermeability zones seem to reflect the original heterogeneous permeability of the hostrock. Although, some enhancement of permeability due to devolatilization reactionsmay have also occurred.
With the amount, extent, and geometry of isotopic alteration clearly defined, massbalance calculations can be used to provide an estimate of the amount and compositionof the infiltrating fluid. The calculation of classic fluid/rock ratios (Taylor, 1977) fromisotopic data was shown to be valid only under very restricted conditions. The mostimportant restriction is that the flow system be considered as a whole and not the sum ofindividual samples. Thus it becomes important that a data set be representative of thebulk system. The Ubehebe Peak data appear to be an ideal candidate for suchcalculations. The results of these calculations show that the 850 m infiltrated zoneexperienced an overall volumetric fluid/rock ratio of approx 0.2 and that the infiltratingfluid had an average composition of 0.3 XCO2
. Unfortunately, the fluid/rock ratiocalculations are inappropriate for the Ubehebe Peak aureole because of the geometry ofthe fluid infiltration. Fluid/rock ratio calculations are based on evaluating infiltrationfronts and should not be used on data that represent a plane perpendicular to the flowdirection. The InSide model is a new approach to quantify the composition of infiltratingfluids based on data representing infiltration sides. This model assumes that while mostof the fluids move vertically there is some lateral movement due to diffusion orinfiltration. Differences in the amount of alteration for two isotopes are used to calculatefluid compositions. The results of calculations using the InSide model indicate that theinfiltrating fluid had an average XCO2
of approx 0.3.These calculations highlight an important problem in the quantification of contact
metamorphic fluid flow in carbonate rocks. While the petrologic evidence typically
Gregory T. Roselle and others—Stable isotope130
suggests that infiltrating fluids were water-rich, stable isotope studies consistently showevidence for the infiltration of fluids with significant amounts of CO2 (Valley, 1986;Roselle and others, 1996). Because magmatic fluids are not generally considered to beCO2-rich, this trend in previous studies could possibly be due to sampling bias.However, the mass balance calculations on the statistically representative Ubehebe Peakdata also require relatively high values of XCO2
. At this point the source of the extracarbon is unclear, but several solutions to the problem have been suggested which rangefrom difficulties in the application of the InSide model to kinetic effects (Baumgartnerand others, 1992; Roselle, Baumgartner, and Valey, 1996). Certainly there is a greatneed for continuing investigations into the mass balance of carbon in carbonate-hostedcontact metamorphic aureoles.
The statistically representative Ubehebe Peak data provide the most realisticaureole-scale picture of contact metamorphic fluid infiltration presently available. At thesame time they emphasize some serious problems in quantifying the influence of fluidinfiltration in contact aureoles. The hydrothermal flow systems within an aureole havebeen shown to be extremely heterogeneous in both the style and extent of infiltration. Inaddition to spatial heterogeneity in fluid flow, there is likely to be significant temporalcomplexity in the lifetime of a hydrothermal system. Although the time-integratedresults of fluid infiltration can be quantified, it is difficult to use these results to makeaccurate predictions of fluid amounts and compositions. The complex interactionsbetween the numerous factors controlling fluid infiltration make the use of traditionalmass balance models inappropriate in deciphering hydrothermal systems. Any applica-tion of these types of models to calculate fluid amounts and compositions is likely toprovide ambiguous results. Accurate models and predictions of contact metamorphicfluid infiltration will only come when there is a greater understanding of the complexspatial and temporal interplay of the many factors that control fluid flow.
ACKNOWLEDGMENTS
This research was supported by NSF grants EAR 92-57160, EAR 93-16504, andEAR 96-14649 to LPB and EAR 93-04372 to JWV. Additional funds were provided bythe Wisconsin Alumni Research Foundation (LPB), Albert and Alice Weeks Fellowship(GTR), Geological Society of America (GTR) and Sigma Xi (GTR). This study is part ofthe Ph.D. dissertation research conducted by Roselle at the University of Wisconsin-Madison. We thank Mike Spicuzza for invaluable assistance in the stable isotopelaboratory, Richard Anderson (National Park Service) for granting permission to collectin Death Valley National Park, Brian Hess for thin section preparation, and MatthewKohn, Nami Kitchen and William Peck for obtaining the silicate and NBS 19 analyses.We also thank John Ferry and Andreas Luttge for their insightful reviews.
APPENDIX A
General Mathematical Formulation of the Infiltration Side (InSide) ModelThe model derived here is used to quantify the effects of fluid-rock interaction by evaluating the
geochemical alteration in a profile or area that represents a cut perpendicular to the flow direction (fig. A-1). Inthis model the primary direction of fluid infiltration is directed vertically upward toward the surface along lines(tubes) or thin planes (veins). In addition, fluids move laterally away from the source through diffusion and/orinfiltration. The geochemical changes that occur in the host rock due to this lateral fluid movement are used toevaluate the composition of the infiltrating fluid. This model provides no means of estimating the amount offluid that flows in the vertical direction.
The change in concentration of a species i within a fluid-rock system through diffusion and/or infiltration isdescribed by the differential equation:
�( Cf � (1 � )Cr)
�t� D°�2Cf � ��Cf (A-1)
evidence of heterogeneous fluid infiltration 131
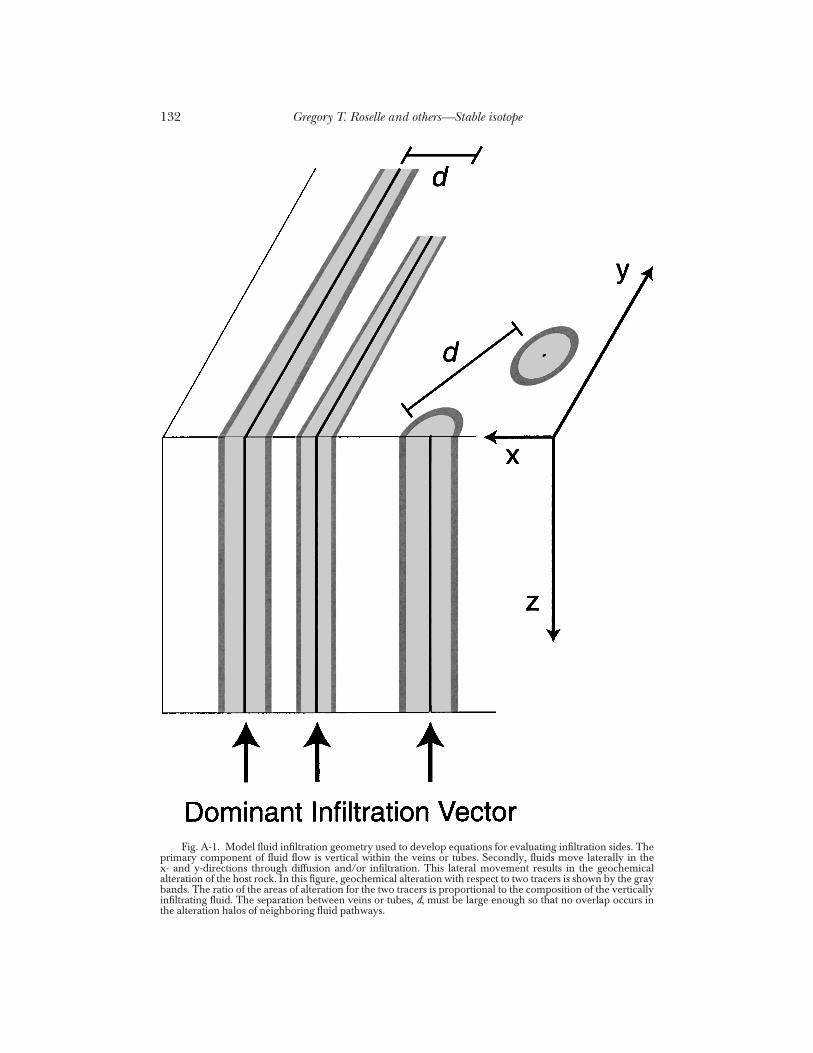
Fig. A-1. Model fluid infiltration geometry used to develop equations for evaluating infiltration sides. Theprimary component of fluid flow is vertical within the veins or tubes. Secondly, fluids move laterally in thex- and y-directions through diffusion and/or infiltration. This lateral movement results in the geochemicalalteration of the host rock. In this figure, geochemical alteration with respect to two tracers is shown by the graybands. The ratio of the areas of alteration for the two tracers is proportional to the composition of the verticallyinfiltrating fluid. The separation between veins or tubes, d, must be large enough so that no overlap occurs inthe alteration halos of neighboring fluid pathways.
Gregory T. Roselle and others—Stable isotope132
in which t represents time, the porosity of the rock, Cf the concentration of species i in the fluid, Cr theconcentration of i in the rock, D° the diffusion coefficient, and � the velocity of the fluid. Assuming equilibriumfractionation, the concentration of species i in the fluid can be related to its concentration in the rock throughthe relation:
Cr � ki Cf (A-2)
where ki is the fractionation factor, and the concentrations are expressed in units of moles/m3. By combiningeqs (A-1) and (A-2) the change in concentration of i within the system can be described solely in term of itsconcentration in the fluid. If the porosity, , and the fractionation factor, ki, are assumed to be constant overtime the resulting equation is:
( � (1 � )ki)�Cf
�t� D°�2Cf � �Cf (A-3)
In order to simplify the solution of eq (A-3), diffusion and infiltration are considered to be unrelated processes.Thus for the movement of species i due solely to diffusion the solution to (A-3) becomes:
x � �2D*t
where x is the distance of the diffusive front from the source, and D* is given by:
D* �D°
� (1 � )ki(A-5)
In the case of infiltration the solution becomes simply:
x � �*t (A-6)
where x is the distance of the infiltration front from the source, and �* is given by:
�* ��
� (1 � )ki(A-7)
Eqs (A-4) and (A-6) can also be represented in terms of the area of geochemical alteration surrounding thesource. Assuming that the fronts from individual sources do not overlap with one another (i.e. x9 d/2, whered is the separation distance; see figure A-1), the transformation of eqs (A-4) and (A-6) into area coordinates forthe two geometries (veins and tubes) results in the following four equations:
Ai � �2D*t · 1 (diffusion � fracture) (A-8)
Ai � 2�D*t (diffusion � tube) (A-9)
Ai � �*t · 1 (infiltration � fracture) (A-10)
Ai � �(�*t)2 (infiltration � tube) (A-11)
where Ai is the area of alteration for species i, and l the length of a fracture in the y-direction (fig. A-1).
Evaluating the Fractionation Factor ki for Isotope SystemsThe fractionation of an isotope between a fluid and rock is given by the relation (Rumble 1982):
Rir � �r�f
i Rif (A-12)
where Ri is the ratio of the rarer to the more common isotope i (that is, 18O/16O) in the rock or fluid, and � is theisotopic fluid-rock fractionation factor for i. Before eq (A-12) can be combined with eqs (A-8) to (A-11) toevaluate fluid compositions using stable isotope data, the isotopic compositions, Ri, need to be transformed intoconcentration units of moles/m3. If the abundance of the rare isotope is less than 1 percent, then the totalconcentration of the element can be assumed to be equal to the concentration of the common isotope. Using
evidence of heterogeneous fluid infiltration 133
oxygen as an example this results in the expression:
C18O� C17O
� C16O� C16O
(A-13)
The total concentration of oxygen in a phase can be expressed in moles/m3 through the relation:
COtotaln � C16O
��O
n
Vn(A-14)
where C is the concentration of oxygen in moles/m3, n stands for the rock or fluid phase, � the stoichiometricconcentration of oxygen in phase n, and V the molar volume of n. In general terms the total concentration of anelement i in phase n can be written as:
Ci totaln �
�in
Vn(A-15)
Using eqs (A-13) and (A-15), the isotopic ratio, Ri, can be expressed in the form:
Rir �
Cir
Ci totalr
�Ci
r
�ir/Vr
�Ci
r Vr
�ir
(rock) (A-16A)
Rif �
Cif
Ci totalf
�Ci
f
�if /Vf
�Ci
f Vf
�if
(fluid) (A-16B)
Substitution of eqs (A-16A) and (A-16B) into eq (A-12) yields:
CirVr
�ir
� �r�fi Ci
fVf
�if
(A-17)
By rearranging eq (A-17) into the same form as (A-2) it can be seen that the fractionation factor, ki, for isotopesystems is given by the equation:
ki � �r�fi 1V
f
Vr 2 1�ir
�if2 (A-18)
Evaluating Fluid Compositions with Isotope DataUsing two isotope systems (such as carbon and oxygen) the above derived equations can be used to
evaluate the composition of the vertically flowing fluid. All that is required is a knowledge of the percentage ofarea altered by each isotope, assumptions about the composition of the rock phase, and the isotopefractionation factor �r�f. As an example consider the case of diffusion from a fracture. The first step is to ratiothe areas of alteration for the two isotope systems using eq (A-8):
Ai
Aj�
�2D*i t · 1
�2D*j t · 1
��D*
i
�D*j
(A-19)
where the subscripts i and j refer to the two different isotopes. Substitution of eq (A-5) into eq (A-19) yields:
Ai
Aj�
� D°i( � (1 � )ki)
� D°j( � (1 � )kj)
(A-20)
Gregory T. Roselle and others—Stable isotope134
If the porosity is very small then the term, � (1 � ), is approximately equal to one and cancels out. Thediffusion coefficients are assumed to cancel each other, because their exact values are poorly understood, andthey are likely very similar. In reality, the lateral movement of the isotope fronts is due to dispersion of thevertically flowing fluid and not pure diffusion. Because dispersion is an intrinsic property of the rock and notchemistry (that is, isotopes), it can be assumed that the diffusion/dispersion coefficients will cancel. Since thevelocity term in eq (A-7) is the fluid velocity and not the velocity of the front, they will also cancel one anotherin the case of infiltration. As a result, the ratio of the areas of alteration for diffusion from a fracture simplifies tothe expression:
Ai
Aj��kj
ki(A-21)
Substituting the expression for the isotopic fractionation factor into eq. (A-21) yields:
Ai
Aj���r�f
j
�r�fi
�if
�jf
�jr
�ir
(A-22)
Since the areas of alteration, fractionation factors �, and stoichiometry of the rock are known or assumed, eq(A-22) is solved for the ratio of the stoichiometry of species i and j in the fluid:
�if
�jf� 1Ai
Aj22
1�r�fi
�r�fj 2 1�i
r
�jr2 (diffusion � fracture) (A-23)
The same steps can be repeated to derive the appropriate equations for diffusion and infiltration from the twodifferent geometries. The steps for each are not shown here, but the resulting equations are as follows:
�if
�jf� 1Ai
Aj2 1�r�f
i
�r�fj 2 1�i
r
�jr2 (diffusion � tube) (A-24)
�if
�jf� 1Ai
Aj2 1�r�f
i
�r�fj 2 1�i
r
�jr2 (infiltration � fracture) (A-25)
�if
�jf��Ai
Aj1�r�f
i
�r�fj 2 1�i
r
�jr2 (infiltration � tube) (A-26)
The final step is to determine the XCO2from the stoichiometric ratio of the two isotopes in the fluid. The
total concentration of carbon and oxygen in the fluid phase is related to the fluid XCO2composition through the
relations:
CCtotalf � nf · XCO2
(A-27A)
COtotalf � nf(XH2O � 2XCO2
) (A-27B)
where nf is total number of moles of fluid. Combining eqs (A-27) with eq (A-15) allows the ratio of thestoichiometry of carbon and oxygen in the fluid to be solved for the total concentrations:
�Cf
�Of
�CCtotal
f
COtotalf
�nf · XCO2
nf(XH2O � 2XCO2)
(A-28)
This equation can now be simplified and expressed solely in terms of XCO2to yield the relation between XCO2
and the stoichiometric ratio of the two species:
XCO2�
�Cf /�O
f
(1 � �Cf /�O
f )(A-29)
evidence of heterogeneous fluid infiltration 135
REFERENCES
Al-Aasm, I. S., Taylor, B. E., and South, B., 1990, Stable isotope analysis of multiple carbonate samples usingselective acid extraction: Chemical Geology, v. 80, p. 119–125.
Anderson, T. F., 1969, Self-diffusion of carbon and oxygen in calcite by isotope exchange with carbon dioxide:Journal of Geophysical Research, v. 74/B15, p. 3918–3932.
————— 1972, Self-diffusion of carbon and oxygen in dolomite: Journal of Geophysical Research, v. 77/B5,p. 857–861.
Baumgartner, L. P., 1987, Fluid-rock ratio: A reasonable concept? [abstract]: EOS, v. 68, p. 466.Baumgartner, L. P., and Ferry, J. M., 1991, A model for coupled fluid flow and mixed volatile mineral reactions
with applications to regional metamorphism: Contributions to Mineralogy and Petrology, v. 106,p. 273–285.
Baumgartner, L. P., Gerdes, M. L., Person, M. A., and Roselle, G. T., 1996, Porosity and permeability ofcarbonate rocks during contact metamorphism, in Jamtveit, B., and Yardley, B., editors, Fluid flow andtransport in rocks: mechanisms and effects: London, Chapman & Hall, p. 83–98.
Baumgartner, L. P., Giere, R., Trommsdorff, V., and Ulmer, P., 1989, Field guide for the Southern Adamello, inTrommsdorff, V., Ulmer, P., Giere, R., and Baumgartner, L. P., editors, Guidebook for the excursion tothe Central Alps, Bergell and Adamello: Sienna, Italy, Consiglio Nazionale delle Richerche, p. 91–115.
Baumgartner, L. P., and Rumble, D., 1988, Transport of stable isotopes I: Development of kinetic continuumtheory for stable isotope transport: Contributions to Mineralogy and Petrology, v. 98, p. 417–430.
Baumgartner, L. P., Valley, J. W., and Olsen, S. N., 1992, Diffusion limited Rayleigh distillation: 18O and 13Cdepletion halos around calc-silicate nodules from a contact aureole [abstract]: International GeologicCongress, 29th, Kyoto, Japan, Abstracts, v. 2, p. 603.
Bickle, M. J., and Baker, J. 1990a, Advective-diffusive transport of isotopic fronts: An example from Naxos,Greece: Earth and Planetary Science Letters, v. 97, p. 78–93.
————— 1990b, Migration of reaction and isotopic fronts in infiltration zones: Assessments of fluid flux inmetamorphic terrains: Earth and Planetary Science Letters, v. 98, p. 1–13.
Bickle, M. J., and McKenzie, D., 1987, The transport of heat and matter by fluids during metamorphism:Contributions to Mineralogy and Petrology, v. 95, p. 384–392.
Blank, J. G., and Brooker, R. A., 1994, Experimental studies of carbon dioxide in silicate melts: Solubility,speciation, and stable carbon isotope behavior, in Carroll, M. R., and Holloway, J. R., editors, Volatiles inmagmas: Mineralogical Society of America, Reviews in Minerology, v. 30, p. 157–186.
Bottinga, Y., 1968, Calculation of fractionation factors for carbon and oxygen exchange in the systemcalcite-carbon dioxide-water: Journal of Physical Chemistry, v. 72, p. 800–808.
Bowman, J. R., Willett, S. D., and Cook, S. J., 1994, Oxygen isotopic transport and exchange during fluid flow:One-dimensional models and applications: American Journal of Science, v. 294, p. 1–55.
Broecker, W. S., and Oversby, V. M., 1971, Chemical equilibria in the earth: New York, McGraw-Hill, 318 p.Cartwright, I., 1994, The two-dimensional pattern of metamorphic fluid flow at Mary Kathleen, Australia:
Fluid focusing, transverse dispersion, and implications for modeling fluid flow: American Mineralogist,v. 79, p. 526–535.
Cathles, L. M., 1977, An analysis of the cooling of intrusives by groundwater convection which includesboiling: Economic Geology, v. 72, p. 804–826.
Chacko, T., Mayeda, T. K., Clayton, R. N., and Goldsmith, J. R., 1991, Oxygen and carbon isotopefractionations between CO2 and calcite: Geochimica et Cosmochimica Acta, v. 55, p. 2867–2882.
Chiba, H., Chacko, T., Clayton, R. N., and Goldsmith, J. R., 1989, Oxygen isotope fractionations involvingdiopside, forsterite, magnetic and calcite: Application to geothermometry: Geochimica et CosmochimicaActa, v. 53, p. 2985–2995.
Criss, R. E., and Taylor, H. P., Jr., 1983, An 18O/16O and D/H study of Tertiary hydrothermal systems in thesouthern half of the Idaho batholith: Geological Society of America Bulletin, v. 94, p. 640–663.
Dipple, G. M., and Ferry, J. M., 1992, Fluid flow and stable isotopic alteration in rocks at elevated temperatureswith applications to metamorphism: Geochimica et Cosmochimica Acta, v. 56, p. 3539–3550.
————— 1996, The effect of thermal history on the development of mineral assemblages during infiltration-driven contact metamorphism: Contributions to Minerology and Petrology, v. 124, p. 334–345.
Eiler, J. M., Valley, J. W., and Baumgartner, L. P., 1993, A new look at stable isotope thermometry:Geochimica et Cosmochimica Acta, v. 57, p. 2571–2583.
Epstein, S., Graf, D. L., and Degens, E. T., 1964, Oxygen isotope studies on the origin of dolomites, in Craig,H., Miller, S. L., and Wasserburg, G. J., editors, Isotopic and cosmic chemistry: Amsterdam, North-Holland Publishing Company, p. 169–180.
Farver, J. R., 1994, Oxygen self-diffusion in calcite: Dependence on temperature and water fugacity: Earth andPlanetary Science Letters, v. 121, p. 575–587.
Ferry, J. M., 1986, Reaction progress: A monitor of fluid-rock interaction during metamorphic and hydrother-mal events, in Walther, J. V., and Wood, B. J., editors, Fluid-rock interactions during metamorphism: NewYork, Springer-Verlag, p. 60–88.
————— 1991, Dehydration and decarbonation reactions as a record of fluid infiltration, in Kerrick, D. M., editor,Contact metamorphism: Mineralogical Society of America, Reviews in Mineralogy, v. 26, p. 351–393.
————— 1994, Role of fluid flow in the contact metamorphism of siliceous dolomitic limestones: AmericanMineralogist, v. 79, p. 719–736.
————— 1995, Fluid flow during contact metamorphism of ophicarbonate rocks in the Bergell aureole, ValMalenco, Italian Alps: Journal of Petrology, v. 36, p. 1039–1053.
————— 1996, Prograde and retrograde fluid flow during contact metamorphism of siliceous carbonate rocksfrom the Ballachulish aureole, Scotland: Contributions to Mineralogy and Petrology, v. 124, p. 235–254.
Gregory T. Roselle and others—Stable isotope136
Ferry, J. M., and Dipple, G. M., 1991, Fluid flow, mineral reactions, and metasomatism: Geology, v. 19,p. 211–214.
————— 1992, Models for coupled fluid flow, mineral reaction, and isotopic alteration during contact metamor-phism: The Notch Peak aureole, Utah: American Mineralogist, v. 77, p. 577–591.
Ferry, J. M., and Rumble, D., 1997, Formation and destruction of periclase by fluid flow in two contactaureoles: Contributions to Mineralogy and Petrology, v. 128, p. 313–334.
Ferry, J. M., Sorensen, S. S., and Rumble, D., 1998, Structurally controlled fluid flow during contactmetamorphism in the Ritter Range pendant, California, USA: Contributions to Mineralogy and Petrol-ogy, v. 130, p. 358–378.
Fletcher, R. C., and Hofmann, A. W., 1975, Simple models of diffusion and combined diffusion-infiltrationmetasomatism, in Hofmann, A. W., Giletti, B. J., Yoder, H. S., Jr., and Yund, R. A., editors, Geochemicaltransport and kinetics: Washington, D.C., Carnegie Institute of Washington, p. 243–260.
Fyfe, W. S., Price, N. J., and Thompson, A. B., 1978, Fluids in the Earth’s crust: Their significance inmetamorphic, tectonic and chemical transport processes: Amsterdam, Elsevier.
Gerdes, M. L., and Valley, J. W., 1994, Fluid flow and mass transport at the Valentine wollastonite deposit,Adirondack Mountains, New York State: Journal of Metamorphic Geology, v. 12, p. 589–608.
Gerdes, M. L., Baumgartner, L. P., and Person, M., 1995, Stochastic permeability models of fluid flow duringcontact metamorphism: Geology, v. 23, p. 945–948.
Gerdes, M. L., Baumgartner, L. P., Person, M., and Rumble, D., 1995, One- and two-dimensional models offluid flow and stable isotope exchange at an outcrop in the Adamello contact aureole, southern Alps, Italy:American Mineralogist, v. 80, p. 1004–1019.
Graham, C. M., Valley, J. M., Eiler, J. M., and Wada, H., 1998, Timescales and mechanisms of fluid infiltrationin a marble: an ion microprobe study: Contributions to Mineralogy and Petrology, v. 132, p. 371–389.
Hanson, R. B., 1992a, Effects of fluid production on fluid flow during regional and contact metamorphism:Journal of Metamorphic Geology, v. 10, p. 87–97.
————— 1992b, Effects of magmatic and metamorphic volatiles on the evolution of fluid-rock interactions andfluid pressure during contact metamorphism [abstract]: Geological Society of America Abstracts withPrograms, v. 24, p. A251.
Hofmann, A. W., 1972, Chromatographic theory of infiltration metasomatism and its application to feldspars:American Journal of Science, v. 272, p. 69–90.
Korzhinskii, D. S., 1970, Theory of metasomatic zoning: Oxford, Clarendon Press, 162 p.Kronenberg, A. K., Yund, R. A., and Giletti, B. J., 1984, Carbon and oxygen diffusion in calcite: Effects of Mn
content and PH2O: Physics and Chemistry of Minerals, v. 11, p. 101–112.Land, L. S., Salem, M. R. I., and Morrow, D. W., 1975, Paleohydrology of ancient dolomites: geochemical
evidence: American Association of Petroleum Geologists Bulletin, v. 59, p. 1602–1625.Lasaga, A. C., and Rye, D. M., 1993, Fluid flow and chemical reaction kinetics in metamorphic systems:
American Journal of Science, v. 293, p. 361–404.Lichtner, P. C., 1985, Continuum model for simultaneous chemical reactions and mass transport in hydrother-
mal systems: Geochimica et Cosmochimica Acta, v. 49, p. 779–800.Lohmann, K. C., 1988, Geochemical patterns of meteoric diagenetic systems and their application to studies of
paleokarst, in James, N. P., and Choquette, P. W., editors, Paleokarst: New York, Springer-Verlag,p. 58–80.
Manning, C. E., and Bird, D. K., 1991, Porosity evolution and fluid flow in basalts of the Skaergaardmagma-hydrothermal system, East Greenland: American Journal of Science, v. 291, p. 201–257.
Matthews, A., 1994, Oxygen isotope geothermometers for metamorphic rocks: Journal of MetamorphicGeology, v. 12, p. 211–219.
McAllister, J. F., 1955, Geology of mineral deposits in the Ubehebe Peak quadrangle, Inyo County, California:California Division of Mines and Geology, Special Report 42, 63 p.
————— 1956, Geology of the Ubehebe Peak Quadrangle, California: United States Geological Survey MapGQ-95.
McCrea, J. M., 1950, On the isotope chemistry of carbonates and a paleotemperature scale: Journal ofChemical Physics, v. 18, p. 849–857.
Nabelek, P. I., Labotka, T. C., O’Neil, J. R., and Papike, J. J., 1984, Contrasting fluid/rock interaction betweenNotch Peak granitic intrusion and argillites and limestones in western Utah: Evidence from stable isotopesand phase assemblages: Contributions to Mineralogy and Petrology, v. 86, p. 25–34.
Norton, D. L., and Knight, J., 1977, Transport phenomena in hydrothermal systems: Cooling plutons:American Journal of Science, v. 277, p. 937–981.
Norton, D. L., and Taylor, H. P., 1979, Quantitative simulation of the hydrothermal systems of crystallizingmagmas on the basis of transport theory and oxygen isotope data: An analysis of the Skaergaard intrusion:Journal of Petrology, v. 20, p. 421–486.
O’Neil, J. R., Clayton, R. N., and Mayeda, T. K., 1969, Oxygen isotope fractionation in divalent metalcarbonates: Journal of Chemical Physics, v. 51, p. 5547–5558.
O’Neil, J. R., and Taylor, H. P., Jr., 1967, The oxygen isotope and cation exchange chemistry of feldspars:American Mineralogist, v. 52, p. 1414–1437.
Rice, J. M., and Ferry, J. M., 1982, Buffering, infiltration, and the control of intensive variables duringmetamorphism, in Ferry, J. M., editor, Characterization of metamorphism through mineral equilibria:Mineralogical Society of America, Reviews in Mineralogy, v. 10, p. 263–326.
Roselle, G. T., ms, 1997, Integrated petrologic, stable isotopic, and statistical study of fluid-flow in carbonates ofthe Ubehebe Peak contact aureole, Death Valley National Park, California: Ph.D. thesis, University ofWisconsin, Madison, Wisconsin, 264 p.
evidence of heterogeneous fluid infiltration 137
Roselle, G. T., and Baumgartner, L. P., ms, Petrologic constraints on fluid infiltration and volatile production atthe Ubehebe Peak contact aureole, California.
Roselle, G. T., Baumgartner, L. P., and Chapman, J. A., 1997, Nucleation-dominated crystallization offorsterite in the Ubehebe Peak contact aureole, California: Geology, v. 25, 823–826.
Roselle, G. T., Baumgartner, L. P., and Valley, J. W., 1996, Do magmatic fluids from shallow crustal graniticintrusions contain abundant CO2?: Evidence from stable isotope studies of contact metamorphism[abstract]: EOS, v. 77/46, p. F838.
Rumble, D., 1982, Stable isotope fractionation during metamorphic devolatilization reactions, in Ferry, J. M.,editor, Characterization of metamorphism through mineral equilibria: Mineralogical Society of America,Reviews in Mineralogy, v. 10, p. 327–353.
Rumble, D., and Spear, F. S., 1983, Oxygen isotope equilibration and permeability enhancement duringregional metamorphism: Journal of the Geological Society of London, v. 140, p. 619–628.
Sharma, T., and Clayton, R. N., 1965, Measurement of 18O/16O ratios of total oxygen of carbonates:Geochimica et Cosmochimica Acta, v. 29, p. 1347–1353.
Sheppard, S. M. F., and Schwarcz, H. P., 1970, Fractionation of carbon and oxygen isotopes and magnesiumbetween metamorphic calcite and dolomite: Contributions to Mineralogy and Petrology, v. 26, p. 161–198.
Snow, J. K., and White, C., 1990, Listric normal faulting and synorogenic sedimentation, northern CottonwoodMountains, Death Valley region, California, in Wernicke, B. P., editor, Basin and Range extensionaltectonics near the latitude of Las Vegas, Nevada: Geological Society of America Memoir 176, p. 413–445.
Taylor, H. P., Jr., 1974, The application of oxygen and hydrogen isotope studies to problems of hydrothermalalteration and ore deposition: Economic Geology, v. 69, p. 843–883.
————— 1977, Water/rock interactions and the origin of H2O in granitic batholiths: Journal of the GeologicalSociety of London, v. 133, p. 509–558.
Taylor, H. P., Jr., and Forester, R. W., 1979, An oxygen and hydrogen isotope study of the Skaergaardintrusion and its country rocks: A description of a 55-M.Y. old fossil hydrothermal system: Journal ofPetrology, v. 20, p. 355–415.
Valley, J. W., 1986, Stable isotope geochemistry of metamorphic rocks, in Valley, J. W., Taylor, Jr., H. P., andO’Neil, J. R., editors, Stable isotopes in high temperature geological processes: Mineralogical Society ofAmerica, Reviews in Mineralogy, v. 16, p. 445–489.
Valley, J. W., Kitchen, N., Kohn, M. J., Niendorf, C. R., and Spicuzza, M. J., 1995, UWG-2, a garnet standardfor oxygen isotope ratio: strategies for high precision and accuracy with laser heating: Geochimica etCosmochimica Acta, v. 59, p. 5223–5231.
Valley, J. W., and O’Neil, J. R., 1984, Fluid heterogeneity during granulite facies metamorphism in theAdirondacks: Stable isotope evidence: Contributions to Mineralogy and Petrology, v. 85, p. 158–173.
Valley, J. W., Peacor, D. R., Bowman, J. R., Essene, E. J., and Allard, M. J., 1985, Crystal chemistry of aMg-vesuvianite and implications of phase equilibria in the system CaO-MgO-Al2O3-SiO2-H2O-CO 2:Journal of Metamorphic Geology, v. 3, p. 137–153.
Veizer, J., and Hoefs, J., 1976, The nature of O18/O16 and C13/C12 secular trends in sedimentary carbonaterocks: Geochimica et Cosmochimica Acta, v. 40, p. 1387–1395.
Gregory T. Roselle and others138