Embed Size (px)
Citation preview
1
A joint RANO/EANO/EANM Practice Guideline/SNMMI Procedure Standard for
Imaging of Gliomas using PET with Radiolabeled Amino Acids and [18F]FDG:
Version 1.0
Ian Law1#, Nathalie L Albert2, Javier Arbizu3, Ronald Boellaard4,5, Alexander
Drzezga6, Norbert Galldiks7,9, Christian la Fougère8, Karl-Josef Langen9, 10,
Egesta Lopci11, Val Lowe12, Jonathan McConathy13, Harald H. Quick14, Bernhard
Sattler15, David M Schuster16, Jörg-Christian Tonn17, Michael Weller18
The author list is ranked by the chair followed by all members of the working group in alphabetical order by last name
1. Department of Clinical Physiology, Nuclear Medicine and PET, Rigshospitalet, University of Copenhagen, Denmark (Chair)
2. Department of Nuclear Medicine, Ludwig-Maximilians-University Munich, Germany
3. Department of Nuclear Medicine, Clínica Universidad de Navarra, University of Navarre, Spain
4. Department of Nuclear Medicine and Molecular Imaging, University Medical Center Groningen, The Netherlands
5. Department of Radiology and Nuclear Medicine, VU University Medical Center, Amsterdam, The Netherlands
6. Department of Nuclear Medicine, University Hospital Cologne, Germany 7. Department of Neurology, University Hospital Cologne, Germany 8. Division of Nuclear Medicine and Clinical Molecular Imaging,
Department of Radiology, University of Tübingen, Germany 9. Institute of Neuroscience and Medicine (INM-3, -4), Forschungszentrum
Julich, Germany 10. Department of Nuclear Medicine, RWTH University Aachen, Germany 11. Department of Nuclear Medicine, Humanitas Clinical and Research
Hospital, Rozzano Italy 12. Department of Radiology, Nuclear Medicine, Mayo Clinic, Rochester,
MN, USA 13. Division of Molecular Imaging and Therapeutics, University of Alabama
At Birmingham, AL, USA 14. High-Field and Hybrid MR Imaging, University Hospital Essen, Germany 15. Department for Nuclear Medicine, University Hospital Leipzig, Germany

2
16. Division of Nuclear Medicine and Molecular Imaging, Department of Radiology and Imaging Sciences, Emory University, Atlanta, USA
17. Department of Neurosurgery, Ludwig-Maximilians-University Munich, Germany
18. Department of Neurology, University Hospital Zurich, Switzerland
# Corresponding author:
Prof. Ian Law, MD PhD DMSc
Chief Physician, Dept of Clinical Physiology, Nuclear Medicine & PET
Rigshospitalet
9, Blegdamsvej,
2100-DK Copenhagen Ø
Denmark
Tel: +45 35 45 85 13 or 39 19 (Work)
Tel: +45 30 29 51 22 (Mobile)
FAX: +45 35 45 38 98
E-mail: [email protected]
Abstract
This joint Practice guideline, or Procedure Standard, was developed collaboratively by the European Association of Nuclear Medicine (EANM), the
3
Society of Nuclear Medicine and Molecular Imaging (SNMMI), the European Association of Neurooncology (EANO), and the working group for Response Assessment in Neurooncology with PET (PET-RANO).
Brain PET imaging is being increasingly used to supplement MRI in the clinical management of glioma. The goal of this standard/guideline is to assist nuclear medicine practitioners in recommending, performing, interpreting, and reporting the results of brain PET imaging in gliomas in order to achieve a high quality imaging standard using FDG and the radiolabeled amino acids MET, FET, and FDOPA. This will help promote the appropriate use of PET imaging and contribute to evidence-based medicine that may improve the diagnostic impact of this technique in neuro-oncological practice. The present document replaces a former version of the guidelines that were published in 2006 (1), and supplements a recent evidence-based recommendation by the PET-RANO working group and EANO on the clinical use of PET imaging in gliomas (2). The information provided should be taken in the context of local conditions and regulations.
Keywords
FDG, FET, MET, FDOPA, PET, PET/CT, PET/MRI, Imaging procedure, Brain Tumor, Glioma, Neurooncology, Quantification
Preamble
The Society of Nuclear Medicine and Molecular Imaging (SNMMI) is an international scientific and professional organization founded in 1954 to promote the science, technology, and practical application of nuclear medicine. Its 18,000 members are physicians, technologists, and scientists specializing in the research and practice of nuclear medicine. In addition to publishing journals, newsletters, and books, the SNMMI also sponsors international meetings and workshops designed to increase the competencies of nuclear medicine practitioners and to promote new advances in the science of nuclear medicine. The European Association of Nuclear Medicine (EANM) is a professional nonprofit medical association that facilitates communication worldwide between individuals pursuing clinical and research excellence in nuclear medicine, and has 2800 members in 2017. The EANM was founded in 1985.
The SNMMI/EANM will periodically define new standards/guidelines for nuclear medicine practice to help advance the science of nuclear medicine and to improve the quality of service to patients. Existing standards/guidelines will be reviewed for revision or renewal, as appropriate, on their fifth anniversary or sooner, if indicated. As of February 2014, the SNMMI guidelines will now be referred to as procedure standards. Any previous practice guideline or procedure guideline that describes how to perform a procedure is now considered an SNMMI procedure standard.
Each standard/guideline, representing a policy statement by the SNMMI/EANM, has undergone a thorough consensus process in which it has been subjected
4
to extensive review. The SNMMI/EANM recognizes that the safe and effective use of diagnostic nuclear medicine imaging requires specific training, skills, and techniques, as described in each document.
The EANM and SNMMI have written and approved these standards/guidelines to promote the use of nuclear medicine procedures with high quality. These standards/guidelines are intended to assist practitioners in providing appropriate nuclear medicine care for patients. They are not inflexible rules or requirements of practice and are not intended, nor should they be used, to establish a legal standard of care. For these reasons and those set forth below, the SNMMI/EANM cautions against the use of these standards/guidelines in litigation in which the clinical decisions of a practitioner are called into question.
The ultimate judgment regarding the propriety of any specific procedure or course of action must be made by medical professionals taking into account the unique circumstances of each case. Thus, there is no implication that an approach differing from the standards/guidelines, standing alone, is below the standard of care. To the contrary, a conscientious practitioner may responsibly adopt a course of action different from that set forth in the standards/guidelines when, in the reasonable judgment of the practitioner, such course of action is indicated by the condition of the patient, limitations of available resources, or advances in knowledge or technology subsequent to publication of the standards/guidelines.
The practice of medicine involves not only the science but also the art of dealing with the prevention, diagnosis, alleviation, and treatment of disease. The variety and complexity of human conditions make it impossible to always reach the most appropriate diagnosis or to predict with certainty a particular response to treatment. Therefore, it should be recognized that adherence to these standards/guidelines will not ensure an accurate diagnosis or a successful outcome. All that should be expected is that the practitioner will follow a reasonable course of action based on current knowledge, available resources, and the needs of the patient to deliver effective and safe medical care. The sole purpose of these standards/guidelines is to assist practitioners in achieving this objective.
The present guideline/standard was developed collaboratively by the EANM and SNMMI with the European Association of Neurooncology (EANO) and the working group for Response Assessment in Neurooncology with PET (PET-RANO). It summarizes the views of the Neuroimaging, Oncology and Physics Committees of the EANM, Brain Imaging Council of the SNMMI, the EANO, and PET RANO and reflects recommendations for which the EANM cannot be held responsible. The recommendations should be taken into context of good practice of nuclear medicine and do not substitute for national and international legal or regulatory provisions.
I. Introduction
Gliomas are the second most common primary brain tumor with an annual incidence rate of around six cases per 100.000 individuals worldwide (3). Gliomas represent approximately 27% of all CNS tumors and 80% of malignant
5
CNS tumors and is a leading cause of cancer mortality in adults. The most common of all malignant brain and CNS tumors is glioblastoma (46 %) with a median overall survival of 15 months in the patient subgroup treated with maximal safe tumor resection, concomitant radiation-chemo-therapy and adjuvant chemo-therapy (4).
Magnetic resonance imaging (MRI) is the primary clinical imaging modality in gliomas at all disease stages ranging from the primary evaluation, pre-surgical planning, early post-surgical evaluation of residual tumor, radiotherapy planning, surveillance during chemotherapy, and definition of recurrence.
There are defined objective and standardized MRI-based criteria for response assessment in neurooncology (RANO) applied for clinical trials in brain tumors. However, MRI contrast enhancement can be unreliable as a surrogate of tumor size or growth. It non-specifically reflects vascular surface area and contrast permeability across a disrupted blood-tumor barrier and may represent tumor biology or number of other factors including therapy-induced inflammation. Contrast enhancement can be influenced by therapeutics that impact tumor vascular permeability, such as corticosteroid, antiangiogenic (5) or immunotherapy agents (6). Because of the growing awareness of significant limitations of MRI in glioma management, the RANO criteria were recently updated (7). Hence, to identify infiltrative glioma tissue the RANO definition of tumor progression was supplemented by inclusion of “significant” enlarging areas of non-enhancing tumor on MRI T2-weighted and fluid-attenuated inversion recovery (FLAIR) image sequences. However, precise quantification of the increase in T2/FLAIR signal could not be defined and other causes of increased T2 or FLAIR signal, such as radiation effects, demyelination, ischemic injury, and edema have to be considered in the evaluation of progression.
Molecular imaging using positron emission tomography (PET) is a well-established method in systemic oncology (8), and is being increasingly used to supplement MRI in the clinical management of glioma (2, 9, 10). PET imaging could have an important role in clinical trials of new therapeutic strategies of glioma, e.g. immunotherapy, where pseudoprogression is particularly challenging for MRI (6). Recently an evidence-based recommendation by the PET-RANO working group and EANO on the clinical use of PET imaging in gliomas has been published focusing on radiotracers that are used in clinical practice imaging, i.e. glucose metabolism, 2-deoxy-2-[18F]fluoro-D-glucose (FDG), and system L amino acid transport ([11C-methyl]-methionine (MET), O-(2-[18F]fluoroethyl)-L-tyrosine (FET) and 3,4-dihydroxy-6-[18F]fluoro-L-phenylalanine (FDOPA) (2). The present guideline/standard will focus on the technical aspects of PET image acquisition with the abovementioned radiotracers, thus replacing all previously published guidelines on glioma imaging (1).
II. Goals
The goal of this standard/guideline is to assist nuclear medicine practitioners in recommending, performing, interpreting, and reporting the results of brain PET imaging in gliomas.
6
III. Definitions
1. PET systems provide static, dynamic or gated images of the distribution of positron-emitting radionuclides within the body by detecting pairs of photons produced in coincidence by the annihilation of a positron and an electron. PET images are produced by a reconstruction process using the coincidence pair data.
2. PET is generally combined with Computed Tomography (CT) in a single system (PET/CT). Combined PET/MRI systems are also available for
clinical use but are currently less widely available.
3. Nuclear Medicine Computer Systems and Software-applications collect,
quantitate, analyze, and display the imaging information.
IV. Common clinical indications
Common indications for PET imaging in glioma include, but are not limited to the following (2):
1. At primary diagnosis: a. Differentiation of grade III and IV tumors versus non-neoplastic
lesions or grade I and II gliomas b. Prognostication of gliomas c. Definition of an optimal biopsy site (e.g. site of maximum tracer
uptake) d. Delineation of tumor extent for surgery and radiotherapy planning
2. Diagnosis of tumor recurrence: a. Differentiation of glioma recurrence from treatment-induced changes,
e.g. pseudoprogression, radionecrosis 3. Disease and therapy monitoring:
a. Detection of malignant transformation in grade I and II gliomas b. Response assessment during and after radio- and/or chemo-therapy c. Differentiation between tumor response and pseudoresponse during
antiangiogenic therapy
The relative performances of the following PET tracers are different and discussed in a recent evidence-based recommendation (2).
FDG-PET plays a more limited role than amino acid PET in gliomas due to the high physiological uptake in normal brain gray matter and variable uptake by inflammatory lesions. FDG-PET is most often used to distinguish tumor recurrence from radiation necrosis in enhancing brain lesions or to distinguish gliomas from CNS lymphoma or opportunistic infection.
V. Qualification and responsibilities of the personnel
Physician: PET examinations should be performed by, or under supervision of, a physician specialized in nuclear medicine and certified by accrediting boards. In Europe, the certified nuclear medicine physician who performed the study
7
and signed the report is responsible for the procedure, according to national laws and rules. In the United States, see the SNMMI Guideline for General Imaging (Society of Nuclear Medicine., 2010, http://interactive.snm.org/docs/General_ Imaging_Version_6.0.pdf).
Technologist: PET examinations should be performed by qualified registered/certified Nuclear Medicine Technologists. Please refer to: Performance Responsibility and Guidelines for Nuclear Medicine Technologists 3.1 and http://www.eanm.org/content-eanm/uploads/2016/11/EANM_2017_TC_Benchmark.pdf (11) for further details. In some jurisdictions, there may be additional qualifications necessary for technologists to operate the CT or MR components.
Physicist: PET examinations should be performed using PET systems that comply with national or international quality standards (Section IX). A certified clinical physicist is responsible to assure that PET systems meet these quality standards. Moreover, in some countries it is required to have a board certified medical physicist available for advising/performing the above-mentioned personnel in running the imaging systems and/or in managing dys- or mal-function of the systems. In addition, examinations should be performed following national or international dosimetry and radiation safety standards, both for patients and personnel.
VI. Procedure/specifications of the examination
Recommendations for FDG specific procedures are defined in previous guidelines, and only recommendations that are new or particular to glioma are reported (12, 13).
A. Request
The nuclear medicine imaging facility should check with the nuclear pharmacy provider as to the availability of the radiotracer before scheduling the exam. Advanced notice may be required for tracer delivery.
1. The study requisition should include: a. Appropriate clinical information about the patient and a clearly
specified clinical question to justify the study and to allow appropriate exam/study coding (see Section IV)
b. Information about the ability of the patient to cooperate for the examination and the participation of a caretaker can be helpful.
c. Information about current medications, including glucocorticoids, for correct study interpretation and to avoid unwanted pharmacological interaction effects if mild sedation is necessary.
d. History of prior therapy, including prior chemotherapy, surgery and radiotherapy, which might affect radiopharmaceutical distribution
e. Results of pertinent imaging studies, resections and biopsies performed and laboratory results
f. For PET/MRI: All patients should at request be prescreened for relevant MRI contraindications using a standardized checklist (e.g. pregnancy, contrast agent reactions, implants, ports, catheters,
8
metallic implants, vascular stents, coils, active implants, cardiac pacemakers, claustrophobia, etc.) (14).
B. Patient preparation and precautions
1. Height and body weight must be documented for SUV measurements (Section VI.F.ii.1.).
2. Recent morphologic imaging with MRI (T1, T1 + contrast medium, T2/FLAIR) should be available for image fusion.
3. The patient should be informed about the procedure in order to guarantee optimal compliance.
4. The patient should be able to lie down quietly for at least 30 to 40 minutes. 5. If sedation is required with MET, FET or FDOPA, it should start about 20 -
60 minutes before the examination. If sedation is required with FDG, sedation should start as late as possible after FDG administration, ideally at least 30 min after FDG injection but prior to imaging.
6. Patient should be fasting to ensure stable metabolic conditions. A minimum 4 hours is recommended for MET, FET, FDOPA, and FDG.
7. Serum glucose should/may be measured before FDG administration, in order for the interpretation physician to be aware of potential altered biodistribution.
8. Before scanning, the patients should empty their bladder for maximum comfort during the study and in order to reduce absorbed dose to bladder, (table 3).
9. In case of pregnancy a clinical decision is necessary in which the benefits for the patient are weighed against the possible harm (8).
10. FDOPA: Premedication with carbidopa is not necessary. To date, most published studies with FDOPA-PET in brain tumors have not used carbidopa or other inhibitors of peripheral FDOPA metabolism.
11. If the PET study will be acquired using PET/MRI: a. Check MRI contraindications from checklist (Section VI.A.1.f.). b. Remove all metal (e.g. dental prostheses, clothing with zippers and
buttons) from the patient and provide cotton clothing to patient. c. Regarding implants, the specific kind of implant, its location, and its
material need to be known beforehand of an MRI examination. Ask patient for implant pass. Check with implant/device manufacturer (e.g. online) for safety level of implant (“MRI unsafe” - absolute contraindication; “MRI conditional” - relative contraindication, conditions apply; “MRI safe” - no contraindication.
d. If the patient has implants, metal implants or active devices labelled “MRI conditional”, get informed (e.g. implant pass, online) about all conditions that may apply for safe MRI examination.
e. Beyond safety concerns, implants may cause artifacts, large-volume signal voids and geometric distortions in MRI imaging. This may hamper image reading.
12. It is recommended that the patient to stay well hydrated and empty the bladder often.
9
C. Radiopharmaceuticals
- 2-deoxy-2-[18F]fluoro-D-glucose (FDG) - O-(2-[18F]fluoroethyl)-L-tyrosine (FET) - L-[methyl-11C]methionine (MET) - 3,4-dihydroxy-6-[18F]fluoro-L-phenylalanine (FDOPA)
i. Preparation of the radiopharmaceuticals
All radiopharmaceuticals must be produced by qualified personnel according to cGMP compliant methods that conform to regulatory requirements. The radiopharmaceutical is delivered ready to use. Quality control is carried out by the manufacturer prior to delivery of the final product.
ii. Administered activity in adults
The recommended injected activity for brain imaging in adults are as follows:
1. F18-FET: 185 - 200 MBq 2. C11-MET: 370-555 MBq 3. F18-FDOPA: 185 - 200 MBq 4. F18-FDG: 185 - 200 MBq
The above radiopharmaceuticals should be injected as a bolus. In children, the radioactivity dose should be calculated as a fraction of the dose for adults according to the body weight using the factors provided by the EANM Pediatric Task Group (15). The administered dose may be reduced in systems with higher sensitivity (Section X: Radiation safety).
D. PET acquisition protocols
1. Positioning: The patient scan should be performed while positioning the patient in a dedicated head holder, and arms along the body. The entire brain should be in the field of view, including the entire cerebellum. Avoid extreme neck extension or flexion.
2. Head stability: a. The patient should be informed immediately before PET acquisition
to avoid head movements during all parts of the investigation b. Head stability can be obtained by comfortably positioning the patient
in the head holder and securing the head as completely as possible. Tape, padding or other flexible head restraints including termoplastic mould and vaccum mattress for children may be employed and are often helpful specially for radiotherapy (RT) planning purposes.
c. During the entire investigation, continuous visual monitoring of the patient is necessary. Monitoring is particularly important in patients with tumor associated seizures. Seizure activity during the uptake
10
phase of FDG and FET can lead to increased uptake in brain affected by seizure activity and be mistaken for tumor.
3. The preferred sequence of PET imaging is: a. CT scout topogram for PET/CT to setup field of view b. For attenuation correction (see Section VI.D.4, below): Low-dose CT
scan, MRI attenuation correction scan or transmission scan. Mathematical attenuation correction (i.e. based on the patient’s external contour derived from a non-attenuation corrected PET image) should not be applied.
c. Static or dynamic single FOV PET acquisition 4. Image acquisition should be performed in 3D data acquisition mode and
attenuation correction should be based on low-dose CT, on MRI attenuation correction, or on a 511keV-transmission scan. If 511keV-transmission scanning is used, the transmission images should be acquired before tracer injection. CT parameters should always be chosen to ensure the lowest doses to the patient that are compatible with this purpose. The following points relevant to attenuation correction in PET/MRI are to be considered:
a. In PET/MRI, attenuation correction is based on MRI imaging, thus, MRI-based attenuation correction needs to be accurate and free of artifacts to provide accurate PET quantification.
b. Users should use the latest version of MRI attenuation correction software including ultrashort echo time (UTE), zero TE (ZTE) sequences or bone-models for bone detection in brain PET/MRI, where available (16, 17)
c. Various attenuation correction strategies for PET/MRI have been implemented. Some may lead to systematic differences in the activity distribution and calculated semiquantitative metrics (Section VI.F.ii) (18), that should carefully be considered during PET image interpretation (19, 20).
d. MRI attenuation correction images must routinely be checked for artifacts, consistency and plausibility during PET/MRI reading. Artifacts in MRI attenuation correction have a direct effect on PET quantification in brain PET/MRI. Typical artifacts are mis-segmentation of brain/fat/bone tissue, metal artifacts due to dental prostheses and due to metallic implants such as coils, stents, surgical clips, etc (18, 21, 22). Artifacts may show as signal voids, exceeding the true dimensions of metal inclusions. Thus, artifacts are mostly well detectable in MRI attenuation correction indicating regions of potentially inaccurate PET quantification (23, 24).
e. Where applicable, use time-of-flight (TOF) PET detection to reduce impact of metal artifacts in brain PET/MRI examinations (25).
f. Only use radiofrequency (RF) head coils that are labelled for combined PET/MRI use only. Using standard RF head coils that are labelled for MRI-only use will not be considered in PET/MRI attenuation correction and may, thus, lead to inaccurate PET quantification and artifacts in PET.
g. In case of longitudinal studies the patient should always be scanned on the same system using the same procedures to avoid changes related to differences in imaging technology or methodology. In
11
cross-sectional studies, one should consider possible differences among scans related to the technologies being used. Particular care is warranted in pediatric patients.
5. To ensure PET comparability, a standardized protocol for clinical reading should be used with a fixed time for the start of image acquisition.
a. FET: 20 min static image acquisition obtained 20 minutes post injection. This may be part of a 40-50 min dynamic image acquisition initiated at tracer injection. In case of a dynamic image acquisition it is recommended to start the acquisition using short frames that progressively increases in duration. From 10 to 50 minutes post injection 5 minutes acquisition frames should be applied allowing to assess the slope in tracer uptake at this interval. During the first 10 minutes post injection, the following image acquisition frames could be used: 12 frames of 5 seconds, 6 frames of 10 seconds, 6 frames of 30 seconds and 5 frames of 60 seconds allowing to precisely obtain information of the tracer uptake phase.
b. MET: 20 min static image acquisition obtained 10 minutes post injection
c. FDOPA: 10-20 min static image acquisition obtained 10-30 minutes post injection
d. FDG: 10-20 min static image acquisition obtained at least 45 min post injection
6. If movement artifacts are expected, it can be helpful to acquire the static time window dynamically e.g. in 5-min frames, or in list-mode, check the sinograms, and use only the sinograms of the properly acquired motion-free time period for reconstruction.
E. PET image reconstruction
1. During image reconstruction, all corrections needed for quantitative interpretation are required such as attenuation, scatter, random, dead time and decay corrections as well as detector sensitivity normalization.
2. Time of flight acquisitions and reconstructions are allowed, although the benefit for brain imaging is not yet completely investigated.
3. Iterative reconstruction is the field standard and should be applied. However, in case iterative reconstructions would result in upward bias due to non-negativity constraints applied during reconstruction, filtered back-projection reconstruction may be used as alternative reconstruction method
4. The use of resolution modeling during reconstruction, so-called point-spread-function (PSF) reconstructions, may give rise to Gibbs artifacts and quantitative errors (26), and is not recommended.
5. Moreover, in order to harmonize PET image quality, the following reconstruction settings/protocols are recommended:
a. One of the reconstructions should be performed using settings so that the reconstructed images meet EARL requirements for IQ recovery (8) thereby allowing harmonization of PET data for multicentre settings or for use with reference datasets.
b. As the above harmonizing reconstruction settings will assure comparable image quality among different generations of PET/CT
12
systems, a higher resolution reconstruction may be desired or required for visual interpretation or tumor delineation. When a specific PET system allows the application of multiple reconstructions, a high-resolution dedicated brain reconstruction protocol may be applied. The latter protocol should preferably meet the following requirements:
i. Voxels sizes of preferably 1-2 mm, but smaller than 3 mm in any direction
ii. Reconstructed spatial resolution < 6 mm FWHM
F. Interpretation/Quantification
SUV calculations and Image analysis
i. General image display:
1. PET images should have at least 16-bit pixels to provide an adequate range of values, and appropriate image scaling should be employed for image display. A color scale may be used. PET images should be displayed in the transaxial orientation and additionally correlated with morphological images in coronal and sagittal planes.
2. Internal landmarks can be used for reorientation to achieve a standardized image display. Reorientation procedures based on the intercommisural line are commonly used (27).
3. FET, MET, FDOPA: If the display scale is in color, it should be adjusted so that the background radioactivity of healthy brain is in the lower third of the range (blue hue in the widely used Sokoloff scale), in order to create standardized conditions for the visual detection of increased tracer accumulation above background.
4. FDG: The display scale should be initially adjusted so that the radioactivity in normal cerebral cortex is near the maximum of the scale. If lesions have higher uptake than cerebral cortex, the scale should be adjusted such that the lesion with the highest uptake is near to maximum of the scale. Color scales with 10 or 20 increments are useful to estimate the relative concentrations of FDG across brain regions and in lesions.
ii. Static FET, MET, FDOPA PET
1. Calculation of the standardized uptake value (SUV) is optional and may be performed by dividing the radioactivity concentration (kBq/ml) in the tissue by the radioactivity (MBq) injected per body weight (kg), body surface area (m2) or lean body mass (kg) (depending on the most appropriate distribution volume for each tracer).
2. Standard summation images in the ranges defined in Section VI.D.8.a-c are used for clinical reading and should be co-registered and fused with recent high-resolution post-contrast T1, T2/FLAIR MRI sequences. Fusion to other MRI sequences is optional. Usually vendor provided co-registration software solutions are sufficiently robust for clinical use, but must routinely be checked for misalignment during reading. This can be done by adjusting
13
the PET colour scale to clearly visualize the scalp and nose of the patient and compare to these structures on MRI.
3. In a first visual analysis, a qualitative evaluation can be performed and the lesion of interest can be classified as either positive, when tracer uptake visually exceeds the background activity in contralateral cortex, or as negative, when no increased uptake can be found
4. MET, FET: In order to ensure intraindividual as well as interindividual comparability, semiquantitative measures of mean and maximal tumor activity uptake values (TBRmean, TBRmax) are calculated as a ratio to healthy appearing reference brain tissue.
a. The mean physiological brain activity uptake in healthy appearing cortex of the hemisphere contralateral to the tumor including grey and white matter is measured from a large “banana” / crescent shaped background volume of interest (VOI) (28).
b. The measurement of TBRmean depends on the delineation of the tumor VOI.
5. FDOPA: Semiquantitative measures of mean and maximal tumor activity uptake values (TSRmean, TSRmax) can be calculated as a ratio to the healthy appearing striatum (29) contralateral to the tumor. Striatum is the most commonly used reference region. Other reference regions have not been investigated systematically.
iii. Static FDG PET
1. A static image acquired for 10-20 min at least 45 min post-injection is used for clinical FDG-PET reading and should be co-registered and fused with recent high-resolution post-contrast T1 and T2/FLAIR MRI sequences. Fusion to other MRI sequences are optional.
2. The direct use of SUVs generally has a limited role in the clinical interpretation of FDG-PET neurooncology studies.
3. Qualitative visual analysis can be performed and the lesion of interest can be classified as either positive, when FDG uptake visually exceeds the activity in a reference region (e.g. normal appearing white matter or cerebral cortex depending), or as negative when FDG uptake in the lesion is less than the reference region. Using white matter as the reference region increases sensitivity for detecting recurrent tumor at the expense of specificity, while using cerebral cortex increases specificity at the expense of sensitivity.
4. Lesion to reference region ratios using mean or maximum SUV can be used to provide a measure of FDG uptake in lesions. Numerical cut-offs for distinguishing tumor from benign lesions such as radiation necrosis and for grading tumors are not well established for FDG. If ratios are used, either white or gray matter rather than a mixture of both should be used for reference due to the substantially higher FDG uptake in gray matter compared to white matter. Additionally, normal appearing brain should be considered for the reference region to provide consistency across studies.
5. The regional metabolic rate of glucose can be estimated in lesions and normal brain by compartmental modeling or by using graphical analytical approaches. A correction factor, the so-called “lumped constant” (30), can be used to convert the FDG values to values reflecting glucose metabolism
14
(31). However, little is known about the accuracy of these methods in brain tumors and/or treatment effects. Currently, there is insufficient data to recommend these types of quantitative studies in routine clinical FDG-PET for neurooncology.
iv. Cut-off thresholds for definition of biological tumor volume (BTV):
FDG: Not available
FET: > 1.6 - 1.8 of the mean value in healthy appearing brain (Section VI.F.ii.4.a) (32)
MET: > 1.3 of the mean value in healthy appearing brain (33)
FDOPA: > mean value in healthy striatum (29). Not validated histologically.
v. Dynamic PET acquisition
An established clinical value of dynamic PET acquisitions applies only for FET (2). Time-activity-curves (TAC) from the mean tissue radioactivity in the tumor ROI/VOI (SUV, Bq/cc, counts/cc) as a function of time can be generated from dynamic FET PET images. The TAC of the healthy brain (Section VI.F.ii.4.a) should be plotted for comparison to exclude technical artifacts. In order to extract the TACs of the most aggressive tumor area and to provide sufficient count statistics for curve generation, the following approach is recommended:
1. The VOI is drawn semiautomatically using an individually adapted iso-contour of the tumor maximum yielding a volume of 1 - 2 ml or using a standard ROI/VOI with a fixed diameter of 1.6 cm centered on the tumor maximum yielding a volume of 2 ml.
2. These ROIs/VOIs can be defined on the summation images of 20-40 minutes or 10-30 minutes. The latter may be better suited to depict the early peak uptake in more aggressive gliomas
3. The shape of the TACs are classified into increasing, decreasing or plateau. For the assessment of time-to-peak (TTP), the time point of the tumor peak uptake is noted.
vi. Interpretation of static FET/MET/FDOPA PET data
Based on the 2016 WHO classification (34), gliomas will be progressively divided into combined classes based on histological and molecular characteristics rather than low or high grade glioma: i.e. (a) astrocytomas grade II and III (with IDH1 mutation, without 1p/19q codeletion) (35), (b) oligodendrogliomas grade II and III (with IDH1 mutation, with 1p/19q codeletion) (36), (c) wildtype astrocytomas or oligodendrogliomas not otherwise specified (NOS), (d) secondary glioblastomas (with IDH1 mutation), and (e) primary glioblastomas (IDH1 wildtype or IDH1-negative) (37, 38). Available data on range of radiotracer uptake are limited to FDG, FET and MET (39–43) Further
15
evidence is required to complement molecular characterization of gliomas and implement radiotracers in the new classification.
1. At primary diagnosis: a. Negative scan: Uptake in the range of the background or slightly
above excludes a grade III-IV glioma, lymphoma or metastasis with high probability. Also, an oligodendroglial tumor is very unlikely. A grade I and II astrocytoma cannot be excluded, since approximately 30 % exhibit low uptake.
b. Positive scan: Increased uptake has high positive predictive value for a neoplastic process. A reliable differentiation of grade III and IV and grade I and II gliomas is not possible because of a high proportion of active tumors in the latter, especially in oligodendrogliomas. Local areas with the highest uptake should be used for biopsy guidance.
2. Therapy planning: FET, MET: Areas with uptake larger than the above BTV cut-off activity thresholds are used to delineate the metabolically active tumor tissue for planning of surgery and radiotherapy.
3. Tumor recurrence: Increased uptake in the follow-up of previously treated glioma has high accuracy in differentiating treatment related changes e.g. pseudoprogression, radionecrosis, from recurrent disease
4. Therapy monitoring: Progressive amino acid uptake during different kinds of therapy is indicative of therapy failure while regressive uptake indicates responsiveness. FET and FDOPA PET have been shown to identify pseudoresponse during antiangiogenic therapy.
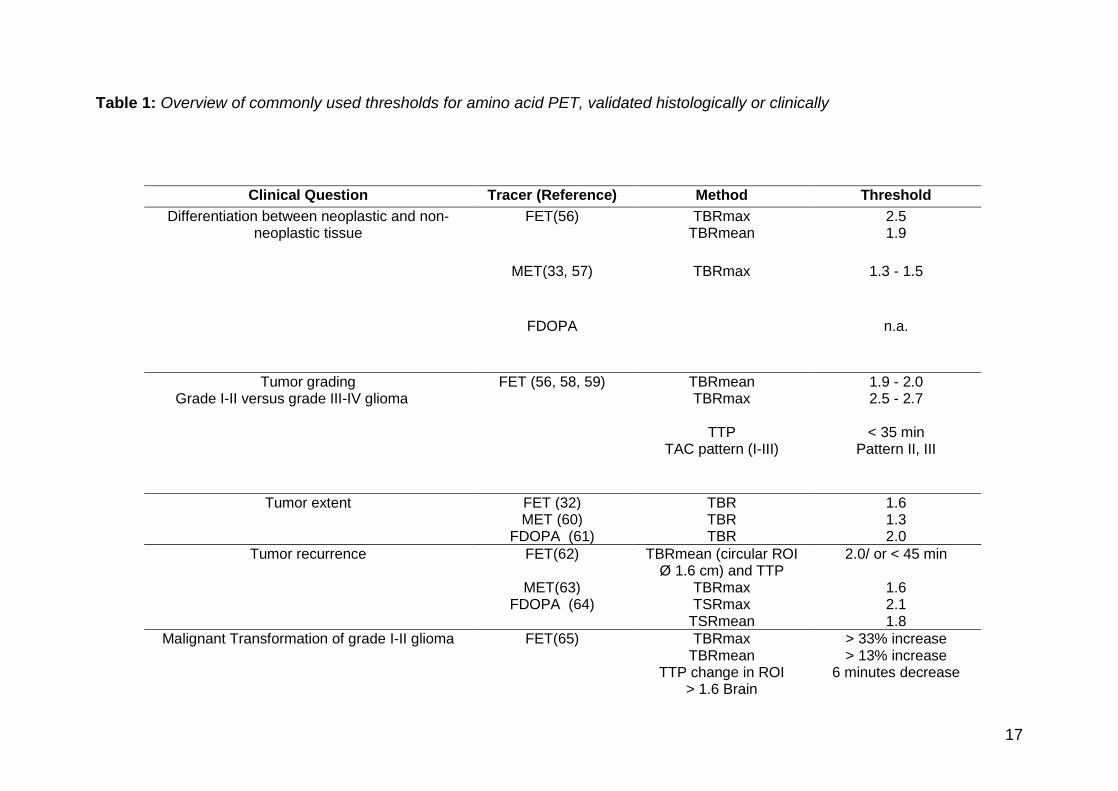
The threshold of the TBRmean and TBRmax ratios establishing a pathological amino acid accumulation depends on the technique of ROI definition, spatial resolution of the PET scan (system type, reconstruction, data filtering) and the clinical question to be answered (44). The thresholds divided by clinical questions are summarized in Table 1.
vii. Interpretation of static FDG PET data
1. At primary diagnosis a. Increasing FDG uptake by gliomas is correlated with higher grade
and worse prognosis (2, 45–48). Grade I and II gliomas typically have FDG uptake similar to or less than white matter although some grade I and II gliomas such as pilocytic astrocytomas have high FDG uptake. Grade III and IV grade gliomas typically have FDG uptake greater than white matter. See comments on the new WHO classification scheme (Section VI.F.vi.1.).
b. There is overlap between grade I and II vs. grade III and IV glioma FDG uptake, particularly for gliomas with FDG uptake greater
16
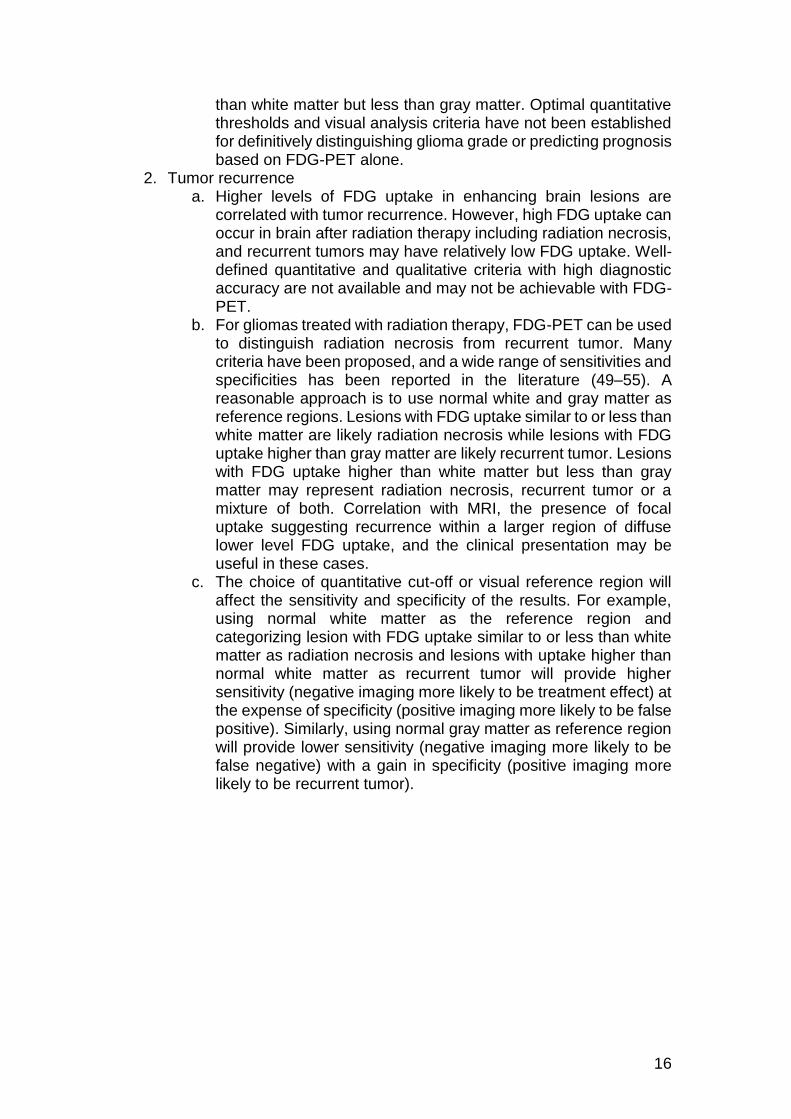
than white matter but less than gray matter. Optimal quantitative thresholds and visual analysis criteria have not been established for definitively distinguishing glioma grade or predicting prognosis based on FDG-PET alone.
2. Tumor recurrence a. Higher levels of FDG uptake in enhancing brain lesions are
correlated with tumor recurrence. However, high FDG uptake can occur in brain after radiation therapy including radiation necrosis, and recurrent tumors may have relatively low FDG uptake. Well-defined quantitative and qualitative criteria with high diagnostic accuracy are not available and may not be achievable with FDG-PET.
b. For gliomas treated with radiation therapy, FDG-PET can be used to distinguish radiation necrosis from recurrent tumor. Many criteria have been proposed, and a wide range of sensitivities and specificities has been reported in the literature (49–55). A reasonable approach is to use normal white and gray matter as reference regions. Lesions with FDG uptake similar to or less than white matter are likely radiation necrosis while lesions with FDG uptake higher than gray matter are likely recurrent tumor. Lesions with FDG uptake higher than white matter but less than gray matter may represent radiation necrosis, recurrent tumor or a mixture of both. Correlation with MRI, the presence of focal uptake suggesting recurrence within a larger region of diffuse lower level FDG uptake, and the clinical presentation may be useful in these cases.
c. The choice of quantitative cut-off or visual reference region will affect the sensitivity and specificity of the results. For example, using normal white matter as the reference region and categorizing lesion with FDG uptake similar to or less than white matter as radiation necrosis and lesions with uptake higher than normal white matter as recurrent tumor will provide higher sensitivity (negative imaging more likely to be treatment effect) at the expense of specificity (positive imaging more likely to be false positive). Similarly, using normal gray matter as reference region will provide lower sensitivity (negative imaging more likely to be false negative) with a gain in specificity (positive imaging more likely to be recurrent tumor).
17
Table 1: Overview of commonly used thresholds for amino acid PET, validated histologically or clinically
Clinical Question Tracer (Reference) Method Threshold
Differentiation between neoplastic and non-neoplastic tissue
FET(56) TBRmax TBRmean
2.5 1.9
MET(33, 57) TBRmax 1.3 - 1.5
FDOPA n.a.
Tumor grading Grade I-II versus grade III-IV glioma
FET (56, 58, 59) TBRmean TBRmax
TTP
TAC pattern (I-III)
1.9 - 2.0 2.5 - 2.7
< 35 min
Pattern II, III
Tumor extent FET (32) TBR 1.6 MET (60) TBR 1.3
FDOPA (61) TBR 2.0
Tumor recurrence FET(62) TBRmean (circular ROI Ø 1.6 cm) and TTP
2.0/ or < 45 min
MET(63) TBRmax 1.6 FDOPA (64) TSRmax
TSRmean 2.1 1.8
Malignant Transformation of grade I-II glioma FET(65) TBRmax TBRmean
TTP change in ROI > 1.6 Brain
> 33% increase > 13% increase
6 minutes decrease

18
Differentiation between early pseudoprogression and true progression
FET(66) TBRmax
2.3
Differentiation between late pseudoprogression and true progression
FET(67) TBRmax TBRmean
1.9 1.9
Identification of responder in treatment response evaluation
FET(68–70) Radiochemotherapy TBRmax
TBRmean
Bevacizumab/Irinotecan BTV
7-10 days Decrease > 20 % Decrease > 5%
4 -12 weeks
Decrease > 45%
MET (71) Temozolomide TBRmax
stable or decreasing
FDOPA(29) Bevacizumab BTV
2 weeks Decrease > 35 %
BTV < 18 mL
19
viii. Interpretation of dynamic FET PET data:
1. An early peak of the TAC shape of mean ROI/VOI activity (< 20 min p.i.) followed by a plateau or a decreasing TAC is indicative of a grade III and IV tumor.
2. Continuously increasing uptake up to 40 min p.i. is more frequently observed in grade I and II gliomas, but not specific. This TAC pattern is also typical for treatment induced changes e.g. radionecrosis, pseudoprogression
3. Change of TAC pattern in the follow-up of grade I and II gliomas from increasing TAC to an early peak with a decreasing TAC is indicative of malignant transformation (65)
ix. Physiological tracer distribution
1. FDG: a. Common: High physiologic uptake in gray matter (e.g. cerebral
and cerebellar cortex, deep gray nuclei). b. Common: Moderate uptake in the extraocular muscles c. Occasionally: Brain activation during the uptake phase such as
patient motion or visual stimulation can result in higher uptake in the associated regions in the cerebral cortex.
2. FET, MET(72): a. Common: Slight uptake in vascular structures, basal ganglia,
cerebellum, skin, salivary glands
b. Occasionally: Slight focal uptake in pineal body,choroid plexus,
clivus bone marrow 3. FDOPA:
a. Common: Moderately increased uptake in basal ganglia and pituitary and slight uptake in the cerebellum, skin, optic nerve, ocular muscles, and salivary glands
b. Occasionally: Pineal body c. No increase in vascular structures
x. Known pitfalls
1. All tracers: a. Uptake may be increased in inflammatory lesions and epileptic
seizures b. Uptake may be underestimated in small lesions relative to image
resolution 2. FDG:
a. High FDG uptake in gray matter can obscure lesions within or adjacent to gray matter
b. High blood glucose levels at the time of injection decreases uptake in tumor and healthy tissue, but may not affect lesion detection
c. Perivascular infiltration of FDG d. Anatomical abnormalities

20
e. Treatment effects may decrease FDG uptake in the treatment area and brain regions that receive synaptic input from the treated area (diaschisis)
3. MET, FET, FDOPA: a. TBRmean, TBRmax and BTV may be overestimated if there is
reduced uptake in the reference brain tissue VOI because of structural changes e.g. atrophy, trauma, infarcts, or reduced tracer delivery e.g. ischemia
b. As MET, FET, and FDOPA all are transported across the blood-brain barrier and into cells by system L amino acid transport, they can all be expected to have similar pitfalls (Table 2).
4. Dynamic FET a. In early images, up to 15 min post-injection blood pool is relatively
high and tracer activity within vascular structures may appear as uptake in tumor tissue
b. Reduced uptake in occipital and temporal skin areas may be seen on static images, probably reduced perfusion secondary to head padding
c. An increasing TAC may indicate inflammatory lesions d. A decreasing TAC may be seen in WHO grade II oligodendroglial
tumors (around 50%) e. A decreasing TAC may be seen in tumors close to sinuses
because of influence from venous blood activity f. TACs after antiangiogenic treatment can change from decreasing
to increasing pattern
21
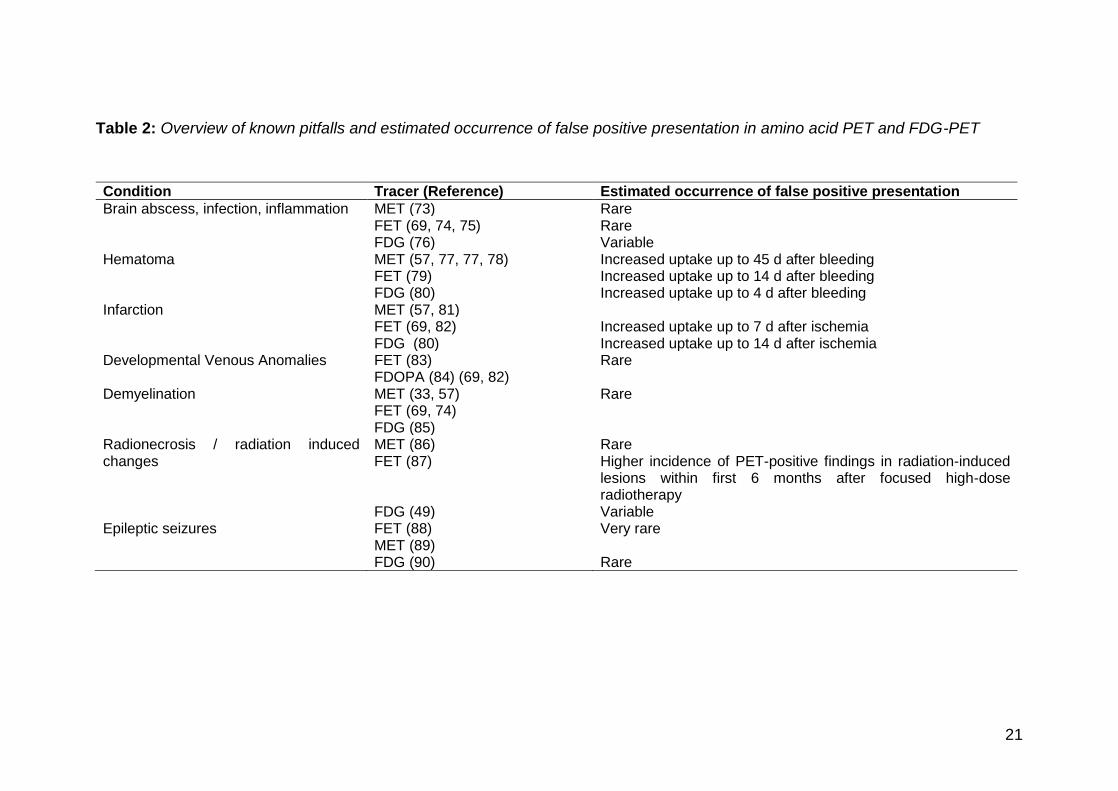
Table 2: Overview of known pitfalls and estimated occurrence of false positive presentation in amino acid PET and FDG-PET
Condition Tracer (Reference) Estimated occurrence of false positive presentation
Brain abscess, infection, inflammation MET (73) Rare FET (69, 74, 75) FDG (76)
Rare Variable
Hematoma MET (57, 77, 77, 78) Increased uptake up to 45 d after bleeding FET (79) FDG (80)
Increased uptake up to 14 d after bleeding Increased uptake up to 4 d after bleeding
Infarction MET (57, 81) FET (69, 82) FDG (80)
Increased uptake up to 7 d after ischemia Increased uptake up to 14 d after ischemia
Developmental Venous Anomalies FET (83) Rare FDOPA (84) (69, 82) Demyelination MET (33, 57) Rare
FET (69, 74) FDG (85)
Radionecrosis / radiation induced changes
MET (86) Rare FET (87) FDG (49)
Higher incidence of PET-positive findings in radiation-induced lesions within first 6 months after focused high-dose radiotherapy Variable
Epileptic seizures FET (88) MET (89) FDG (90)
Very rare Rare
22
VII. Documentation and reporting
Description of findings in brain tumor imaging should generally comply with guidelines as published previously for FDG imaging in oncology and with regard to general aspects of reporting such as due diligence (8).
The content of the report affects patient management and clinical outcomes, and is a legal document. It is good practice to provide a structured report with concise concluding statements intended to answer the specific clinical question(s) posed, if possible.
Regardless of the radiotracer, reports should contain the following general structure:
1) General information: a) Name of the patient and other identifiers, such as birthdate b) Name of the referring physician c) Type and date of examination d) Radiopharmaceutical including route of administration and amount of
activity administered e) Patient history with emphasis on diagnosis and tumor related treatment
and clinical question leading to study request (see Common clinical indications Sections IV and VI A)
2) Body of the report: a) Procedure description:
i) Information on the imaging procedure (e.g. static or dynamic scan) and interval between PET tracer injection and image acquisition
ii) If FDG is used, the measured blood glucose level at the time of injection should be recorded.
iii) If sedation is performed, describe type and time of medication in relation to the tracer injection
iv) If low-dose CT is used for attenuation correction, a statement such as “not performed for diagnostic purposes, not replacing diagnostic CT” could be added
v) The use of a non-conventional system-type (e.g. PET/MRI) should be mentioned.
b) Data quality: i) Abnormal tracer biodistribution ii) CT-related artifacts e.g. from metallic implants iii) Poor compliance to fasting iv) Any observed events that may adversely influence interpretation, e.g.
head movements, seizure activity v) For FDG: increased blood glucose level.
c) Comparative data: i) PET images should be compared to morphological data, particular
MRI, whenever possible. ii) PET images should be compared to previous PET scans to evaluate
the course of disease.
23
iii) The type and date of comparative data should be noted before the description of imaging findings.
d) Description of findings: i) It should be stated if radiotracer uptake is normal or abnormal ii) In case of abnormal findings, an anatomically correct description of
the location, the extent and the intensity of pathological tracer accumulation related to normal tissue uptake should be described
iii) The uptake characteristics include: (1) Shape of uptake e.g. focal, diffuse, inhomogeneous (2) Intensity of uptake relative to healthy brain: Slight, moderate or
strong (3) Extent and peak correlated to e.g. T1 contrast enhancement
and/or T2/FLAIR hyperintensity on MRI or obvious anatomical abnormalities on CT/low-dose CT
iv) Semiquantitative parameters: (1) Calculate and report the TBRmax. Reporting the TBRmean and
BTV are optional. The assessment of FDG SUV/SUVr, TBRmean , TBRmax and BTV are optional in the clinical setting and do not have well established utility in characterizing gliomas or distinguishing treatment effects from recurrence.
(2) When dynamic imaging is performed with FET, the pattern of tumor TAC (increasing, decreasing, plateau) should be described, the reporting of TTP and slope are optional
v) Clinically relevant incidental findings should be reported, e.g. extracerebral metastases.
vi) Comparison to previously performed PET studies, e.g. for therapy response or malignant transformation.
e) Limitations: When appropriate, factors that limit data quality or diagnostic accuracy should be mentioned (Table 2).
3) Interpretation: The interpretation should address the question raised in the clinical request and integrate medical history, comparative imaging and any limitations. A precise diagnosis should be given whenever possible. Additional scans or follow-up scans should be recommended when appropriate.
VIII. Equipment Specifications
A. System specifications:
The use of state of the art 3D PET/CT or PET/MRI systems is recommended. The system should allow for the collection of low dose CT images or MRI based sequences that can be used for attenuation and scatter correction of the PET emission data. Dedicated brain PET only systems may be used provided that these systems are equipped with transmission scan sources of sufficient strength - as recommended by the vendor - to assure sufficient quality of the transmission scans and thereby of the PET emission data attenuation correction. PET(/CT) Systems should have a minimal axial field of view of 15
24
cm to assure sufficient coverage of the entire brain, including cerebellum and brain stem.
B. PET acquisition:
The system should be able to acquire both static and dynamic or list mode PET emission data in 3D mode. Data should be reconstructed online or offline (i.e. retrospectively) in single or multiple frames as specified by the study protocols and this guideline. In addition, PET images can be reconstructed with and without attenuation correction. The non-attenuation corrected PET images are not used for primary interpretation but can be useful for recognizing attenuation artifacts in the attenuation corrected PET images. The system should have all functionalities and methods available as required for quantitative brain PET imaging and reconstruction, such as, but not limited to, online randoms correction, scatter correction, attenuation correction, dead time correction, decay and abundance correction and normalization (correction for detector sensitivities).
IX. Quality control and improvement
A. Quality control and inter-institutional PET system performance harmonization
Various factors affecting PET image quality and quantification have previously been reviewed (91). Although this review focused on the use of radiolabeled amino acids and FDG for glioma imaging, the technical and imaging physics related uncertainties indicated in that review are valid for any PET examination regardless of radiotracer or specific application. The use of brain PET examinations in multicenter studies and/or when data are compared to a reference database or disease patterns it is of utmost importance that PET data are collected in such a manner that they can be pooled and compared. In order to guarantee sufficient image quality, quantitative performance and image harmonization the correct performance of the PET systems must be regularly checked by several QC experiments.
The following QC experiments are recommended:
1. All regular and vendor provided maintenance and quality control procedures should be followed. Quality control experiments should at least address the following:
• Daily check of detector performance, i.e. with point, rod or cylindrical sources to automatically test and visualize proper functioning of detector modules including inspection of 2-D sinograms.
• Daily check of PET activity concentration measurement calibration using an activity filled cylindrical phantom source following the procedure given by manufacturer
• Cross-calibration of the PET(/CT) system against the locally used dose calibrator to prepare and measure the patient specific radiotracer activities. Cross-calibrations should be performed following EARL recommendations and criteria
25
• Correct alignment between PET and CT should be verified according to vendor recommended procedures and frequency
• Additional QC procedures performed less frequently according to manufacturer given instructions and the EANM recommendations for routine quality control of nuclear medicine equipment (92).
B. CT quality control (CT-QC)
From the EU guideline of FDG PET/CT tumor imaging: Several documents and reports on CT quality control (CT-QC) have been published and are listed below
for readers’information. An overview of CT-QC is given in, for example, the
“Equipment Specifications” and “Quality Control” sections of the American
College of Radiology Practice Guideline for the Performance of Computed Tomography of the Extracranial Head and Neck in Adults and Children, the American College of Radiology Practice Guideline for the Performance of Pediatric and Adult Thoracic Computed Tomography (CT), and the American College of Radiology Practice Guideline for the Performance of Computed Tomography (CT) of the Abdomen and Computed Tomography (CT) of the Pelvis and in IPEM report 91. In addition, CT performance monitoring guidelines are given in the American College of Radiology Technical Standard for Medical Physics Performance Monitoring of Computed Tomography (CT) Equipment.
C. MR Quality control in PET/MRI
While there are no regulatory requirements for special/standard QC-/QA-procedures for MRI systems, numerous points are to be considered to conduct safe and high-quality MRI examinations as outlined in section VI. It is advisable to adhere to the manufacturer’s provisions (i.e. follow the intervals of planned maintenance). For PET/MRI systems a suggestion for basic MRI-QC to be performed by the user can be found in a respective review (93).
X. Radiation safety
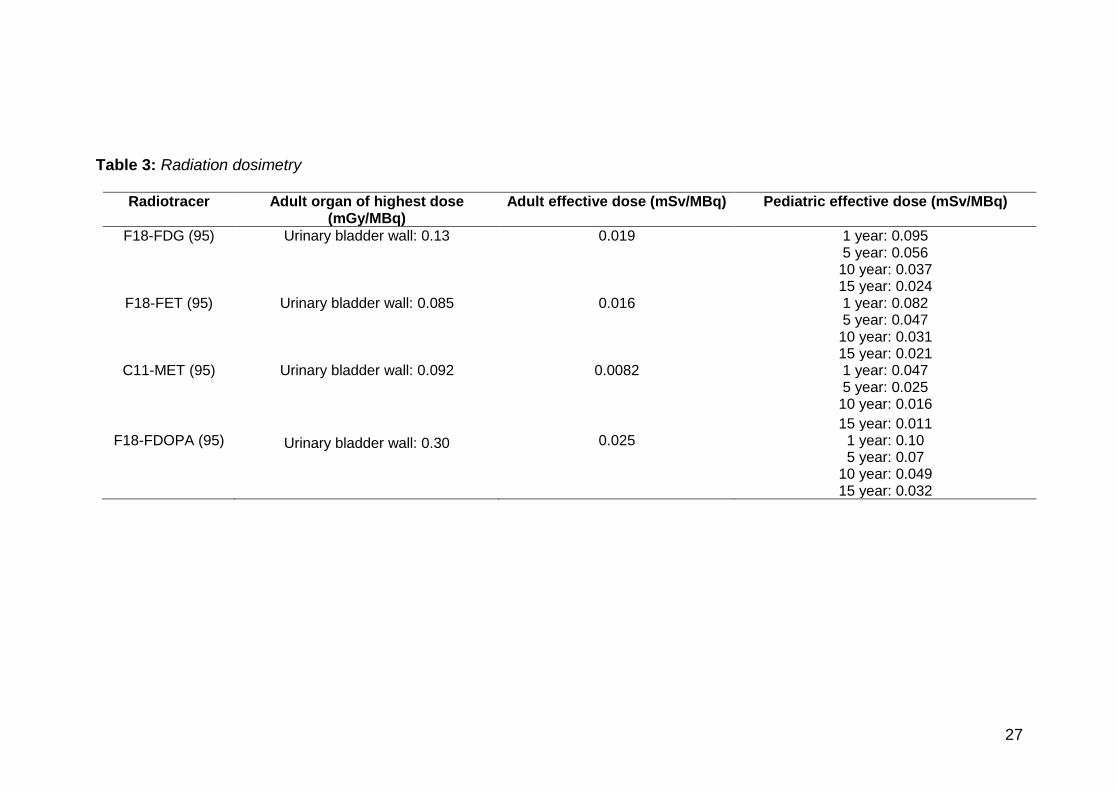
The systemic use of radiotracers causes a systemic radiation exposure of the patients. For the amounts of radioactivity usually to be administered for 11C-labeled and 18F-labelled PET radioligands (see Section VI.C.ii) this results in an effective dose (ED) of the same order of magnitude of other 11C- and 18F-labeled radiotracers (94). The radiation dose by the low-dose CT of the head region depends on the CT scanning parameters and generally is well below 0.5 mSv. The overall ED by PET/CT investigations of the head region, when accounting for the whole-body exposure, should remain near or below 5 mSv.
In adults, the organ with the highest radiation dose for all the above tracers is the urinary bladder wall.

26
27
Table 3: Radiation dosimetry
Radiotracer Adult organ of highest dose (mGy/MBq)
Adult effective dose (mSv/MBq) Pediatric effective dose (mSv/MBq)
F18-FDG (95) Urinary bladder wall: 0.13 0.019 1 year: 0.095 5 year: 0.056 10 year: 0.037 15 year: 0.024
F18-FET (95) Urinary bladder wall: 0.085 0.016 1 year: 0.082 5 year: 0.047 10 year: 0.031 15 year: 0.021
C11-MET (95) Urinary bladder wall: 0.092 0.0082 1 year: 0.047 5 year: 0.025 10 year: 0.016
15 year: 0.011 F18-FDOPA (95) Urinary bladder wall: 0.30 0.025 1 year: 0.10
5 year: 0.07 10 year: 0.049 15 year: 0.032
28
XI. Conclusion
Since the previous EANM guideline from 2006 (1) the clinical use of molecular imaging with PET and PET/CT in the diagnosis of glioma has continuously increased in Europe and in the US. For successful and appropriate use of this technology, a clear understanding of the capabilities and limitations of the technology and appropriate patient selection, preparation, scan acquisition, and image reconstruction is required. This document attempts to provide some guidance on the performance and interpretation of molecular imaging to supplement recent clinical guidelines (2), and to bring PET brain imaging into daily clinical practice and into larger scale inter-institutional clinical neurooncological trials across imaging platforms.
XII. Acknowledgments
The guidelines were brought to the attention of all other EANM Committees and to the National Societies of Nuclear Medicine. The comments and suggestions from the EANM Radiation Protection and the Technologist Committee are highly appreciated and have been considered for this Guideline. We acknowledge the contribution of previous guidelines from which the present is based (1, 12, 13, 96)
XIII. References
1. Vander Borght T, Asenbaum S, Bartenstein P et al. EANM procedure guidelines
for brain tumour imaging using labelled amino acid analogues. Eur J Nucl Med Mol
Imaging. 2006;33:1374-1380.
2. Albert NL, Weller M, Suchorska B et al. Response Assessment in Neuro-
Oncology working group and European Association for Neuro-Oncology
recommendations for the clinical use of PET imaging in gliomas. Neuro Oncol. 2016
3. Ostrom QT, Gittleman H, Fulop J et al. CBTRUS Statistical Report: Primary
Brain and Central Nervous System Tumors Diagnosed in the United States in 2008-
2012. Neuro Oncol. 2015;17 Suppl 4:iv1-iv62.
4. Weller M, van den Bent M, Tonn JC et al. European Association for Neuro-
Oncology (EANO) guideline on the diagnosis and treatment of adult astrocytic and
oligodendroglial gliomas. Lancet Oncol. 2017;18:e315-e329.
5. Reardon DA, Ballman KV, Buckner JC, Chang SM, Ellingson BM. Impact of
imaging measurements on response assessment in glioblastoma clinical trials. Neuro
Oncol. 2014;16 Suppl 7:vii24-35.
6. Okada H, Weller M, Huang R et al. Immunotherapy response assessment in
neuro-oncology: a report of the RANO working group. Lancet Oncol. 2015;16:e534-
42.
29
7. Wen PY, Macdonald DR, Reardon DA et al. Updated response assessment
criteria for high-grade gliomas: response assessment in neuro-oncology working group.
J Clin Oncol. 2010;28:1963-1972.
8. Boellaard R, Delgado-Bolton R, Oyen WJ et al. FDG PET/CT: EANM
procedure guidelines for tumour imaging: version 2.0. Eur J Nucl Med Mol Imaging.
2015;42:328-354.
9. Langen KJ, Galldiks N, Hattingen E, Shah NJ. Advances in neuro-oncology
imaging. Nat Rev Neurol. 2017;13:279-289.
10. Langen KJ, Watts C. Neuro-oncology: Amino acid PET for brain tumours -
ready for the clinic. Nat Rev Neurol. 2016;12:375-376.
11. Fragoso Costa P, Santos A, Testanera G. An insight into the EANM
technologist committee benchmark document on nuclear medicine technologists’
competencies. Eur J Nucl Med Mol Imaging. 2017;44:1604-1606.
12. Waxman AD, Herholz K, Lewis DH et al. Society of Nuclear Medicine
Procedure Guideline for FDG PET Brain Imaging Version 1.0. 2009
13. Varrone A, Asenbaum S, Vander Borght T et al. EANM procedure guidelines
for PET brain imaging using [(18)F]FDG, version 2. Eur J Nucl Med Mol Imaging.
2009;36:2103-2110.
14. Shelock FG. Reference Manual for Magnetic Resonance Safety, Implants, and
Devices: 2018 Edition. Biomedical Research Publishing Group; 2018
15. Lassmann M, Biassoni L, Monsieurs M, Franzius C, Jacobs F, EANM DAPC.
The new EANM paediatric dosage card. Eur J Nucl Med Mol Imaging. 2007;34:796-
798.
16. Koesters T, Friedman KP, Fenchel M et al. Dixon Sequence with Superimposed
Model-Based Bone Compartment Provides Highly Accurate PET/MR Attenuation
Correction of the Brain. J Nucl Med. 2016;57:918-924.
17. Bailey DL, Pichler BJ, Gückel B et al. Combined PET/MRI: Global Warming-
Summary Report of the 6th International Workshop on PET/MRI, March 27-29, 2017,
Tübingen, Germany. Mol Imaging Biol. 2018;20:4-20.
18. Ladefoged CN, Andersen FL, Kjær A, Højgaard L, Law I. RESOLUTE
PET/MRI Attenuation Correction for O-(2-18F-fluoroethyl)-L-tyrosine (FET) in Brain
Tumor Patients with Metal Implants. Frontiers in Neuroscience. 2017;11:453.
19. Andersen FL, Ladefoged CN, Beyer T et al. Combined PET/MR imaging in
neurology: MR-based attenuation correction implies a strong spatial bias when ignoring
bone. Neuroimage. 2014;84:206-216.
20. Ladefoged CN, Law I, Anazodo U et al. A multi-centre evaluation of eleven
clinically feasible brain PET/MRI attenuation correction techniques using a large
cohort of patients. Neuroimage. 2017;147:346-359.
30
21. Ladefoged CN, Hansen AE, Keller SH et al. Impact of incorrect tissue
classification in Dixon-based MR-AC: fat-water tissue inversion. EJNMMI Phys.
2014;1:101.
22. Ladefoged CN, Hansen AE, Keller SH et al. Dental artifacts in the head and
neck region: implications for Dixon-based attenuation correction in PET/MR.
EJNMMI Phys. 2015;2:8.
23. Brendle C, Schmidt H, Oergel A et al. Segmentation-based attenuation
correction in positron emission tomography/magnetic resonance: erroneous tissue
identification and its impact on positron emission tomography interpretation. Invest
Radiol. 2015;50:339-346.
24. Fuin N, Pedemonte S, Catalano OA et al. PET/MRI in the Presence of Metal
Implants: Completion of the Attenuation Map from PET Emission Data. J Nucl Med.
2017;58:840-845.
25. Ter Voert EEGW, Veit-Haibach P, Ahn S et al. Clinical evaluation of TOF
versus non-TOF on PET artifacts in simultaneous PET/MR: a dual centre experience.
Eur J Nucl Med Mol Imaging. 2017;44:1223-1233.
26. Munk OL, Tolbod LP, Hansen SB, Bogsrud TV. Point-spread function
reconstructed PET images of sub-centimeter lesions are not quantitative. EJNMMI
Phys. 2017;4:5.
27. Minoshima S, Koeppe RA, Mintun MA et al. Automated detection of the
intercommissural line for stereotactic localization of functional brain images. J Nucl
Med. 1993;34:322-329.
28. Unterrainer M, Vettermann F, Brendel M et al. Towards standardization of
(18)F-FET PET imaging: do we need a consistent method of background activity
assessment. EJNMMI Res. 2017;7:48.
29. Schwarzenberg J, Czernin J, Cloughesy TF et al. Treatment response evaluation
using 18F-FDOPA PET in patients with recurrent malignant glioma on bevacizumab
therapy. Clin Cancer Res. 2014;20:3550-3559.
30. Graham MM, Muzi M, Spence AM et al. The FDG lumped constant in normal
human brain. J Nucl Med. 2002;43:1157-1166.
31. Lucignani G, Schmidt KC, Moresco RM et al. Measurement of regional cerebral
glucose utilization with fluorine-18-FDG and PET in heterogeneous tissues: theoretical
considerations and practical procedure. J Nucl Med. 1993;34:360-369.
32. Pauleit D, Floeth F, Hamacher K et al. O-(2-[18F]fluoroethyl)-L-tyrosine PET
combined with MRI improves the diagnostic assessment of cerebral gliomas. Brain.
2005;128:678-687.
33. Kracht LW, Miletic H, Busch S et al. Delineation of brain tumor extent with
[11C]L-methionine positron emission tomography: local comparison with stereotactic
histopathology. Clin Cancer Res. 2004;10:7163-7170.
31
34. Louis DN, Perry A, Reifenberger G et al. The 2016 World Health Organization
Classification of Tumors of the Central Nervous System: a summary. Acta Neuropathol.
2016;131:803-820.
35. Suchorska B, Giese A, Biczok A et al. Identification of time-to-peak on
dynamic 18F-FET-PET as a prognostic marker specifically in IDH1/2 mutant diffuse
astrocytoma. Neuro Oncol. 2017
36. Jansen NL, Schwartz C, Graute V et al. Prediction of oligodendroglial histology
and LOH 1p/19q using dynamic [(18)F]FET-PET imaging in intracranial WHO grade
II and III gliomas. Neuro Oncol. 2012;14:1473-1480.
37. Verger A, Stoffels G, Bauer EK et al. Static and dynamic (18)F-FET PET for
the characterization of gliomas defined by IDH and 1p/19q status. Eur J Nucl Med Mol
Imaging. 2017
38. Lopci E, Riva M, Olivari L et al. Prognostic value of molecular and imaging
biomarkers in patients with supratentorial glioma. Eur J Nucl Med Mol Imaging.
2017;44:1155-1164.
39. Saito T, Maruyama T, Muragaki Y et al. 11C-Methionine Uptake Correlates
with Combined 1p and 19q Loss of Heterozygosity in Oligodendroglial Tumors. AJNR
Am J Neuroradiol. 2012
40. Niyazi M, Schnell O, Suchorska B et al. FET-PET assessed recurrence pattern
after radio-chemotherapy in newly diagnosed patients with glioblastoma is influenced
by MGMT methylation status. Radiother Oncol. 2012;104:78-82.
41. Okita Y, Nonaka M, Shofuda T et al. (11)C-methinine uptake correlates with
MGMT promoter methylation in nonenhancing gliomas. Clin Neurol Neurosurg.
2014;125:212-216.
42. Choi H, Bang JI, Cheon GJ et al. ¹⁸F-fluorodeoxyglucose and ¹¹C-methionine
positron emission tomography in relation to methyl-guanine methyltransferase
promoter methylation in high-grade gliomas. Nucl Med Commun. 2015;36:211-218.
43. Bette S, Gempt J, Delbridge C et al. Prognostic Value of O-(2-[18F]-
Fluoroethyl)-L-Tyrosine-Positron Emission Tomography Imaging for Histopathologic
Characteristics and Progression-Free Survival in Patients with Low-Grade Glioma.
World Neurosurg. 2016;89:230-239.
44. Filss CP, Albert NL, Böning G et al. O-(2-[(18)F]fluoroethyl)-L-tyrosine PET
in gliomas: influence of data processing in different centres. EJNMMI Res. 2017;7:64.
45. Colavolpe C, Chinot O, Metellus P et al. FDG-PET predicts survival in
recurrent high-grade gliomas treated with bevacizumab and irinotecan. Neuro Oncol.
2012;14:649-657.
46. De Witte O, Lefranc F, Levivier M, Salmon I, Brotchi J, Goldman S. FDG-PET
as a prognostic factor in high-grade astrocytoma. J Neurooncol. 2000;49:157-163.
32
47. Dunet V, Pomoni A, Hottinger A, Nicod-Lalonde M, Prior JO. Performance of
18F-FET versus 18F-FDG-PET for the diagnosis and grading of brain tumors:
systematic review and meta-analysis. Neuro Oncol. 2015
48. Mertens K, Acou M, Van Hauwe J et al. Validation of 18F-FDG PET at
conventional and delayed intervals for the discrimination of high-grade from low-grade
gliomas: a stereotactic PET and MRI study. Clin Nucl Med. 2013;38:495-500.
49. Dankbaar JW, Snijders TJ, Robe PA et al. The use of (18)F-FDG PET to
differentiate progressive disease from treatment induced necrosis in high grade glioma.
J Neurooncol. 2015;125:167-175.
50. Imani F, Boada FE, Lieberman FS, Davis DK, Mountz JM. Molecular and
metabolic pattern classification for detection of brain glioma progression. Eur J Radiol.
2014;83:e100-5.
51. Nihashi T, Dahabreh IJ, Terasawa T. Diagnostic Accuracy of PET for Recurrent
Glioma Diagnosis: A Meta-Analysis. AJNR Am J Neuroradiol. 2012
52. Nihashi T, Dahabreh IJ, Terasawa T. PET in the clinical management of glioma:
evidence map. AJR Am J Roentgenol. 2013;200:W654-60.
53. Santra A, Kumar R, Sharma P et al. F-18 FDG PET-CT in patients with
recurrent glioma: comparison with contrast enhanced MRI. Eur J Radiol. 2012;81:508-
513.
54. Chen W. Clinical applications of PET in brain tumors. J Nucl Med.
2007;48:1468-1481.
55. Wray R, Solnes L, Mena E, Meoded A, Subramaniam RM. 18)F-Flourodeoxy-
Glucose PET/Computed Tomography in Brain Tumors: Value to Patient Management
and Survival Outcomes. PET Clin. 2015;10:423-430.
56. Rapp M, Heinzel A, Galldiks N et al. Diagnostic Performance of 18F-FET PET
in Newly Diagnosed Cerebral Lesions Suggestive of Glioma. J Nucl Med.
2013;54:229-235.
57. Herholz K, Holzer T, Bauer B et al. 11C-methionine PET for differential
diagnosis of low-grade gliomas. Neurology. 1998;50:1316-1322.
58. Lohmann P, Herzog H, Rota Kops E et al. Dual-time-point O-(2-
[F]fluoroethyl)-L-tyrosine PET for grading of cerebral gliomas. Eur Radiol. 2015
59. Albert NL, Winkelmann I, Suchorska B et al. Early static F-FET-PET scans
have a higher accuracy for glioma grading than the standard 20-40 min scans. Eur J
Nucl Med Mol Imaging. 2015
60. Galldiks N, Ullrich R, Schroeter M, Fink GR, Kracht LW. Volumetry of
[(11)C]-methionine PET uptake and MRI contrast enhancement in patients with
recurrent glioblastoma multiforme. Eur J Nucl Med Mol Imaging. 2010;37:84-92.
33
61. Pafundi DH, Laack NN, Youland RS et al. Biopsy validation of 18F-DOPA
PET and biodistribution in gliomas for neurosurgical planning and radiotherapy target
delineation: results of a prospective pilot study. Neuro Oncol. 2013;15:1058-1067.
62. Galldiks N, Stoffels G, Filss C et al. The use of dynamic O-(2-18F-fluoroethyl)-
l-tyrosine PET in the diagnosis of patients with progressive and recurrent glioma. Neuro
Oncol. 2015;17:1293-1300.
63. Terakawa Y, Tsuyuguchi N, Iwai Y et al. Diagnostic accuracy of 11C-
methionine PET for differentiation of recurrent brain tumors from radiation necrosis
after radiotherapy. J Nucl Med. 2008;49:694-699.
64. Herrmann K, Czernin J, Cloughesy T et al. Comparison of visual and
semiquantitative analysis of 18F-FDOPA-PET/CT for recurrence detection in
glioblastoma patients. Neuro Oncol. 2014;16:603-609.
65. Galldiks N, Stoffels G, Ruge MI et al. Role of O-(2-18F-fluoroethyl)-L-tyrosine
PET as a diagnostic tool for detection of malignant progression in patients with low-
grade glioma. J Nucl Med. 2013;54:2046-2054.
66. Galldiks N, Dunkl V, Stoffels G et al. Diagnosis of pseudoprogression in
patients with glioblastoma using O-(2-[(18)F]fluoroethyl)-L-tyrosine PET. Eur J Nucl
Med Mol Imaging. 2015;42:685-695.
67. Kebir S, Fimmers R, Galldiks N et al. Late Pseudoprogression in glioblastoma:
diagnostic value of dynamic O-(2-[18F]fluoroethyl)-L-tyrosine PET. Clin Cancer Res.
2015
68. Galldiks N, Langen KJ, Holy R et al. Assessment of Treatment Response in
Patients with Glioblastoma Using O-(2-18F-Fluoroethyl)-L-Tyrosine PET in
Comparison to MRI. J Nucl Med. 2012;53:1048-1057.
69. Hutterer M, Nowosielski M, Putzer D et al. O-(2-18F-fluoroethyl)-L-tyrosine
PET predicts failure of antiangiogenic treatment in patients with recurrent high-grade
glioma. J Nucl Med. 2011;52:856-864.
70. Galldiks N, Rapp M, Stoffels G et al. Response assessment of bevacizumab in
patients with recurrent malignant glioma using [(18)F]Fluoroethyl-L-tyrosine PET in
comparison to MRI. Eur J Nucl Med Mol Imaging. 2013;40:22-33.
71. Galldiks N, Kracht LW, Burghaus L et al. Use of (11)C-methionine PET to
monitor the effects of temozolomide chemotherapy in malignant gliomas. Eur J Nucl
Med Mol Imaging. 2006;33:516-524.
72. Cook GJ, Maisey MN, Fogelman I. Normal variants, artefacts and interpretative
pitfalls in PET imaging with 18-fluoro-2-deoxyglucose and carbon-11 methionine. Eur
J Nucl Med. 1999;26:1363-1378.
73. Dethy S, Manto M, Kentos A et al. PET findings in a brain abscess associated
with a silent atrial septal defect. Clin Neurol Neurosurg. 1995;97:349-353.
34
74. Floeth FW, Pauleit D, Sabel M et al. 18F-FET PET differentiation of ring-
enhancing brain lesions. J Nucl Med. 2006;47:776-782.
75. Pichler R, Dunzinger A, Wurm G et al. Is there a place for FET PET in the
initial evaluation of brain lesions with unknown significance? Eur J Nucl Med Mol
Imaging. 2010;37:1521-1528.
76. Tsuyuguchi N, Sunada I, Ohata K et al. Evaluation of treatment effects in brain
abscess with positron emission tomography: comparison of fluorine-18-
fluorodeoxyglucose and carbon-11-methionine. Ann Nucl Med. 2003;17:47-51.
77. Ogawa T, Hatazawa J, Inugami A et al. Carbon-11-methionine PET evaluation
of intracerebral hematoma: distinguishing neoplastic from non-neoplastic hematoma. J
Nucl Med. 1995;36:2175-2179.
78. Dethy S, Goldman S, Blecic S, Luxen A, Levivier M, Hildebrand J. Carbon-11-
methionine and fluorine-18-FDG PET study in brain hematoma. J Nucl Med.
1994;35:1162-1166.
79. Salber D, Stoffels G, Oros-Peusquens AM et al. Comparison of O-(2-18F-
fluoroethyl)-L-tyrosine and L-3H-methionine uptake in cerebral hematomas. J Nucl
Med. 2010;51:790-797.
80. Zazulia AR, Videen TO, Powers WJ. Transient focal increase in perihematomal
glucose metabolism after acute human intracerebral hemorrhage. Stroke.
2009;40:1638-1643.
81. Jacobs A. Amino acid uptake in ischemically compromised brain tissue. Stroke.
1995;26:1859-1866.
82. Salber D, Stoffels G, Pauleit D et al. Differential uptake of [18F]FET and [3H]l-
methionine in focal cortical ischemia. Nucl Med Biol. 2006;33:1029-1035.
83. Law I, Borgwardt L, Højgaard L. Pediatric hybrid imaging of the brain. In:
von Schulthess GK, editor. Clinical molecular anatomic imaging - PET/CT, PET/MR and SPECT/CT. Zürich: Wolters Kluwer Health; 2015. p. 218-229.
84. Morana G, Piccardo A, Garrè ML, Cabria M, Rossi A. 18F-DOPA Uptake of
Developmental Venous Anomalies in Children With Brain Tumors. Clin Nucl Med.
2016;41:e351-2.
85. Schiepers C, Van Hecke P, Vandenberghe R et al. Positron emission
tomography, magnetic resonance imaging and proton NMR spectroscopy of white
matter in multiple sclerosis. Mult Scler. 1997;3:8-17.
86. Singhal T, Narayanan TK, Jain V, Mukherjee J, Mantil J. 11C-L-methionine
positron emission tomography in the clinical management of cerebral gliomas. Mol
Imaging Biol. 2008;10:1-18.
87. Jansen NL, Suchorska B, Schwarz SB et al. [18F]fluoroethyltyrosine-positron
emission tomography-based therapy monitoring after stereotactic iodine-125
35
brachytherapy in patients with recurrent high-grade glioma. Mol Imaging.
2013;12:137-147.
88. Hutterer M, Ebner Y, Riemenschneider MJ et al. Epileptic activity increases
cerebral amino acid transport assessed by [18F]-fluoroethyl-L-tyrosine amino acid PET
- a potential brain tumor mimic. J Nucl Med. 2016
89. Lopci E, Bello L, Chiti A. (11)C-Methionine uptake in secondary brain epilepsy.
Rev Esp Med Nucl Imagen Mol. 2014;33:234-236.
90. Novak L, Molnar P, Lengyel Z, Tron L. Does increased 18FDG uptake reflect
malignant transformation of a low-grade glioma? A diagnostic dilemma. Neurol India.
2005;53:112-114.
91. Boellaard R, O’Doherty MJ, Weber WA et al. FDG PET and PET/CT: EANM
procedure guidelines for tumour PET imaging: version 1.0. Eur J Nucl Med Mol
Imaging. 2010;37:181-200.
92. EANM PC, Busemann Sokole E, Płachcínska A et al. Routine quality control
recommendations for nuclear medicine instrumentation. Eur J Nucl Med Mol Imaging.
2010;37:662-671.
93. Sattler B, Jochimsen T, Barthel H et al. Physical and organizational provision
for installation, regulatory requirements and implementation of a simultaneous hybrid
PET/MR-imaging system in an integrated research and clinical setting. MAGMA.
2013;26:159-171.
94. Zanotti-Fregonara P, Lammertsma AA, Innis RB. Suggested pathway to assess
radiation safety of (1)(8)F-labeled PET tracers for first-in-human studies. Eur J Nucl
Med Mol Imaging. 2013;40:1781-1783.
95. Mattsson S, Johansson L, Leide Svegborn S et al. Radiation Dose to Patients
from Radiopharmaceuticals: a Compendium of Current Information Related to
Frequently Used Substances. Ann ICRP. 2015;44:7-321.
96. Langen KJ, Bartenstein P, Boecker H et al. [German guidelines for brain tumour
imaging by PET and SPECT using labelled amino acids]. Nuklearmedizin.
2011;50:167-173.
XIV. Approval
This practice guideline was approved by the Board of Directors of the EANM, SNMMI, EANO and PET RANO.

36