Embed Size (px)
Citation preview

CORPORATE STRATEGY 2014 & FINANCIAL
PERFORMANCE AS AT DEC 2013 By: Hizamuddin Jamalluddin Head, Strategic Management & Managing Director’s Office
Strictly Private & Confidential

TABLE OF CONTENTS
Managing Director’s Office Page 2
Corporate Profiles
Business Operations
Financial Highlights
Corporate Strategic Plan
Sec 1
Sec 2
Sec 3
Sec 4
Managing Director’s Office Page 3

BANK ISLAM AT GLANCE
Managing Director’s Office Page 4
Malaysia’s 1st
Islamic bank Incorporated on 1 March
1983
134 branches nationwide with more than
1,200 self-service
terminals
Universal
licence able to offer commercial
and investment banking
activities all under one roof
>4,000 staff Top 50 Malaysia’s Most
Preferred Employers
Primarily a
retail bank with more than 70%
financing driven by
Consumer banking
Voted
Islamic Bank
of the Year by
The Banker in 2013

CORPORATE VISION
Managing Director’s Office Page 5
Value-Based Organization
TO BE A GLOBAL LEADER IN ISLAMIC BANKING
“Global Leader” is defined as being the ultimate
guidance and source of reference for innovative
Shariah-based products and services

MISSION STATEMENT
Managing Director’s Office Page 6
To continually develop and innovate universally
accepted financial solutions in line with Shariah principles
To provide a reasonable and sustainable return to shareholders
To provide a conducive working environment and to become an Employer of Choice for top talents in the market
To deliver comprehensive financial solutions of
global standards using state-of-the-art technology
To be a responsible and prudent corporate citizen
In carrying out this corporate mission, Bank Islam shall
be guided by its corporate brand values by being: A Leader, Dynamic, Professional, Caring and Trustworthy

CORPORATE VALUES
Managing Director’s Office Page 7
•Our Islamic products are the benchmark. Reputed as the pioneer in Islamic banking. Built the Islamic banking industry in Malaysia
Leader
•Progressive and innovative - constantly moving ahead, technologically advanced, with new products & services
Dynamic
•Fast, efficient and responsive service. Knowledgeable and equipped staff to handle global business challenges
Professional
•A supportive partner who is approachable, ever ready to provide solutions to your financial problems
Caring
•100% Shariah-based products, services and principles
Trustworthy

54.4% 9.98% 5.11% 5.05%
CORPORATE STRUCTURE @ MARCH 2014
Managing Director’s Office Page 8
100%
14.4%

GOVERNANCE STRUCTURE
Managing Director’s Office Page 9

BOARD OF DIRECTORS
Managing Director’s Office Page 10

SHARIAH SUPERVISORY COUNCIL ("SSC")
Managing Director’s Office Page 11
• Dr. Ahmad Shahbari
@ Sobri Salamon
Chairman • Datuk Mohd Bakir Mansor
• Assistant Professor Dr. Uzaimah Ibrahim
• Professor Dr. Ahmad Hidayat Buang
• Dr. Muhammad Syafii Antonio
• Mohd Nazri Chik
Secretary to SSC

SHARIAH GOVERNANCE FRAMEWORK
Managing Director’s Office Page 12
SHARIAH AS OVERARCHING PRINCIPLE IN BANK ISLAM
SHARIAH
SUPERVISORY COUNCIL (SSC) • Oversight accountability on Shariah related
matters.
BOARD OF
DIRECTORS (Overall oversight on Shariah governance structure & Shariah
compliance)
BOARD RISK COMMITTEE
AUDIT &
EXAMINATION COMMITTEE (AEC)
MANAGEMENT • Ensure execution of business & operations are in accordance with Shariah principles. • Provide necessary resources, infrastructure, enablers to the SSC.
Shariah Risk Management Control Function: Identify, measure, monitor, report & control Shariah non-compliance risk
Shariah Review Function: Review business operation on regular basis to ensure Shariah compliance.
Shariah Research Function: (under Product Development) Conduct in-depth Shariah research prior to submission to Shariah Committee.
Shariah Audit Function: Provide independent assessment & objective assurance designed to value add & improve Bank Islam adherence to Shariah
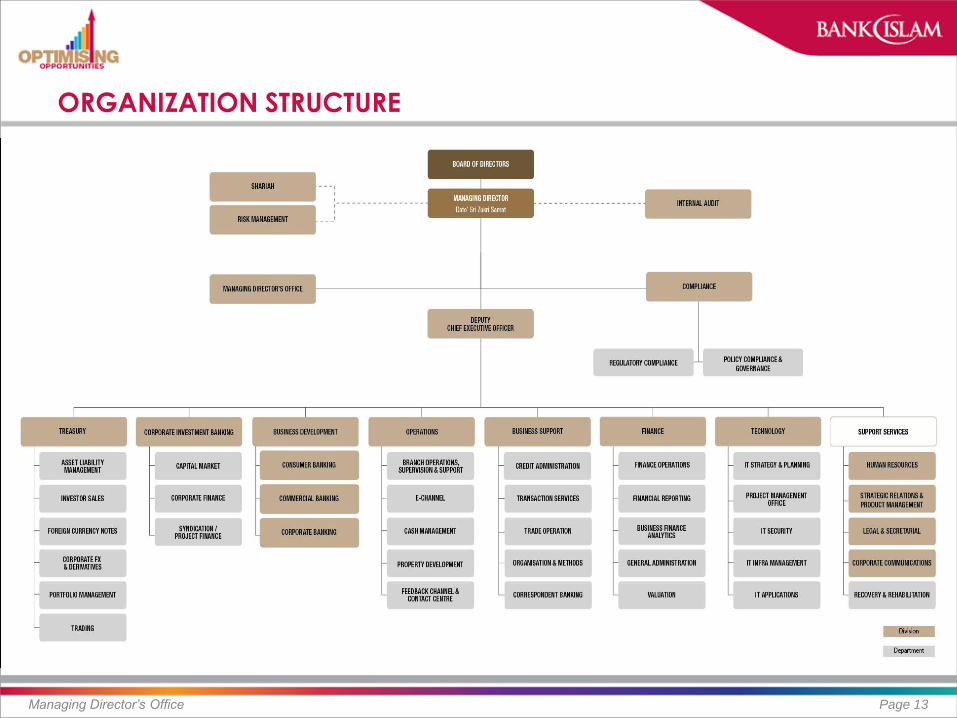
ORGANIZATION STRUCTURE
Managing Director’s Office Page 13

SENIOR MANAGEMENT
Managing Director’s Office Page 14

SENIOR MANAGEMENT
Managing Director’s Office Page 15
• Dato’ Sri Zukri Samat
Managing Director
• Hizamuddin Jamalluddin
General Manager /Head
Strategic Management &
Managing Director’s Office
• Maria Mat Said
General Manager/Head
Legal & Secretarial
cum Company Secretary
• Nik Azmir Nik Anis
Assistant General Manager/Head
Compliance
• Mohd Nazri Chik
General Manager/Head
Shariah
• Jeroen P.M.M. Thijs
Chief Risk Officer
• Mohamed Iran Moriff Mohd Shariff
Chief Internal Audit

SENIOR MANAGEMENT - BUSINESS
Managing Director’s Office Page 16
• Khairul Kamarudin
Director
Business Development
• Abdul Rashid Abdul Hamid
General Manager/Head
Commercial Banking
• Mujibburrahman Abd Rashid
General Manager/Head
Consumer Banking
• Norashikin Mohd Kassim
Director
Treasury
• Mashitah Osman
Director
Corporate Investment Banking
• Zaharin Mohd Ali
Assistant General Manager /Acting Head
Corporate Banking

SENIOR MANAGEMENT – OPERATION & SERVICES
Managing Director’s Office Page 17
• Wahid Ali Mohd Khalil
Chief Operating Officer
Business Support
• Dato’ Norasni Ayob
Chief Operating Officer
Operation
• Ryan Liew Choon Ching
Chief Technology Officer
• Malkit Singh Maan
Chief Financial Officer
• Jamilah Abdul Sallam
General Manager/Head
Human Resource
• Azmir Abdul Malik
Assistant General Manager/Head
Corporate Communication
• Dato’ Wan Ismail Wan Yusoh
General Manager/Head
Strategic Relations &
Product Management
• Mizan Masram
Assistant General Manager/Head
Recovery & Rehabilitation
Managing Director’s Office Page 18
BUSINESS
OPERATIONS

BUSINESS ACTIVITIES
Managing Director’s Office Page 19
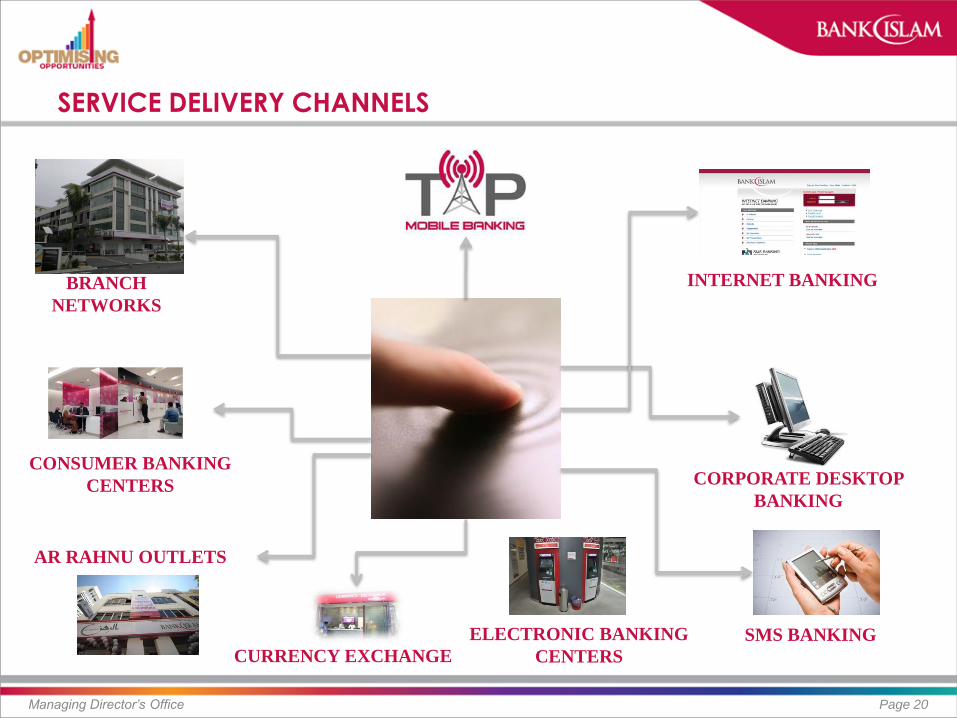
SERVICE DELIVERY CHANNELS
Managing Director’s Office Page 20
BRANCH
NETWORKS
INTERNET BANKING
CONSUMER BANKING
CENTERS
AR RAHNU OUTLETS
CURRENCY EXCHANGE
SMS BANKING
CORPORATE DESKTOP
BANKING
ELECTRONIC BANKING
CENTERS

BRANCH NETWORKS
Managing Director’s Office Page 21
Perlis - 1
Kedah - 11
Kelantan - 13
Pulau Pinang - 5
Perak - 9
Pahang - 9
Terengganu - 5
Selangor – 26 Kuala Lumpur - 18
Negeri
Sembilan -6
Melaka - 4 Johor - 15
Sarawak - 6
Sabah - 5 Labuan- 1
Region Total
Central 44
Northern 26
Eastern 27
Southern 25
East Malaysia 12
Total @ 31 Dec 2013 134

SELF SERVICE TERMINALS
Managing Director’s Office Page 22
ATM – 8 CDM – 4
CQM – 1 SP - 1
ATM – 36 CDM – 14
CQM – 7 SP -1
ATM – 30 CDM – 16
CQM – 7 SP -3
ATM – 2 CDM – 1
CQM – 1 SP - 1
ATM – 58 CDM – 27
CQM – 14 SP -4
ATM – 56 CDM –31
CQM – 11 SP - 4
ATM – 32 CDM – 13
CQM – 3 SP - 1
ATM – 39 CDM – 22
CQM – 7 SP - 2
ATM – 55 CDM – 20
CQM – 12 SP - 7
COIN - 1
ATM -158 CDM – 57
CQM – 28 SP - 10
ATM – 31 CDM – 14
CQM – 6 SP -2
ATM – 78 CDM - 36
CQM – 14 SP – 7
ATM – 33 CDM – 16
CQM – 6 SP - 4
ATM – Automated Teller Machine CDM – Cash Deposit Machine CQM – Cheque Deposit Machine SP – Statement Printer COIN – Coin Deposit Machine
ATM – 39 CDM – 17
CQM – 5 SP - 0
COIN - 1
ATM – 67 CDM – 36
CQM – 11 SP - 4
COIN - 1
Location type ATM CDM CQM SP Coin Total
Branches 291 211 116 43 3 664
IPTA/IPTS 119 19 4 4 0 146
Shopping Centres 92 9 1 2 0 104
Corporate Offices 67 23 7 1 0 98
TH Branches 40 29 0 0 0 69
Petrol Stations 34 2 0 0 0 36
Hospitals 21 0 1 0 0 22
Mosques 15 10 0 0 0 25
Others 43 21 4 1 0 69
Total 722 324 133 51 3 1,233
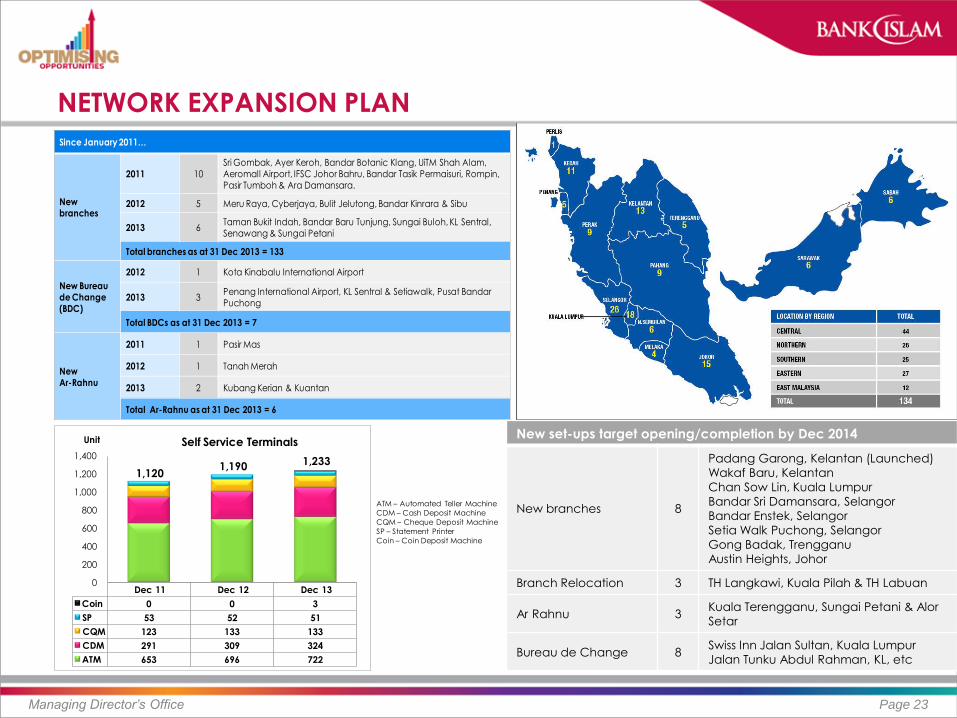
NETWORK EXPANSION PLAN
Managing Director’s Office Page 23
Dec 11 Dec 12 Dec 13
Coin 0 0 3
SP 53 52 51
CQM 123 133 133
CDM 291 309 324
ATM 653 696 722
0
200
400
600
800
1,000
1,200
1,400
Unit Self Service Terminals
1,1201,190 1,233
ATM – Automated Teller Machine
CDM – Cash Deposit Machine
CQM – Cheque Deposit Machine
SP – Statement Printer
Coin – Coin Deposit Machine
Since January 2011…
New branches
2011 10
Sri Gombak, Ayer Keroh, Bandar Botanic Klang, UiTM Shah Alam, Aeromall Airport, IFSC Johor Bahru, Bandar Tasik Permaisuri, Rompin, Pasir Tumboh & Ara Damansara.
2012 5 Meru Raya, Cyberjaya, Bulit Jelutong, Bandar Kinrara & Sibu
2013 6Taman Bukit Indah, Bandar Baru Tunjung, Sungai Buloh, KL Sentral, Senawang & Sungai Petani
Total branches as at 31 Dec 2013 = 133
New Bureaude Change (BDC)
2012 1 Kota Kinabalu International Airport
2013 3Penang International Airport, KL Sentral & Setiawalk, Pusat Bandar Puchong
Total BDCs as at 31 Dec 2013 = 7
New Ar-Rahnu
2011 1 Pasir Mas
2012 1 Tanah Merah
2013 2 Kubang Kerian & Kuantan
Total Ar-Rahnu as at 31 Dec 2013 = 6
New set-ups target opening/completion by Dec 2014
New branches 8
Padang Garong, Kelantan (Launched)
Wakaf Baru, Kelantan
Chan Sow Lin, Kuala Lumpur
Bandar Sri Damansara, Selangor
Bandar Enstek, Selangor
Setia Walk Puchong, Selangor
Gong Badak, Trengganu
Austin Heights, Johor
Branch Relocation 3 TH Langkawi, Kuala Pilah & TH Labuan
Ar Rahnu 3 Kuala Terengganu, Sungai Petani & Alor
Setar
Bureau de Change 8 Swiss Inn Jalan Sultan, Kuala Lumpur
Jalan Tunku Abdul Rahman, KL, etc

CONSUMER BANKING
Managing Director’s Office Page 24

AR RAHNU OUTLETS
Managing Director’s Office Page 25
Kota Bharu Outlet
Pasir Puteh Outlet
Pasir Mas Outlet
Tanah Merah Outlet
…6 Ar Rahnu Outlets
…another outlet in Kuala
Trengganu by end of Dec 2013
No. Location State Day 1
1 Kota Bahru KLN 10 Jun 2010
2 Pasir Puteh KLN 15 Jul 2010
3 Pasir Mas KLN 29 Jul 2011
4 Tanah Merah KLN 28 Jun 2012
5 Kubang Kerian KLN 11 Jul 2013
6 Kuantan PHG 24 Aug 2013
Kubang Kerian Outlet

CORPORATE INVESTMENT BANKING
Managing Director’s Office Page 26
RM5.311 billion
Islamic Securities
Programme
Turus Pesawat Sdn Bhd
Joint Lead Manager
RM8.0 billion
Government Guaranteed
Islamic CPs/MTNs
Programme
DANAINFRA
N A S I O N A L
DanaInfra Nasional Berhad
Joint Lead Manager
Runner
RM10.0 billion
Islamic Medium Term
Notes Programme
Aman Sukuk Berhad
Joint Lead Manager &
Shariah Adviser
RM5.0 billion**
Islamic Securities
Programme
Manjung Island Energy
Berhad
Joint Principal Advisers,
Joint Lead Arrangers, Joint
Lead Managers & Joint Shariah Advisers
RM1.66 billion
Sukuk Murabahah
BIMB Holdings Berhad
Lead Aranger
RM500.0 million
Bank Guaranteed
Sukuk Ijarah
Aras Sejagat Sdn Bhd
Joint Lead Arranger &
Joint Lead Manager
RM4.0 billion
Sukuk Musyarakah
Plus SPV Berhad
Joint Book Runner
RM1.5 billion
Islamic Medium Term
Notes Programme
Malaysia Debt Ventures
Berhad
Joint Lead Manager

CORPORATE INVESTMENT BANKING…CONT
Managing Director’s Office Page 27
RM1.0 billion
Istisna’
Projek Usahasama
Transit Aliran Ringan
Joint Arranger & Shariah
Adviser
RM2.2 billion
BaIDS
KL International Airport
Berhad
Sole Lead Arranger
RM1.5 billion
Al-Ijarah Muntahiyah
Bit-Tamlik
Kumpulan Guthrie Berhad
Structuring & Shariah
Adviser
USD150.0 million
Sukuk Al Ijarah
First Global Sukuk Inc
Sole Lead Arranger
USD600.0 million
Sukuk Al Ijarah
Malaysia Global Sukuk Inc
Co-Arranger
RM1.28 billion
BaIDS
SAJ Holdings Sdn Bhd
Joint Lead Arranger/Lead Manager & Shariah
Adviser
RM752.2 million
Mudharabah Sukuk
Manfaat Tetap Sdn Bhd
Shariah Adviser
RM200.0 million BBA CPs
RM3.0 billion BBA MTNs
Syarikat Bekalan Air
Selangor Sdn Bhd
Joint Lead Arranger & Shariah Adviser
RM4.0 billion
Ijarah Medium Term Notes
Programme
Syarikat Prasarana
Negara Berhad
Co-Manager
RM200.0 million
Bai’ Murabahah Medium
Term Notes Programme
TH Plantations Berhad
Joint Lead Arranger &
Shariah Adviser

CORPORATE FINANCE
Managing Director’s Office Page 28
Listing of APFT Berhad
on the Main Market of
Bursa Malaysia
Securities Berhad
Main Adviser
APFT Berhad
Listing of Focus Lumber
Berhad on the Main
Market of Bursa Malaysia
Securities Berhad
Main Adviser
Focus Lumber Berhad
Listing of PESTECH
International Berhad
on the Main Market of
Bursa Malaysia
Securities Berhad
Main Adviser
Exemption from the
obligation to undertake
Mandatory Take-over Offer
arising from the acquisition of
Syarikat Sabaco Sdn Bhd
from TH Ladang (Sabah &
Sarawak) Sdn Bhd
Main Adviser
Lembaga Tabung Haji
Akarmas Sdn Bhd
Conditional Mandatory
Take-over Offer by Akarmas
Sdn Bhd to acquire all the
remaining ordinary shares
of RM1.00 each in PK
Resources Berhad for a
cash consideration of
RM0.60 per share
Main Adviser
Acquisitions by BIMB
Holdings Berhad of the
remaining 49% equity
interest in Bank Islam
Malaysia Berhad for a total
purchase consideration of
USD884.6 million
Main Adviser
TH Plantations Berhad
•Acquisitions of Syarikat
Sabaco Sdn Bhd and Ladang
Bukit Belian Sdn Bhd from TH
Ladang (Sabah & Sarawak)
Sdn Bhd for a total purchase
consideration of RM199 million
•Bonus Issue
•Employees’ Share Option
Scheme
Main Adviser
Renounceable rights Issue of
426,715,958 new ordinary
shares of RM1.00 each in BIMB
Holdings Berhad together with
426,715,958 free detachable
warrants to raise gross
proceeds of
RM1.814 billion
Main Adviser *
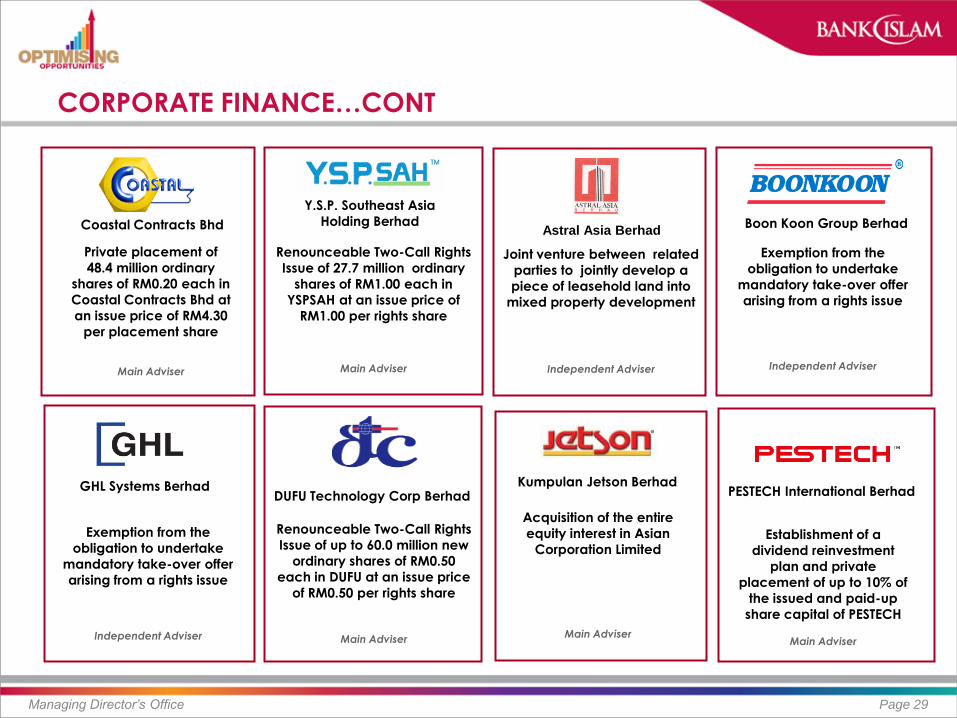
CORPORATE FINANCE…CONT
Managing Director’s Office Page 29
Boon Koon Group Berhad
Exemption from the
obligation to undertake
mandatory take-over offer
arising from a rights issue
Independent Adviser
GHL Systems Berhad
Exemption from the
obligation to undertake
mandatory take-over offer
arising from a rights issue
Independent Adviser
Astral Asia Berhad
Joint venture between related
parties to jointly develop a
piece of leasehold land into
mixed property development
Independent Adviser
Y.S.P. Southeast Asia
Holding Berhad
Renounceable Two-Call Rights
Issue of 27.7 million ordinary
shares of RM1.00 each in
YSPSAH at an issue price of
RM1.00 per rights share
Main Adviser
Acquisition of the entire
equity interest in Asian
Corporation Limited
Main Adviser
Kumpulan Jetson Berhad PESTECH International Berhad
Establishment of a
dividend reinvestment
plan and private
placement of up to 10% of
the issued and paid-up
share capital of PESTECH
Main Adviser
Coastal Contracts Bhd
Private placement of
48.4 million ordinary
shares of RM0.20 each in
Coastal Contracts Bhd at
an issue price of RM4.30
per placement share
Main Adviser
DUFU Technology Corp Berhad
Renounceable Two-Call Rights
Issue of up to 60.0 million new
ordinary shares of RM0.50
each in DUFU at an issue price
of RM0.50 per rights share
Main Adviser

BUREAU DE CHANGE
Managing Director’s Office Page 30
Kota Kinabalu International Airport
Contact Pier,
Kuala Lumpur International Airport
KLIA - LCCT
Penang International Airport*
Bukit Bintang
BDC
No. Location State Day 1
1 LCCT, Sepang SGR 15 Dec 2008
2 Contact Pier International, KLIA SGR 01 Oct 2010
3 Bukit Bintang KL 03 Dec 2010
4 Kota Kinabalu International Airport SBH 26 Jul 2012
5 Penang International Airport PNG 1 Feb 2013
6 KL Sentral KL 13 Sep 2013
7 Setiawalk, Puchong SGR 21 Nov 2013
8 Swiss Inn, Kuala Lumpur KL 22 April 2014
KL Sentral

BEST ISLAMIC BANK
Managing Director’s Office Page 31

Managing Director’s Office Page 32
CORPORATE
STRATEGIC PLAN

STRATEGIC MANAGEMENT PYRAMID
Managing Director’s Office Page 33
Vision, Mission & Corporate Values
3-year Corporate Plan
Annual Corporate/Business Plan - Resource Allocation
Divisional/Tactical Plan
Key Performance Indicators Framework
Accountability & Reporting Regime
…Strategic management process - The full set of commitments, decisions, and actions required for a firm to
create value and earn above-average returns

STRATEGY DOCUMENTATION
Page 34
Divisional Business Plan & Roadmap
Tactical Plan Divisional KPIs
Framework Product Plan
Divisional Policy, Manuals & SOP
Annual Business Plan & Budget
Corporate Plan Risk Appetite
Statement Budget & Financial
Projections Corporate KPIs
Corporate Master Plan
Managing Director’s Office
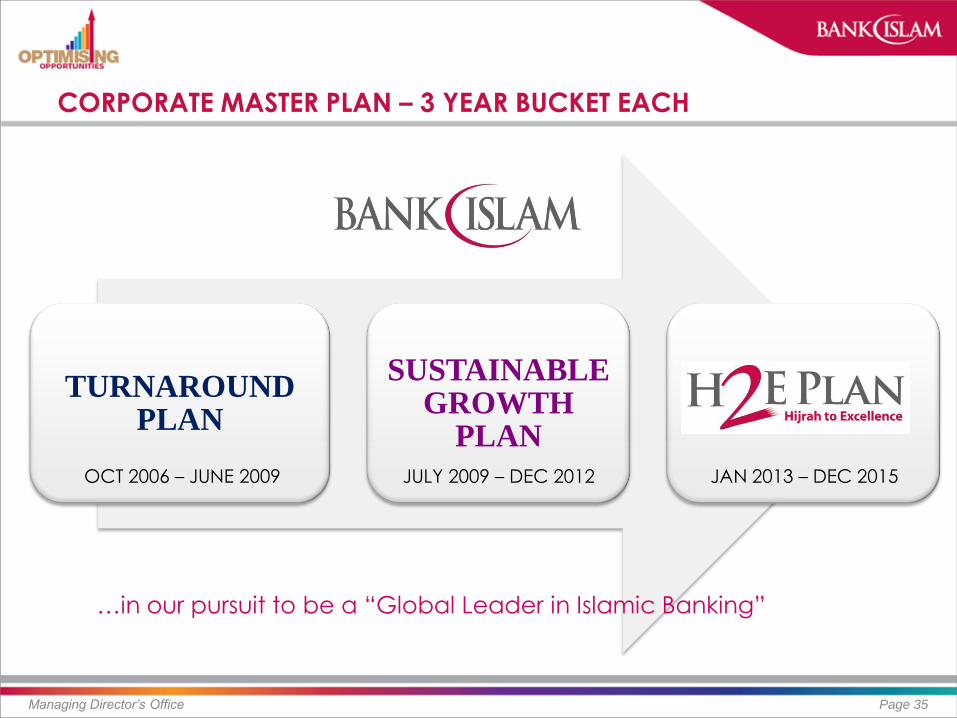
CORPORATE MASTER PLAN – 3 YEAR BUCKET EACH
Page 35
TURNAROUND PLAN
SUSTAINABLE GROWTH
PLAN
OCT 2006 – JUNE 2009 JULY 2009 – DEC 2012
…in our pursuit to be a “Global Leader in Islamic Banking”
JAN 2013 – DEC 2015
Managing Director’s Office

TURNAROUND PLAN (OCT 2006- JUNE 2009)
Page 36
Recapitalization & Balance Sheet Restructuring
Transformation Programme
IT Infrastructure
Revamp
Cost Rationalization
Human Capital Development
Managing Director’s Office

BRAND POSITIONING
Managing Director’s Office Page 37
“Banking for Muslims”
“Banking for All”
… growing recognition that the inherent tenets of Islamic finance are aligned to sustainable dimensions of ethical banking and responsible financing.
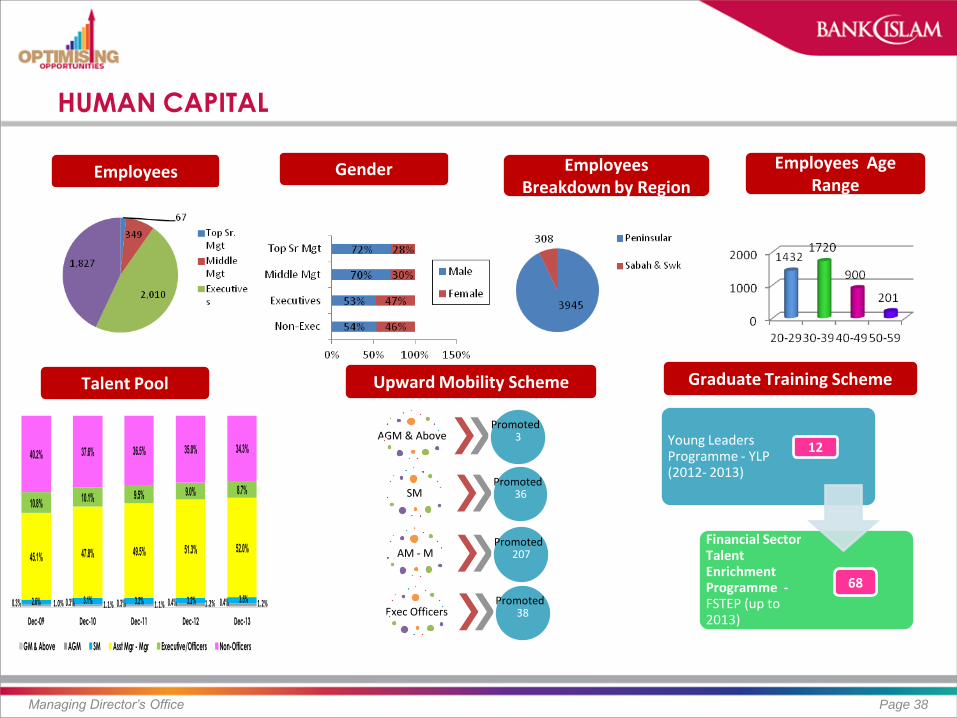
HUMAN CAPITAL
Managing Director’s Office Page 38
Employees Employees Breakdown by Region
Employees Age Range
Gender
Total Spent:
RM1.5 bil Total Spent:
RM1.5 bil
Graduate Training Scheme Talent Pool
0.3% 0.3% 0.3% 0.4% 0.4%1.0% 1.1% 1.1% 1.2% 1.2%2.6% 3.1% 3.2% 3.2% 3.5%
45.1% 47.8% 49.5% 51.3% 52.0%
10.8%10.1% 9.5% 9.0% 8.7%
40.2% 37.6% 36.5% 35.0% 34.3%
Dec-09 Dec-10 Dec-11 Dec-12 Dec-13
GM & Above AGM SM Asst Mgr - Mgr Executive/Officers Non-Officers
Upward Mobility Scheme
AGM & Above 3 Promoted
SM 36 Promoted
AM - M 207 Promoted
Exec Officers 38 Promoted
Young Leaders Programme - YLP (2012- 2013)
Financial Sector Talent Enrichment Programme - FSTEP (up to 2013)
12
68
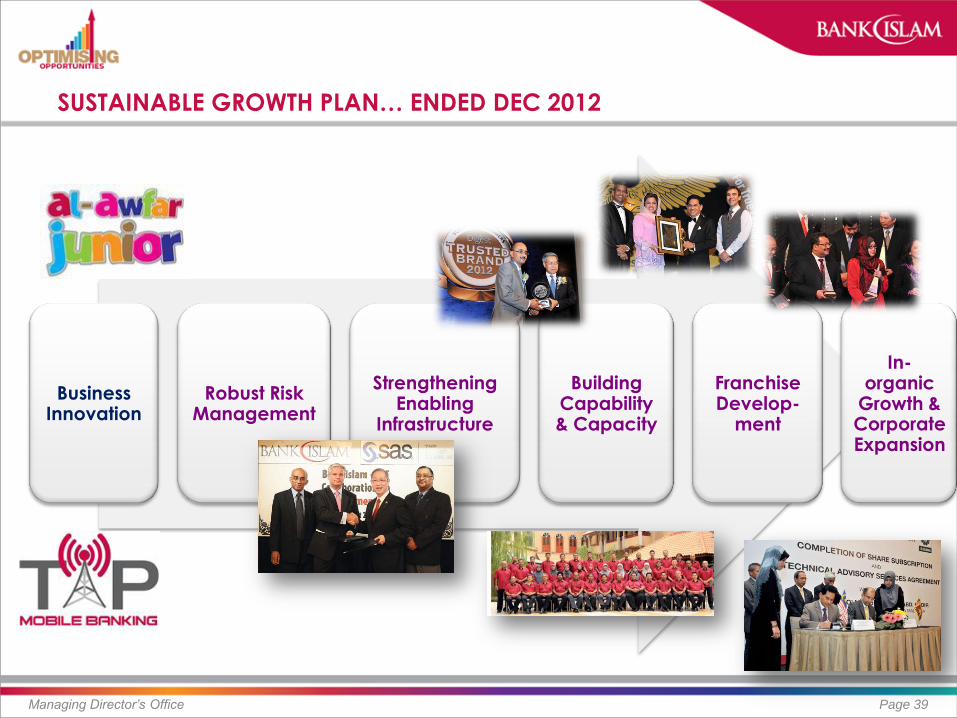
Business Innovation
Robust Risk Management
Strengthening Enabling
Infrastructure
Building Capability & Capacity
Franchise Develop-
ment
In-organic
Growth & Corporate Expansion
SUSTAINABLE GROWTH PLAN… ENDED DEC 2012
Page 39 Managing Director’s Office
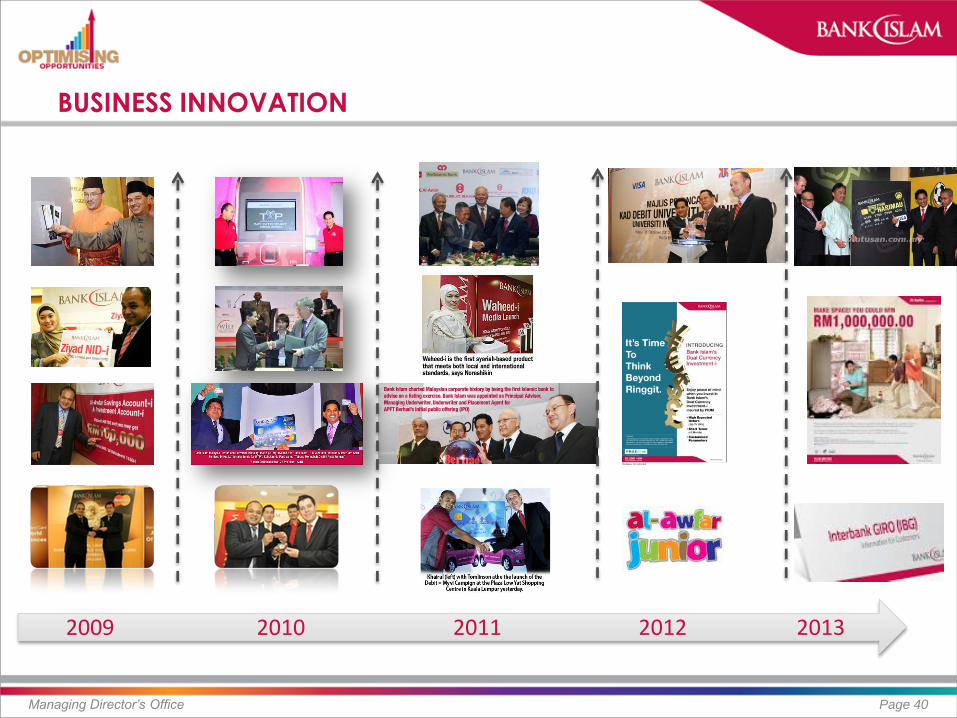
BUSINESS INNOVATION
Managing Director’s Office Page 40
2009 2010 2011 2012 2013
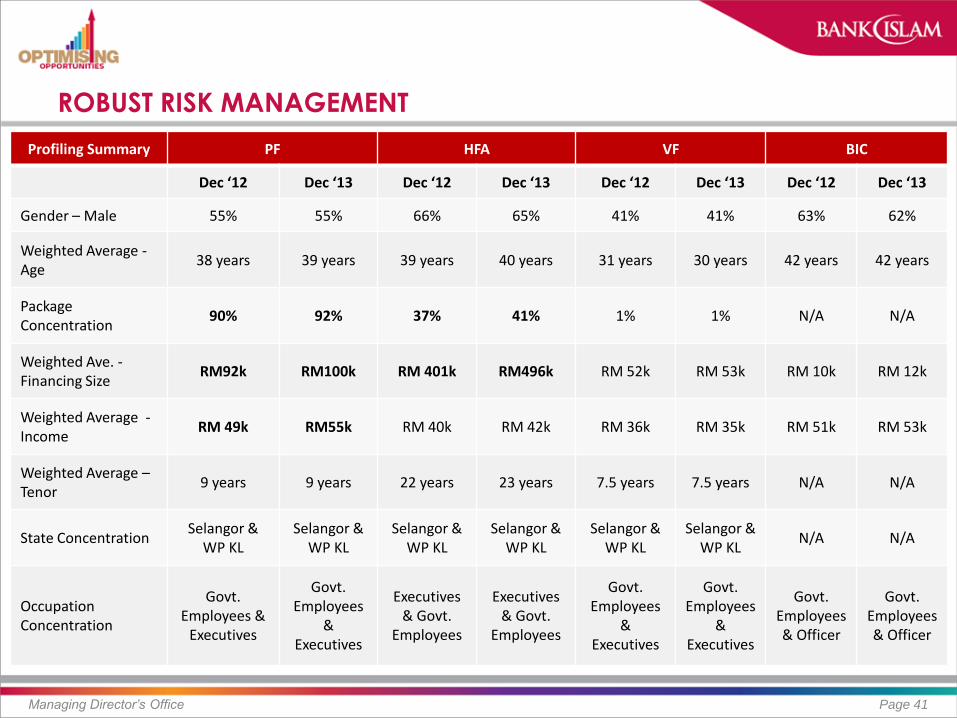
ROBUST RISK MANAGEMENT
Managing Director’s Office Page 41
Profiling Summary PF HFA VF BIC
Dec ‘12 Dec ‘13 Dec ‘12 Dec ‘13 Dec ‘12 Dec ‘13 Dec ‘12 Dec ‘13
Gender – Male 55% 55% 66% 65% 41% 41% 63% 62%
Weighted Average - Age
38 years 39 years 39 years 40 years 31 years 30 years 42 years 42 years
Package Concentration
90% 92% 37% 41% 1% 1% N/A N/A
Weighted Ave. - Financing Size
RM92k RM100k RM 401k RM496k RM 52k RM 53k RM 10k RM 12k
Weighted Average - Income
RM 49k RM55k RM 40k RM 42k RM 36k RM 35k RM 51k RM 53k
Weighted Average – Tenor
9 years 9 years 22 years 23 years 7.5 years 7.5 years N/A N/A
State Concentration Selangor &
WP KL Selangor &
WP KL Selangor &
WP KL Selangor &
WP KL Selangor &
WP KL Selangor &
WP KL N/A N/A
Occupation Concentration
Govt. Employees &
Executives
Govt. Employees
& Executives
Executives & Govt.
Employees
Executives & Govt.
Employees
Govt. Employees
& Executives
Govt. Employees
& Executives
Govt. Employees & Officer
Govt. Employees & Officer
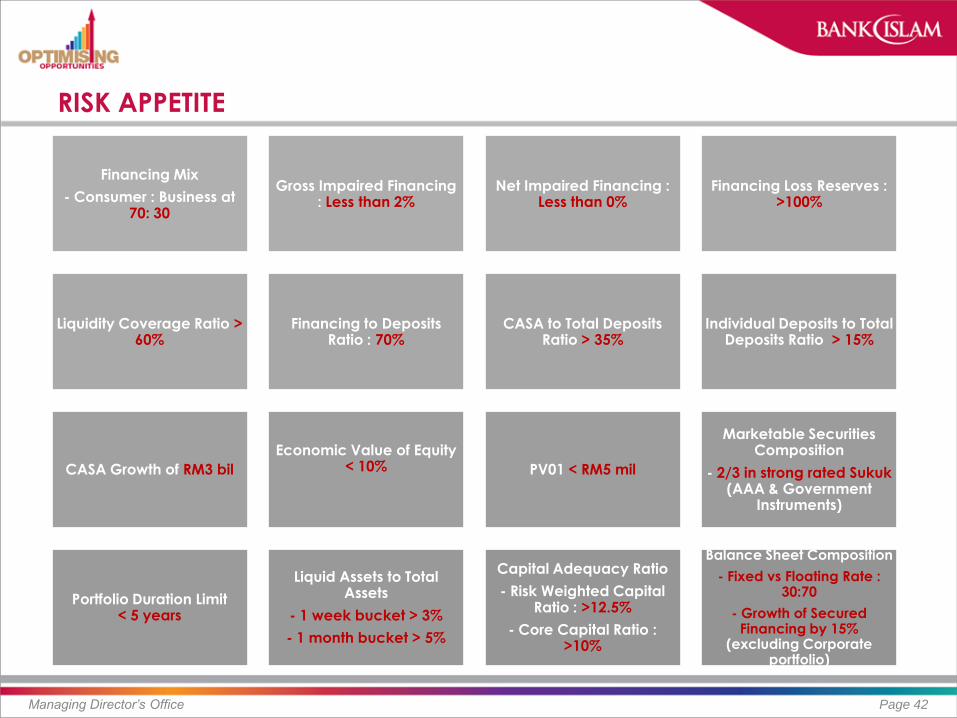
RISK APPETITE
Managing Director’s Office Page 42
Financing Mix
- Consumer : Business at 70: 30
Gross Impaired Financing : Less than 2%
Net Impaired Financing : Less than 0%
Financing Loss Reserves : >100%
Liquidity Coverage Ratio > 60%
Financing to Deposits Ratio : 70%
CASA to Total Deposits Ratio > 35%
Individual Deposits to Total Deposits Ratio > 15%
CASA Growth of RM3 bil
Economic Value of Equity < 10%
PV01 < RM5 mil
Marketable Securities Composition
- 2/3 in strong rated Sukuk (AAA & Government
Instruments)
Portfolio Duration Limit < 5 years
Liquid Assets to Total Assets
- 1 week bucket > 3%
- 1 month bucket > 5%
Capital Adequacy Ratio
- Risk Weighted Capital Ratio : >12.5%
- Core Capital Ratio : >10%
Balance Sheet Composition
- Fixed vs Floating Rate : 30:70
- Growth of Secured Financing by 15%
(excluding Corporate portfolio)
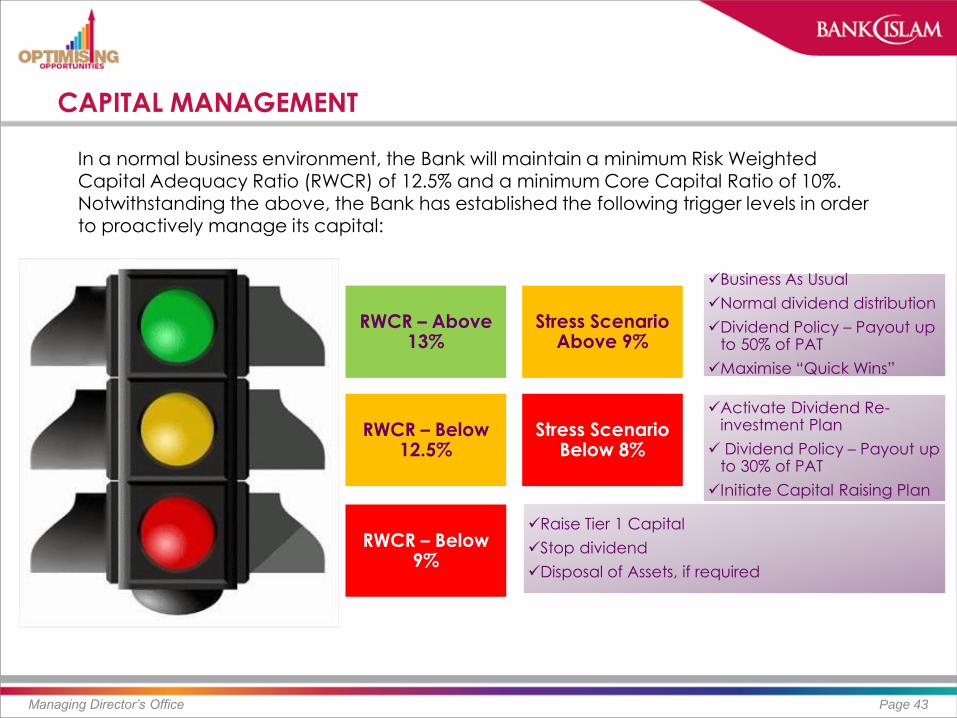
CAPITAL MANAGEMENT
Managing Director’s Office Page 43
In a normal business environment, the Bank will maintain a minimum Risk Weighted Capital Adequacy Ratio (RWCR) of 12.5% and a minimum Core Capital Ratio of 10%. Notwithstanding the above, the Bank has established the following trigger levels in order to proactively manage its capital:
RWCR – Above 13%
RWCR – Below 12.5%
RWCR – Below 9%
Stress Scenario Below 8%
Stress Scenario Above 9%
Business As Usual
Normal dividend distribution
Dividend Policy – Payout up to 50% of PAT
Maximise “Quick Wins”
Activate Dividend Re-investment Plan
Dividend Policy – Payout up to 30% of PAT
Initiate Capital Raising Plan
Raise Tier 1 Capital
Stop dividend
Disposal of Assets, if required

FRANCHISE DEVELOPMENTS
Managing Director’s Office Page 44
2010 2011 2012 2013

NETWORK & WORKFORCE
Managing Director’s Office Page 45
2011 2012 2013
Cost income ratio (%) 53.8% 51.4% 54.1%
Number of employees 3,882 4,082 4,253
additional during the year 173 200 171
Number of branches 122 127 133
additional during the year 10 5 6
Number of Bureau De Change 5 4 7
additional during the year - 1 3
Number of Ar Rahnu 3 4 6
additional during the year 1 1 2
Number of Self Service Terminal 1,120 1,190 1,233
additional during the year 173 70 43

HIJRAH TO EXCELLENCE PLAN – H2E (2013 TO 2015)
Page 46
Robust Organic Growth
Service Excellence
Shariah-led Innovation
Resource Optimisation
Employer of Choice
Regional-isation
Managing Director’s Office

KEY COMPONENTS OF H2E
Page 47
Robust Organic Growth
Asset Growth of 15% p.a.
Financing Growth between 20% to 25% p.a.
Financing-to-Deposit Ratio of 75% by 2015
Non-fund Base Income of 15% by 2015
Gross Profit Growth of 15% p.a.
Service Excellence
Customer Centric – Client Driven Model
Service Transformation – Service Culture
Operational Excellence
Product Attractiveness & Competitiveness
Technology as Key Enabler
Shariah-led Innovation
Shariah Centre of Excellence
Aspire Pioneering
World Class Shariah Product/Contracts
Innovation-based Incentives – “Idea
Bank”
Cost Effective Product Structure
Resource Optimisation
Harnessing Share of Wallet – “Cross
Selling & Up Selling”
Process Improvement &
Optimization
Shared Services
Cost Efficiency & High Productivity
Re-energise Brand Equity
Employer of Choice
Inspired Employees – Mindset of Excellence
Passionate Leadership
People Engagement & Shared Values
High Performance & Knowledge -
based Workplace
Work-life Balance –”Community Connection”
Regionalisation
“Close to Home” – ASEAN region
Fit Our Franchise
Right Local Partner
Business Synergistics
Strong Domestic Presence &
Delivery Networks
Managing Director’s Office

OPTIMISING OPPORTUNITIES – STRATEGIC PRIORITIES
Managing Director’s Office Page 48
Optimising Returns Accelerating CASA Growth
Delivering Superior Banking Experience
Optimising Resources
Cross Marketing for Fee-Based
Income
(FOREX, Cash Mgmt, etc)
Financing-to-Deposit Ratio of
70%
Sustaining Net Income Margin
Focus on Retail CASA
(Salary a/c)
Individual Deposit -15% of Total
Deposit
First-time Resolution at
Contact Centre
Expanding Footprint &
Optimising Cross Marketing at
Branches
Refinement of Turnaround
Time& Customer Service Charter
Seamless customer service across all customer touch points
(Greetings/Welcoming environment, Interaction with
customers, Service level, Product knowledge, etc)
Service/Channel Differentiation (i.e. Bulk Opening accounts at site for universities,
factories, etc)
Channel Productivity &
Efficiency
Reinforcing Performance
Culture
Proactive Capital
Management
Rightsizing of Operating Environment &
Redeployment of Human Capital
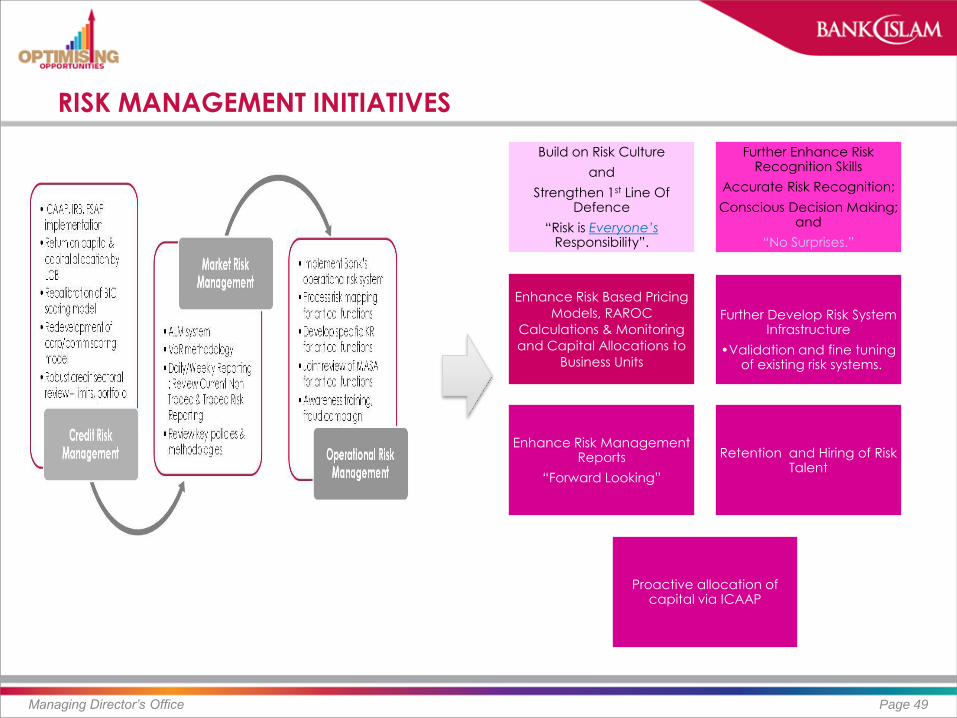
RISK MANAGEMENT INITIATIVES
Managing Director’s Office Page 49
Build on Risk Culture
and
Strengthen 1st Line Of Defence
“Risk is Everyone’s Responsibility”.
Further Enhance Risk Recognition Skills
Accurate Risk Recognition;
Conscious Decision Making; and
“No Surprises.”
Enhance Risk Based Pricing
Models, RAROC
Calculations & Monitoring
and Capital Allocations to
Business Units
Further Develop Risk System Infrastructure
•Validation and fine tuning of existing risk systems.
Enhance Risk Management Reports
“Forward Looking”
Retention and Hiring of Risk Talent
Proactive allocation of capital via ICAAP

Managing Director’s Office Page 50
BUSINESS
MODALITY

ASSETS & REVENUE COMPOSITION AS AT DEC 2013
Managing Director’s Office Page 51
42.6%
7.5% 6.1%
40.7%
0.4%
2.7% Consumer
Commercial
Corporate
Treasury
BILOB
Others*
Asset Composition Revenue Composition Revenue Mix
53.8%
7.8% 6.1%
31.2%
0.3%
0.7% Consumer
Commercial
Corporate
Treasury
BILOB
Others 87.4%
12.6%
Fund-based Income
Non-fund based Income
…primarily a retail bank…
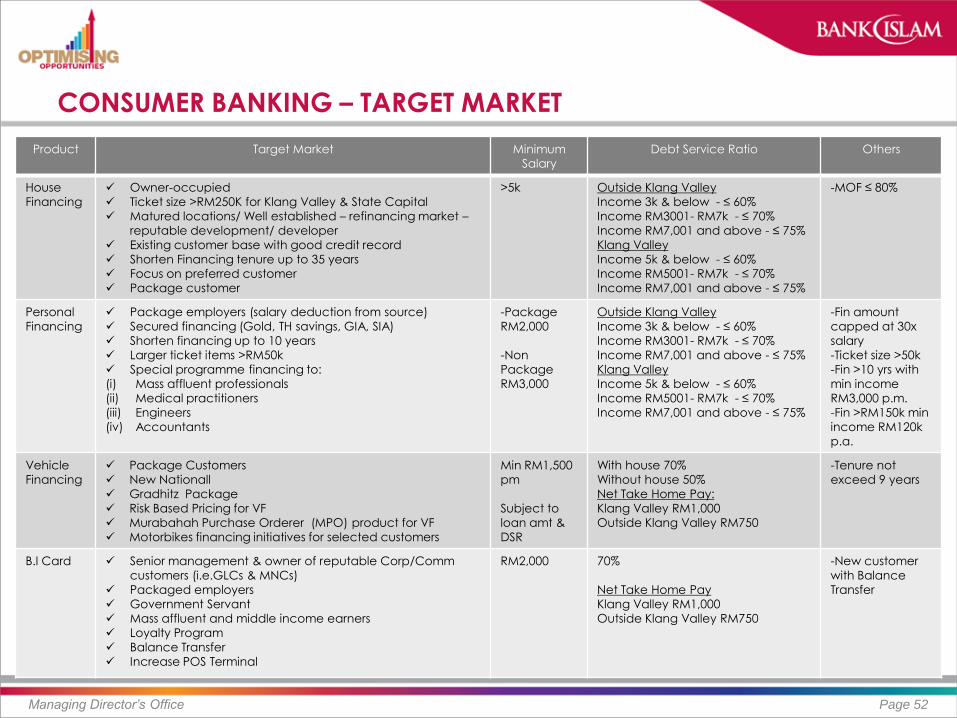
CONSUMER BANKING – TARGET MARKET
Managing Director’s Office Page 52
Product Target Market Minimum
Salary
Debt Service Ratio Others
House
Financing
Owner-occupied
Ticket size >RM250K for Klang Valley & State Capital
Matured locations/ Well established – refinancing market –
reputable development/ developer
Existing customer base with good credit record
Shorten Financing tenure up to 35 years
Focus on preferred customer
Package customer
>5k Outside Klang Valley
Income 3k & below - ≤ 60%
Income RM3001- RM7k - ≤ 70%
Income RM7,001 and above - ≤ 75%
Klang Valley
Income 5k & below - ≤ 60%
Income RM5001- RM7k - ≤ 70%
Income RM7,001 and above - ≤ 75%
-MOF ≤ 80%
Personal
Financing
Package employers (salary deduction from source)
Secured financing (Gold, TH savings, GIA, SIA)
Shorten financing up to 10 years
Larger ticket items >RM50k
Special programme financing to: (i) Mass affluent professionals
(ii) Medical practitioners
(iii) Engineers
(iv) Accountants
-Package
RM2,000
-Non
Package RM3,000
Outside Klang Valley
Income 3k & below - ≤ 60%
Income RM3001- RM7k - ≤ 70%
Income RM7,001 and above - ≤ 75%
Klang Valley Income 5k & below - ≤ 60%
Income RM5001- RM7k - ≤ 70%
Income RM7,001 and above - ≤ 75%
-Fin amount
capped at 30x
salary
-Ticket size >50k
-Fin >10 yrs with min income
RM3,000 p.m.
-Fin >RM150k min
income RM120k
p.a.
Vehicle
Financing
Package Customers
New Nationall
Gradhitz Package Risk Based Pricing for VF
Murabahah Purchase Orderer (MPO) product for VF
Motorbikes financing initiatives for selected customers
Min RM1,500
pm
Subject to
loan amt &
DSR
With house 70%
Without house 50%
Net Take Home Pay: Klang Valley RM1,000
Outside Klang Valley RM750
-Tenure not
exceed 9 years
B.I Card Senior management & owner of reputable Corp/Comm
customers (i.e.GLCs & MNCs)
Packaged employers
Government Servant
Mass affluent and middle income earners
Loyalty Program
Balance Transfer
Increase POS Terminal
RM2,000 70%
Net Take Home Pay
Klang Valley RM1,000
Outside Klang Valley RM750
-New customer
with Balance
Transfer
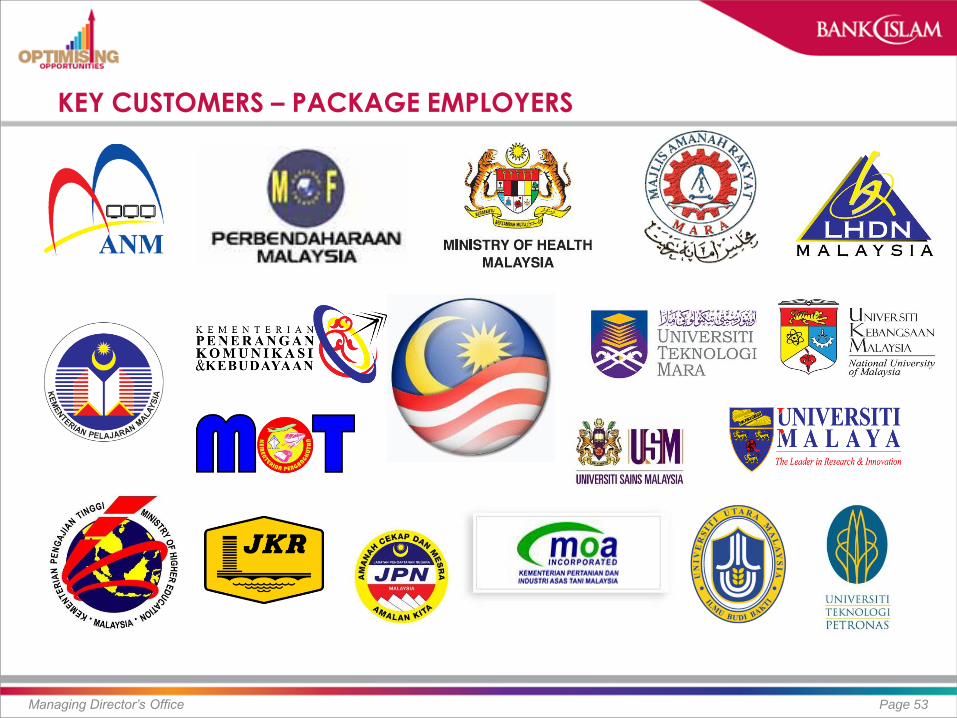
KEY CUSTOMERS – PACKAGE EMPLOYERS
Managing Director’s Office Page 53
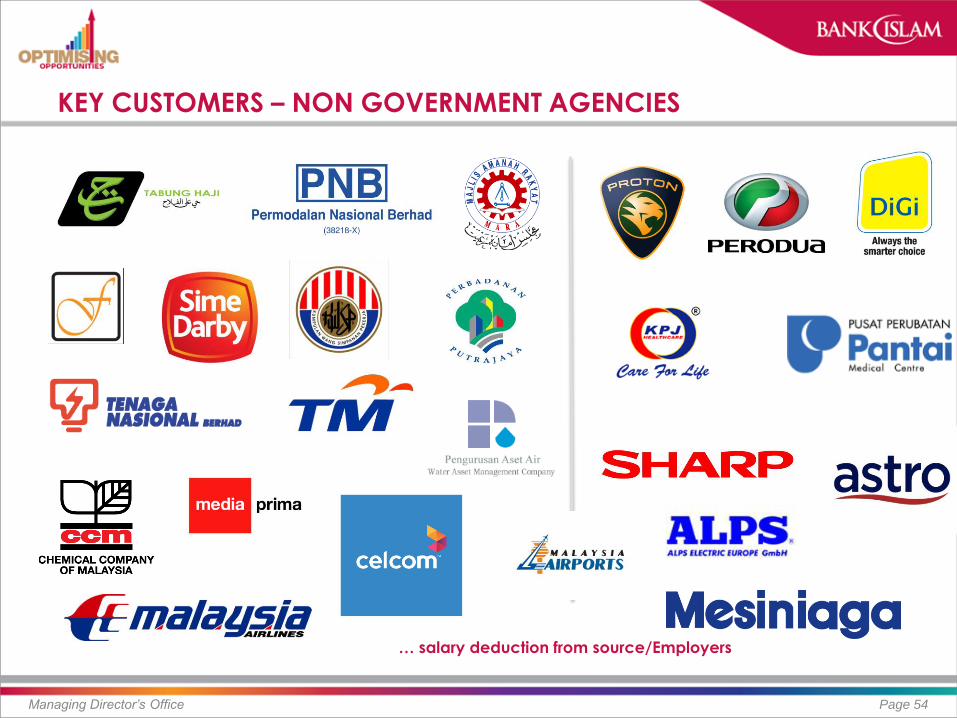
KEY CUSTOMERS – NON GOVERNMENT AGENCIES
Managing Director’s Office Page 54
… salary deduction from source/Employers

NEW TARGET SEGMENTS
Managing Director’s Office Page 55

EXPOSURE TO ETP PROJECTS
Managing Director’s Office Page 56
Oil, Gas & Energy
Education
Palm Oil
Healthcare
Greater Kuala Lumpur
About RM360 million About RM4.7 billion
About RM4.7 billion
About RM515 million
..out of RM219.3 billion worth of committed ETP projects, only RM20.5 billion were realised by end-Sept 2013. The balance will flow through from 2014 onwards

GAME CHANGING INITIATIVES
Managing Director’s Office Page 57
Total
Spent:
RM1.5 bil
Total
Spent:
RM1.5 bil
1. ENABLING E-PAYMENT SERVICES FOR SMEs AND MICRO ENTERPRISES
Agenda: Promoting Electronic Banking Transactions Introduced the country’s first low-cost Mobile Point of Sales (MPOS) to allow small business entrepreneurs
and petty traders to benefit from electronic payment
Facilitate usage of online banking via eBanker and internet banking by SMEs – achieved 39.4% growth
from April 2013 to March 2014
Deployed self-service Internet (SSI) kiosks at branches - 48 SSIs were deployed in 2013
Deployment of POS Terminals and Acceptance of Payment Cards at Government Agencies
Internet Banking Fund Transfer and Interbank Giro for SME at Internet Banking and Ebanker
National Bill Payment System Project – ePayment standardisation
eDebit card and EDCPOS – for retail driven by Credit Card business (BICC)
2. MOBILE BANKING
Agenda: Attaining Excellence in Service Delivery to Customers Launched the first mobile banking service without internet access known as TAP Mobile Banking-i, where
account owners can perform banking transactions anywhere and anytime
In partnership with Amanah Ikhtiar Malaysia (AIM) to facilitate collection of micro financing via mobile
banking
Gained 447K subscribers within three years, mainly from Generation X and Y.
To cater for the younger segment of the demographics that appreciate the value of technology and
hassle-free transactions
Digital Malaysia
Programme
Digital
Malaysia Programme
Rural Transformation
Programme

GAME CHANGING INITIATIVES…CONT
Managing Director’s Office Page 58
Total
Spent:
RM1.5 bil
Total
Spent:
RM1.5 bil
3. AR RAHNU (ISLAMIC PAWN-BROKING)
Agenda: Promoting Financial Inclusion and Microfinancing Pawn broking services, providing access to capital to the underserved community hence facilitating social
uplift
5 Ar Rahnu Outlets in Kelantan
1 Ar Rahnu Outlet in Kuantan, Pahang
Total Financing outstanding of RM85m as at Q1 2014
No of customers grew by 34% from 10,896 in 2012 to 14,597 as at Mar 2014.
4. UNIDEBIT CARD
Agenda: Promoting Cashless Ecosystem to the University Community Providing infrastructure and enabler to social uplift, in support of Rural Transformation Programme and
Digital Malaysia Programme
Corporate Card and University student COMBO card with total active UniDebit Cards of more than 6,500
in UMK, UMP and UPSI and more than RM1.5m in terms of total transaction amounts.
Digital Malaysia
Programme
Digital Malaysia
Programme
Rural Transformation
Programme
Rural Transformation
Programme
Managing Director’s Office Page 59
FINANCIAL
HIGHLIGHTS

ROBUST ORGANIC GROWTH
Managing Director’s Office Page 60
+13.8% PBZT Growth
+14.4% Total Assets Growth
+21.7% Financing Growth
65% Financing-to-deposits ratio
1.2% Gross Impaired Ratio
236.7 308.3
233.1 342.5
493.0 600.3
683.0
Jun 07 Jun 08 Jun 09 Dec 10 Dec 11 Dec 12 Dec 13
19,091.2 23,559.4
27,497.5 30,397.9 32,226.5 37,450.8
42,836.5
June 07 June 08 June 09 Dec 10 Dec 11 Dec 12 Dec 13
8,472.1 9,061.3 9,661.9 11,857.1
14,160.3
19,508.7
23,740.9
June 07 June 08 June 09 Dec 10 Dec 11 Dec 12 Dec 13 -0.9% Net Impaired Ratio
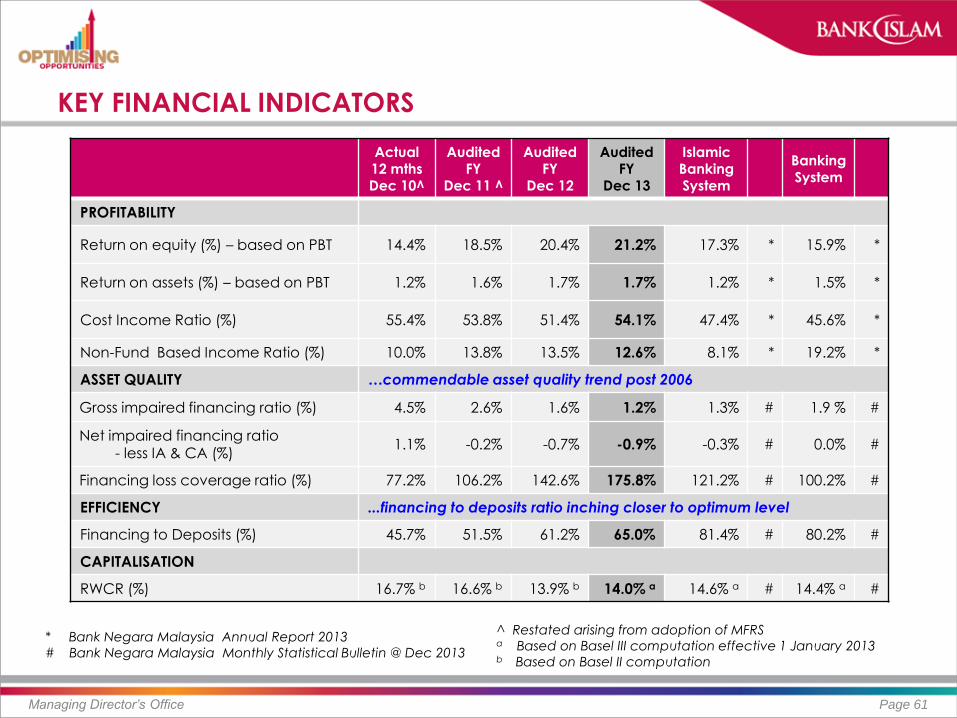
KEY FINANCIAL INDICATORS
Managing Director’s Office Page 61
Actual 12 mths Dec 10^
Audited FY
Dec 11 ^
Audited FY
Dec 12
Audited FY
Dec 13
Islamic Banking System
Banking System
PROFITABILITY
Return on equity (%) – based on PBT 14.4% 18.5% 20.4% 21.2% 17.3% * 15.9% *
Return on assets (%) – based on PBT 1.2% 1.6% 1.7% 1.7% 1.2% * 1.5% *
Cost Income Ratio (%) 55.4% 53.8% 51.4% 54.1% 47.4% * 45.6% *
Non-Fund Based Income Ratio (%) 10.0% 13.8% 13.5% 12.6% 8.1% * 19.2% *
ASSET QUALITY …commendable asset quality trend post 2006
Gross impaired financing ratio (%) 4.5% 2.6% 1.6% 1.2% 1.3% # 1.9 % #
Net impaired financing ratio - less IA & CA (%)
1.1% -0.2% -0.7% -0.9% -0.3% # 0.0% #
Financing loss coverage ratio (%) 77.2% 106.2% 142.6% 175.8% 121.2% # 100.2% #
EFFICIENCY ...financing to deposits ratio inching closer to optimum level
Financing to Deposits (%) 45.7% 51.5% 61.2% 65.0% 81.4% # 80.2% #
CAPITALISATION
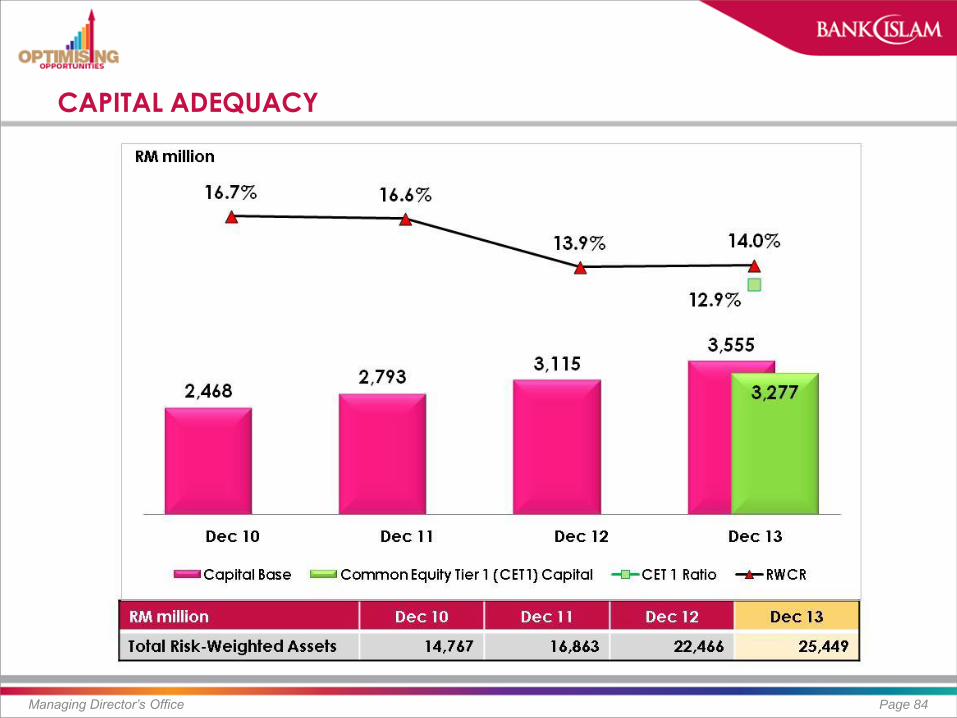
RWCR (%) 16.7% b 16.6% b 13.9% b 14.0% a 14.6% a # 14.4% a #
* Bank Negara Malaysia Annual Report 2013
# Bank Negara Malaysia Monthly Statistical Bulletin @ Dec 2013
^ Restated arising from adoption of MFRS a Based on Basel III computation effective 1 January 2013 b Based on Basel II computation

INCOME STATEMENT
Managing Director’s Office Page 62
FYE Dec 13
FYE Dec 12
Variance
RM million Amount %
Total income 2,244.3 1,987.4 256.9 12.9%
Profit to depositors (780.3) (593.4) (186.9) -31.5%
Net income 1,464.0 1,394.0 70.0 5.0%
Total overheads (792.3) (716.8) (75.5) -10.5%
Profit before allowance for impairment 671.7 677.2 (5.5) -0.8%
Allowance for impairment on financing and advances 15.0 (66.1) 81.1 -122.7%
Allowance for impairment on investments (9.2) 0.6 (9.8) -1,696.4%
Reversal on allowance for impairment on other assets 5.5 3.4 2.1 63.2%
Provision for contingent liability - (14.8) 14.8 -100.0%
Profit before zakat and tax 683.0 600.3 82.7 13.8%
Zakat (12.6) (9.2) (3.4) -35.9%
Tax (178.8) (160.3) (18.5) -11.6%
Profit for the period 491.6 430.8 60.8 14.1%

RETURN ON EQUITY – DEC 2013 VS DEC 2012
Managing Director’s Office Page 63
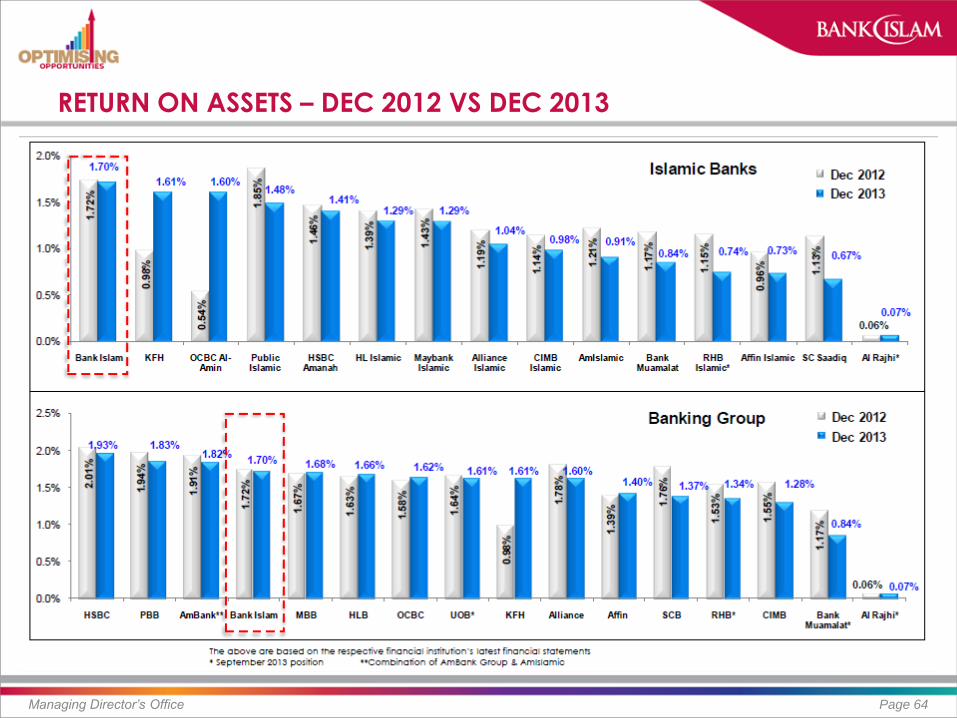
RETURN ON ASSETS – DEC 2012 VS DEC 2013
Managing Director’s Office Page 64

NET INCOME SPREAD
Managing Director’s Office Page 65
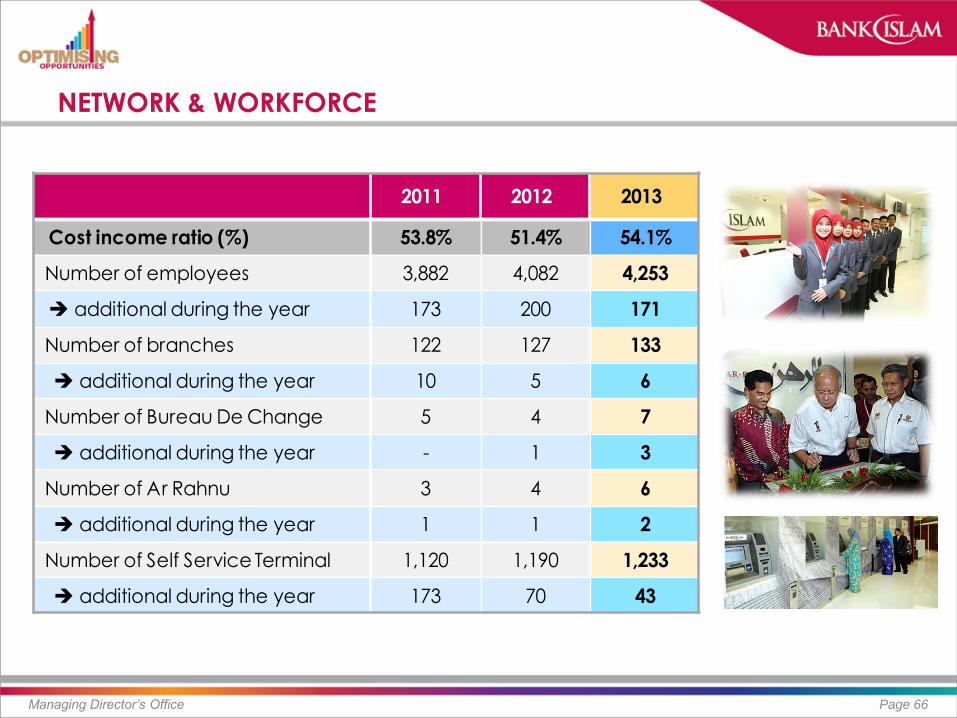
NETWORK & WORKFORCE
Managing Director’s Office Page 66
2011 2012 2013
Cost income ratio (%) 53.8% 51.4% 54.1%
Number of employees 3,882 4,082 4,253
additional during the year 173 200 171
Number of branches 122 127 133
additional during the year 10 5 6
Number of Bureau De Change 5 4 7
additional during the year - 1 3
Number of Ar Rahnu 3 4 6
additional during the year 1 1 2
Number of Self Service Terminal 1,120 1,190 1,233
additional during the year 173 70 43
NETWORK & WORKFORCE…CONT
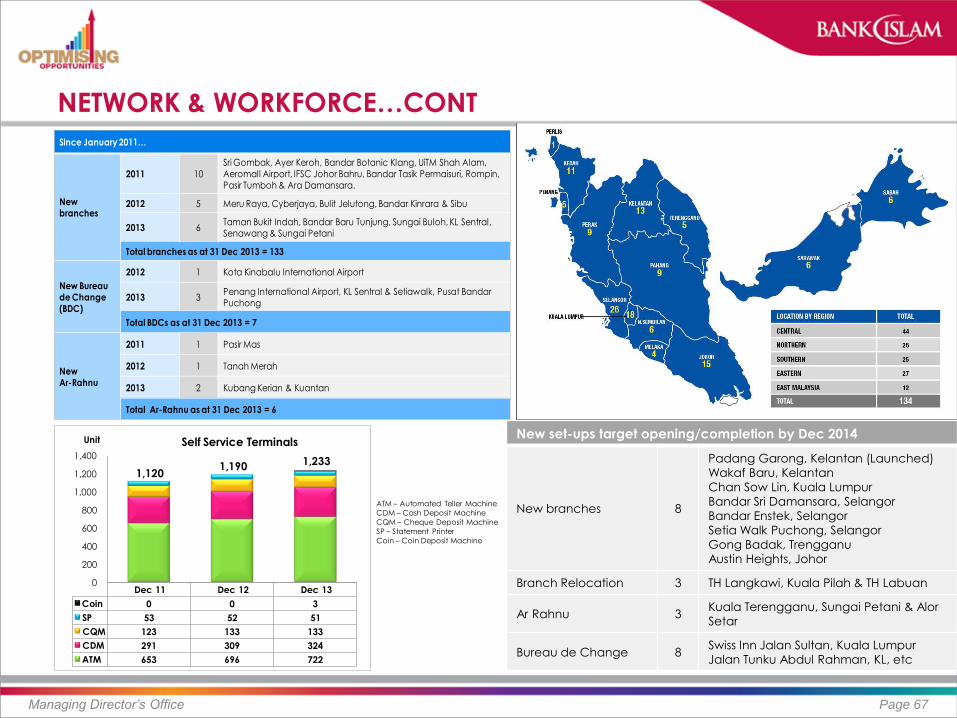
Managing Director’s Office Page 67
Dec 11 Dec 12 Dec 13
Coin 0 0 3
SP 53 52 51
CQM 123 133 133
CDM 291 309 324
ATM 653 696 722
0
200
400
600
800
1,000
1,200
1,400
Unit Self Service Terminals
1,1201,190 1,233
ATM – Automated Teller Machine
CDM – Cash Deposit Machine
CQM – Cheque Deposit Machine
SP – Statement Printer
Coin – Coin Deposit Machine
Since January 2011…
New branches
2011 10
Sri Gombak, Ayer Keroh, Bandar Botanic Klang, UiTM Shah Alam, Aeromall Airport, IFSC Johor Bahru, Bandar Tasik Permaisuri, Rompin, Pasir Tumboh & Ara Damansara.
2012 5 Meru Raya, Cyberjaya, Bulit Jelutong, Bandar Kinrara & Sibu
2013 6Taman Bukit Indah, Bandar Baru Tunjung, Sungai Buloh, KL Sentral, Senawang & Sungai Petani
Total branches as at 31 Dec 2013 = 133
New Bureaude Change (BDC)
2012 1 Kota Kinabalu International Airport
2013 3Penang International Airport, KL Sentral & Setiawalk, Pusat Bandar Puchong
Total BDCs as at 31 Dec 2013 = 7
New Ar-Rahnu
2011 1 Pasir Mas
2012 1 Tanah Merah
2013 2 Kubang Kerian & Kuantan
Total Ar-Rahnu as at 31 Dec 2013 = 6
New set-ups target opening/completion by Dec 2014
New branches 8
Padang Garong, Kelantan (Launched)
Wakaf Baru, Kelantan
Chan Sow Lin, Kuala Lumpur
Bandar Sri Damansara, Selangor
Bandar Enstek, Selangor
Setia Walk Puchong, Selangor
Gong Badak, Trengganu
Austin Heights, Johor
Branch Relocation 3 TH Langkawi, Kuala Pilah & TH Labuan
Ar Rahnu 3 Kuala Terengganu, Sungai Petani & Alor
Setar
Bureau de Change 8 Swiss Inn Jalan Sultan, Kuala Lumpur
Jalan Tunku Abdul Rahman, KL, etc

KEY BALANCE SHEET ITEMS
Managing Director’s Office Page 68
RM million Actual Dec 13
Actual Dec 12
Growth
Amount %
Total assets 42,836.5 37,450.8 5,385.7 14.4%
Net financing, advances and others 23,740.9 19,508.7 4,232.2 21.7%
Gross impaired financing 285.3 308.7 (23.4) -7.6%
Net impaired financing (216.3) (131.6) (84.7) 64.3%
Deposits from customers 37,272.4 32,583.2 4,689.2 14.4%
Equity 3,329.4 3,099.6 229.8 7.4%

TOTAL ASSETS & MARKET SHARE TRENDS
Managing Director’s Office Page 69

TOTAL ASSET
Managing Director’s Office Page 70

GROSS FINANCING & MARKET SHARE TRENDS
Managing Director’s Office Page 71

GROSS FINANCING BY BUSINESS UNITS
Managing Director’s Office Page 72
% growth Dec 13 vs
Dec 12
Business units mix (%) Dec 10 Dec 11 Dec 12 Dec 13
Consumer 75.9% 75.5% 73.7% 75.2%
Commercial 12.2% 12.5% 12.3% 13.2%
Corporate 9.9% 10.3% 13.1% 10.9%
BILOB 2.0% 1.7% 0.9% 0.7%

CONSUMER FINANCING PORTFOLIO
Managing Director’s Office Page 73
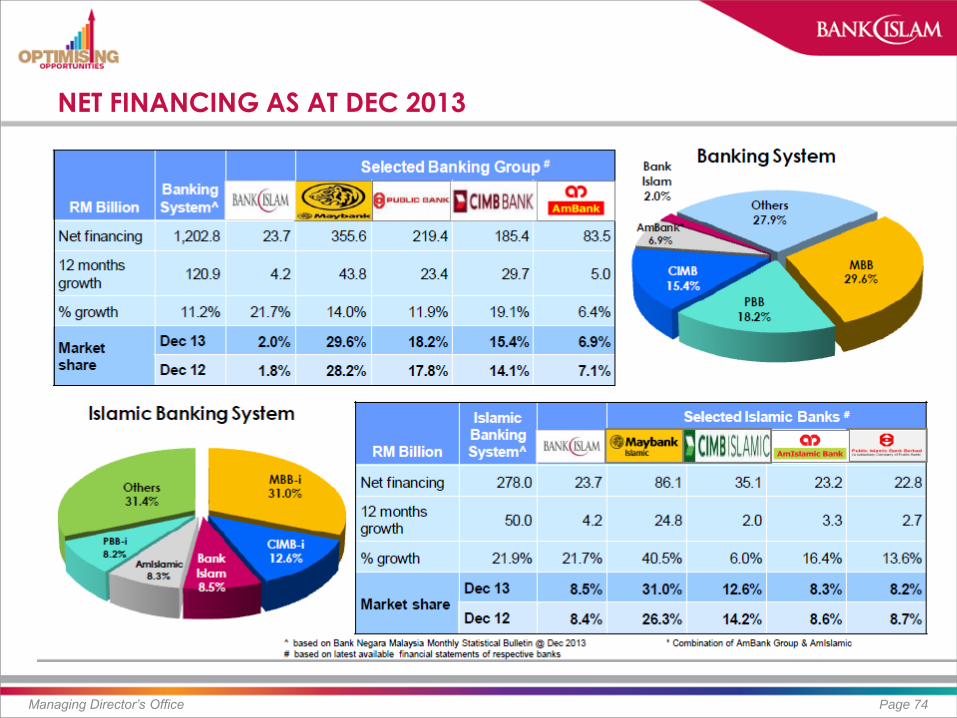
NET FINANCING AS AT DEC 2013
Managing Director’s Office Page 74

CUSTOMER DEPOSITS
Managing Director’s Office Page 75
Growth 14.4%
Financing to Deposits %
45.7% 51.5% 61.2% 65.0%

CUSTOMER DEPOSITS & MARKET SHARE TREND
Managing Director’s Office Page 76

DEPOSIT MARKET SHARE
Managing Director’s Office Page 77

CASA MARKET SHARE
Managing Director’s Office Page 78

CREDIT QUALITY TREND
Managing Director’s Office Page 79

ASSET QUALITY
Managing Director’s Office Page 80
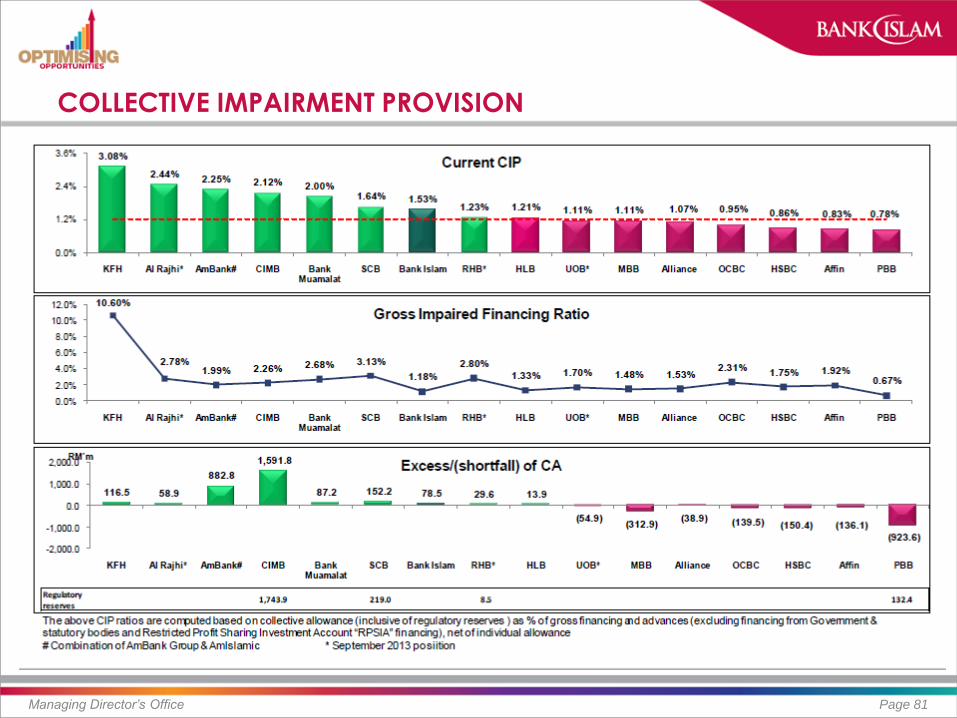
COLLECTIVE IMPAIRMENT PROVISION
Managing Director’s Office Page 81

COLLECTIVE IMPAIRMENT PROVISION FOR ISLAMIC BANKS
Managing Director’s Office Page 82
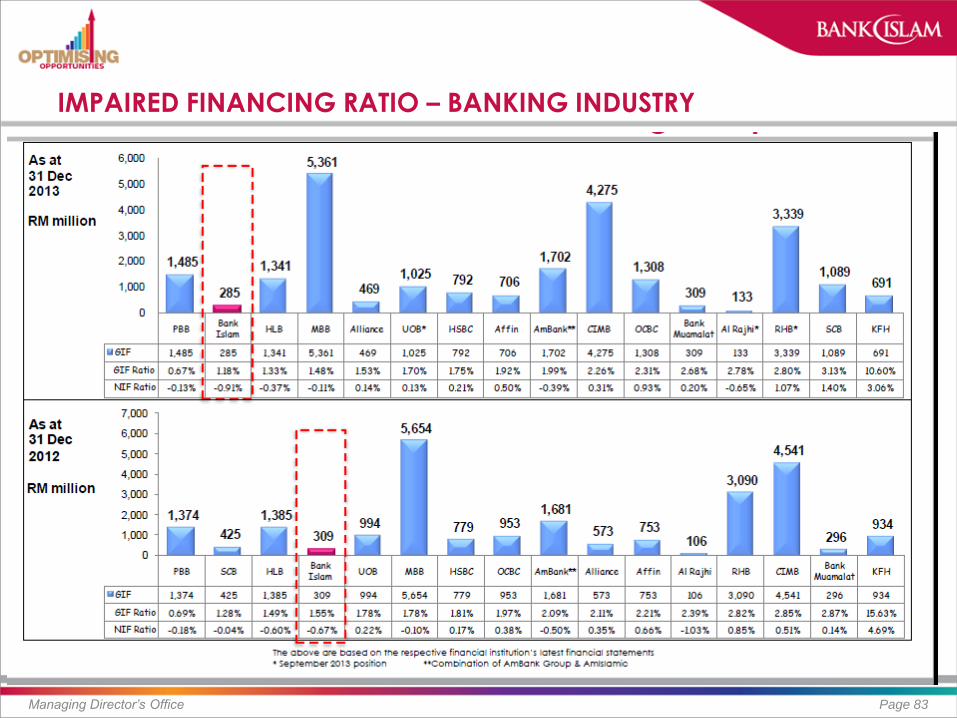
IMPAIRED FINANCING RATIO – BANKING INDUSTRY
Managing Director’s Office Page 83
CAPITAL ADEQUACY
Managing Director’s Office Page 84
DIVIDEND PAID IN 2013
Managing Director’s Office Page 85
Dividend type
Sen per share
Total amount RM’000 Date of payment
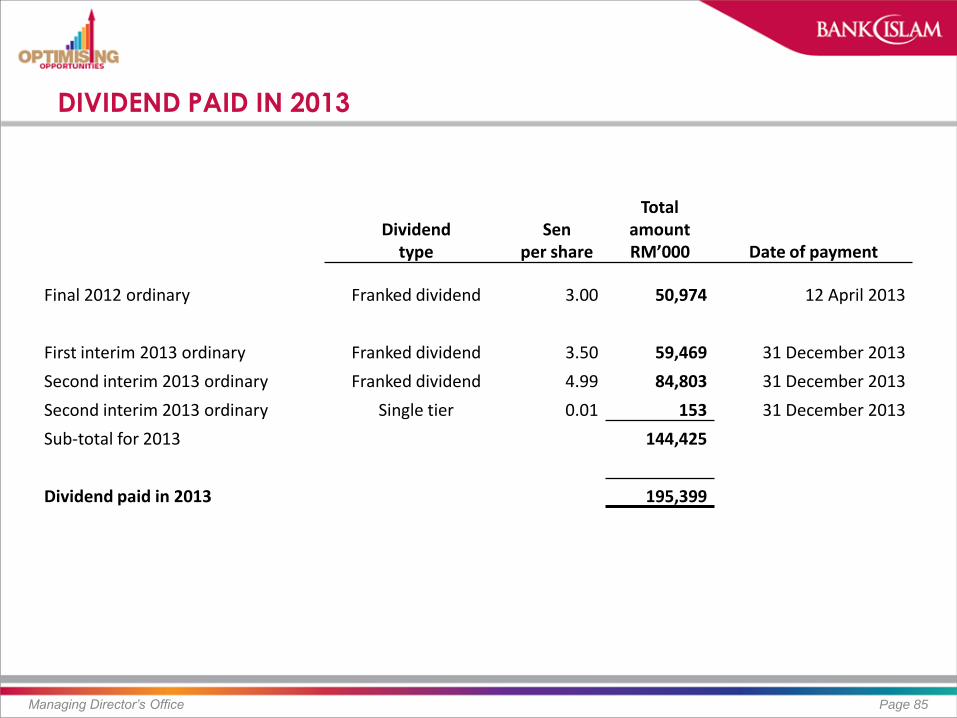
Final 2012 ordinary Franked dividend 3.00 50,974 12 April 2013
First interim 2013 ordinary Franked dividend 3.50 59,469 31 December 2013
Second interim 2013 ordinary Franked dividend 4.99 84,803 31 December 2013
Second interim 2013 ordinary Single tier 0.01 153 31 December 2013
Sub-total for 2013 144,425
Dividend paid in 2013 195,399

ZAKAT
Managing Director’s Office Page 86
Figu
res
in R
M ‘0
00
4,885
8,934
11,575
8,081
9,251
12,584
FY2008 FY2009 FY2010* FY2011 FY2012 FY2013
* Amount for 2010 is for a period of 18 months due to change of our
financial year from 30 June to 31 December
Managing Director’s Office Page 87
ISLAMIC BANKING
LANDSCAPE
MALAYSIAN ISLAMIC FINANCE LANDSCAPE
Managing Director’s Office Page 88
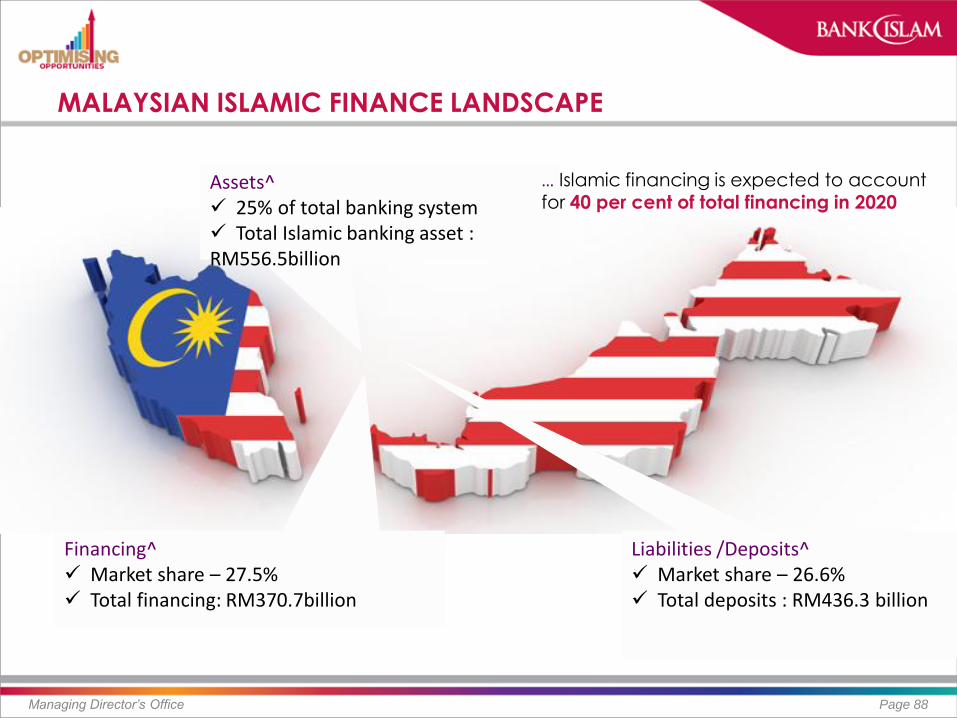
Assets^ 25% of total banking system Total Islamic banking asset : RM556.5billion
Financing^ Market share – 27.5% Total financing: RM370.7billion
Liabilities /Deposits^ Market share – 26.6% Total deposits : RM436.3 billion
… Islamic financing is expected to account for 40 per cent of total financing in 2020

KEY STATISTICS OF ISLAMIC BANKING
Managing Director’s Office Page 89
Source: BNM
Chart 1: % of total banking system
19.6
20.7
22.4
23.8
25.0
21.6
22.7
24.3
25.8
27.5
20.7
22.6
24.4 25.6
26.6
15.0
17.0
19.0
21.0
23.0
25.0
27.0
29.0
2009 2010 2011 2012 2013
Total assets
Total financing
Total deposits 2.2
2.1
1.6
1.2
1.0
1.3 1.3
1.0
1.3
1.2
0.8
1.0
1.2
1.4
1.6
1.8
2.0
2.2
2.4
0.0
0.2
0.4
0.6
0.8
1.0
1.2
1.4
2009 2010 2011 2012 2013
Net impaired
financing ratio (RHS)
Return on asset
Chart 2: ROA vs. net impaired ratio

KEY STATISTICS OF ISLAMIC BANKING…CONT
Managing Director’s Office Page 90
Chart 3: Income composition in 2013 Chart 4: Return on Equity
Fund-based income 89.3%
Fee-based income 10.7%
0
2
4
6
8
10
12
14
16
18
20
2009 2010 2011 2012 2013
5-yr average @ 15.7

KEY STATISTICS OF ISLAMIC BANKING…CONT
Managing Director’s Office Page 91
Source: BNM
Chart 5: Cost-to-income ratio Chart 6: # of Employee vs. Office Network
45.3%
46.7%
47.4%
50.9%
50.2%
44.0%
45.0%
46.0%
47.0%
48.0%
49.0%
50.0%
51.0%
52.0%
2009 2010 2011 2012 2013
7,829
8,515
9,214
9,751
10,205
0
500
1,000
1,500
2,000
2,500
7,500
8,000
8,500
9,000
9,500
10,000
10,500
2009 2010 2011 2012 2013
Number of employee
Office network (RHS)
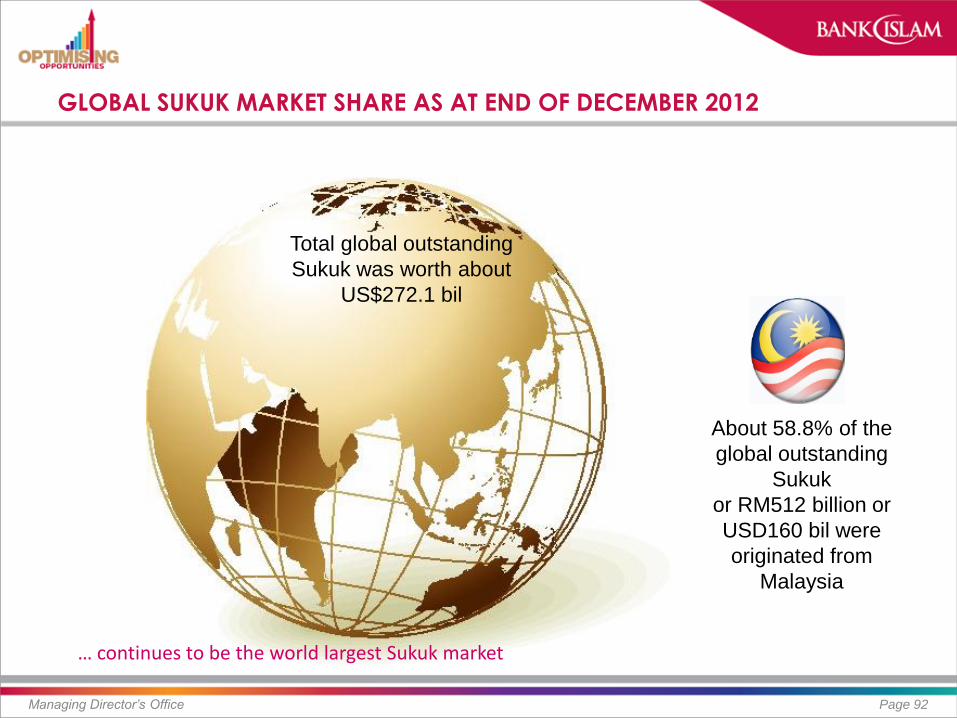
GLOBAL SUKUK MARKET SHARE AS AT END OF DECEMBER 2012
Managing Director’s Office Page 92
About 58.8% of the
global outstanding
Sukuk
or RM512 billion or
USD160 bil were
originated from
Malaysia
Total global outstanding
Sukuk was worth about
US$272.1 bil
… continues to be the world largest Sukuk market

Managing Director’s Office Page 93
DEPOSIT
TRANSITION PLAN
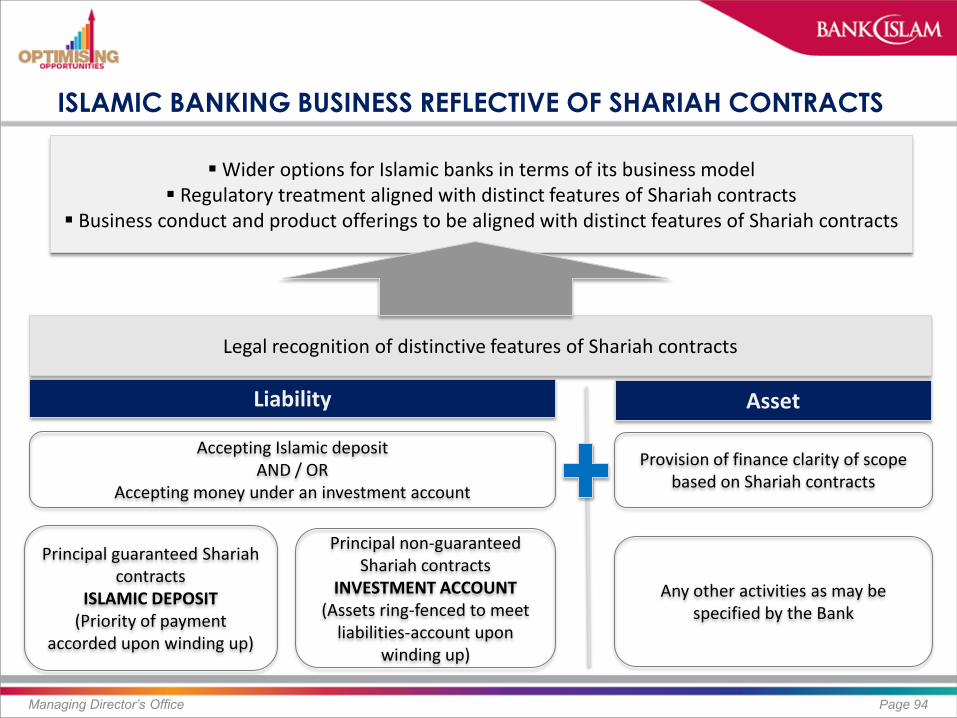
ISLAMIC BANKING BUSINESS REFLECTIVE OF SHARIAH CONTRACTS
Managing Director’s Office Page 94
Wider options for Islamic banks in terms of its business model Regulatory treatment aligned with distinct features of Shariah contracts
Business conduct and product offerings to be aligned with distinct features of Shariah contracts
Liability Asset
Accepting Islamic deposit AND / OR
Accepting money under an investment account
Provision of finance clarity of scope based on Shariah contracts
Principal guaranteed Shariah contracts
ISLAMIC DEPOSIT (Priority of payment
accorded upon winding up)
Principal non-guaranteed Shariah contracts
INVESTMENT ACCOUNT (Assets ring-fenced to meet
liabilities-account upon winding up)
Any other activities as may be specified by the Bank
Legal recognition of distinctive features of Shariah contracts

RECLASSIFYING OF FUNDS
Managing Director’s Office Page 95
30 June 2013 - IFSA is effective, distinguishing Islamic deposit and Islamic investment accounts as follows:
The new IA guideline was released take effect from 14 March 2013 while the transition policy for IA will take effect commencing from 1 June 2015
Existing customers who hold Mudarabah and Wakalah based demand deposit and investment products are effected by transition plan
Islamic Deposit
Sum of money paid or accepted in accordance with Shariah
Principal is Guaranteed With or without any consideration Repayment on demand or at a certain
time
Investment Account (IA)
Money paid or accepted for purposes of investment in accordance with Shariah
Principal Non-Guaranteed With any consideration Repayment at certain time

OVERVIEW OF DEPOSIT ACCOUNTS
Managing Director’s Office Page 96
Deposit Account
Wadiah/Qard Tawarruq Bai Inah
Wadiah/Qard
No returns Marketing on services/features
i.e.: debit-card facility, access to TH account, TAP mobile banking, MEPS IBFT, etc
Tawarruq
Similar to fixed/term deposit Returns are fixed upfront as part
of murabaha structure Brokerage fees to be borne by
the Bank

OVERVIEW OF INVESTMENT ACCOUNTS (IA)
Managing Director’s Office Page 97
Investors Bank As Agent (Wakalah); or As Entrepreneur (Mudarabah); or As Business Partner (Musharakah)
Venture
1st Leg 2nd Leg
Contract under IA : Wakalah Mudarabah Musharakah
Contract between Bank and business owner Equity financing (Musharakah,
Mudarabah) Lease-based financing (Ijarah) Sale-based (Murabahah, Istisna’,
Inah) Fee based (Wakalah , Ujra’)) Guarantee (Kafalah)
Principal non-guaranteed Shariah contracts
INVESTMENT ACCOUNT (Assets ring-fenced to meet liabilities-
account upon winding up)

IA RELATIONS
Managing Director’s Office Page 98
Islamic Banking Institutions
(IBIs)
IBIs to play significant role in structuring RIA to
match investors & ventures
KEEN INVESTORS GOOD VENTURES
Retail Investors
Institutional Investors
Small Business
Established Business
Source : Bank Negara Malaysia

TYPE OF SHARIAH CONTRACTS FOR INVESTMENT ACCOUNTS
Page 99
Shariah Contract Definitions
Mudarabah
“Mudarabah”, means a contract between capital provider (rabbul mal) and an entrepreneur (mudarib) under which the rabbul mal provides capital to be managed by the mudarib based on any profit generated from the capital is shared between the rabbul mal and the mudarib according to mutually agreed profit sharing ratio (PSR) whilst financial losses are borne by the rabbul mal provided that such losses are not due to the mudarib’s misconduct (ta’adi), negligence (taqsir) or breach of specified terms (mukhafalah al-shurut).
Musharakah
“Musharakah”, means a partnership between two or more parties which may take effect through contractual relationship (‘aqd) or by operation of Islamic law, whereby all contracting parties will share the profit and bear loss from partnership.
Wakalah
“Wakalah”, means a contract in which a party (muwakkil) authorizes another party as his agent (wakil) to perform a particular task, in matters that may be delegated, either voluntarily or with imposition of fee.
Managing Director’s Office
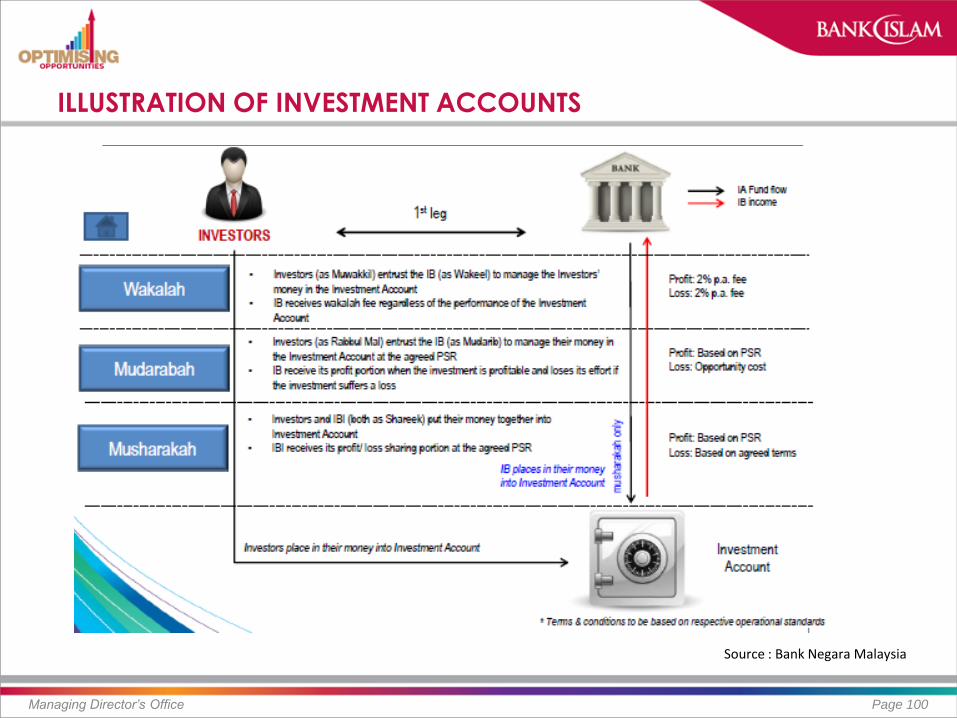
ILLUSTRATION OF INVESTMENT ACCOUNTS
Managing Director’s Office Page 100
Source : Bank Negara Malaysia

ILLUSTRATION ON APPLICATION OF IA
Managing Director’s Office Page 101
Source : Bank Negara Malaysia
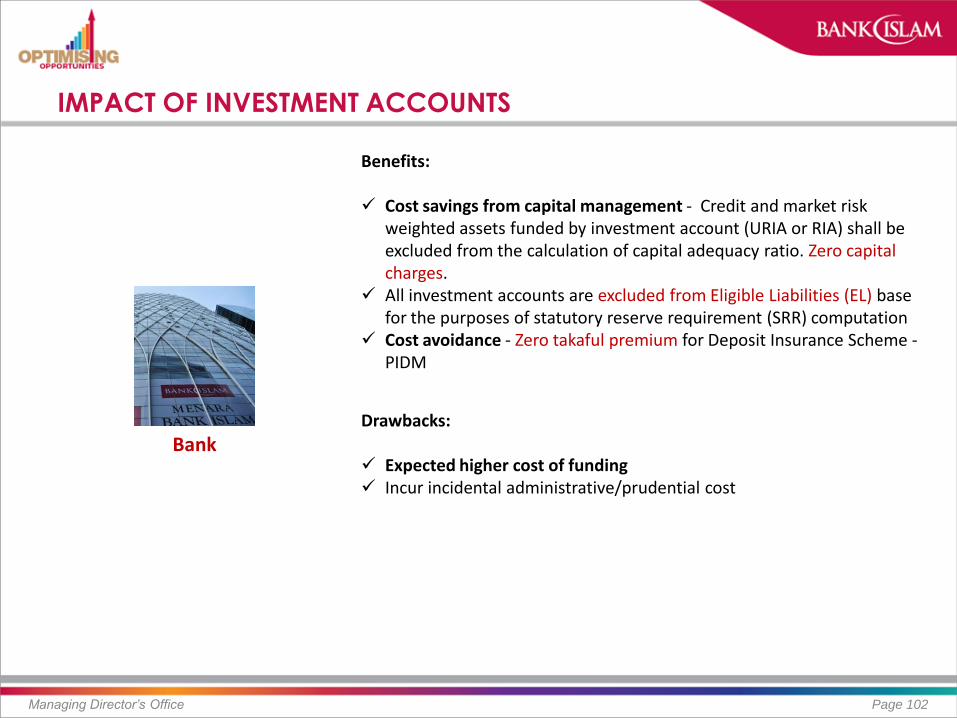
IMPACT OF INVESTMENT ACCOUNTS
Managing Director’s Office Page 102
Bank
Benefits: Cost savings from capital management - Credit and market risk
weighted assets funded by investment account (URIA or RIA) shall be excluded from the calculation of capital adequacy ratio. Zero capital charges.
All investment accounts are excluded from Eligible Liabilities (EL) base for the purposes of statutory reserve requirement (SRR) computation
Cost avoidance - Zero takaful premium for Deposit Insurance Scheme - PIDM
Drawbacks: Expected higher cost of funding Incur incidental administrative/prudential cost
IMPACT TO EXISTING CUSTOMERS
Customers whose Islamic deposit account are structured based on Shariah contract with non-principal guaranteed feature (i.e. Mudharabah Savings Account or Wakalah Deposit) will be dully informed of the alternative products and provided with sufficient information/ transparency to make an informed decision.
Customers would have a choice to either maintain their funds with Islamic deposit or change to investment account product depending on the customers’ risk appetite.
Customers will be accorded sufficient time to inform the Islamic banks of their decision by June 2014.
During the transition period, all the Islamic deposits based on Shariah contract with non-principal guarantee feature will remain status quo and continue to be eligible for PIDM protection (up to RM250K) until the completion of the transition plan.
Page 103 Managing Director’s Office

ACCOUNTING TREATMENT
Managing Director’s Office Page 104
Bank
Investors
BNM is currently facilitating the discussion with Malaysia Institute of Accountant and Malaysia Accounting Standard Board with regards to the following accounting treatment: URIA – On vs Off balance sheet Consolidation Financial Ratios Notes to the Account
Disclosure in the Account Valuation / Mark-to-market accounting

Managing Director’s Office Page 105
BUSINESS
ENVIRONMENT

THE 5 WAVES
Managing Director’s Office Page 106
Intensified Competition
Price War
Eroding Margin
War for Deposits
- Pricing of CASA
- Reclassifying Deposit & Investment
- Liquidity Management
Cost of Regulatory Compliance
New Shariah Standards, Deposit Transition Plan, PDPA, FATCA,
etc
Macro Prudential Measures
- Responsible Financing Guidelines - New Measures for Property Fin. - Stringent Provision Requirement
Scarce Capital
- BASEL III
- ICAAP

Managing Director’s Office Page 107
ECONOMIC
UPDATE
Managing Director’s Office Page 108
1Q2014 GDP GROWTH – DEMAND SIDE
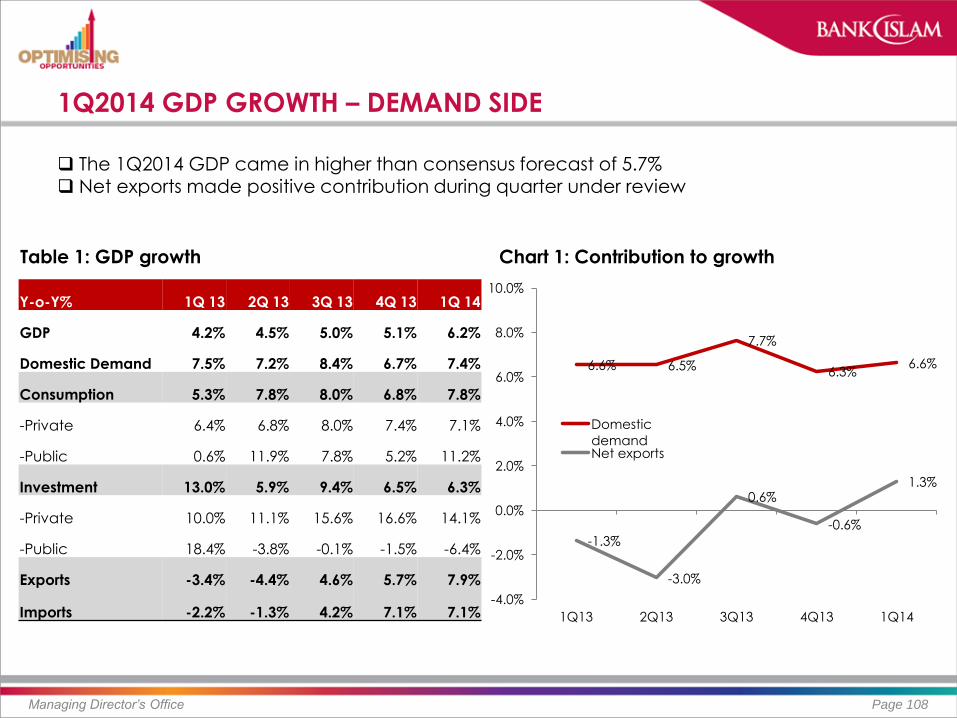
Y-o-Y% 1Q 13 2Q 13 3Q 13 4Q 13 1Q 14
GDP 4.2% 4.5% 5.0% 5.1% 6.2%
Domestic Demand 7.5% 7.2% 8.4% 6.7% 7.4%
Consumption 5.3% 7.8% 8.0% 6.8% 7.8%
-Private 6.4% 6.8% 8.0% 7.4% 7.1%
-Public 0.6% 11.9% 7.8% 5.2% 11.2%
Investment 13.0% 5.9% 9.4% 6.5% 6.3%
-Private 10.0% 11.1% 15.6% 16.6% 14.1%
-Public 18.4% -3.8% -0.1% -1.5% -6.4%
Exports -3.4% -4.4% 4.6% 5.7% 7.9%
Imports -2.2% -1.3% 4.2% 7.1% 7.1%
6.6% 6.5%
7.7%
6.3% 6.6%
-1.3%
-3.0%
0.6%
-0.6%
1.3%
-4.0%
-2.0%
0.0%
2.0%
4.0%
6.0%
8.0%
10.0%
1Q13 2Q13 3Q13 4Q13 1Q14
Domestic
demand Net exports
Table 1: GDP growth Chart 1: Contribution to growth
The 1Q2014 GDP came in higher than consensus forecast of 5.7%
Net exports made positive contribution during quarter under review

1Q2014 GDP GROWTH – SUPPLY SIDE
Managing Director’s Office Page 109
YoY% 1Q 13 2Q 13 3Q 13 4Q 13 1Q 14
GDP 4.2% 4.5% 5.0% 5.1% 6.2%
Agriculture 6.2% 0.3% 2.0% 0.2% 2.3%
Mining and
Quarrying -1.4% 4.4% 1.4% -1.2% -0.8%
Manufacturing 0.4% 3.8% 4.3% 5.2% 6.8%
Construction 14.2% 10.0% 10.2% 9.8% 18.9%
Services 6.1% 5.0% 6.0% 6.4% 6.6%
-0.1%
0.0%
0.4%
1.3%
3.5%
-0.1%
0.2%
0.7%
1.7%
3.6%
-1.0% 0.0% 1.0% 2.0% 3.0% 4.0%
Mining and Quarrying
Agriculture
Construction
Manufacturing
Services
1Q 14
4Q 13
Chart 1: Contribution to growth Table 1: GDP growth – by industry
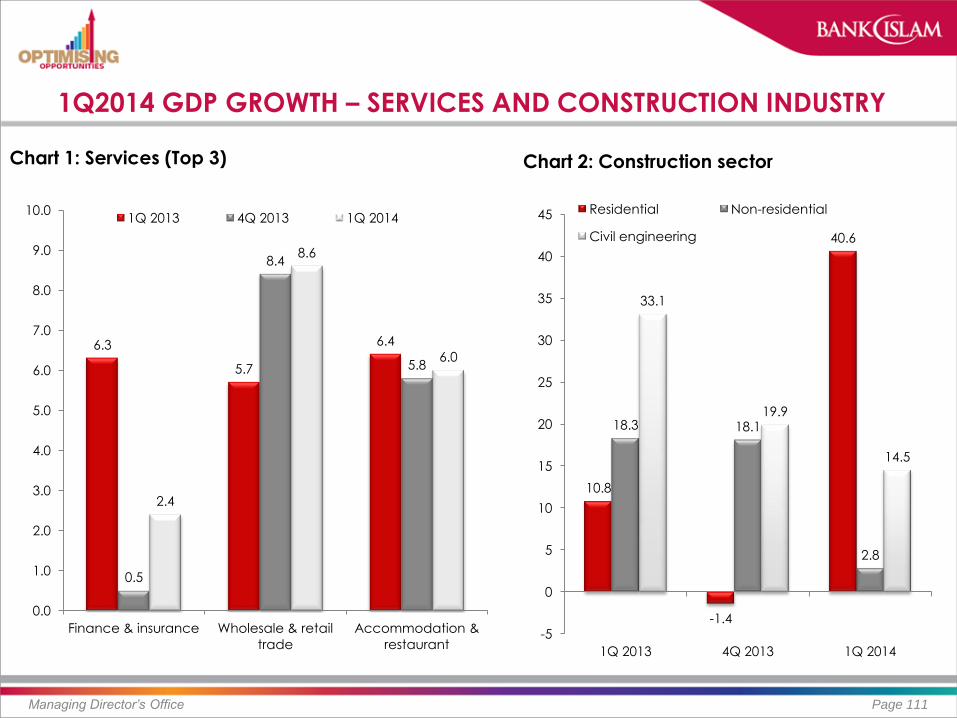
On the supply side, growth was largely underpinned by services and manufacturing
sector
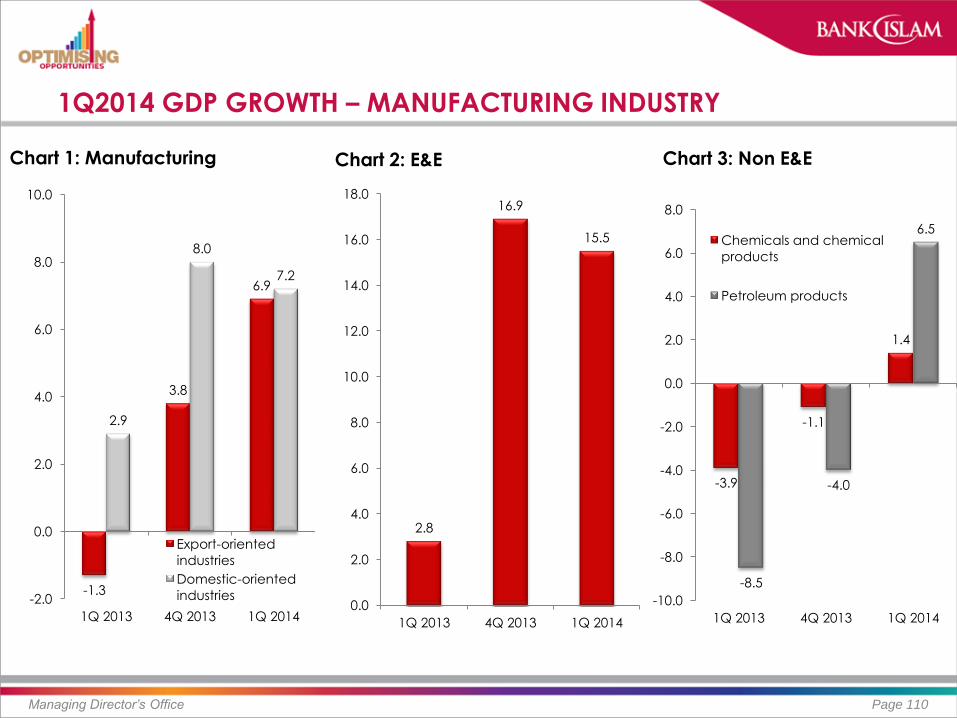
1Q2014 GDP GROWTH – MANUFACTURING INDUSTRY
Managing Director’s Office Page 110
Chart 1: Manufacturing
-1.3
3.8
6.9
2.9
8.0
7.2
-2.0
0.0
2.0
4.0
6.0
8.0
10.0
1Q 2013 4Q 2013 1Q 2014
Export-oriented
industries
Domestic-oriented
industries
2.8
16.9
15.5
0.0
2.0
4.0
6.0
8.0
10.0
12.0
14.0
16.0
18.0
1Q 2013 4Q 2013 1Q 2014
Chart 2: E&E
-3.9
-1.1
1.4
-8.5
-4.0
6.5
-10.0
-8.0
-6.0
-4.0
-2.0
0.0
2.0
4.0
6.0
8.0
1Q 2013 4Q 2013 1Q 2014
Chemicals and chemical
products
Petroleum products
Chart 3: Non E&E
Managing Director’s Office Page 111
1Q2014 GDP GROWTH – SERVICES AND CONSTRUCTION INDUSTRY
Chart 1: Services (Top 3) Chart 2: Construction sector
6.3
5.7
6.4
0.5
8.4
5.8
2.4
8.6
6.0
0.0
1.0
2.0
3.0
4.0
5.0
6.0
7.0
8.0
9.0
10.0
Finance & insurance Wholesale & retail
trade
Accommodation &
restaurant
1Q 2013 4Q 2013 1Q 2014
10.8
-1.4
40.6
18.3 18.1
2.8
33.1
19.9
14.5
-5
0
5
10
15
20
25
30
35
40
45
1Q 2013 4Q 2013 1Q 2014
Residential Non-residential
Civil engineering

OTHER INDICATORS
Managing Director’s Office Page 112
1Q2013 4Q2013 1Q2014
Current Account 13.2 14.8 19.8
(% of GNI) 5.8 5.8 7.9
Goods 28.0 33.3 33.6
Services -2.6 -4.1 -2.7
Primary income -8.0 -10.0 -6.4
Secondary income -4.2 -4.4 -4.6
Financial Account 1.2 -9.7 -37.6
Direct investment -2.8 -4.0 -14.6
-Assets -11.6 -6.5 -20.4
-Liabilities 8.8 10.4 5.8
Portfolio investment 3.9 -0.8 -13.4
-Assets -5.3 -5.4 -7.6
-Liabilities 9.2 4.6 -5.8
Financial derivatives 0.2 0.4 -1.5
Other investment -0.2 -13.3 -8.1
Errors & omissions -10.3 -7.8 0.4
Overall Balance 4.0 -2.7 -17.3
1Q2013 4Q2013 1Q2014
Revenue 43.8 61.1 49.2
% annual growth -8.6 6.8 12.4
Operating expenditure 49.9 58.8 55.2
% annual growth 9.4 -4.6 10.6
Current account -6.1 2.3 -6.0
% of GDP -2.6 0.9 -2.3
Net development expenditure 8.8 16.0 7.0
% annual growth 8.3 -3.4 -20.9
Overall balance -14.9 -13.8 -13.0
% of GDP -6.4 -5.2 -5.1
Total Federal Government debt
(as at end-period) 508.9 539.9 560.6
% of GDP 51.6 54.7 52.2
Domestic debt 352.2 381.5 398.5
% of GDP 35.7 38.7 37.1
External debt 156.7 158.4 162.1
% of GDP 15.9 16.1 15.1
Balance of payment (RM bn) Federal government finance (RM bn)

CAPITAL FLOWS IN MALAYSIA
Managing Director’s Office Page 113
-3.0
0.9 0.6
-6.3
-2.8
-5.6 -3.4
0.4
2.8
-10.0
-5.0
0.0
5.0
1H Dec 13 2H Dec 13 1H Jan 14 2H Jan 14 1H Feb 14 2H Feb 14 1H Mar 14 2H Mar 14 1H April 14
-1930.1
-989.7
-1653.6
-710.1
668.5 402.4
-2500
-2000
-1500
-1000
-500
0
500
1000
Dec-13 Jan-14 Feb-14 Mar-14 Apr-14 May-14
Chart 1: Fortnightly changes in international reserve assets (RM billion)
Chart 2: Net (sales) or purch. by foreign investors in equities market (RM Mil)
Sources: CEIC, BNM & MIDF Research

MALAYSIA – HOUSEHOLD LOAN GROWTH REMAINED STEADY
Managing Director’s Office Page 114
0.0%
2.0%
4.0%
6.0%
8.0%
10.0%
12.0%
14.0%
16.0%
18.0%
Mar-10 Mar-11 Mar-12 Mar-13 Mar-14
Total loans
Household Sector
Business loans
0.0%
2.0%
4.0%
6.0%
8.0%
10.0%
12.0%
14.0%
16.0%
Mar-12 Jul-12 Nov-12 Mar-13 Jul-13 Nov-13 Mar-14
Purchase of residential properties
Purchase of transport vehicle - passenger cars
Credit card
Chart 1: System loan growth y-o-y% Chart 2: Household loan growth
Source: CEIC
The current trend suggests further tightening in lending practices is on the horizon

INCOME PROFILE FOR THE MASS AFFLUENT
Managing Director’s Office Page 115
Source: World Top Income Data Base & DOS
22.53 24.65 24.18
8.18 9.42 9.33
0
5
10
15
20
25
30
Y00 Y05 Y10
Top 10% income share Top 1% income share
3,808 5,545 5,172
6,516 7,444
11,705
18,276 18,793
24,910
28,736
-
5,000
10,000
15,000
20,000
25,000
30,000
35,000
Y85 Y95 Y00 Y05 Y10
Top 10% Top 1%
Chart 2: Average monthly income
2009 2012 chg
Total 5.9 9.7 3.8
Bumiputera 4.5 7.4 2.9
Chinese 9.3 15.4 6.1
India 6.1 10.2 4.1
Others 7.4 4.9 -2.5
Table 1: % of income distribution for RM 10,000 and above
Chinese remained the at the top spot in
terms of percentage of those who earned RM10,000 and above followed by India and Bumiputera.
Chart 1: Share of income (%)

Q & A SESSION
Managing Director’s Office Page 116

Originating Department Page 117