Embed Size (px)
Citation preview
Modification of Biochemical Derangements and VEGF Secretion MayPrevent Diabetic Retinopathy (DR)Lakshmi Kanta Mondal1*, Subhasish Pramanik2, Sriparna De3, Suman K Paine4 and Gautam Bhaduri5
1Regional Institute of Ophthalmology, Kolkata, India2Institute of Post-Graduate Medical Education & Research, Kolkata, India3Department of Polymer Science and Technology, University of Calcutta, Kolkata, India4Regional Medical Research Centre ICMR, Dibrugarh, India5MGM Medical College, Kissangang, Bihar, India*Corresponding author: Lakshmi Kanta Mondal, Regional Institute of Ophthalmology, Kolkata, India, E-mail: [email protected]
Received date: February 21, 2019; Accepted date: May 15, 2019; Published date: May 22, 2019
Copyright: © 2019 Mondal LK, et al. This is an open-access article distributed under the terms of the Creative Commons Attribution License, which permits unrestricteduse, distribution, and reproduction in any medium, provided the original author and source are credited.
Abstract
Unutilized, enormous intracellular glucose in insulin-nondependent tissues, including retina, leads to severalconsequences: (i) increased formation of advanced glycation end products, (ii) activation of polyol pathway, (iii)anaerobic glycolysis, (iv) glutamate toxicity, (v) lipid peroxidation and oxidative stress, and all of these, finally,resulting in convergence to up regulation of antigenic VEGF and VEGFR2, the crucial player in the development ofDR. The purpose of the present pilot study is to assess the effects of one kind of intervention on the development ofDR: supplementation of B-vitamins (B1, B2, B3, B5 and B6), vitamin C and vitamin E on amelioration of biochemicalderangements related to development of DR.
400 diagnosed type 2 diabetic patients were identified for the study, of which subjects were randomised 1:1 toreceive oral antidiabetic medication along with B-vitamins, vitamin C and vitamin E or only antidiabetic medication togive the study and controlled population in this unblended randomized trial since December 2004 to December2017. The following preliminary tasks were completed: firstly, baseline detailed fundoscopic examinations wereenough to exclude the presence of retinopathy. Secondly, had baseline biochemical parameters like bllodconcentration of NAD+, NADH, advanced glycation end products (AGEs), malondialdehyde (MDA), VEGF andVEGFR2 determined? Lastly, yearly fundoscopic examinations were documented to detect the features of DR.
These efforts revealed the following findings: 32 among 187 (17.11%) patients who received supplementationwith B-vitamins, vitamin C and vitamin E developed very mild microangiopathy; whereas 92 patients among 200(46%) controlled ones developed mild to moderate non proliferative diabetic retinopathy (NPDR). 13 patients of thestudy group who didn’t follow up were counted as lost from the observation of the study.
The findings lead to this conclusion: Glycolysis and citric acid cycle should run uninterruptedly bysupplementation of precursors of oxidized cofactors and antioxidants to prevent biochemical derangements whichlead to increased expression of VEGF.
Keywords: Type 2 Diabetes Mellitus (T2DM); Diabetic Retinopathy(DR); Vitamin B; Vitamin C; Vitamin E; Biochemical derangement;Nicotinamide Adenine Dinucleotide Positive (NAD+), ReducedNicotinamide Adenine Dinucleotide (NADH); Red Blood Cell (RBC)
IntroductionIn spite of remarkable advances in diagnosis and treatment, diabetes
mellitus (DM) is becoming rampant and assuming the proportions of aglobal epidemic,with its most common microvascular complication,diabetic retinopathy, rising as the leading cause of blindness among theworking age groups [1]. Duration and severity of hyperglycemia havebeen identified as the major contributors to the pathogenesis of DR[2]. So far as the explicable etiopathogenesis known till date isconcerned, it ’ s found that hyperglycemia-induced toxic metabolicpathways are considered to lead to degeneration of microvasculature ofretina and gradual vaso-occlusion of retinal capillary bed resulting inan ischemic environment and tissue hypoxia. Though there are many
mechanisms implicated in pathogenesis of microangiopathy of DM,the background mostly explored tells that the initiation ofinflammation is the convergence of the following symptoms:environment of hyperglycemia, abnormal lipids, increased oxidativestress, elevated serum and tissue advanced glycation end products, andincreased serum and tissue cytokines. Pathways of inflammation incitethe pathways of endothelial dysfunction and vaso-occlusion of retinalcapillaries resulting in tissue hypoxia which invite increased secretionof vascular endothelial growth factor [3].
In the last decade, many of the investigators in this field wereattracted by the flames of inflammation, which is established as theprincipal factor related to the causation of diabetic retinopathy.Sequential experimental animal and human studies demonstratedsupportive evidences for this inflammatory etiology-mediatedmicroangiopathy [4-6].
Explicable biochemical scenario and persistent replicativeobservations, including the one done by us, postulated that vascular
Jour
nal o
f Clin
ical & Experimental Ophthalm
ology
ISSN: 2155-9570
Journal of Clinical & ExperimentalOphthalmology
Mondal et al., J Clin Exp Ophthalmol 2019, 10:3
Research Article Open Access
J Clin Exp Ophthalmol, an open access journalISSN: 2155-9570
Volume 10 • Issue 3 • 803
endothelial growth factor (VEGF) is the crucial mediator for DR [7,8].Therefore the scenario of promising therapeutic efficacy changed thetreatment paradigm of DR from painful laser photocoagulation topharmacotherapy with anti-VEGF agents that demonstrated asignificant progress made in large proportions of diabetic patients withvision impairing diabetic retinopathy [9]. At the same time, the otherunavoidable fact is that repeated intravitreal injections of anti-VEGFagents and maximal anti-inflammatory therapy cannot ameliorateblindness owing to diabetic macular edema and neovascularization ofdiabetic retinopathy in a significant portion of the diabetic population[10]. This perspective of the present therapy draws our attentiontowards other factors related to causation of tissue hypoxia, theprincipal mechanism of development and progression of DR. The redblood cells (RBCs) which carry oxygen to tissue level play a remarkablerole in causation of the disease owing to their structural and functionalalterations behind the biochemical and inflammatory background ofDR. In this present study, we also attempted to prevent the detrimentaleffects of hyperglycemia-induced biochemical derangements and thestructural and functional abnormalities of RBCs related to productionof tissue hypoxia.
Methodology
SubjectsA total count of 400 patients of type 2 DM were recruited following
informed consent under the declarations of Helsinki. Sample size wascalculated for each group as per formula proposed by Naing et al. [11].
The formula is:
� = �1− � �1 1− �1 + �1− �/2 �0 1− �0 2�1− �0 2
Where; P1is the anticipated proportion=40%
Po is the Null Hypothesis value or actual proportion of progressionof diabetic subjects to DR within 15 years=53% [The WisconsinEpidemiologic Study of diabetic retinopathy, 1984].
(p1-p0) is the difference between proportions=0.13
Z 1-β is the desired power of study=90% (1.28)
Z 1-α/2 is the desired level of significance=5% (1.96)
Alternate hypothesis is two sided
Putting the values in the formula the required sample size in eachgroup is: 152
30% subject may loss to follow up in each group=46
So, total sample size in each group=152+46=198 ≈ 200 (takinground up value).
Patients who were primarily diagnosed in the diabetic clinic of theinstitute of Post-graduate Medical Education and Research, Kolkata,India, according to WHO guidelines and criteria of American DiabeticAssociation, and referred to the Retina Research Clinic of the RegionalInstitute of Ophthalmology, Kolkata, India, were recruited forcomprehensive ophthalmological examination during the period fromDecember 2004 to December 2005.
Inclusion criteria were (1) diagnosis of type 2 DM of ≤ 5 years; (2)Stable medication with oral hypoglycemic agents for the management
of diabetes before entry into the study and expected to remain duringthe study; (3) best-corrected visual acuity ≥ 6/9 in each eye with noDR; and (4) literate patients who had the ability to give informedwritten consent and could read the Snellen’s visual acuity chart.
The exclusion criteria were (1) presence of DR with or withoutdiabetic macular edema as determined by dilated fundoscopicexamination, spectral domain optical coherence tomography (SD-OCT), and digital fundus photography; (2) patients taking insulin orhistory of taking insulin; (3) concomitant conditions like branchretinal vein occlusion, Eales’ disease or presence of glaucoma in theeyes that could alter the normal occurrence of microvascularcomplication of the disease; (4) patients suffering from hypertension,coronary artery diseases or strong family history of coronary arterydiseases, peripheral vascular disease, chronic infection,thromboembolic events, urinary microalbumin>300 mg/dl were someof the conditions considered as exclusion criteria of this study.
Treatment protocolThe study subjects who were diagnosed by an experienced
retinologist to have no retinopathy at baseline were given standarddoses of the following: (i) vitamin B containing thiamin mononitrate10 mg, (ii) riboflavin 10 mg, (iii) nicotinamide 45 mg, (iv)pyridoxamine HCl 3 mg, (v) Ca panthenate 50 mg, (vi)cyanocobalomine 15mcg (Neurobionforte, MERK PHARMA); (vii)ascorbic acid 500 mg (Celin, Glaxosmithkline Pharmaceuticals ); andlastly,α-tocopherol 400 (Evion, MERK LTD India) along with requiredoral hypoglycemic agents. General physical health and ocularcondition were assessed at baseline and at a 12 months interval usingstandard clinical procedures for evaluating vision and ocularpathology, including, (i) best corrected visual acuity by Snellen’s VisualAcuity Chart, (ii) intraocular pressure by applanation tonometry, (iii)contrast sensitivity by Robin Contrast Sensitivity Chart, (iv) dilatedfundus examination by direct, indirect ophthalmoscopy and slit-lampbiomicroscopy with + 90D lens, and (v) central retinal thicknessmeasurement by spectral-domain optical coherence tomography(Spectralis, Heidelberg Engineering, Germany).
Efficacy and safety assessmentGeneral health of each subject was assessed during the course of the
study, including blood pressure, heart rate, body weight, HbA1creadings and urinary microalbumin/creatinine ratio. Subjects whoexhibited sensitivity to any of the orally administered vitamins werenoted and excluded from the efficacy assessments.
Laboratory investigationsDuly signed by the participants, written informed consent was taken
before the following investigations were carried out at the base-lineand at the end of 12 years of the follow-up study. First, the collection of15 ml of venous blood by venepuncture from all the recruited subjectswas done after theirs having undergone a fasting period of 12 hoursduration. From these, 10 ml blood samples were collected in aheparinized tube. From 10 ml heparinized blood sample, 8 ml wascollected in a 15 ml sterile centrifuge for peripheral bloodmononuclear cell (PBMC) isolation, and 2 ml samples werecentrifuged at 3000 revolutions per minute for 10 minutes at 4°C toseparate cellular components and plasma. Buffy coat was removed bycareful aspiration, and packed erythrocytes were then washed withcold phosphate buffered saline (pH-7.2) by maintaining 4°C
Citation: Mondal LK, Pramanik S, De S, Paine SK, Bhaduri G (2019) Modification of Biochemical Derangements and VEGF Secretion mayPrevent Diabetic Retinopathy (DR) . J Clin Exp Ophthalmol 10: 803.
Page 2 of 11
J Clin Exp Ophthalmol, an open access journalISSN: 2155-9570
Volume 10 • Issue 3 • 803
temperature for estimation of erythrocytes redox state. Plasma sampleswere collected in cryocube vials for assay of glucose. The remaining 5ml sample from the initial 15 ml sample was aliquoted in to two vials. 3ml in a clot vial to obtain serum for estimation of AGE, MDA andVEGF.2 ml sequestrenated whole blood was used for morphologicalstudy of red blood cells.
Measurement of erythrocyte pyridine coenzymesBuffy coat was removed from centrifuged blood by careful
aspiration, and packed erythrocytes were washed with cold phosphate-buffered saline (pH 7.2) at 4°C and 106 red blood corpuscle (RBC) cellswere pelleted in microcentrifuge tube (200 revolutions per minute for5 minutes ) for the estimation of coenzymes ( NAD+, NADH). Theconcentration of pyridine coenzymes and their ratio were determinedby using the kits of Bio Vision (Bio Vision Research Products,Mountain View, CA). Nicotinamide adenine dinucleotide positive andNADH concentrations in erythrocytes were measured by NAD cyclingenzyme mixture through an enzyme cycling reaction. Thedeterminations included both the oxidized and reduced form ofnucleotide. The absorbance of color product was read at 450 nm byBio-Rad multiplate reader (Model 680). Furthermore, NAD+: NADHratio was calculated as follows:��� ����� – ��������Measurement of peripheral blood mononuclear cell reactiveoxygen species
Mononuclear cells were obtained from 8 ml heparinized blood byusing Histopaque-1077 density gradient separating media (SigmaAldrich, St. Louis, MO, USA) for 40 minutes at 1300 rpm and 20°C.PBMCs were further subjected to centrifugation at 1500 rpm for 10minutes and washed with phosphate-buffered saline twice. Cells (5 ×10⁵ )were pelleted and resuspended in phosphate-buffered saline forthe estimation of ROS. Intracellular ROS generation in mononuclearcells was measured by ROS sensitive cell permeable dye 2’7’dihydrodichlorofluorescein diacetate (2’7’H2DCF-DA), which in the presenceof ROS was oxidized to highly fluorescent 2 ’7 ’-dichlorofluorescein(2 ’7 ’DCF) in the cell. Production of intracellular ROS is directlyproportional to the oxidation of 2’7’H2DCF-DA and thereby elevatescellular fluorescence level. 5 × 10⁵ number of pelleted cells werewashed twice with IX PBS (pH 7.2) by centrifuging at 4000 rpm for 5minutes and cells were resuspended in 500 µL of IX PBS (pH 7.2).Thereafter cells were incubated with 20 µm 2’7’H2DCF-DA for 30minutes at 37°C. finally the cells were washed again with IX PBS (pH7.2) and resuspended in 400 µL of IX PBS. The mononuclear cellsexhibiting increased fluorescence of oxidized DCF was measured byflow cytometry ( FACS caliber, Becton Dickinson, San Jose, CA)equipped with an argon ion laser (15 mW) tuned to 488 nm. Thefluorescence of DCF was collected in FL1 channel, equipped with a530/30 nm band pass filter. Fluorescence was measured in the longmode using cell quest prosoftware (BD Bioscience, San Jose, CA) andexpressed as geometrical mean fluorescence channel (GMFC). Cellswere gated on the basis of their characteristic morphology i.e. forwardscatter and side scatter of monocytes and lymphocytes. Acquisitionswere performed on 10000 gated events; while data analysis was carriedout with cell questpro software (BD Bioscience).
Measurement of MDAThe quantitative analysis of serum malondialdehyde (MDA) free of
interference from sialic acid was used as described by Satoh [12].Lipoproteins in serum were precipitated by adding 20% trichloroaceticacid and 8.1% dodecyl sulphate. Thereafter, 0.8% aqueous solution ofthiobarbituric acid was added to this precipitate mixed well and finallywas heated at 95°C for 1 hour for coupling of lipid peroxide withthiobarbituric acid reagent. The resulting chromogen was extractedfrom the precipitate by adding a mixture of n-butanol and pyridine(15:1). The organic mixture was separated by centrifugation and theintensity of the organic layer was measured spectrophotometrically(Halo DB-20, Dynamica, Salzburg-Mayrwise, Austria) by using a 530nm filter against water blank. The concentration of MDA in serumsample was determined from a linear standard curve established by 1to 8 nm of 1,1,3,3 tetra methoxy propane.
Measurement of advanced glycation end-products (AGEs)from serum
Serum level of total advanced glycation end products was measuredby enzyme-linked immunosorbent assay by using The Cell Biolabs kit(Cell Biolabs, San Diego, CA). AGE protein adducts present in thesample were probed with an ant-AGE polyclonal antibody, followed byHRP conjugated antibody. The AGE-protein adduct content in thesample was determined by comparison with a standard curve preparedfrom AGE-bovine serum albumin (BSA) standards ranging from 0.25to 5 µg/ml. The absorbance of the final color product was read at 450nm as the primary wavelength using a Bio Rad multiplate reader(Model 680, Bio Rad, Laboratories, Hercules, CA) against the reducedBSA standard as the absorbance blank. The AGE-BSA provided in thekit was prepared by reacting BSA with glycolaldehyde, followed byextensive dialysis and column purification.
Measurement of erythrocytes 2, 3-DPG contentThe erythrocytes 2, 3-DPG content was determined by quantitative
sandwich enzyme immunoassay technique using the Cusabio Human2, 3-DPG ELISA kit (CSB-E09861h, CUSABIO, China). At firsthemolysate of erythrocytes was prepared as per method described byErlandsen et al. [13]. Then hemolysate was used in the assay. Briefly,Standards and samples were pipetted into the 2, 3-DPG specificantibody coated wells. Then any 2, 3-DPG present in the sample orstandard was bound by the immobilized antibody. After removing anyunbound substances, a biotin-conjugated antibody specific for 2, 3-DPG was added to the wells. After washing, avidin conjugatedHorseradish Peroxidase (HRP) was added to the wells. Following awash to remove any unbound avidin-enzyme reagent, a substratesolution was added to the wells and color developed in proportion tothe amount of 2, 3-DPG bound in the initial step. The colordevelopment was stopped by addition of stop solution and the intensityof the color was measured colorimetrically by using 450 nm filter in anELISA plate reader (BIO-Rad, Model 680).
Erythrocyte osmotic fragility studyOsmotic Fragility of RBC was tested as per modified method of
Parpart et al. [14]. In brief, 50 µl of heparinized blood sample waspipetted in to a set of tubes containing 5 ml of each 0.1, 0.3, 0.5, 0.7, 0.9gm/l of NaCl (pH 7.4) and there after carefully mixed and incubatedfor 30 minutes at room temperature (26°C-28°C). Then the test tubeswere centrifuged at 1500 × g for 5 minutes. The supernatant was
Citation: Mondal LK, Pramanik S, De S, Paine SK, Bhaduri G (2019) Modification of Biochemical Derangements and VEGF Secretion mayPrevent Diabetic Retinopathy (DR) . J Clin Exp Ophthalmol 10: 803.
Page 3 of 11
J Clin Exp Ophthalmol, an open access journalISSN: 2155-9570
Volume 10 • Issue 3 • 803
transferred in to a glass cuvette and the absorbance was readspectrophotometrically at a wave length 415 nm. The percentage ofhaemolysis for each concentration of NaCl was calculated using theformula below-�����������/ �100 ������� � 100 = ������� �� ℎ��������
Where, the optical density, D equals the log of the reciprocal oftransmission value obtained in the colorimeter, D 100 percent is thecalibration solution, D experiment, is that for the supernatant fluid ofany particular blood-salt solution. The degree of hemolysis wascalculated by comparing with 0.1% NaCl which represent 100% lysis.
Scanning electron microscopy of Red Blood Cells (RBCs)Red cells were prepared for SEM examination by fixing the
sequestrenated whole blood in 2.5% buffered glutraldehyde preparedin 2 molar cacodylate buffers for one and half hour for roomtemperature for primary fixation. Red blood cells were separated fromwhite blood cells by centrifugation. After primary fixation, the cellswere washed with 1 molar cacodylate rinsing buffer three times for 15minutes at room temperature. After washing, the samples were fixed in1% osmium tetraoxide for one hour for secondary fixation. The post-fixed cells were washed in 0.1 molar cacodylate rinsing buffer and indistilled water three times for 15 minutes at room temperature.
After secondary fixation, the cells were dehydrated in graded seriesof ethanol. The samples were vaccum dried in dessicator for overnight.After drying, samples were mounted on aluminium stubs with doubleadhesive carbon tapes and coated with gold for 20 seconds in a goldion sputter to render their surfaces conducting. Red cells werevisualized and photographed in a Scanning Electron Microscope(Product No: EVOIS-20-67, EVO 18, EVO/18, Carlzeiss, Germany).Microphotographs were taken at direct magnification in 5 KX.
Measurement of surface roughness of RBCThe surface roughness of Scanning electron microscopic image of
an RBC was performed by using ‘ Image J ’ software (version 1.46,Rasband, NIH). First, a randomly selected scanning electronmicroscopic image of an RBC from a film was converted to 32-bit.Then 3D surface presentation and gradient analysis of the 3D surfacewas done by using ‘Plugins’. The values of RA (roughness average), RQ(root mean square roughness), Rsk ( skewness of the roughnessprofile) and Rku ( kurtosis of the roughness profile) were considered asthe determinant of the surface roughness for the present study.
At baseline red cells were prepared from 48 blood samples of thecontrol group and 47 blood samples of the study subjects. Sixindividuals of the study group were lost to follow-up. So ultimately, redblood cells of 48 control population and 41 study subjects were againanalyzed by the same procedures of Scanning Electron Microscopicstudy at the end point of 12 years follow-up and relevant data wereentered into statistical evaluation.
Measurement of serum Vascular Endothelial Growth Factor(VEGF)
Serum VEGF was assayed by ELISA using commercial kits of RayBiotech (Ray Biotech, Norcross, USA). In this assay, an antibodyspecific for human VEGF was coated on a well plate. A series ofstandards ranging from 8.23 pg/ml to 6000 pg/ml and samples (serumsamples were two fold diluted with assay diluents) were added into the
wells. VEGF protein present in the sample was bound to the wells bythe immobilized antibody. The wells were washed and biotinylatedantihuman VEGF antibody was added. After buffer wash HRP-conjugated streptavidin was pipette into the wells. Further, the wellswere subjected to wash and TMB substrate solution was added into thewells and was placed in incubation at room temperature for 30minutes. Intensity of the final color product was proportional to theconcentration of VEGF protein present into the samples and theabsorbance of the color product was measured colorimetrically byusing 450 nm filters in the ELISA plate reader (Bio Rad, Model 680).The concentration of VEGF in the samples was determined by astandard curve and the assay detected less than 10 pg/ml of VEGFfrom the sample.s
The procedures of estimation of VEGF and surrogate markers ofoxidative stress, lipid peroxidation and advanced glycation endproduct formation had been also previously described in our previousworks [15-17].
Measurement of plasma glucosePlasma glucose levels were measured by glucose oxidase and
peroxidase method. The absorbance was read at 520 nm in aspectrophotometer Halo DB-20; Dynamica).
Measurement of glycosylated hemoglobinGlycosylated hemoglobin was measured by direct enzymatic assay,
using the kit of Diazyme laboratories (Poway, CA). The assay involvedextensive protease digestion of lysed whole blood samples with Bacillusspecies protease. The concentration of glycosylated hemoglobin wasexpressed as hemoglobin A1 c% and measured by use of a calibrationcurve in which the calibrators have values for each level of hemoglobinA1c%. The assay has a linear range from 4.0% to 16.0% and wasperformed in biochemistry autoanalyser (Hitachi 980).
Repeatability and durability of each biochemistry analysis weremaintained by matching the values of control with repeat analysis onthe same day and over a period of 20 days.
We have maintained internal quality control by calibrating themachines regularly, running the samples in duplicate and comparingthe values between the study and control groups. All the biochemicalprocedures was done by one of the investigators to reduce the interperson human error.
Results
Statistical analysisData were expressed as mean ± SE (standard error of means).
Normally distributed data were evaluated by paired ‘ t ’ test andunpaired‘t’ test respectively. Not normally distributed paired data wereevaluated by Wilcoxon signed rank test and unpaired data wereevaluated by Mann-Whitney U test. Spearman correlation wasperformed to find out the correlation between two not-normallydistributed parameters. Statistical analysis for gender distributions wasevaluated by chi-square test using Graph pad prism software (Version6, Sandiego, CA, USA). Kaplan-Meier survival analysis was performedto determine the probability of survival from DR among diabeticindividuals of group-A and B respectively. The rate of the study groupswas further compared with Log-rank test (Mantel-Cox) by using IBM
Citation: Mondal LK, Pramanik S, De S, Paine SK, Bhaduri G (2019) Modification of Biochemical Derangements and VEGF Secretion mayPrevent Diabetic Retinopathy (DR) . J Clin Exp Ophthalmol 10: 803.
Page 4 of 11
J Clin Exp Ophthalmol, an open access journalISSN: 2155-9570
Volume 10 • Issue 3 • 803
SPSS software (Version 25, SPSS, Inc, and Chicago, USA). Values ofp<0.05 were considered to be minimum level of significance.
Baseline clinical characteristics of study subjects and controls showno significant differences in age, gender, duration of diabetes, bodymass index, blood pressure, plasma glucose, glycosylated hemoglobinand plasma lipid levels (Table 1).
Parameters Particulars
Group-A
N=200
Group-B
N=200 p-value
Age(years) 53.55 ± 0.79 5.48 ± 0.98 0.402
Gender
Male 110 (55%) 116 (58%)
0.545Female 90 (45%) 84 (42%)
BMI (Kg/m2) 24.40 ± 0.34 23.57 ± 0.48 0.161
BP (mm Hg)
Systolic 127.2 ± 0.98 126.4 ± 0.90 0.529
Diastolic 80.58 ± 0.70 81.16 ± 0.69 0.569
BMI: Body Mass Index; BP: Blood Pressure
Table 1: Baseline demographic and physiological parameters of thestudy groups.
Comparison of group-A and group-B in the present study showedno statistically significant differences for baseline biochemicalparameters like FPG, PPG, HbA1c, ROS, MDA, AGE, NAD+, NADH,NAD+/NADH, 2,3-DPG and VEGF. Comparison of same biochemicalparameters of group–A at baseline with group-A after 6 and 12 yearsalso showed no statistically significant differences. However, thebiochemical parameters like ROS, MDA, AGE, NADH and VEGF werefound to be significantly higher in group-B after 6 and 12 years incomparison to their baseline levels. The study also showed lower levelsof NAD+, NAD+/NADH and 2, 3-DPG in group-B after 6 and 12 yearsthan their baseline levels. Regarding glycemic parameters like FPG,PPG and HbA1c, no statistically significant differences were observedbetween group-A and group-B after 6 and 12 years. However, group-Bafter 6 and 12 years showed higher levels of ROS, MDA, AGE, NADHand VEGF and lower levels of NAD+, NAD+/NADH and 2,3-DPG incomparison to group-A (Tables 2-4). There was a trend of incrementalchanges of biochemical parameters (ROS, MDA, AGE and VEGF )observed over time.
Parameters Particulars
Group-A
(Baseline)
N=200
Group-B
(Baseline)
N=200
Group A vs.Group B(Baseline)
p-value
Group-A
(After 12years)
N=187
Group-B
(After 12years)
N=200
Group Avs. GroupB (after12 years)
p-value
Group-Abaselinevs. Group-A (after 12years) p-value
Group-Bbaselinevs. Group-B (after 12years)
Plasma glucose (mg/dl)
FPG 150.7 ± 1.86 154.6 ± 2.21 0.213 149.5 ± 1.77 153.3 ± 3.01 0.179 0.628 0.842
PPG 191 ± 5.03 194.5 ± 5.22 0.511 189.6 ± 4.82 204 ± 10.94 0.128 0.788 0.332
HbA1c % - 7.86 ± 0.14 7.56 ± 0.14 0.15 7.98 ± 0.15 7.71 ± 0.24 0.359 0.385 0.452
ROS (geomean of DCF/5×105 cells) - 96.31 ± 0.90 96.18 ± 0.66 0.812 98.80 ± 2.33 112.6 ± 1.63 0.0002 0.642 ˂0.0001
MDA (nmol/ml) - 2.69 ± 0.03 2.63 ± 0.03 0.497 2.76 ± 0.13 3.24 ± 0.08 0.038 0.769 ˂0.0001
AGE (µg/ml) - 2.55 ± 0.10 2.65 ± 0.05 0.38 2.67 ± 0.13 3.59 ± 0.23 0.002 0.791 ˂0.0001
NAD+(pmol/106 RBC) - 47.19 ± 0.77 47.71 ± 01.49 0.322 45.29 ± 1.03 39.92 ± 1.26 0.003 0.231 0.0007
NADH (pmol/106 RBC) - 4.42 ± 0.16 3.95 ± 0.25 0.225 4.52 ± 0.10 5.56 ± 0.31 0.003 0.571 0.003
NAD+/NADH - 10.88 ± 0.44 12.98 ± 0.92 0.152 10.5 ± 0.22 7.64 ± 0.52 ˂0.0001 0.133 ˂0.0001
2,3-DPG (µmol/g Hb - 17.17 ± 0.30 17.48 ± 0.54 0.615 16.20 ± 0.72 13.42 ± 0.68 0.012 0.131 0.0002
VEGF (pg/ml) - 92.33 ± 1.23 93.07 ± 1.75 0.722 94.18 ± 2.90 131.7 ± 4.05 <0.0001 0.804 ˂0.0001
Table 2: Biochemical parameters of Group-A and Group-B at the time of diagnosis of T2DM and 12 years after treatment of Group-A (with anti-hyperglycemic drugs, B-vitamins, ascorbic acid and α-tocopherol) and group-B (only with anti-hyperglycemic drugs).
Parameters Particulars
Group-A
(Baseline)
N=200
Group-B
(Baseline)
N=200
Group A vs.Group B(Baseline)
p-value
Group-A
(After 12years)
N=187
Group-B
(After 12years)
N=200
Group A vs.
Group B (after 12years)
p-value
Group-Abaselinevs.Group-A(after 12years)
p-value
Group-Bbaselinevs.Group-B(after 12years)
p-value
Citation: Mondal LK, Pramanik S, De S, Paine SK, Bhaduri G (2019) Modification of Biochemical Derangements and VEGF Secretion mayPrevent Diabetic Retinopathy (DR) . J Clin Exp Ophthalmol 10: 803.
Page 5 of 11
J Clin Exp Ophthalmol, an open access journalISSN: 2155-9570
Volume 10 • Issue 3 • 803
RQ - 35.95 ± 1.69 37.04 ± 1.70 0.655 36.90 ± 1.61 44.17 ± 1.70 0.006 0.355 0.01
RA - 25.42 ± 1.32 25.73 ± 1.34 0.86 26.10 ± 1.32 31.22 ± 1.58 0.021 0.219 0.018
OsmoticFragility Starting 5.44 ± 0.09 5.37 ± 0.08 0.586 5.60 ± 0.07 6.07 ± 0.07 0.0002 0.189 <0.0001
(conc. Of NaCl) Complete 4.44 ± 0.11 4.41 ± 0.15 0.856 4.69 ± 0.14 5.12 ± 0.14 0.047 0.243 0.003
CMT (µm) 244.4 ± 1.56 246 ± 1.48 0.297 250.1 ± 4.41 255.6 ± 7.91 0.278 0.812 0.131
VA (log MAR) 0.22 ± 0.01 0.23 ± 0.01 0.669 0.245 ± 0.02 0.34 ± 0.03 0.04 0.319 0.004
Table 3: Red blood corpuscles surface roughness, osmotic fragility, retinal structural and functional parameters of Group-A and Group-B at thetime of diagnosis of T2DM and 12 years after treatment of Group-A (with anti-hyperglycemic drugs, B-vitamins, ascorbic acid and α-tocopherol)and group-B (only with anti-hyperglycemic drugs).
The Surrogate markers of oxidative stress (ROS and MDA),advanced glycation end product (AGE) formation and vascularendothelial growth factor (VEGF) were found to be further increased
towards the development and severity of the disease. However, theratio of oxidized and reduced co-factors (NAD+/NADH) and red cell2, 3-DPG activity were found to be decreased with the disease severity.
Parameters Particulars
Group-A
(Baseline)
N=200
Group-B
(Baseline)
N=200
Group A vs.Group B(Baseline)
p-value
Group-A
(After 12years)
N=187
Group-B
(After 12years)
N=200
Group Avs.
Group B(after 12years)
p-value
Group-Abaselinevs. Group-A (after 12years) p-value
Group-Bbaselinevs.Group-B(after 12years)
p-value
Plasma glucose (mg/dl)
FPG 150.7 ± 1.86 154.6 ± 2.21 0.213 149.5 ± 1.77 153.3 ± 3.01 0.179 0.628 0.842
PPG 191 ± 5.03 194.5 ± 5.22 0.511 189.6 ± 4.82 204 ± 10.94 0.128 0.788 0.332
HbA1c % - 7.86 ± 0.14 7.56 ± 0.14 0.15 7.98 ± 0.15 7.71 ± 0.24 0.359 0.385 0.452
PBMC ROS (geomean ofDCF/5 × 105 cells) - 96.31 ± 0.90 96.18 ± 0.66 0.812 98.80 ± 1.69 112.6 ± 1.50 0.0002 0.642 ˂0.0001
MDA (nmol/ml) - 2.69 ± 0.03 2.63 ± 0.03 0.497 2.76 ± 0.21 3.24 ± 0.08 0.038 0.769 ˂0.0001
AGE (µg/ml) - 2.55 ± 0.07 2.65 ± 0.05 0.381 2.67 ± 0.13 3.59 ± 0.25 0.002 0.791 ˂0.0001
NAD+(pmol/106 RBC) - 47.19 ± 1.09 47.71 ± 0.86 0.322 45.29 ± 0.92 39.92 ± 0.75 0.003 0.231 0.0007
NADH (pmol/106 RBC) - 4.42 ± 0.16 3.95 ± 0.16 0.225 4.52 ± 0.10 5.56 ± 0.22 0.003 0.571 0.0002
NAD+/NADH - 10.85 ± 0.48 12.72 ± 0.72 0.152 10.5 ± 0.38 7.64 ± 0.66 ˂0.0001 0.133 ˂0.0001
2,3-DPG (µmol/g Hb) - 17.17 ± 0.30 17.48 ± 0.54 0.615 16.20 ± 0.77 13.42 ± 0.53 0.012 0.131 0.0002
VEGF (pg/ml) - 92.33 ± 1.23 93.07 ± 2.16 0.722 94.18 ± 1.37 131.7 ± 3.09 <0.0001 0.804 ˂0.0001
Table 4: Biochemical parameters of Group-A and Group-B at the time of diagnosis of T2DM and 12 years after treatment of Group-A (with anti-hyperglycemic drugs, B-vitamins, ascorbic acid and α-tocopherol) and group-B (only with anti-hyperglycemic drugs).
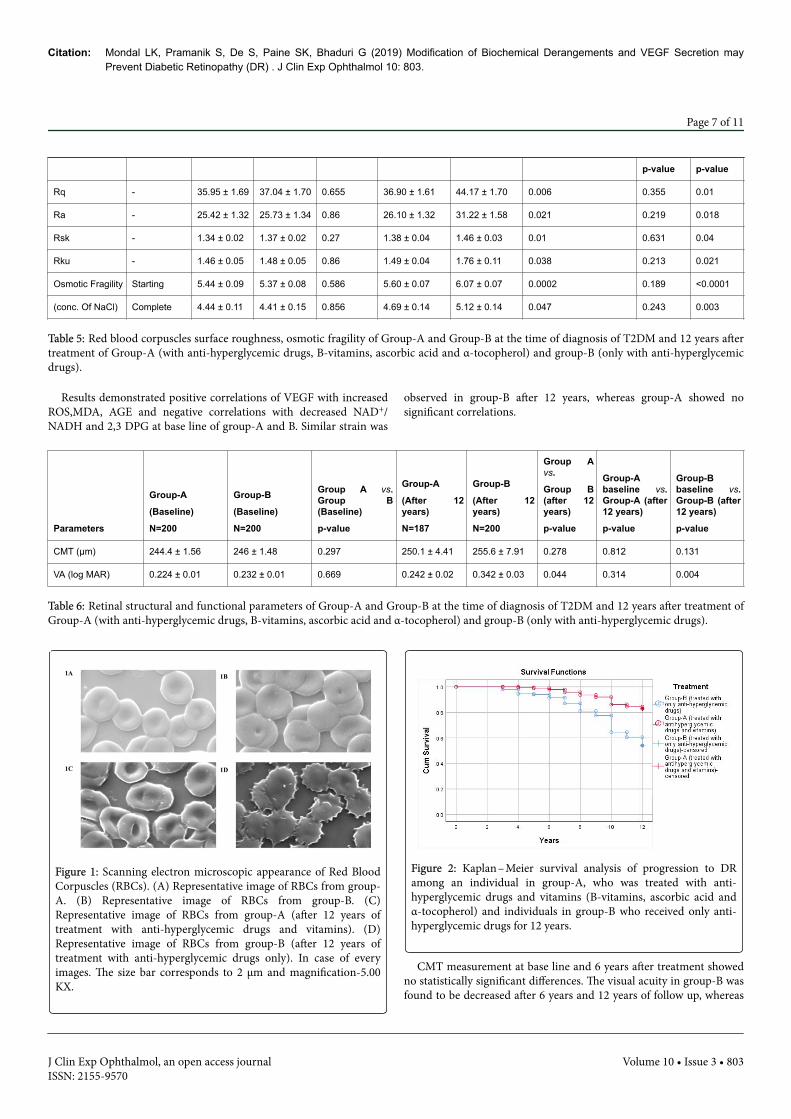
Comparison of group-A and group-B in the present study showedno statistically significant differences for baseline parameters of surfaceroughness and osmotic fragility, whereas such parameters were foundto be increased in group-B (non-supplemented group) compared to
group-A (supplemented group) (Table 5). Study also demonstratedmore number of dysmorphic red cells in the blood sample of group-B(Figures 1 and 2).
Parameters Particulars
Group-A
(Baseline)
N=41
Group-B
(Baseline)
N=48
Group A vs.Group B(Baseline)
p-value
Group-A
(After 12years)
N=41
Group-B
(After 12years)
N=48
Group A vs.
Group B (after 12years)
p-value
Group-Abaselinevs.Group-A(after 12years)
Group-Bbaselinevs.Group-B(after 12years)
Citation: Mondal LK, Pramanik S, De S, Paine SK, Bhaduri G (2019) Modification of Biochemical Derangements and VEGF Secretion mayPrevent Diabetic Retinopathy (DR) . J Clin Exp Ophthalmol 10: 803.
Page 6 of 11
J Clin Exp Ophthalmol, an open access journalISSN: 2155-9570
Volume 10 • Issue 3 • 803
p-value p-value
Rq - 35.95 ± 1.69 37.04 ± 1.70 0.655 36.90 ± 1.61 44.17 ± 1.70 0.006 0.355 0.01
Ra - 25.42 ± 1.32 25.73 ± 1.34 0.86 26.10 ± 1.32 31.22 ± 1.58 0.021 0.219 0.018
Rsk - 1.34 ± 0.02 1.37 ± 0.02 0.27 1.38 ± 0.04 1.46 ± 0.03 0.01 0.631 0.04
Rku - 1.46 ± 0.05 1.48 ± 0.05 0.86 1.49 ± 0.04 1.76 ± 0.11 0.038 0.213 0.021
Osmotic Fragility Starting 5.44 ± 0.09 5.37 ± 0.08 0.586 5.60 ± 0.07 6.07 ± 0.07 0.0002 0.189 <0.0001
(conc. Of NaCl) Complete 4.44 ± 0.11 4.41 ± 0.15 0.856 4.69 ± 0.14 5.12 ± 0.14 0.047 0.243 0.003
Table 5: Red blood corpuscles surface roughness, osmotic fragility of Group-A and Group-B at the time of diagnosis of T2DM and 12 years aftertreatment of Group-A (with anti-hyperglycemic drugs, B-vitamins, ascorbic acid and α-tocopherol) and group-B (only with anti-hyperglycemicdrugs).
Results demonstrated positive correlations of VEGF with increasedROS,MDA, AGE and negative correlations with decreased NAD+/NADH and 2,3 DPG at base line of group-A and B. Similar strain was
observed in group-B after 12 years, whereas group-A showed nosignificant correlations.
Parameters
Group-A
(Baseline)
N=200
Group-B
(Baseline)
N=200
Group A vs.Group B(Baseline)
p-value
Group-A
(After 12years)
N=187
Group-B
(After 12years)
N=200
Group Avs.
Group B(after 12years)
p-value
Group-Abaseline vs.Group-A (after12 years)
p-value
Group-Bbaseline vs.Group-B (after12 years)
p-value
CMT (µm) 244.4 ± 1.56 246 ± 1.48 0.297 250.1 ± 4.41 255.6 ± 7.91 0.278 0.812 0.131
VA (log MAR) 0.224 ± 0.01 0.232 ± 0.01 0.669 0.242 ± 0.02 0.342 ± 0.03 0.044 0.314 0.004
Table 6: Retinal structural and functional parameters of Group-A and Group-B at the time of diagnosis of T2DM and 12 years after treatment ofGroup-A (with anti-hyperglycemic drugs, B-vitamins, ascorbic acid and α-tocopherol) and group-B (only with anti-hyperglycemic drugs).
Figure 1: Scanning electron microscopic appearance of Red BloodCorpuscles (RBCs). (A) Representative image of RBCs from group-A. (B) Representative image of RBCs from group-B. (C)Representative image of RBCs from group-A (after 12 years oftreatment with anti-hyperglycemic drugs and vitamins). (D)Representative image of RBCs from group-B (after 12 years oftreatment with anti-hyperglycemic drugs only). In case of everyimages. The size bar corresponds to 2 µm and magnification-5.00KX.
Figure 2: Kaplan–Meier survival analysis of progression to DRamong an individual in group-A, who was treated with anti-hyperglycemic drugs and vitamins (B-vitamins, ascorbic acid andα-tocopherol) and individuals in group-B who received only anti-hyperglycemic drugs for 12 years.
CMT measurement at base line and 6 years after treatment showedno statistically significant differences. The visual acuity in group-B wasfound to be decreased after 6 years and 12 years of follow up, whereas
Citation: Mondal LK, Pramanik S, De S, Paine SK, Bhaduri G (2019) Modification of Biochemical Derangements and VEGF Secretion mayPrevent Diabetic Retinopathy (DR) . J Clin Exp Ophthalmol 10: 803.
Page 7 of 11
J Clin Exp Ophthalmol, an open access journalISSN: 2155-9570
Volume 10 • Issue 3 • 803
group-A demonstrated no significant alteration in VA after 6 and 12years of follow up (Tables 6-9).
Parameters
Baseline VEGF level (pg/ml) of Group-A (N=200)
VEGF level (pg/ml) of Group-A
after 12 years (N=187)
Correlation Coefficient (r) Level of Significance (p) Correlation Coefficient (r) Level of Significance (p)
PBMC ROS (geomean of DCF/5 × 105 cells) 0.66 <0.0001 0.2 0.29
MDA (nmol/ml) 0.62 0.001 0.18 0.33
AGE (µg/ml) 0.49 0.008 0.24 0.22
NAD+/NADH -0.59 0.004 -0.24 0.24
2,3-DPG (µmol/g Hb) -0.52 0.006 -0.26 0.19
Table 7: Correlation of vascular endothelial growth factor with different biochemical parameters at base line and after 12 years of treatment (withanti-hyperglycemic drugs, B-vitamins, ascorbic acid and α-tocopherol) in Group-A.
Parameters
Baseline VEGF level (pg/ml) of Group-B (N=200) VEGF level (pg/ml) of Group-B after 12 years (N=200)
Correlation Coefficient (r) Level of Significance (p) Correlation Coefficient (r) Level of Significance (p)
PBMC ROS (geomean of DCF/5 × 105 cells) 0.79 <0.0001 0.67 <0.0001
MDA (nmol/ml) 0.47 0.008 0.7 <0.0001
AGE (µg/ml) 0.59 0.001 0.6 0.001
NAD+/NADH -0.45 0.009 -0.51 0.006
2,3-DPG (µmol/g Hb) -0.64 0.001 -0.5 0.009
Table 8: Correlation of vascular endothelial growth factor with different biochemical parameters at base line and after 12 years of treatment (withonly anti-hyperglycemic drugs) in Group-B.
Parameters
Very mild NPDR (N=32)
Supplemented group
Mild to Moderate NPDR [N={53(mildNPDR)+ 39 (moderate NPDR)}]
Non-supplemented group
Level of significance
(p value)
PBMC ROS (geomean of DCF/5 × 105 cells) 101.7 ± 1.01 116.40 ± 2.31 0.004
MDA (nmol/ml) 2.99 ± 0.12 3.51 ± 0.14 0.034
AGE (µg/ml) 2.81 ± 0.15 3.79 ± 0.26 0.021
NAD+/NADH 9.86 ± 0.39 7.02 ± 0.29 0.0002
2,3-DPG (µmol/g Hb) 15.89 ± 0.76 12.12 ± 0.91 0.031
VEGF (pg/ml) 104.18 ±2.42 134.9 ± 3.59 <0.0001
Table 9: Biochemical scenario behind the development of the disease.
Thirty-two (17.11%) among 187 subjects of the cohort (Group A)developed very mild microangiopathy, whereas 13 patients lost thefollow-up due to migration and allergic reaction to the medication.Among 200 diabetic control subjects (Group B) who did not receivethe above-mentioned vitamins supplementation, 92 (46%) patientsdeveloped mild-to-moderate (53 subjects with mild NPDR and 39subjects with moderate NPDR) non proliferative DR within thisfollow-up period of 12 years. Kaplan-Meier survival analysisdemonstrated long term vitamin supplementation more protecteddiabetic subjects (82.89%) from the development of DR, whereas non
supplemented group were less protective (54%) against thedevelopment of DR.
DiscussionIndia ranks second in the prevalence of diabetes mellitus (DM) and
the number of people with DM is expected to increase from current 67million to 79.4 million by 2030 [18]. With the reported prevalence ofdiabetic retinopathy in India ranging from 17.6% to 28.2%, thenumber of diabetics with diabetic retinopathy (DR) will increase to
Citation: Mondal LK, Pramanik S, De S, Paine SK, Bhaduri G (2019) Modification of Biochemical Derangements and VEGF Secretion mayPrevent Diabetic Retinopathy (DR) . J Clin Exp Ophthalmol 10: 803.
Page 8 of 11
J Clin Exp Ophthalmol, an open access journalISSN: 2155-9570
Volume 10 • Issue 3 • 803
22.4 million in another two decades [19]. This will result in a heavyburden on the health care system because of high cost of anti-VEGFtherapy and inadequacy of infrastructure of laser photocoagulation tofight against DR-induced visual impairment. The crucial factor in thedevelopment of DR, that is, biochemical derangements resulting inincrease in angiogenic VEGF secretion, if modulated, would havemeant the DR-related visual loss could be prevented in our countrywhere infrastructural deficiency and financial constrain create a deepconcern.
Although two landmarks studies have demonstrated the beneficialeffects of the tight control of hyperglycemia leading to the delay, oreven, the prevention of the onset of development of diabeticretinopathy [2,20], patients with good glucose control still develop DR.Further studies suggested that even intensive control of blood sugar(HbA1c to 6.5% or less) did not show palliative effect against theinitiation of DR [21,22]. Additionally, a few apparent findings drawour attention towards some patients with poor control of their diseasehaving no DR even over long periods of time, while others havedeveloped DR in a short period of time despite good disease control.However, the fact that improving glycemic control reduces the risk ofonset and progression of DR, has evidence that shows that there is noglycemic threshold as reflected in glycosylated hemoglobin that istotally palliative against the risk of retinopathy [23]. Our recent studyconcluded that differential expression of hyperglycemia-inducedbiochemical derangements dictate the extent of up regulation of VEGFsecretion leading to initiation of DR [24]. In brief, the biochemicalanomalies of enormous amount of intracellular glucose in retinaltissues, which are insulin independent for intracellular transport ofglucose, flow in various ways, as follows –
• Gradually faster anaerobic glycolysis→altered lactate/pyruvate ratioand NAD/NADH ratio→ reductive stress in cellular level→ deficiencyof NAD→inhibition of glycolysis and citric acid cycle;x
• increased generation of lactate→lowering of cellular pH →reducedaction glutamate transporter from synaptic space of retinal neurons→ glutamate toxicity → increased activation of NMDA receptors →increased concentration of intracellular Ca++→increased activationof phopholipase enzymes→ increased membrane lipid peroxidation→increased malondiadehyde (MDA) and advanced lipoxidation endproducts→ structural and functional alteration of red blood cells anddiminished activity of G6PD→reduced function of deformed, roughand rigid red blood cells → localized tissue hypoxia → increasedsecretion of VEGF;
• Unutilized huge intracellular glucose → increased nonenzymaticglycation → increased advanced glycation end products (AGEs)formation→AGE + receptor of AGE (RAGE) interaction→activationof NADPH oxidase → increased production of reactive oxygenspecies(ROS) in pericytes and endothelial cells → oxidativestress →upregulation of NF-kB→upregulation of VEGF.
Previous studies of ours demonstrated the role of hypoxia-inducedanaerobic glycolysis in differential expression of VEGF to beresponsible for initiation of DR [25]. Surprisingly, it now becomesclearly obvious that advancement of anti-VEGF therapy, which is beingused as a strong weapon to fight against DR-induced vision loss,produces little or no discernible effect in a significant portion ofdiabetic patients with diabetic macular edema. This findingnecessitates the importance of finding other sources of tissue hypoxia.Considering the contradictory results of different experimental studiesrelated to the pathogenesis of DR [26,27], we were led to propose thatalterations in structure and function of red blood cell (RBC) produce
hypoxia at the retinal capillary beds of diabetic patients and evokeearliest microvascular dysfunction. The red blood cell must be able tosqueeze through the tight spots in the microcirculation during itsnumerous passages around the capillary beds of retina. Under thebiochemical background of increased lipid peroxidation, advancedglycation of end product formation and oxidative stress induction,RBCs lose their plasticity, fluidity and oxygen carrying capacityresulting in localized tissue hypoxia at retinal capillary beds.
In this unblended trial, 187 among 400 patients of diagnosed type 2DM had been treated since their diagnosis and commencement oftreatment in 2004, with anti-hyperglycemic medication along with B-vitamins, Vitamin-C and Vitamin-E. Conventional control ofhyperglycemia with average glycosylated hemoglobin (HbA1c)between 7 – 7.8% did not experience any significant visual disturbanceexcept age-related correction of refractive errors and did not show anysymptom of diabetic retinopathy on dilated fundoscopic examination,digital fundus photography, fluorescein angiography and ocularcomprehensive tomography except 32 (17.11%) among this group ofpatients, languishing for a similar duration of the disease and glycemicstatus, developed mild microangiopathy characterized by presence ofmicro aneurysms in the posterior pole of retina. Remarkably, asimilarly affected, 200 patients who maintained almost similarglycemic status without intake of vitamins supplementationthroughout this yearly follow-up period of 12 years, were seen to havedeveloped mild to moderate NPDR in 92 (46%) patients.
Measurements of biochemical parameters of the postulateddetrimental pathways in 200 diabetic subjects who had not receivedregular vitamins B,C and E, had demonstrated significantly higherlevels of lipid peroxidation, advanced glycation end productsformation, oxidative stress induction and VEGF secretion, comparedto 187 patients who were supplemented with these vitamins. Thissupplemented group-A did not show positive correlation of VEGFlevel with ROS, AGEs, MDA, NAD+/NADH and 2,3,DPG after 12years of treatment with the above-mentioned vitamins. The implicatedbiochemical mediators are considered to contribute to death ofneurovascular cells of retina leading to formation of a cellularcapillaries and subsequent tissue hypoxia. Here, the dysfunction ofRBCs, the famed cells for their finest ability to squeeze through sometight spots in the microcirculation around the body, could not provideoxygen to the ischemic retina owing to loss of their fluidity andflexibility. Under the systemic environment of non-enzymaticglycation, lipid peroxidation, oxidative stress and inflammation,structural alterations to the lipid bilayer, the actin-spectrin cortex andintegral proteins of RBC membrane deform these cells in shape andsize and, consequently, these cells become nonfunctional andfragmented. So the RBCs are believed to play an important role forgeneration of hypoxia during the development of DR.
According to the projections of our recent study, a posteriori to thediagnosis of diabetes mellitus, smooth and uninterrupted running ofglycolysis and citric acid cycle, prevention of lipid peroxidation,advanced glycation end product formation and free radical productionmay ameliorate the micro vascular complications of this disease.
Systemic administration of riboflavin and nicotinamide assure thesupply of oxidized cofactors in the body, while pyridoxamine preventsnon-enzymatic glycation, and thiamine assists oxidativedecarboxylation of pyruvate to acetyl-CoA within mitochondria bypyruvate dehydrogenase enzyme complex; and thiamine also acts as aco-enzyme of transketolase which is necessary to oxidize glucosecompletely to CO2 via the pentose phosphate pathway. Thus, thiamine
Citation: Mondal LK, Pramanik S, De S, Paine SK, Bhaduri G (2019) Modification of Biochemical Derangements and VEGF Secretion mayPrevent Diabetic Retinopathy (DR) . J Clin Exp Ophthalmol 10: 803.
Page 9 of 11
J Clin Exp Ophthalmol, an open access journalISSN: 2155-9570
Volume 10 • Issue 3 • 803
diphosphate eliminates the inhibition of pyruvate metabolism thatattenuates lethal effects of lactic acidosis. Experimental animal studyhas shown that benfotiamine, a derivative of thiamine (vitamin B1)blocks the major pathways of hyperglycemic damage and preventsexperimental diabetic retinopathy [28]. A recent work on animalmodels have demonstrated the beneficial effect of prolonged releaseformulation of niacin (vitamin B3) to prevent apoptosis, expression ofvascular cell adhesion molecules-1, VEGF, VEGFR and increased tightjunction proteins to lower blood-retinal barrier breakdown in DM[29]. Essential enzymes of glycolysis and citric acid cycle that catalyzegroup transfer and other reactions require, in addition to theirsubstrate, a second organic molecule known as coenzyme, withoutwhich they are inactive. Activity of citric acid cycle is dependent on thesupply of oxidized dehydrogenase cofactors, e.g. NAD+. Active niacinis nicotinamide adenine dinucleotide (NAD+) and nicotinamideadenine dinucleotide phosphate (NADP+). The nicotinamidenucleotides play a widespread role as coenzyme to manydehydrogenase enzymes acting both in cytosol and mitochondria.Active thiamine, e.g. thiamine diphosphate plays as an essentialcoenzyme in oxidative decarboxylation of ketogluterate and pyruvatein citric acid cycle, especially, in transketolase reactins in the pentosephosphate pathway. Active riboflavin is flavin mononucleotide (FMN)and flavin adenine dinucleotide, which act as prosthetic group ofoxidoreductase enzymes like mitochondrial glycerol-3-phosphatedehydrogenase, in transporting reducing equivalents from cytosol intomitochondria and succinate dehydrogenase in citric acid cycle.Pyridoxal phosphate is active vitamin B6, which by entering into Schiffbase combination between its aldehyde group and amino group of anα-amino acid, facilitates changes in the three bonds of α-amino carbonto inhibit non-enzymatic glycation. Pyridoxal 5’-phosphate is also veryeffective in inhibiting lipid glycation. The previous experimental studydemonstrated that AGE-inhibitor pyridoxamine acted as a palliativeagainst diabetes-induced retinal vascular lesions, including thickeningof the basement membrane, and acellular capillaries in diabetic rats[30].
So, continuity of glycolysis and citric acid cycles, inhibition of non-enzymatic glycation, prevention of lipid peroxidation and oxidativestress generation, improvement in structural and functional stability ofRBCs are some of the curatives that seem to ameliorate the derangedsecretion of VEGF and its receptor 2 in supplemented group withthiamine, riboflavin, niacin, pyridoxal phosphate, ascorbic acid and α-tocopherol. The previous studies have advocated the beneficial effectsof supplementation of different nutritional components andantioxidants in prevention of progression and development of age-related macular degeneration and diabetic retinopathy [31-33].
ConclusionThis study, probably a pioneering one, observes the effects of
vitamin B, C and E on the surrogate markers of responsiblebiochemical derangements, and the structural and functionalcapabilities of RBCs related to development of DR in diabetic subjectsfor a considerably longer period of time.
References1. Yau JW, Rogers SL, Kawasaki R, Lamourex EI, Kowalski JW, et al. (2012)
Global prevalence and major risk factors of diabetic retinopathy. DiabetesCare 35: 556-564.
2. Diabetes Control and Complications Trial Research Group (1993) Theeffect of intensive treatment of diabetes on the development and
progression of long-term complications in insulin-dependent diabetesmellitus. N Eng J Med 329: 977-986.
3. Tang J, Kern TS (2011) Inflammation in diabetic retinopathy. Prog RetinEye Res 30: 343-358.
4. Kern TS (2007) Contributions of inflammatory processes to thedevelopment of the early stages of diabetic retinopathy. Exp Diabetes Res2007: 95103.
5. Schroder S, Palinski W, Schmidt-Schonbein GW (1991) Activatedmonocytes and granulocytes, capillary nonperfusion andneovascularization in diabetic retinopathy. Am J Pathol 139: 81-100.
6. Joussen AM, Poulaki V, Le ML, Koizumi K, Esser C et al. (2004) A centralrole for inflammation in the pathogenesis of diabetic retinopathy. FASEBJ 18: 1450 – 1452.
7. Simo R, Hernandez C (2008) Intravitreous anti-VEGF for diabeticretinopathy: hopes and fears for a new therapeutic strategy. Diabetologia51: 1574-1580.
8. Paine SK, Basu A, Mondal LK, Sen A, Choudhuri S, et al. (2012)Association of vascular endothelial growth factor, transforming growthfactor beta, and interferon gama gene polymorphisms with proliferativediabetic retinopathy in patients with type 2 diabetes. Mol Vis 18:2749-2757.
9. Diabetic Retinopathy Clinical Research Network, Wells JA, Glassman AR,Ayala AR, Jampol LM (2015) Aflibercept, Bevacizumab, or Ranibizumabfor Diabetic Macular Edema. N Eng J Med 372: 1193 – 1203.
10. Arevalo JF, Lasave AF, Wu L, Maia M, Diaz-Llopis M, et al. (2017)INTRAVITREAL BEVACIZUMAB FOR PROLIFERATIVE DIABETICRETINOPATHY: Results from the Pan-American Collaborative RetinaStudy Group (PACORES) at 24 months of follow-up. Retina 37: 334-343
11. Naing, NN (2003) Determination of sample size. Malays J Med Sci 10:84-86.
12. Satoh K (1978) Serum lipid peroxide in cerebrovascular disordersdetermined by a new colorimetric method. Clin Chim Acta 90: 37-43.
13. Erlandsen EJ, Jorgensen PE, Markussen S, Brock A (2000) Determinationof porphobilinogen deaminase activity in human erythrocytes: pertinentfactors in obtaining optimal conditions for measurements. Scand J ClinLab Invest 60: 627-634.
14. Parpart AK, Lorenz PB, Parpart ER, Gregg JR, Chase AM (1947) Theosmotic resistance (fragility) of human red cells. J Clin Invest 26: 636-643.
15. Mondal LK, Choudhuri S, Dutta D, Mitra B, Kundu S et al. (2013)Oxidative stress-associated neuroretinal dysfunction and nitrosativestress in diabetic retinopathy. Can J Diabetes 37: 401-407.
16. Choudhuri S, Dutta D, Sen A, Chowdhury IH, Mitra B, et al. (2013) Roleof N-epsilon-carboxy methyl lysine, advanced glycation end products andreactive oxygen species for the development of nonproliferative andproliferative retinopathy in type 2 diabetes mellitus. Mol Vis 19: 100-113.
17. Paine SK, Mondal LK, Borah PK, Bhattacharya CK, Mohanta J (2017)Pro-and antiangiogenic VEGF and its receptor status for the severity ofdiabetic retinopathy. Mol Vis 23: 356-63.
18. International Diabetes Federation (2014) IDF Diabetes Atlas,International Diabetes Federation (6th ed.) Brussels, Belgium.
19. Raman R, Gella L, Srinivasan S, Sharma T (2016) Diabetic retinopathy:An epidemic at home and around the world. India J Ophthalmol 64:69-75.
20. United Kingdom Prospective Diabetes Study (UKPDS) Group. Intensiveblood-glucose control with sulphonylureas or insulin compared withconventional treatment and risk of complications in patients with type 2diabetes (UKPDS 33) (1998) Lancet 352: 837-853.
21. Engerman RL, Kern TS (1987) Progression of incipient diabeticretinopathy during good glycemic control. Diabetes 36: 808-812.
22. Ismail Beigi F, Craven T, Banerji MA, Basile J, Calles J, et al. (2010) Effectsof intensive treatment of hyperglycemia on microvascular outcomes intype 2 diabetes: an analysis of the ACCORD randomized trial. Lancet376: 419-430.
Citation: Mondal LK, Pramanik S, De S, Paine SK, Bhaduri G (2019) Modification of Biochemical Derangements and VEGF Secretion mayPrevent Diabetic Retinopathy (DR) . J Clin Exp Ophthalmol 10: 803.
Page 10 of 11
J Clin Exp Ophthalmol, an open access journalISSN: 2155-9570
Volume 10 • Issue 3 • 803
23. ADVANCE Collaborative Group, Patel A, MacMahon S, Chalmers J, NealB (2008) Intensive blood glucose control and vascular outcomes inpatients with type 2 diabetes. N Eng J Med 358: 2560-2572.
24. Mondal LK, Bhaduri G, Bhattacharya B (2018) Biochemical scenariobehind initiation of diabetic retinopathy in type 2 diabetes mellitus.Indian J Ophthalmol 66: 535-540.
25. Mondal LK, Choudhuri S, Paine SK, Sen A, Bhaduri B, et al. (2013)Anaerobic glycolysis is the centre of different biochemical disarraysassociated with the onset of diabetic retinopathy. J Evo Med Dent Sci 2:2320-2328.
26. Kohner EM, Patel V, Rassam SM (1995) Role of blood flow and impairedautoregulation in the pathogenesis of diabetic retinopathy. Diabetes 44:603-607.
27. Hofman P, van Blijswijk BC, Gaillard PJ, Vrensen GFJM, SchlingemannRO (2001) Endothelial cell hypertrophy induced by vascular endothelialgrowth factor in the retina. New insight into the pathogenesis of capillarynonperfusion. Arch Ophthalmol 119: 861-866.
28. Hammes HP, Du X, Edelstein D, Taguchi T, Matsumura T, et al. (2003)Benfotiamine blocks three major pathways of hyperglycemic damage andprevents experimental diabetic retinopathy. Nat Med 9: 294-299.
29. Wang Y, Hua Y (2016) MicroRNA-126 contributes to Niaspan treatmentinduced vascular restoration after diabetic retinopathy. Scientific Reports6: 26909-26012.
30. Stitt A, Gardiner TA, Alderson NL, Canning P, Frizzell N, et al. The AGEinhibitor pyridoxamine inhibits development of retinopathyinexperimental diabetes. Diabetes 51: 2826 – 2832.
31. Age-Related Eye Disease Study Research Group (2001) A randomized,placebo-controlled, clinical trial of high-dose supplementation withvitamins C and E, beta carotene, and zinc for age-related maculardegeneration and vision loss: AREDS report no. 8. Arch Ophthalmol 119:1417-1436.
32. Kowluru RA, Zhong Q, Santos JM, Thandampallayam M, Putt D, et al.Beneficial effects of nutritional supplements on the development ofdiabetic retinopathy. Nutr Metab (Lond) 11: 8.
33. Kowluru RA, Kanwar M, Chan PS, Zhang JP (2008) Inhibition ofretinopathy and retinal metabolic abnormalities in diabetic rats withAREDS-based micronutrients. Arch Ophthalmol 126: 1266–1272.
Citation: Mondal LK, Pramanik S, De S, Paine SK, Bhaduri G (2019) Modification of Biochemical Derangements and VEGF Secretion mayPrevent Diabetic Retinopathy (DR) . J Clin Exp Ophthalmol 10: 803.
Page 11 of 11
J Clin Exp Ophthalmol, an open access journalISSN: 2155-9570
Volume 10 • Issue 3 • 803


![PHT PHT-RB6X0ST10S0AMS0Z, 製品データシート...PHT-RB6X0ST10S0AMS0Z | PHT 圧力センサ 寸法図面 (寸法 [mm]) 筐体 丸型コネクタ M12 x 1付き、IP67 M12 x 1 ¯](https://img.pdfslide.net/doc/110x75/60b2800f9294f0329d18b2c9/pht-pht-rb6x0st10s0ams0z-effff-pht-rb6x0st10s0ams0z-pht.jpg)