Embed Size (px)
Citation preview
AC 2009-251: A LABORATORY EXERCISE TO TEACH THE HYDROSTATICPRINCIPLE AS A CORE CONCEPT IN FLUID MECHANICS
Robert Edwards, Pennsylvania State University, ErieRobert Edwards is currently a Lecturer in Engineering at The Penn State Erie, The BehrendCollege where he teaches Statics, Dynamics, and Fluid and Thermal Science courses. He earned aBS degree in Mechanical Engineering from Rochester Institute of Technology and an MS degreein Mechanical Engineering from Gannon University.
Gerald Recktenwald, Portland State UniversityGerald Recktenwald is an Associate Professor in the Mechanical and Materials EngineeringDepartment at Portland State University. He is a member of ASEE, ASME, IEEE and SIAM. Hisresearch interests are in fluid mechanics, heat transfer, applications of numerical analysis, and inimproving undergraduate engineering education.
Brian Benini, Case Western Reserve UniversityBrian Benini is a 2008 Mechanical Engineering Technology graduate of Penn State Behrend. Heis now pursuing a Master of Science degree in Materials Science and Engineering at CaseWestern Reserve University in Cleveland, OH. His thesis work involves fracture and fatiguebehavior of implantable medical wires.
© American Society for Engineering Education, 2009
Page 14.37.1

A Laboratory Exercise to Teach the Hydrostatic Principle
as a Core Concept in Fluid Mechanics
Abstract:
Every field of study has core concepts that are essential to the understanding of the material.
Students must understand these concepts and use them as a foundation for further study in the
field. Most students carry preconceived ideas based on previous life experiences into the
classroom which may conflict with the concepts being taught. These misperceptions can be
difficult to overcome. It is common for students to take the material presented in a lecture and
try to reconcile the new information with their preconceived ideas. This creates problems for
both the instructor who is trying to instill these core concepts and the students who struggle with
the conflicts.
One approach to overcome these problems is to create a laboratory experience that will help the
students to face their misperceptions and replace them with the appropriate core concept. The
authors are currently investigating this approach as it relates to the fluid and thermal sciences.
One of the key core concepts in the area of fluid mechanics is the hydrostatic principle relating
the pressure in a fluid to the depth of the fluid. A common misperception is that the pressure is a
function of the weight of the fluid above the point of interest when it is actually a function of the
depth of the fluid column. This paper describes a laboratory exercise designed to teach this
concept to the students. While a description of the apparatus and the test will be included, the
focus of the paper will be on some of the results of the exercise to date, qualitative conclusions
based on observing the exercise, and some suggestions for further refinements of the exercise.
The assessment data which is discussed in the paper tends to indicate that students do not have a
hard time comprehending the basic principle but do run into difficulty when trying to apply their
understanding to practical problems. The laboratory exercise has been used during three
different courses covering Mechanical Engineering, Civil Engineering, Mechanical Engineering
Technology and Electrical Engineering Technology students at both Penn State Erie and Portland
State University. Different assessment tools were used each time the exercise was run since they
were being developed and modified during that time. Each time the results related to
applications have been similar. This is discussed in the paper.
Introduction:
The exercise documented in this paper is part of a National Science Foundation funded project
being jointly conducted at Penn State Erie, The Behrend College (PSB) and Portland State
University (PSU). It is one in a suite of seven exercises being developed by the authors which
are intended to help teach core principles in the thermal and fluid sciences through the use of
everyday devices. These include a hair dryer, a bicycle pump, a blender, a computer power
supply, a toaster, straight and stepped tanks, and a pipe section with a change of area. The
project was first introduced at the 2007 ASEE national convention in a paper presented in the Page 14.37.2

DELOS division1. This paper focuses on just one of the exercises using the straight and stepped
tanks.
Traditional laboratory exercises in the fluid and thermal sciences tend to be centered around
particular equipment with specific functions. For example, at PSB a commercially purchased
refrigeration test bed is used to help demonstrate an ideal refrigeration cycle. The exercises
associated with this type of equipment tend to follow a “cookbook” approach. The equipment
functions essentially the same way every time. The data is similar each time the exercise is run
and is very predictable. Little is left to chance, and the exercise is generally successful. Students
follow the prescribed procedure and gather data. Generally this data is taken away from the lab,
analyzed, and a report is written. The goal of this type of exercise is to reinforce concepts
presented in a lecture and to show how the theory applies in the “real world”. This type of
exercise has its place in demonstrating basic principles and is often used by the authors. The
goal of the suite of exercises being developed by the authors is more to teach the core concepts
that the theory is based on and not so much to demonstrate that the theory works in “real life”.
Several alternative approaches have been becoming popular, particularly in science classrooms.
Many of them fall under the general umbrella of active learning methods. Some of these include
inquiry-based learning2, experiential learning
3, various types of project based learning
4, and
workshops5. An interesting comprehensive program for teaching physics using a hands-on
interactive environment in large classes has been developed by North Carolina State University6.
Known as SCALE-Up (Student-Centered Activities for Large Enrollment University Physics), it
is being incorporated in schools around the country including Arizona State, Massachusetts
Institute of Technology, and the authors own school, Penn State Behrend7. Much of the work in
these areas has taken place in science classrooms but is now finding its way into engineering
classrooms as well.
The approach taken by the authors is guided inquiry. In a basic inquiry based approach students
are asked to pose questions, develop experiments to try to answer those questions, analyze
information from those experiments, and draw conclusions. Guided inquiry is a variation of this
approach in which certain critical questions are posed to the students rather than by the students.
This approach tends to keep the students on track but still allows room for the students to pose
their own questions. In fact, they are encouraged to do so. The wording of the critical questions
is important. They should be open ended and not suggest an answer. A good example of this is
given by Buch and Wolff8. They suggest that a question intended to get the students to think
about improvements in construction materials might be posed two different ways: “How would
the presence of fibers affect concrete toughness?” or “How would you improve concrete
toughness properties?” Clearly the first question suggests an answer while the second is more
thought provoking. We do not claim to have all of the questions in our exercises worded in the
best way, but that is part of the development process.
Conceptual knowledge is the foundation that engineering theory is based on. Without a
fundamental understanding of the basic concepts involved in a problem it is difficult to apply
higher level or critical thinking to that problem. Much work is being done to develop concept
inventories to test not just the ability of a student to solve engineering problems but also their
grasp of the basic concepts. A recent paper by Streveler, Litzinger, et al.9 gives a very good
Page 14.37.3
overview of the research being done in this area. They list several areas where engineering
students struggle with basic concepts such as heat vs. energy. They conclude that much has been
done in the area of conceptual knowledge and misconceptions in science but little has been done
in the field of engineering. They make several recommendations for future research in this field,
one of which is the development of “learning experiences that help student learn difficult
concepts in engineering science”. This exercise and the overall work we are doing is a small part
of that recommended research.
Overview of the Exercise:
The tank filling exercise is designed to demonstrate to students the fundamental principle of fluid
statics that the pressure at the depth of a fluid depends only on the depth and not on the shape of
the container. It challenges the common misperception that the pressure depends on the weight
of the fluid above the point. During this exercise the students are asked to predict the effect of
increasing the depth of water in a container on the pressure at the bottom of the container. This
is done for both a straight cylinder and a stepped container. They then conduct the exercise and
compare their predictions with the actual results.
Students have three main tasks to complete as they go through the exercise. The first is a pre-
exercise worksheet designed to demonstrate their current understanding of the principle. They
are then required to fill out a worksheet as they proceed through the exercise, which forces them
to think about the basic principles involved. Finally, they retry the initial pre-exercise worksheet
to determine if they learned anything during the lab. The documents are described in more detail
below.
While this exercise uses simple devices and is simple to conduct it does expose misperceptions
on the part of the students. After the exercise most students should have a better understanding
of the principle than they would have had from a lecture only. Additionally, knowing that there
are persistent misperceptions among the students can help the instructor to design or modify
lectures to address those misperceptions.
Learning Objectives:
This exercise has several learning objectives:
• Identify a pressure transducer and explain its role in measuring/transmitting pressure
values to a data collection system.
• Identify the fluid properties and other physical variables that determine the pressure at
some depth in a tank partially filled with water and open to air.
• Predict the trend in pressure with tank depth.
• Compute the pressure at any depth below the free surface of a tank partially filled with
liquid.
• Predict how the relationship between pressure and depth changes with the shape of the
tank.
Page 14.37.4

Test Apparatus:
Figure 1 shows a schematic of the equipment for this laboratory exercise. Figure 2 is a picture of
the actual apparatus used at PSB. The apparatus at PSU is similar. The key components are
listed below:
• Pressure transducer to measure pressure at mounted location
• Uniform diameter tank
• Stepped tank (two diameter tank)
• Power supply to supply power to the pressure transducer.
• Data Acquisition Device (DAQ) for digitizing the pressure transducer output.
• Computer to record and display the output from the pressure transducer.
DAQ
Computer PowerSupply
Pressuretransducer
Water
Figure 1: Apparatus setup for the Tank Filling Laboratory
Figure 2: Apparatus in use at Penn State Behrend
Page 14.37.5

Exercise Procedure:
The exercise is comprised of four main sections: determine a calibration equation for the
pressure transducer, gather and analyze data for the straight tube, gather and analyze data for the
stepped tube, and reflection/extension. This section describes what the students are asked to do
as the exercise proceeds. The entire worksheet is included as Appendix 1.
To determine an equation to use for the pressure transducer the students are given two data
points and told that the transducer is linear over its’ useful range. On the surface it is a simple
task to determine the equation of the straight line describing the calibration curve, and the
students do manage to complete this task. However, observations during the lab exercise expose
that many students do not really understand the concept of transducer calibration and struggle
with this. While some students manage this task quite easily, others need guidance to get them
going in the right direction. No formal assessment is done to verify this, but it appears that the
learning benefits from this exercise extend beyond the hydrostatic principle to a better
understanding of calibration concepts and perhaps transducers in general.
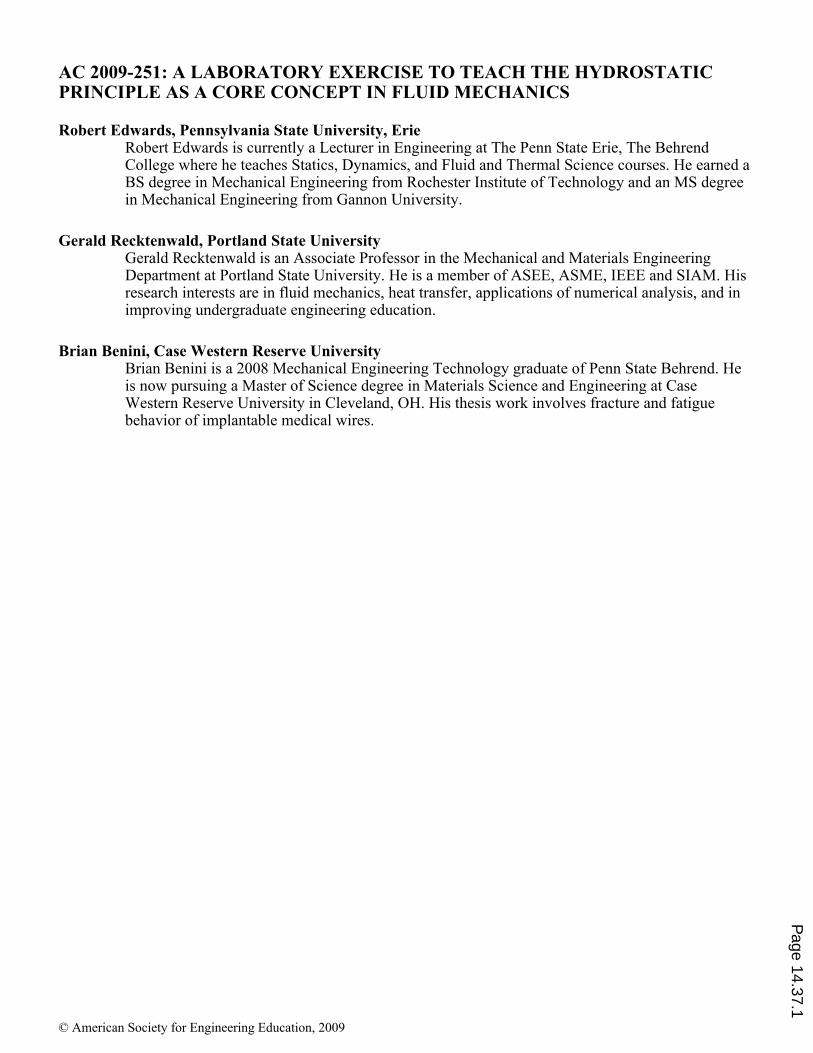
Gathering the data for the straight tube involves filling the tanks to various levels with water.
Four depths are used for this exercise, which are determined by the students. Figure 3 shows the
two tanks that are used. Scales are mounted on the sides of the tanks to facilitate data collection.
The transducer output is directed to a data acquisition unit into a LabView program and
displayed on the computer screen. The output is in volts, so the students must convert the data to
pressure using the calibration equation they determined earlier. This data is plotted on a pressure
vs. depth graph to demonstrate that the curve truly is a straight line. At this point the students
can clearly see that there is a linear relationship between pressure and fluid depth for a straight
tank, but this could still be because of the weight or volume of the water. It is not necessarily
clear to the students at this point whether the linear relationship is due to depth or something
else.
At this point students are asked if they think if the relationship is due to
depth, weight, or some other parameter. They are also asked what
parameters they think might have an effect on the pressure. Some of the
results to these questions are given later in this paper.
Figure 3 - Tanks
The data collection that was done using the straight tank is repeated
using the stepped tank. Students can again use any depths they want.
They are encouraged to use different depths than they did for the straight
tank and to be sure that two of their readings are below the step and two
are above the step. Once this data is gathered and converted into
pressure the results for the two tanks are plotted on the same set of axes.
The graphs clearly demonstrate that the pressure depends only on the
depth and not on the total weight of the water.
As a side note, sometimes things can go wrong. The first time this exercise was run at PSB there
was an interesting “problem” with the data. The curve for the stepped tank was clearly offset
from but parallel to the curve for the straight tank.
Page 14.37.6
While this seems like it was a fairly trivial problem it did introduce into the exercise something
that is not usually present in traditional experiments. The students were required to think on the
spot rather than simply collect data and try to make sense of it later. A teaching moment was
created. Students tend to take data and simply accept it at face value, so this offset in the data
brought up the question whether it was caused by something in the theory or if it was a problem
in the test set-up. They needed to make sense of the data based on their understanding of the
concept.
Students engaged in an informal discussion to try to figure out what was causing the offset.
They were asked to consider the basic theory, the shape of the tanks, the slope of the lines, the
test set-up, and any other factors that may have caused it. They correctly concluded that since
the lines were parallel that the basic hydrostatic relationship seemed to be demonstrated and that
the offset was likely due to a problem with the test set-up. They discovered that the scale on the
stepped tank had been jarred during the test and was not centered on the centerline of the
transducer. After correcting the curve for the measurement offset the results matched the theory,
as expected. Even though no qualitative data is available to verify this, the author suspects that
the students gained a deeper understanding of the basic concept through this informal tangent to
the overall exercise than they otherwise would have. This clearly demonstrates one of the
strengths of inquiry based exercises.
After the data has been gathered, plotted and discussed there is a brief reflection and extension
portion of the worksheet. This section is designed to see if the students recognize similarities
and differences between the measurements for the two tanks and to see if they can extend their
understanding of the principle beyond the tests. As part of this section they are asked three
extension questions to test a deeper understanding of the principle.
1) If a heavy object such as a rock was placed into either of the tanks before the water was
added, what effect would it have on the pressure indicated by the transducer? Why?
2) If the object was added after the water was filled to a given depth, would the result be
different? Why?
3) Suppose the two tanks are placed on weigh scales. For a given depth of water, the straight-
walled tank will weigh more than the step-walled tank. Considering the static equilibrium at
the interface between the bottom of the tank and the top of the scales, it would appear that the
pressure in the bottom of the step-walled tank needs to be less than the pressure at the bottom
of the straight-walled tank. How do you resolve this paradox?
These three questions are intended to determine if the students can apply a basic understanding
of the hydrostatic principle to a problem that is different from those they have seen in class or in
the lab. This level of reasoning can not occur if the students are not grounded in the basic
principles.
Page 14.37.7

Pre and Post Exercise Worksheets:
We have been trying out various ideas for the pre and post test worksheets in order to develop
questions that will provide meaningful data. Currently PSB and PSU are using different but
similar versions of these worksheets. The pre test and post test worksheets are identical to each
other to help assess any change in student understanding gained during the exercise. The
worksheets used at PSB consist of four questions (this worksheet is attached as Appendix 2).
The PSU worksheet has 5 questions and is attached as Appendix 3. In both cases the questions
ask the student to predict the results of the exercise. The PSU worksheet includes extension
questions to determine if students can apply a basic understanding of the principle to other
situations. Since part of the purpose of this research is to develop these assessment instruments
they have been revised and updated several times and are not yet finalized. Eventually both
schools will be using the same documents.
Results and Assessments:
The tank fill exercise has been used three times – once at PSU and twice at PSB.
At PSU it was conducted during the first meeting of the lab section for EAS 361, a required
course for students in the undergraduate Civil Engineering and Mechanical Engineering
programs. In Fall 2008, 137 students enrolled in one of two lecture sections of EAS 361. One of
the sections was comprised mostly of ME students and the other of mostly CE students. The 137
students were divided into six lab sections with a maximum enrollment of 24 students. Students
from the lecture sections were free to enroll in any of six laboratory sections, so the ME’s and
CE’s were mixed. Of the 137 students enrolled in the class, 118 volunteered to participate in the
research study.
The exercise has been run twice at PSB. The first time was during a junior level mechanical
measurements course in the Mechanical Engineering Technology program during the spring of
2008. There were 20 students who participated at that time. The second time it was used at PSB
was in the Fall of 2008 when 15 Electrical Engineering Technology seniors participated during a
course in fluid and thermal sciences for non-MET majors.
The pre and post test assessment instrument was different each time the test was run. The spring
of 2008 group at PSB used a fairly crude pre/post worksheet that was not at all well designed for
gathering assessment data. However, some anecdotal information was obtained, which is
described below. The Fall 2008 group at PSB used the worksheet shown in Appendix 2. This
was an improvement over the original one, but problems remained. Again, some information
can be derived from the testing, but nothing of any statistical significance. This is discussed in
more detail below. The most recent version used at Portland State in Fall 2008 (Appendix 3) is
much improved and did show some trends in the data that are of interest at this point. More
work needs to be done to further refine the exercise and assessment tools.
The Spring 2008 group at PSB exposed problems with the exercise and assessment instruments.
Nevertheless, some information did come out of the exercise. The 20 students involved in the
exercise did have some background with the material by way of a lecture on the hydrostatic
Page 14.37.8

principle. The students were asked to list two parameters that have an effect on the pressure at
the bottom of the tank. Only 70% listed depth as a factor, even after having a lecture on the
material. Volume and diameter were incorrectly listed by 45% and 10% of the students
respectively. Various other parameters were listed by a small number of students. This tends to
show that even after a lecture many of the students were still confused by the basic concept. As
an extension question the students were asked if the pressure would be affected by the presence
of a rock in the tank. 65% of the student incorrectly said that the pressure would increase if a
rock was placed in the tank before the test. As reported below, this result is not uncommon.
Even the students who seem to understand the basic concept struggle with applications.
The Spring 2008 group at PSB was the first group to run the tank filling exercise. There were
several weaknesses exposed in the exercise itself that helped to improve the worksheets.
1) Propagation of error – the answers to various questions throughout the worksheet
were never checked but were used as the basis for later questions. This meant that the
students were likely learning the wrong things because of incorrect answers
propagating through the worksheet. This was corrected on later worksheets by
adding checkpoints along the way to assure the students understood what they had
just done.
2) Pre and Post Test Weaknesses – The pre and post tests used during the first running
of the exercise were quite weak and did not provide any good information for
measuring learning gains. The tests have subsequently been revised several times.
The latest tests used at Portland State represent a dramatically improved version
allowing for meaningful learning gain analysis.
3) “Voluntary Ignorance” – The students that were part of the initial exercise at PSB
were volunteers who were not receiving any kind of grade for their efforts. It was
evident that several of the students did not take the exercise seriously and guessed at
many of the answers. They seemed to be more interested in finishing the exercise
than in actually learning anything.
4) General Aptitude – Weakness in basic algebra and plotting skills became evident
during the exercise. Mistakes in these areas can lead to incorrect conclusions by the
students. Later versions of the worksheets were modified in part to address this
problem.
The Fall 2008 group at PSB used the pre/post worksheet shown in Appendix 2. Although this
data was better suited to a statistical analysis there were still problems which made the analysis
unreliable. First, the questions were too basic and did not provide any application questions.
Secondly, the group size was too small with only 15 students to yield any statistically meaningful
results. Again however there were things to be learned from this group. The exercise itself
contained application questions (see Appendix 1 – Section 8). There were 16 students who
completed the exercise worksheets. Three questions had interesting results:
1) If a heavy object such as a rock was placed into either of the tanks before the water was
added, what effect would it have on the pressure indicated by the transducer? Six
students incorrectly answered that the rock would increase the pressure in the tank for the
same depth of water. One thought the pressure would decrease and one thought it would
Page 14.37.9

2) If the object was added after the water was filled to a given depth, would the result be
different? Nine students correctly recognized that the rock would displace some of the
water causing an increase in depth. Five students said that it would not have any effect
on the pressure. Two students thought that the pressure would spike as the rock settled,
but would then return to the original pressure.
3) Suppose the two tanks are placed on scales as depicted in the sketch below. For a given
depth of water, the straight-walled tank will weigh more than the step-walled tank.
Considering the static equilibrium at the interface between the bottom of the tank and the
top of the scales, it would appear that the pressure in the bottom of the step-walled tank
needs to be less than the pressure at the bottom of the straight-walled tank. How do you
resolve this paradox? There were no students who could answer this question. This is
probably because they were electrical engineering technology students with no
background in statics.
These results were similar to the previous group in that the basic concept seemed to be fairly
well understood but the students had difficulty extending the concept to other applications. No
statistically significant results came from the pre/post worksheets.
The PSU exercise in Fall 2008 involved many more students and revised pretest and posttest
questions. The learning gains were measured from the responses to five multiple choice
questions on pretests and posttests administered immediately before (pretest) and immediately
after (posttest) the students participated in the laboratory exercise (see Appendix 3). The
learning gain was computed from 118 matched tests.
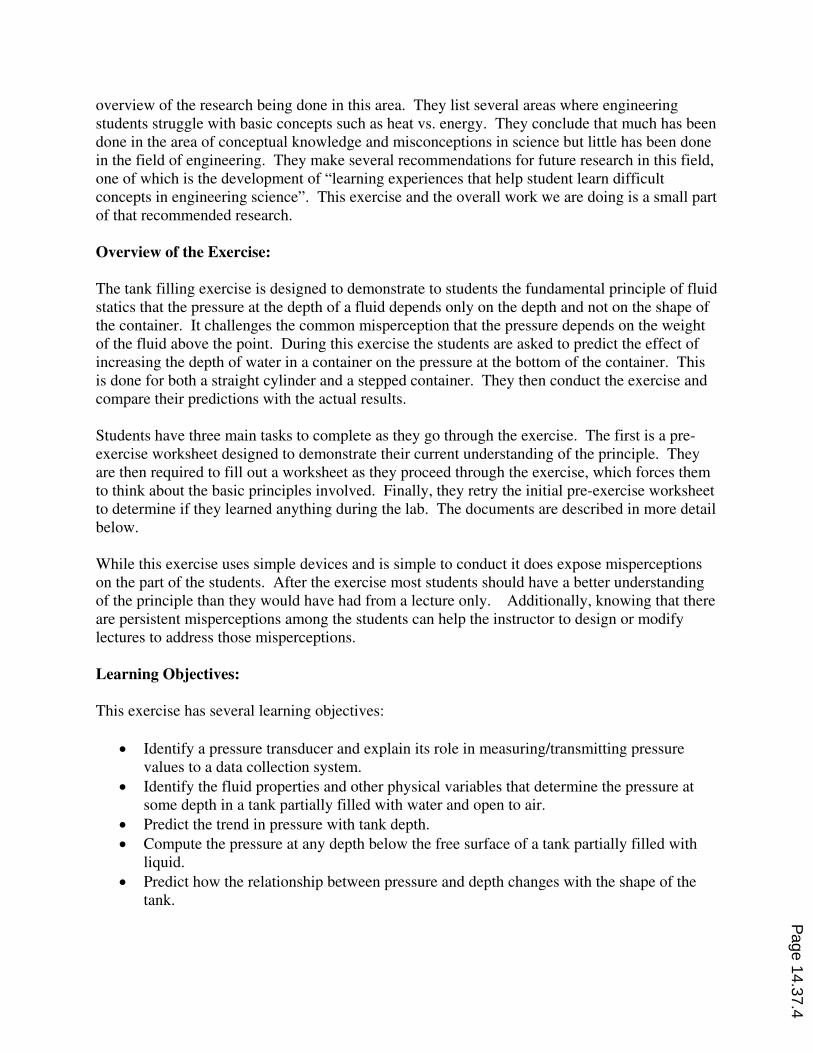
Figure 4 shows the fraction of students getting the correct answer on each question of the pretest
and posttest (see Appendix 3 for the questions). The maximum possible score was 1, which is
indicated by the dashed horizontal line in the plot. Figure 4 shows that student performance
increased from pretest to posttest on each of the five questions. However, given the simplicity of
the concept being tested, it is surprising that the posttest scores were not higher. Questions 1, 2
and 4 on the pre/posttest are directly related to the hydrostatic equation. Questions 3 and 5
required students to generalize their understanding of the hydrostatic equation to an engineering-
like application.
The overall improvement in student performance was measured by the normalized gain10
g =f post − f pre
1− f pre
(1)
where fpre and fpost are the arithmetic averages of the fraction of correct answers on each test.
The overall learning gain was 0.67, which Hake classifies as at the high end of medium learning
gain. Student performance increased most for those questions that were directly related to the
hydrostatic equation such as the comparison of the pressure for the straight and step-walled tank
(Questions 1 and 2). Student performance increased, but not as much, for questions that required
reasoning about the hydrostatic equation in engineering applications, such as the dam problem
Page 14.37.10

(Question 3). These results tend to reinforce the anecdotal results obtained from the exercises at
PSB.
Figure 4 – Fraction of correct answers on the pretest and posttest at PSU during Fall 2008
Future Work:
The exercise described in this paper is part of a suite of exercises aimed at teaching core
principles in the fluid and thermal science through the use of guided inquiry. The exercise
procedure is being tested at PSB and Portland State. Since the exercises are currently being
developed and tested they are undergoing constant revision and improvement. Final versions of
the worksheets will ultimately be available for others to use. Future work planned for this
project includes:
1) Continuing to test and improve the worksheets at the authors’ schools.
2) Making the exercises, including the worksheets, LabView VI’s, and hardware
requirements available to other schools for beta testing.
3) Possibly providing workshops to describe not only the test goals and procedures, but
also the overall pedagogy involved.
4) Publishing all of the exercises on the website http://eet.cecs.pdx.edu.
Acknowledgements
This work is supported by the National Science Foundation under Grant No. DUE 0633754. Any
opinions, findings, and conclusions or recommendations expressed in this material are those of
the author(s) and do not necessarily reflect the views of the National Science Foundation.
Page 14.37.11

References: 1. G. Recktenwald, R.C. Edwards, “Using Simple Experiments to Teach Core Concepts in the Thermal and
Fluid Sciences,” Proceedings of the 2007 American Society for Engineering Education Annual Conference
& Exposition, 2007.
2. L.C. McDermott, et.al., “Physics by Inquiry,” John Wiley & Sons, 1996.
3. D.A. Kolb, “Experiential Learning,” New Jersey, Prentice Hall, 1984.
4. H.L. Cooper, “Using Projects to Improve Understanding of Introductory Thermal Science Concepts,”
Proceedings of the American Society for Engineering Education Annual Conference & Exposition, 2004.
5. D. Hanson, T. Wolfskill, “Process Workshops – A New Model for Instruction,” Journal of Chemical
Education, 77, 120-129, 2000.
6. R. Beichner, “SCALE-UP Project Summary,” North Carolina State University, Raleigh, NC, 2000.
7. J. Bernard, “The Tough Road to Better Science Teaching,” The Chronicle of Higher Education, August 3,
2007, Volume LIII, Number 48
8. N.J. Buch, T.F. Wolff, “Classroom Teaching Through Inquiry,” Journal of Professional Issues in
Engineering Education and Practice, Vol 126 No 3, July, 2000.
9. R. Streveler, T. Litzinger, R. Miller, P. Steif, “Learning Conceptual Knowledge in the Engineering
Sciences: Overview and Future Research Directions,” Journal of Engineering Education, Vol. 97 No. 3:
279-294, July, 2008.
10. Richard R. Hake, “Interactive-engagement versus traditional methods: A six-thousand-student survey of
mechanics test data for introductory physics courses”, American Journal of Physics, 66(1), 64-74
Page 14.37.12

Appendix 1 – In Class Worksheet:
THE TANK FILLING LABORATORY
The Engineering of Everyday Things
SECTION 1 – INTRODUCTION
This experiment is likely to take about 1 ½ hours to complete. If you are participating in the
study and have forgotten your code number the instructor can look it up for you. If you are not
participating in the study use “not in study” for your code number above.
You will be asked to take a brief quiz before you start the exercise to assess your knowledge
prior to performing the exercise and a similar survey at the end to assess the effectiveness of the
exercise. These quizzes will not affect your grade in the course. The answers on the quizzes are
a way to measure how well the lab exercises help you learn the material.
Page 14.37.13

SECTION 2 - APPARATUS
Figure 1 shows the equipment for this laboratory exercise. The key components are listed below:
• Pressure transducer to measure pressure at mounted location
• Uniform diameter tank
• Stepped tank (two diameter tank)
• Power supply to supply power to the pressure transducer.
• Data Acquisition Device (DAQ) for digitizing the pressure transducer output.
• Computer to record and display the output from the pressure transducer.
DAQ
Computer PowerSupply
Pressuretransducer
Water
Figure 1: Apparatus setup for the Tank Filling Laboratory
Page 14.37.14
SECTION 3 – LAB PREPARATION
As part of this exercise you will be asked to make simple plots of measured data. You can use
Excel if you wish, but you must give a copy of the Excel file to the instructor before the end of
the session. All plots on Excel must be clearly labeled so that the instructor can correctly assess
the plots as part of the worksheet. If you want to use Excel you may want to log on to a
computer and load Excel at this time.
SECTION 4 – LEARNING OBJECTIVES
After completing this lab exercise you should be able to
• Identify a pressure transducer and explain its role in measuring/transmitting pressure
values to a data collection system.
• Identify the fluid properties and other physical variables that determine the pressure at
some depth in a tank partially filled with water and open to air.
• Predict the trend in pressure with tank depth.
• Compute the pressure at any depth below the free surface of a tank partially filled with
liquid.
• Predict how the relationship between pressure and depth changes with the shape of the
tank.
SECTION 5 – THE TANK WITH UNIFORM DIAMETER
a) Start the LabView virtual instrument (VI) by clicking on the “Run” arrow, and select the
correct DAQ device. (Note: the instructor should have LabView running on the
computer and the VI loaded).
b) Data Collection:
(1) Add water into tank to about 3” above the transducer
(2) Record transducer voltage on the table on below
(3) Record tank depth on the table below
(4) Repeat steps 1) through 3) at least 3 more times. Make sure your readings are
spread over the entire range of the possible fluid depths for the tank.
(5) Inspect the raw data you have recorded
(a) Be sure to add units to the table.
(b) What is the appropriate reference point for the depth of water measurement?
In other words, where is the physical location of the “zero depth” point in the
tank?
Page 14.37.15

Table 1: Summary Table for Uniform Diameter Tank (add units to the table)
Measured
Water Depth Transducer
Output
Page 14.37.16

c) Calibration and data conversion:
To relate the preceding measurements to the standard model of fluid behavior, the voltage
output of the pressure transducer must be converted to pressure.
Calibration data from the manufacturer: At p=0 the transducer output is 1V. At p=1 psig
the transducer output is 5V.
(1) Use the grid below to create a plot of pressure versus voltage for the tansducer.
Be sure to label the axes. Assume that the transducer output is linear with
pressure.
(2) Using the plot you just created as a guide, what is the calibration formula for the
pressure transducer? In other words, if p = f(v): what is f(v)?
(3) Apply your calibration formula to the transducer output data from table 1 and fill
in the table below.
Table 2: Second Summary Table for Uniform Diameter Tank (add units to the table)
Water Depth Transducer
Output
Pressure
Page 14.37.17

d) Analysis of Pressure Data
1. For the experimental data collected above what is (are) the independent variable(s)?
What is (are) the dependent variables?
Dependent Variable(s):
Independent Variable(s):
Given definitions: An independent variable is an input or parameter that is directly
controllable by the person performing the experiment. An independent variable is often,
though not always, the quantity on the x-axis of a plot.
A dependent variable is the output or result of changing a system. A dependent variable
is often, but not always, the quantity on the y-axis of a plot.
In an experiment, both independent and dependent variables are measured.
e) Use the following grid to make a plot of the data you collected using the variables you
listed in d above as your axes. Plot your choice of independent variable on the horizontal
axis and the dependent variable on the vertical axis. Be sure to label your axes.
(Alternatively, you may use Excel to make this plot).
f) What, if any, observations can you make from the plot you just created?
Page 14.37.18
g) Based on your results is the pressure related to the water height, volume, or some other
parameter? How does the data support your answer?
h) List at least two possible parameters that may have an effect on the pressure. (Hint: One
of the parameters is a property of the fluid.)
Page 14.37.19

SECTION 6 – THE STEP-WALLED TANK
a. Repeat the experiment from Part 1, but use the stepped tank instead of the straight-walled
tank. Record your data on the table below. (Record the tank diameter at the free surface
for each depth)
b. Run the experiment so that at least two data points are from the larger diameter tube and
at least two are from the smaller diameter tube. Be sure to add units to the table.
c. Use the calibration developed above to convert the pressure transducer output to pressure
and record it in the fourth column of the table.
Table 3 – Summary Table for The Step-Walled Tank (add units to the table)
Measured
Diameter Water
Depth
Transducer
Output
Pressure
d. For the experimental data collected above what is (are) the independent variable(s)?
What is (are) the dependent variables?
Dependent Variable(s):
Independent Variable(s):
Page 14.37.20

SECTION 7 – COMPARING MEASUREMENTS FROM THE TWO TANKS
a. Plot data from the two tanks on the same axes. Label the axes appropriately. (This may
be done on the grid below or using Excel. If you use the grid below be as accurate as
possible with your plots.) Based on your plots, answer the questions below.
(1) How does the change in diameter at the free surface affect the pressure? Does this
make sense based on your personal experience or intuition?
(2) For each of the lines on the graph above, what is the numerical value of the slope?
What are the units of the slope?
Page 14.37.21
(3) What theory can be used to explain the data? In other words, if you were to add a
third plot of theoretical values, what formula would you use?
(4) In order to use the theoretical equation identified in your answer to the previous
question, what other information is needed in order to compute numerical values
before adding the data to the plot? Could the missing value(s) in the formula be
obtained from the measured data? How?
Page 14.37.22
SECTION 8– REFLECTION, DISCUSSION and EXTENSION
4) List the key similarities and differences for the two tanks.
Similarities:
Differences:
5) How do the differences in the shape of the tanks affect the variation of pressure with depth?
6) Does the theory “explain” the data? In other words, given the agreement (or disagreement)
between the theory and measurements, how well will theory predict the pressure versus depth
relationship for any shape of tank?
7) If a heavy object such as a rock was placed into either of the tanks before the water was
added, what effect would it have on the pressure indicated by the transducer? Why?
If the object was added after the water was filled to a given depth, would the result be
different? Why?
Page 14.37.23

8) Suppose the two tanks are placed on scales as depicted in the sketch below. For a given
depth of water, the straight-walled tank will weigh more than the step-walled tank.
Considering the static equilibrium at the interface between the bottom of the tank and the top
of the scales, it would appear that the pressure in the bottom of the step-walled tank needs to
be less than the pressure at the bottom of the straight-walled tank. How do you resolve this
paradox?
Page 14.37.24

Appendix 2 – Pre/Post Assessment Worksheet – Penn State Behrend
Pre/Post-Exercise Worksheet
Figure 1 shows a cylindrical tank of water with a pressure transducer attached near the base of
the tank. The pressure transducer is a sensor that produces an electrical signal (voltage in this
case) that is proportional to the pressure. A DC power supply provides electrical energy to the
transducer. The output of the transducer is connected to a data acquisition (DAQ) device that
converts the voltage to a digital value, which is then sent to a computer.
DAQ
Computer
Powerupply
Water
S
Pressuretransducer
Figure 1: Apparatus for the hair dryer experiment.
Page 14.37.25

Questions
1. Which of the following sketches shows the correct trend of pressure with depth of water
in the cylinder?
2. Consider a second tank made from two cylinders of different diameters as shown on the
right below. The base of the stepped tank is the same diameter as the base of the straight
tank.
Which of the following sketches shows the correct trend of pressure with depth of water
in the stepped tank?
Page 14.37.26

3. Consider a third tank shaped as shown.
Which of the following sketches shows the correct trend of pressure with depth of water
in this tank?
4. The pressure caused by a fluid is related to:
a. The volume of the fluid above the point
b. The weight of the fluid above the point
c. The depth of the fluid above the point
d. The shape of the tank the fluid is in
B
C
D
A
Page 14.37.27

Appendix 3– Pre/Post Assessment Worksheet – Portland State
1. For a stationary fluid, the pressure at a point is determined by
(a) the volume of the fluid above the point.
(b) the weight of the fluid above the point.
(c) the depth of the fluid above the point.
(d) the shape of the tank containing the fluid.
(e) none of the above reasons are sufficient.
2. The Sketch to the right depicts a cylindrical tank that can be filled with
water to different depths. Which of the following miniature graphs
shows the correct trend of pressure at the bottom of the tank as a
function of depth of water in the cylinder?
3. The sketches below depict two identical dams holding back two different reservoirs of
water. Both reservoirs have the same H and W dimensions, and the same width in the
direction into the page.
a.) Which of the following statements is true?
i The hydrostatic load on Dam 1 is greater than the hydrostatic load on Dam 2.
ii The hydrostatic load on Dam 1 is greater than the hydrostatic load on Dam 1.
iii The hydrostatic load on Dam 1 is equal to the hydrostatic load on Dam 2.
iv Not enough information is given to determine the hydrostatic load on the Dams.
b.) Explain your choice of answer for part (a).
Page 14.37.28

4. Consider a sloped tank shaped as shown in the right half of the
following sketch. Which of the following sketches shows the correct
trend of pressure with depth of water in this tank? The solid line is a
reference. The data connected with dashed lines indicate possible
trends in the pressure at the bottom of the sloped tank as a function of
water depth.
5. The sketch to the right depicts an open tank with an opening
on its side. The opening is covered with a flange that is held
in place by six bolts arranged in a circle around the
periphery of the flange. The design engineer needs to
choose the correct size of bolts to keep the flange from
leaking. Which of the following choices provides the best
description of how the hydrostatic load on the bolts would
change if the diameter D is changed?
a.) Increases linearly with D
b.) Increases with D2
c.) Is independent of D
d.) Decreases as 1/D
e.) Decreases as 1/D2
f.) Varies with D in some way not listed here.
Page 14.37.29