Embed Size (px)
Citation preview

A Large Throughput High ResolutionFourier Transform Spectrometer for
Submillimeter Applications
M. Bin1, D.J. Benford, M.C. Gaidis2,
T.H. B�uttgenbach3, J. Zmuidzinas,
E. Serabyn4 and T.G. Phillips
Downs Laboratory of PhysicsMail Code 320-47
California Institute of Technology, Pasadena, CA 91125.
Abstract
We have designed and constructed a Fourier TransformSpectrometer (FTS) for the study of submillimeter-wave mixersand optical components. The FTS has a large aperture (up to25.4 cm) and small focal ratio (as fast as f/2.5) to achievea large throughput. It operates in the 100-3750 GHz (3.3-125 cm�1) frequency range with a resolution of up to 75 MHz(0.0025 cm�1). Here we discuss the design goals and provide adetailed description of the construction of the FTS. In addition,we highlight the variety of studies which have been conductedwith this instrument, which include characterizing SIS mixersthrough both direct and heterodyne detection and measuringthe properties of optical materials.
keywords: Fourier Transform, spectroscopy, quasi-optics,heterodyne, SIS, dielectrics, submillimeterwaves, materialproperties
1Presently at TeraDyne, 30801 Agoura Rd., Agoura Hills, CA 91301
2Presently at JPL, Mail Stop 168-314, Pasadena, CA 91109
3Presently at Bach Corporation, 625 Fair Oaks Blvd., Suite 230, South Pasadena, CA 91030
4Presently at JPL, Mail Stop 171-113, Pasadena, CA 91109

1. Introduction
Recent advances in the technology of receivers and detectors forsubmillimeter astronomy have generated a need for high resolution, highsensitivity characterization of receivers and optical components. Forinstance, advances in the design of planar antennas and quasi-optics[1; 2; 3],particularly in applications involving astronomy with low-noise receivers,require detailed knowledge and control of the frequency response of themixer and associated quasi-optics. To test low-noise SIS receivers, ameans of rapidly testing the frequency response of various receiver designswas needed. Fourier transform spectroscopy has been shown to be avery powerful tool in the performance analysis of SIS mixers[4; 5; 6; 7; 8; 9].Additionally, optical components such as �lters, lenses, and windowmaterials can be studied. A precise knowledge of the refractive index andabsorption coe�cient of such elements is important as receivers becomemore nearly quantum-limited: at 492GHz, Kooi et. al.[10] measured areceiver total noise temperature of 74K, of which 52K stems from opticallosses. In order to satisfy this variety of needs, we have constructed anFTS which is optimized for these kinds of studies.
A Fourier transform spectrometer is essentially a Michelsoninterferometer. It operates by separating the radiation from a source intotwo beams and then coherently recombining them to produce the outputbeam. Interference e�ects are produced by varying the relative length ofoptical paths traveled by the separate beams. When used without anysamples in the beam paths, the signal output of the (power) detector I ata given path di�erence � is:
I(�) /
Z1
0S(�)[1+ cos(2���)]d� (1)
where S is the detector response at wavenumber � (1=�). The Fouriertransform of this function gives the system e�ciency as a function offrequency:
S(�) /
Z1
�1
[I(�)�1
2I(0)] cos(2���)d�: (2)
It is thus possible to use Fourier transform spectroscopy to determine thespectral response of detectors, or, by placing an object in the combinedlight path and measuring response ratios, to determine the spectraltransmission of optics such as windows, lenses, and �lters.
To study the properties of SIS mixers at high frequencies (� 500GHz), an FTS with large throughput and high resolution is needed. Large
Int. J. IR MM Waves{ 2
throughput in the form of large mirrors is necessary to assure a good signalto noise ratio, through collecting light from a larger solid angle or reducingspillover. A resolution much better than the IF frequency (1.5 GHz) isrequired to resolve the sidebands from the local oscillator in a heterodynedetection. Since commercially available Fourier Transform Spectrometersare expensive and not particularly optimized for the aforementionedfeatures, an FTS was developed in our lab. This paper describes the FTSand gives some experimental results obtained with it, both of SIS directand heterodyne detection and optical measurements of dielectrics.
2. Construction of the FTS
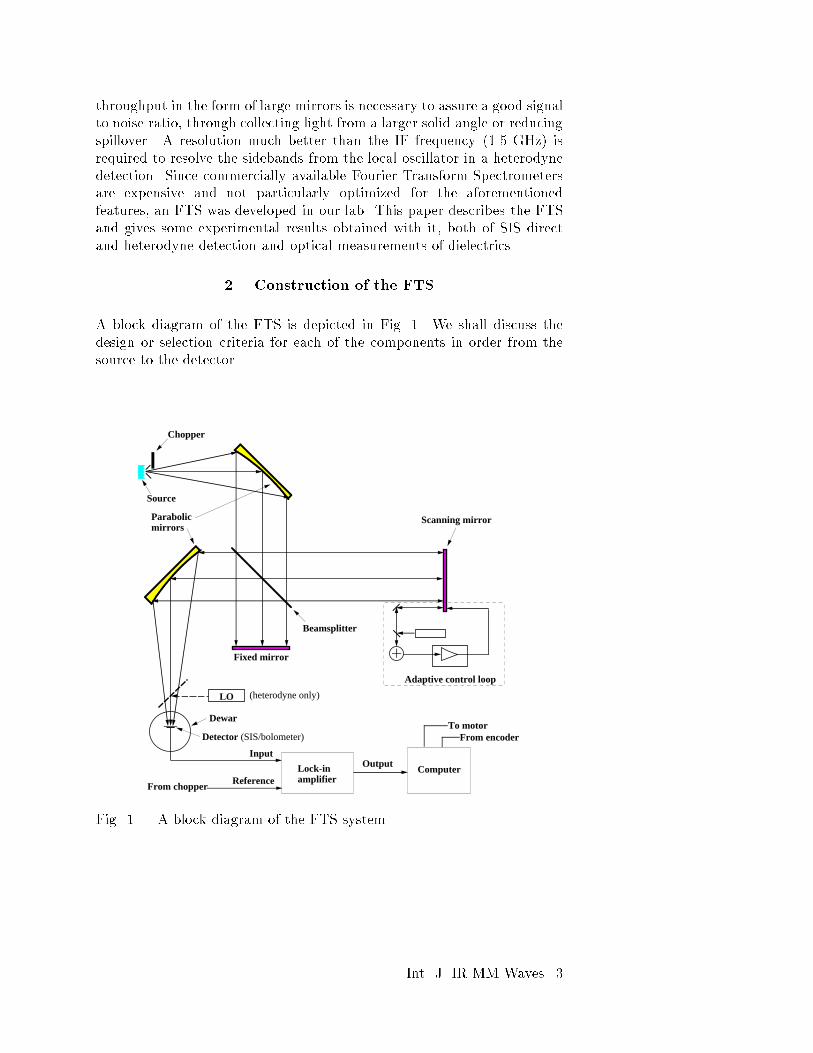
A block diagram of the FTS is depicted in Fig. 1. We shall discuss thedesign or selection criteria for each of the components in order from thesource to the detector.
Detector (SIS/bolometer)
Parabolicmirrors
Scanning mirror
Fixed mirror
Beamsplitter
Chopper
Source
From chopper
Input
ReferenceLock-in amplifier
OutputComputer
To motorFrom encoder
LO
Dewar
Adaptive control loop
(heterodyne only)
Fig. 1.| A block diagram of the FTS system.
Int. J. IR MM Waves{ 3

2.1. The Source
The source consists of hot and cold loads, with an optical chopper blade[12]
switching between the two at frequencies between � 5 and � 250 Hz. Thehot load is a low resistance coil of NiCr alloy in a ceramic housing cavity[13].When supplied with 6A AC (corresponding to 5 V AC), the temperature isnominally 1050�C. The temperature can be varied by changing the current.The cold load is an Eccosorb sheet[14] immersed in liquid nitrogen, servingas a 77 K blackbody. The source size is circular, about 1cm in diameter.For direct detection where the full source emitting area can reimaged onto asuitably-sized detector, an extended source causes the spectrum to spreadout towards lower frequencies. This spread is �� = �0(=2�), beingthe solid angle subtended by the source at the collimating mirror[15]. Inour FTS the source is about 64 cm away from the collimating mirror,so � �=(2 � 64)2 � 0:0002. Thus ��=�0 = 0:0002=2� � 3 � 10�5.For requirements of high resolution at high frequencies, an aperture canbe used to stop down the solid angle. Alternatively, a smaller detectorcan be used. The e�ect of �nite aperture size on throughput reductionbecomes signi�cant when the wavelength increases to about 1/10 of thesource aperture size, or about 1mm. For our FTS this sets a rough lowfrequency limit at � �> c=3 mm � 100 GHz (3.3 cm�1). The throughputof the FTS in the frequency region of interest is mainly determined by thebeamsplitter e�ciency.
2.2. The Mirrors and Beamsplitter
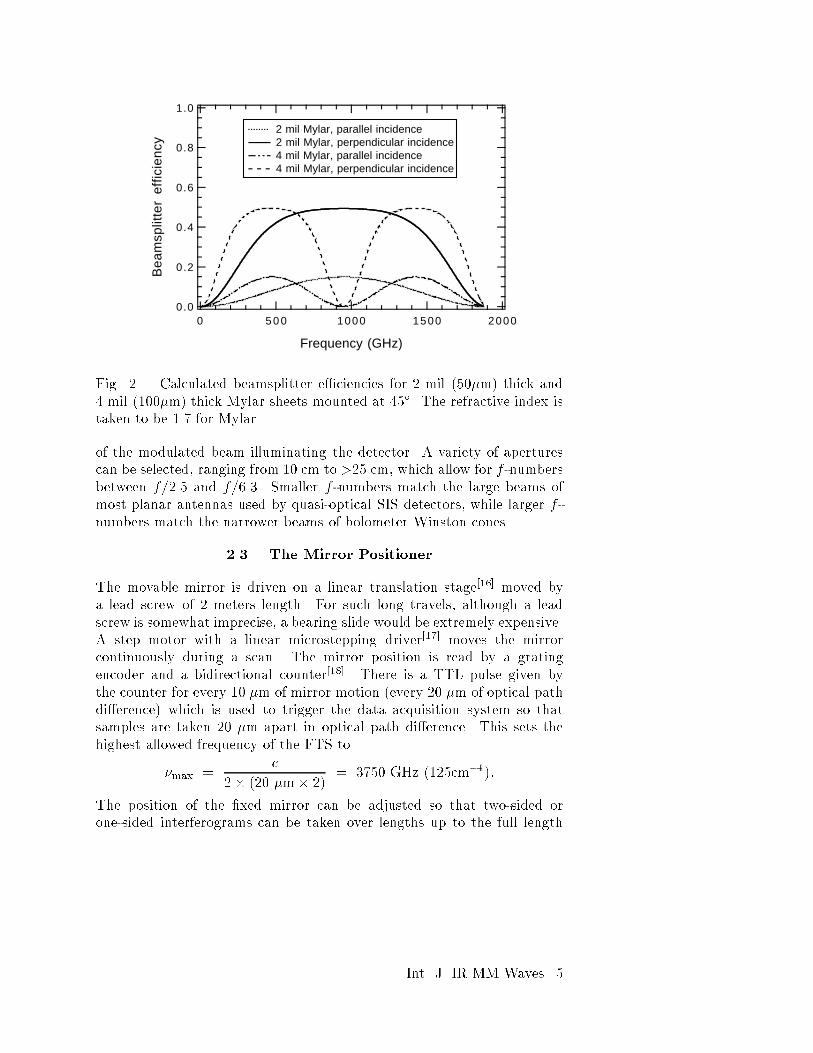
The 25.4�30.5 cm2 collimating mirror is a 45� o�-axis f/2.5 parabola,as is the focusing mirror. It was machined from an aluminum platewith a numerically controlled mill and gold-plated afterwards, with anestimated surface accuracy of about 3 �m. The �xed mirror and thescanning mirror are 25.4 � 25.4 cm square optical-quality �rst surfaceglass mirrors. The beamsplitter is a 35.6 cm diameter sheet of Mylar on aframe which is mounted against an annular knife-edge (rounded to preventshearing the thin material); the knife-edge tensions the Mylar, holdingit at. Fig. 2 shows the beamsplitter e�ciency calculated for 50�m and100�m thick Mylar sheets. The 50�m sheet is the standard thickness,chosen for operation in the 300-1500 GHz (10-50 cm�1) range, althoughvarious applications have used sheet thicknesses between 25�m and 250�m.
An adjustable aperture is made from a set of Eccosorb-coatedaluminum sheet metal in the collimated beam between the beamsplitterand the focusing mirror. This aperture can be used to de�ne the f -number
Int. J. IR MM Waves{ 4
1.0
0.8
0.6
0.4
0.2
0.0
Bea
msp
litte
r ef
ficie
ncy
2000150010005 0 00
Frequency (GHz)
2 mil Mylar, parallel incidence 2 mil Mylar, perpendicular incidence 4 mil Mylar, parallel incidence 4 mil Mylar, perpendicular incidence
Fig. 2.| Calculated beamsplitter e�ciencies for 2 mil (50�m) thick and4 mil (100�m) thick Mylar sheets mounted at 45�. The refractive index istaken to be 1.7 for Mylar.
of the modulated beam illuminating the detector. A variety of aperturescan be selected, ranging from 10 cm to >25 cm, which allow for f -numbersbetween f/2.5 and f/6.3. Smaller f -numbers match the large beams ofmost planar antennas used by quasi-optical SIS detectors, while larger f -numbers match the narrower beams of bolometer Winston cones.
2.3. The Mirror Positioner
The movable mirror is driven on a linear translation stage[16] moved bya lead screw of 2 meters length. For such long travels, although a leadscrew is somewhat imprecise, a bearing slide would be extremely expensive.A step motor with a linear microstepping driver[17] moves the mirrorcontinuously during a scan. The mirror position is read by a gratingencoder and a bidirectional counter[18]. There is a TTL pulse given bythe counter for every 10 �m of mirror motion (every 20 �m of optical pathdi�erence) which is used to trigger the data acquisition system so thatsamples are taken 20 �m apart in optical path di�erence. This sets thehighest allowed frequency of the FTS to
�max =c
2� (20 �m� 2)= 3750 GHz (125cm�1):
The position of the �xed mirror can be adjusted so that two-sided orone-sided interferograms can be taken over lengths up to the full length
Int. J. IR MM Waves{ 5
of the scanning mirror travel. Only two-sided interferograms have beenemployed on this FTS. The advantage of taking two-sided interferogramsis that one can correct for the phase error distortion in the spectrumcaused by an o�set of the �rst sample from the true zero optical pathdi�erence position[19]. A second advantage is that it helps average outthe e�ect of any experimental asymmetries of the interferogram due toimperfect atness or misalignment of components[20]. In order to use theFFT algorithm[21] to process the data, the number of data points should be2n, with n an integer. For our two-sided interferograms, the longest usablescan length is limited to � 2 meters (n=32, with the necessary extra datapadded with zeros). The highest frequency resolution is therefore [15]
�� =c
2�max: optical path di�erence= 75 MHz (0:0025cm�1):
This resolution can be reduced in steps of factors of 2 from �� = 114 MHz(0.004 cm�1) to �� = 29:3 GHz (� 1 cm�1), although intermediateresolutions can also be used if a modi�ed FFT algorithm is used.
2.4. Electronic Control and Readout
The signal from the detector is sent to the input of a digital lock-inampli�er[22], which uses a reference signal synchronized to the choppingbetween the hot and cold loads. The integration time constant of the lock-in is determined by the user to obtain a desirable signal to noise ratio.The speed of the scanning mirror is then set accordingly, so that the stepperiod of the mirror is twice the integration time constant.
An Apple PowerMac 7100 serves as the computer for the FTS systemcontrol and data acquisition. A graphical user interface allows theoperator to position the optics, set the parameters for an FTS scan,and perform the data analysis to measure a spectrum. The control,data acquisition and processing software is written in the LabVIEWprogramming environment[23] and provides real-time updating of theinterferogram as it is being taken.
2.5. Other FTS Hardware
The whole FTS system is built on a 2�4 meter optical table. The opticalcomponents of the FTS system are encased in an airtight box made from6mm thick acrylic sheets on a rigid acrylic frame. The box is purgedwith dry nitrogen and held at slightly over atmospheric pressure duringFTS experiments to keep water absorption low. The box is sealed with
Int. J. IR MM Waves{ 6
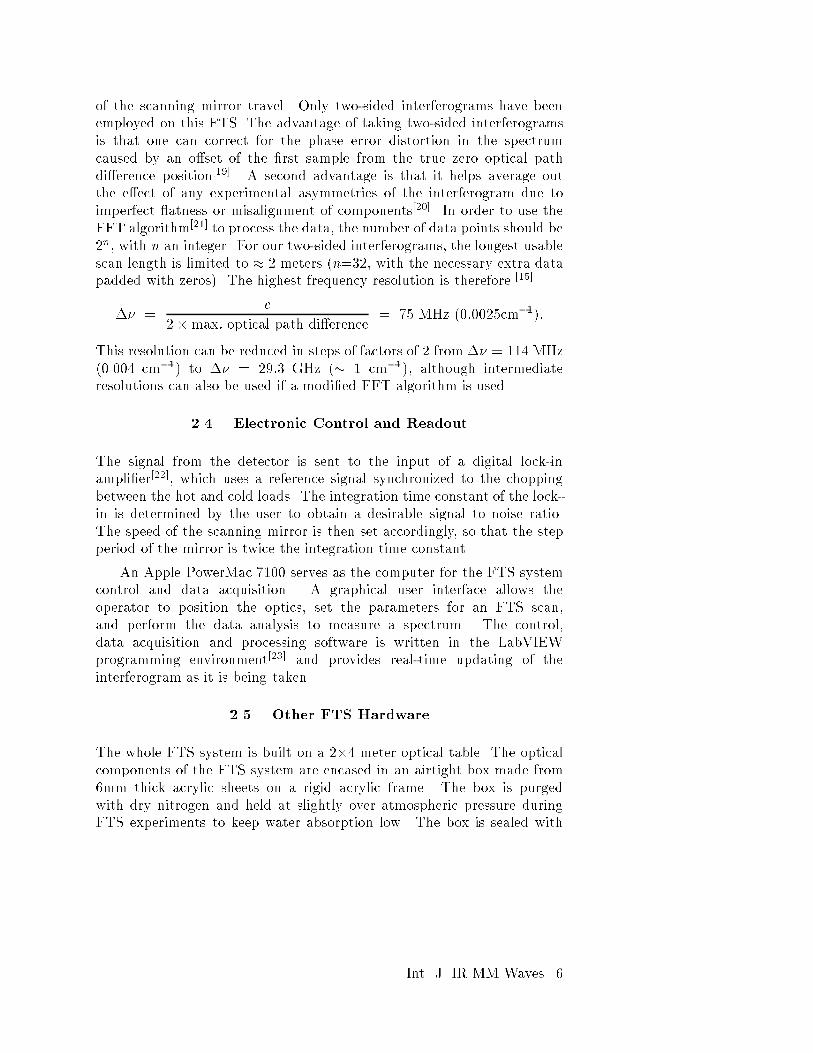
acrylic glue and silicone rubber, with vent ports to prevent overpressuring.Gasket-sealed portholes allow access to the beamsplitter, aperture, andsource areas for exchanging and servicing of components. Liquid nitrogenis piped into the cold load dewar ask through a permanent stainless steeltube. Water vapor is strongly absorptive in the submillimeter, with broadabsorption features at 557, 752, 988, and above 1100 GHz, as shown in�gure 3. Because of the di�erence in absorption in the two arms of theinterferometer, even small absorption losses (�< 10%) adversely a�ect thequality of the data. Liquid nitrogen from a 160 liter dewar is turned intoroom temperature vapor through a 15 meter coiled copper pipe, immersedin temperature-controlled antifreeze. A needle valve controls the ow rate.The time to dry the box is �6 hours at 25% maximum ow, with anultimate relative humidity of < 2% as measured by a capacitive humiditymeter[24].
Fig. 3.| Calculated transmission of the FTS at 2% relative humidity (solidline) and 50% (dotted line), corresponding to a path length of roughly 3meters.
2.6. FTS alignment
It is critical to have the movable mirror and �xed mirror each perpendicularto the incident radiation beams. Mirror tilt and lack of alignment ofone mirror relative to the other can seriously a�ect the e�ciency of the
Int. J. IR MM Waves{ 7
interfero
meter.
Thereq
uirem
entfor
alignmentisthat
attheexitport
thewave
frontsofthetwobeam
smustbeparallel
tomuch
better
than
awavelen
gth
acrossthewhole
apertu
re.Itcan
beshow
nthat
atilt
angle
�betw
eenthetwomirro
rscauses
reduction
inthespectru
mam
plitu
de
andcancause
asymmetries
intheinterferogram
[25].
Theam
plitu
deof
aspectru
mat
waven
umber
�will
bered
uced
tozero
when
��l=1=2,
i.e.,
�=0:5�=l,where
listhelinearsize
ofthemirror,
25.4cm.Theam
plitu
de
will
be95%
ofits
originalvalu
eif�=0:088
�=land50%
if�=0:30
�=l.
Athigher
frequencies,
thealign
mentreq
uirem
enton
�ismore
stringen
t.
Thealign
mentofthesca
nningmirror
variesas
themirror
movesalon
gthetran
slation
stage,
dueto
thenonlinearity
inthe2meter
leadscrew
.Over
theentire
scandista
nce
thechange
inthenorm
alisas
largeas
1.7mrad,which
corresp
ondsto
azero
amplitu
deresp
onse
at350
GHz.
To
reduce
thisangle
anoptica
lfeed
back
control
system
was
constru
cted.
Scanning Mirror
Piezo A
ctuators
He N
e Laser
Electronics
Control B
ox ∆θx
∆θy
Quadrant
Detector
Beam
Splitter
Beam
splitter
Wall 4m
away
(for visual check)
12
34
Encoder
(1+3)-(2+4)
(1+2)-(3+4)
Translation stage
Mirror
holder
Fig.
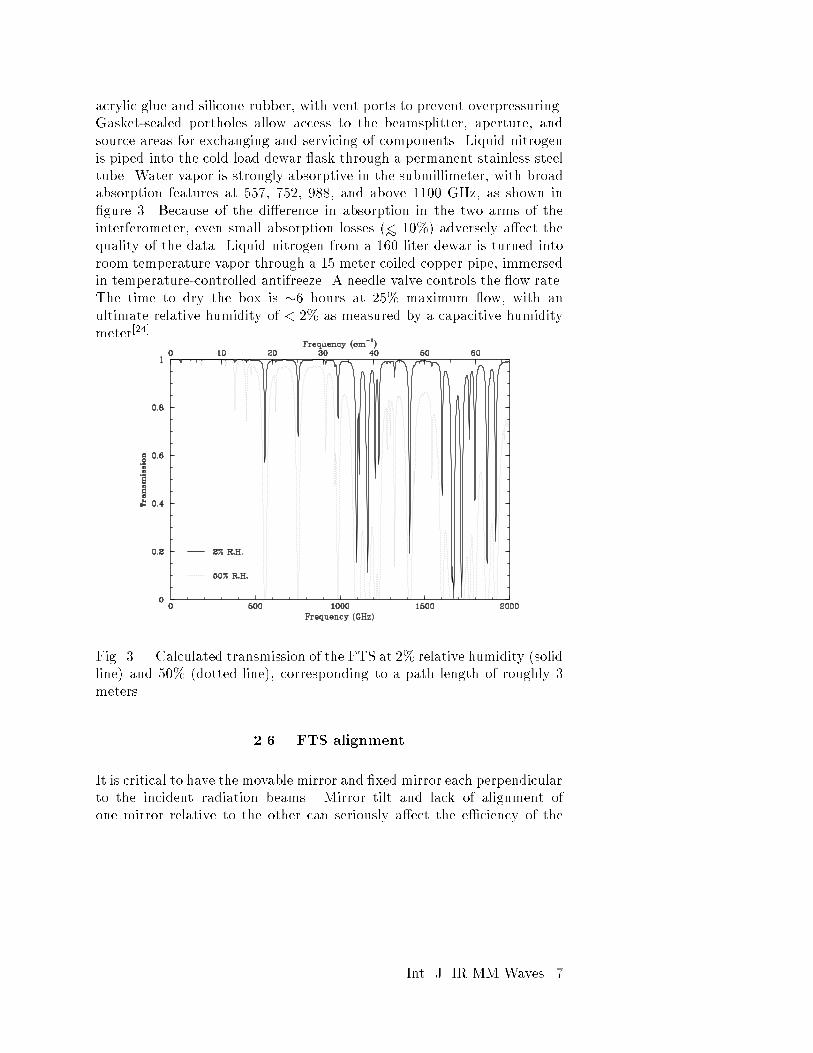
4.|
Block
diagram
oftheoptica
lcon
trolsystem
forthemovingmirror
inthelab
FTSsystem
Fig.
4show
stheblock
diag
ram
ofthis
feedback
control
system
.Nega
tivefeed
back
isused
tosta
bilize
thenorm
alwhen
themirror
ismoving.
Atwo-a
xistilt
position
erequipped
with
twopiezotran
slators[26]
hold
stheback
ofthemirror
tothemirror
support.
Byapplyingvoltage
tothetwopiezo
electricactu
ators,th
emirror
canbeadjusted
inthehorizon
tal
Int.J.IR
MM
Waves{
8
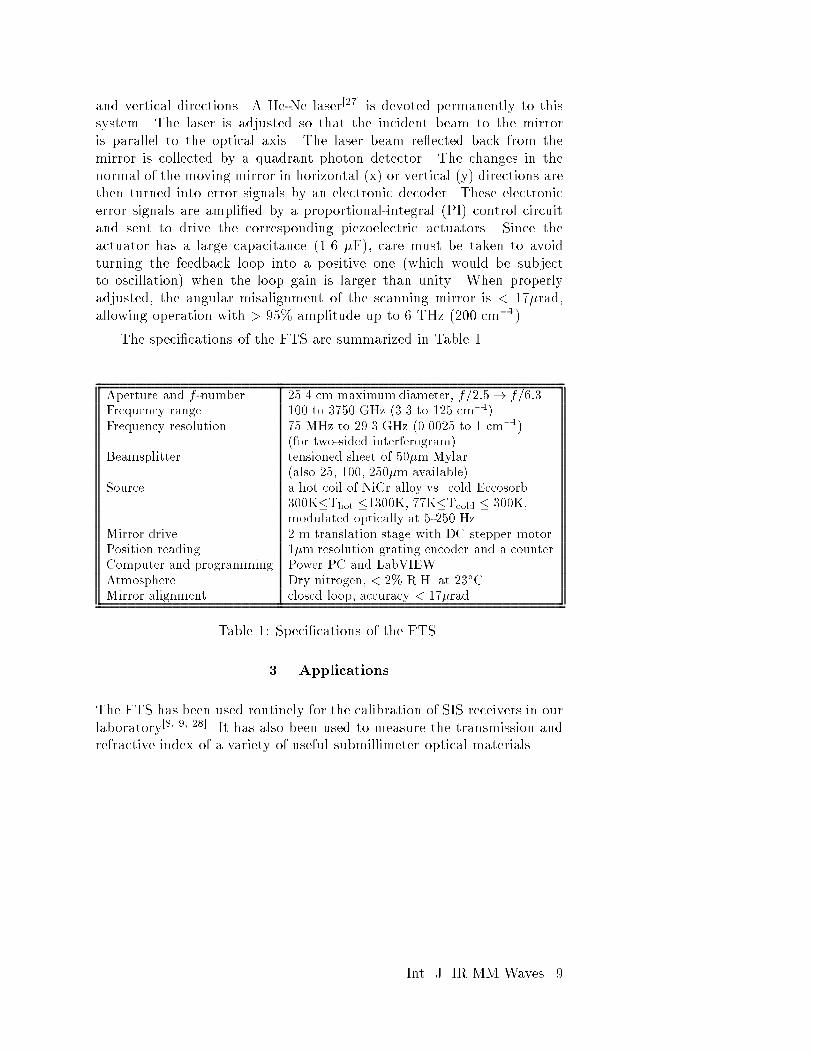
and vertical directions. A He-Ne laser[27] is devoted permanently to thissystem. The laser is adjusted so that the incident beam to the mirroris parallel to the optical axis. The laser beam re ected back from themirror is collected by a quadrant photon detector. The changes in thenormal of the moving mirror in horizontal (x) or vertical (y) directions arethen turned into error signals by an electronic decoder. These electronicerror signals are ampli�ed by a proportional-integral (PI) control circuitand sent to drive the corresponding piezoelectric actuators. Since theactuator has a large capacitance (1.6 �F), care must be taken to avoidturning the feedback loop into a positive one (which would be subjectto oscillation) when the loop gain is larger than unity. When properlyadjusted, the angular misalignment of the scanning mirror is < 17�rad,allowing operation with > 95% amplitude up to 6 THz (200 cm�1).
The speci�cations of the FTS are summarized in Table 1.
Aperture and f-number 25.4 cm maximum diameter, f=2:5! f=6:3Frequency range 100 to 3750 GHz (3.3 to 125 cm�1)Frequency resolution 75 MHz to 29.3 GHz (0.0025 to 1 cm�1)
(for two-sided interferogram)Beamsplitter tensioned sheet of 50�m Mylar
(also 25, 100, 250�m available)Source a hot coil of NiCr alloy vs. cold Eccosorb
300K�Thot �1300K, 77K�Tcold � 300K,modulated optically at 5-250 Hz.
Mirror drive 2 m translation stage with DC stepper motorPosition reading 1�m resolution grating encoder and a counterComputer and programming Power PC and LabVIEWAtmosphere Dry nitrogen, < 2% R.H. at 23�CMirror alignment closed loop, accuracy < 17�rad
Table 1: Speci�cations of the FTS
3. Applications
The FTS has been used routinely for the calibration of SIS receivers in ourlaboratory[8; 9; 28]. It has also been used to measure the transmission andrefractive index of a variety of useful submillimeter optical materials.
Int. J. IR MM Waves{ 9
3.1.
Directdetectio
n
Usin
gSIS
junction
sasdirect
detecto
rson
anFTScan
yield
inform
ationontheSIS
mixer's
frequency
responseandthuson
theperform
ance
ofthe
tuningcircu
its[4
;5;6;7;8;9].
Thisisan
e�ectiv
eway
tocheck
ontuning
circuitdesign
andaquick
way
toscreen
mixers.
420
-2-4
Interferogram signal (a.u.)
-4
-2
02
4
Sca
nn
ing
m
irror
po
sition
(m
m)
43210
Corrected spectrum (a.u.)
80
06
00
40
02
00F
requency (GH
z)
(b)
(a)
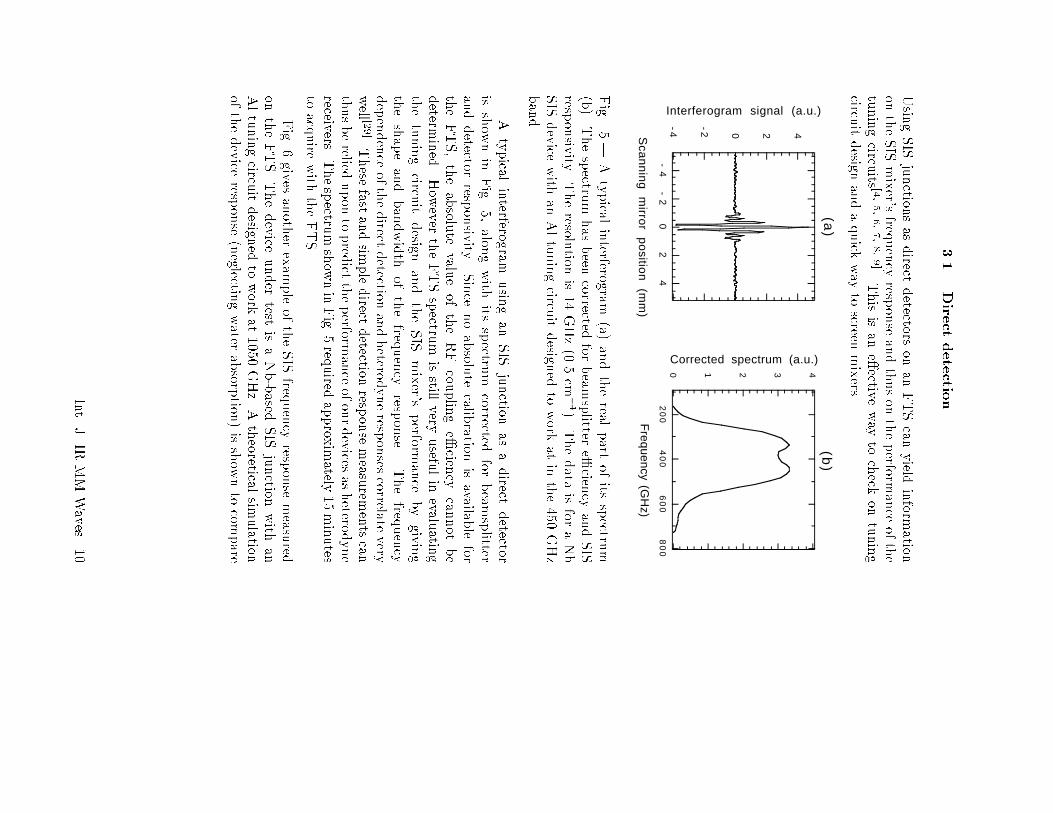
Fig.
5.|A
typical
interfero
gram(a)andthereal
part
ofits
spectru
m(b).
Thespectru
mhasbeen
correctedfor
beam
splitter
e�cien
cyandSIS
responsiv
ity.Thereso
lution
is14GHz(0.5
cm�1).
Thedata
isfor
aNb
SIS
device
with
anAltuningcircu
itdesign
edto
work
atin
the450
GHz
band.Atypica
linterfero
gramusin
ganSIS
junction
asadirect
detector
isshow
nin
Fig.
5,alo
ngwith
itsspectru
mcorrected
forbeam
splitter
anddetector
responsiv
ity.Since
noabsolu
tecalib
rationisavailab
lefor
theFTS,theabsolute
valueoftheRF
couplinge�
ciency
cannot
be
determ
ined.How
evertheFTSspectru
misstill
veryusefu
lin
evaluatin
gthetuningcircu
itdesig
nandtheSIS
mixer's
perform
ance
bygiv
ing
theshapeandbandwidth
ofthefreq
uency
response.
Thefreq
uency
dependence
ofthedirect
detection
andhetero
dyneresp
onses
correlatevery
well [2
9].These
fastandsim
pledirect
detection
responsemeasu
rementscan
thusberelied
upon
topred
icttheperfo
rmanceofourdevices
ashetero
dyne
receivers.
Thespectru
mshow
ninFig.5
required
approx
imately
15minutes
toacq
uire
with
theFTS.
Fig.
6gives
anoth
erexam
pleoftheSIS
frequency
response
measu
redontheFTS.Thedevice
under
testisaNb-based
SIS
junction
with
anAltuningcircu
itdesig
ned
towork
at1050
GHz.
Atheoretical
simulation
ofthedevice
response
(neglectin
gwater
absorp
tion)isshow
nto
compare
Int.J.IR
MM
Waves{
10

0.4
0.3
0.2
0.1
0.0
RF
cou
plin
g ef
ficie
ncy
140012001000800600400
Frequency (GHz)
1.0
0.8
0.6
0.4
0.2
0.0
Atm
osph
ere
tran
smis
sion
Device: 1028-20,15 FTS results Simulation Water lines
Fig. 6.| The spectrum of a Nb SIS device with Al tuning circuit designedto work at 1050 GHz. The frequency resolution for this spectrum is 3 GHz(0.1 cm�1).
with the measurement[30]. The line absorptions due to residual water inthe FTS system become severe at the high frequency end.
3.2. Heterodyne detection with an FTS
Early SIS receivers had narrow instantaneous bandwidths due to the lackof on-chip tuning circuits, thus it was important to know if the responseof each of two sidebands was the same for a given setting of the waveguidebackshorts. Even with modern broadband SIS mixers which do not needadjustable backshorts, it is still of interest to see that the responses of thetwo sidebands �t theory, as the frequency separation of the sidebands isincreasing due to the demand for larger IF bandwidths. Heterodyne testswith the FTS provide such a measurement.
The setup for a heterodyne test on the FTS is identical to the direct-detection case except that a local oscillator is introduced by a beamsplitterin front of the dewar window, and the signal is taken at the IF poweroutput. The incoming radiation from the FTS is same as in direct detectionmode, using a chopped hot-cold load.
A heterodyne FTS interferogram and its spectrum are shown in Fig. 7.The device is an all-Nb SIS mixer which was designed to work in the
Int. J. IR MM Waves{ 11

4
3
2
1
0-0.4 -0.2 0.0 0.2 0.4
4 0
3 0
2 0
1 0
0
748744740736
a)
b )4 0
3 0
2 0
1 0
0
Spe
ctru
m (
a.u.
)
40003000200010000
Frequency (GHz)
4
3
2
1
Sig
nal
(a.u
.)
-600 -400 -200 0 2 0 0 4 0 0 6 0 0
Scanning mirror position (mm)
Fig. 7.| Heterodyne FTS interferogram (a) and spectrum (b) showing twosidebands. The device is an all-Nb SIS mixer optimized for the 750 GHzband.
750 GHz band[9]. Since the IF ampli�er is centered at 1.5 GHz with abandwidth of 500 MHz, a resolution of 114 MHz was used in order toseparate the two sidebands. The LO frequency for this test is 742 GHz.The FTS interferogram (Fig. 7a) shows the high frequency oscillationscharacteristic of the 742 GHz LO (see inset), modulated by the 3 GHzsideband separation and 500 MHz IF bandwidth. The spectrum (Fig. 7b)clearly shows signi�cant response only near the LO frequency. The IFbandwidth and double-sideband operation are evident from the inset.The negative sidelobes are due to the �nite interferogram and the chosenapodization procedure in performing the inverse Fourier transform. Theupper sideband peak is weaker than the lower sideband peak because ofthe absorption from the broad wing of the 752 GHz water line; in 10%humidity the ratio of atmospheric transmission is almost a factor of two.
Int. J. IR MM Waves{ 12
3.3. Material Measurements
A bolometric detector is also available for use with the FTS. Theinstrument uses a commercially available 1.4K bolometer, Winston coneand cold ampli�er[31]. In order that the light from the FTS goes throughthe samples in a collimated beam, an o�-axis paraboloidal mirror is usedto reimage the FTS output light at f=4:0 into the dewar where an image ofthe aperture stop is placed �2 cm in front of the Winston cone aperture.At this point, there is a rotatable �lter wheel containing 5 samples andone open port, all cooled to 1.4K. The Winston cone aperture is largeenough to accept the collimated beam directly. The ampli�ed output ofthe bolometer is lock-in detected, and two scans are taken, one with asample in the beam and one without. The two are ratioed to �nd theabsolute transmission of the material which, combined with the thicknessof the material (for the simple case of a slab), allows the determinationof the refractive index and absorption loss. These parameters have beenmeasured for a variety of optical components, such as lenses, �lters, andIR blocks[32].
0.01
0.1
1
10
100
200 400 600 800 1000 1200 1400
Abs
orpt
ion
Coe
ffic
ient
(ne
pers
/cm
)
Frequency (GHz)
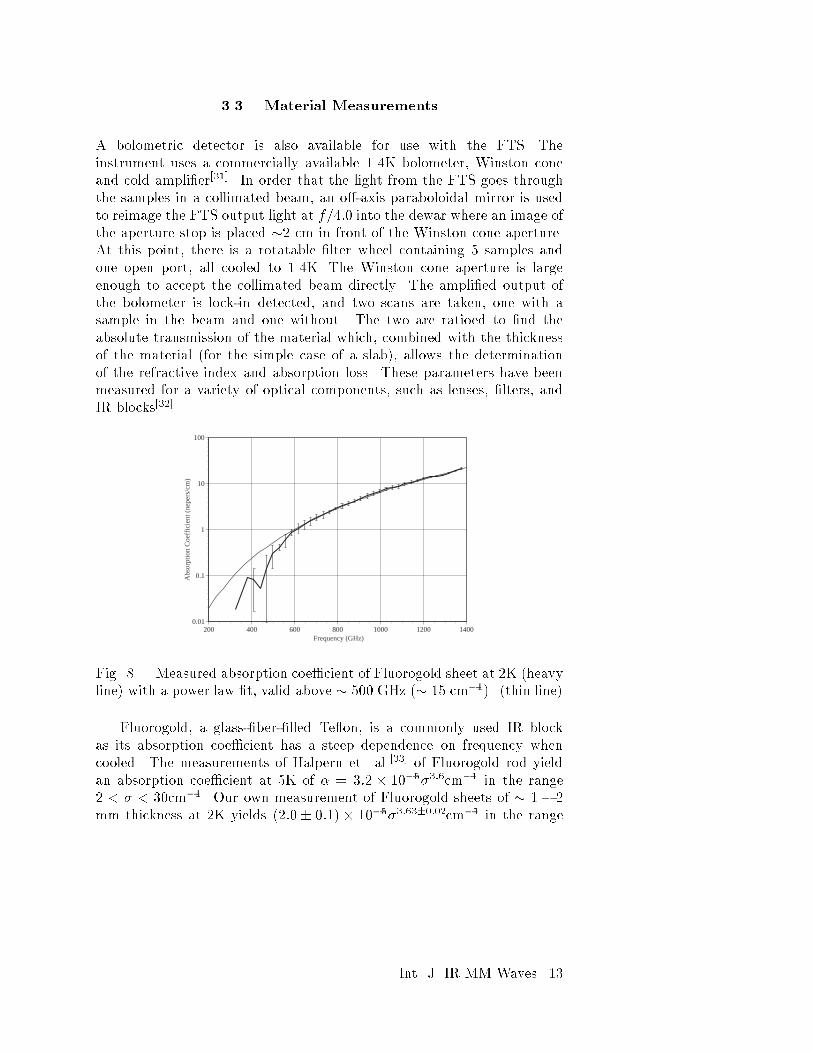
Fig. 8.| Measured absorption coe�cient of Fluorogold sheet at 2K (heavyline) with a power law �t, valid above � 500 GHz (� 15 cm�1). (thin line)
Fluorogold, a glass-�ber-�lled Te on, is a commonly used IR blockas its absorption coe�cient has a steep dependence on frequency whencooled. The measurements of Halpern et. al.[33] of Fluorogold rod yieldan absorption coe�cient at 5K of � = 3:2 � 10�5�3:6cm�1 in the range2 < � < 30cm�1. Our own measurement of Fluorogold sheets of � 1� 2mm thickness at 2K yields (2:0� 0:1)� 10�5�3:63�0:02cm�1 in the range
Int. J. IR MM Waves{ 13

15 < � < 45cm�1 as shown in Fig. 8. Our lower absorption coe�cient islikely due to a lower glass concentration in thin sheets as opposed to rod,as suggested by Halpern et. al.
3.4. Novel Filters
A harmonic �lter, tuned to harmonics of the 115 GHz (3.8 cm�1)rotational transition of CO[34], has been constructed using a matched pairof silicon disks acting as a double Fabry-Perot �etalon. The transmissionof this �lter was measured using the FTS and is shown in Fig. 9.The measured transmission (solid line) agrees remarkably well withthe theoretical transmission (dotted line). The rest frequencies of therotational transitions are shown at the top, indicating that the �lter passesthe desired frequencies while strongly rejecting the out-of-band frequencies.When used with a bolometric detector on an FTS at a submillimetertelescope, the background noise power will then be reduced by a factorof � 2, reducing the necessary integration time by a factor of 4. This �lterhas been used to measure simultaneously 4 CO transitions in absorptionin the atmosphere of Venus.
Fig. 9.| Transmission of a 115 GHz harmonic �lter. The solid line is theFTS measurement, compared to the theoretical transmission (dotted line).The rest frequencies of the rotational transitions of CO are shown at thetop.
Int. J. IR MM Waves{ 14
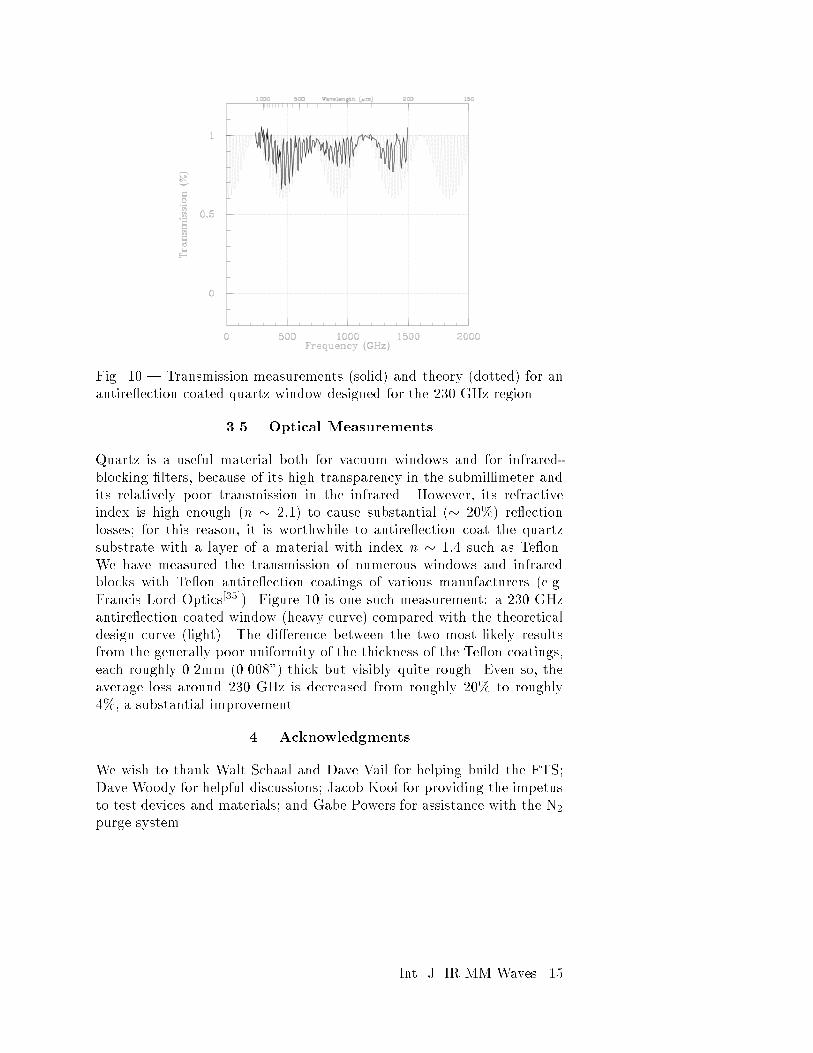
Fig. 10.| Transmission measurements (solid) and theory (dotted) for anantire ection coated quartz window designed for the 230 GHz region.
3.5. Optical Measurements
Quartz is a useful material both for vacuum windows and for infrared-blocking �lters, because of its high transparency in the submillimeter andits relatively poor transmission in the infrared. However, its refractiveindex is high enough (n � 2:1) to cause substantial (� 20%) re ectionlosses; for this reason, it is worthwhile to antire ection coat the quartzsubstrate with a layer of a material with index n � 1:4 such as Te on.We have measured the transmission of numerous windows and infraredblocks with Te on antire ection coatings of various manufacturers (e.g.Francis Lord Optics[35]). Figure 10 is one such measurement: a 230 GHzantire ection coated window (heavy curve) compared with the theoreticaldesign curve (light). The di�erence between the two most likely resultsfrom the generally poor uniformity of the thickness of the Te on coatings,each roughly 0.2mm (0.008") thick but visibly quite rough. Even so, theaverage loss around 230 GHz is decreased from roughly 20% to roughly4%, a substantial improvement.
4. Acknowledgments
We wish to thank Walt Schaal and Dave Vail for helping build the FTS;Dave Woody for helpful discussions; Jacob Kooi for providing the impetusto test devices and materials; and Gabe Powers for assistance with the N2
purge system.
Int. J. IR MM Waves{ 15

REFERENCES
[1] D. B. Rutledge and M. S. Muha, "Imaging Antenna Arrays", IEEETrans. Antennas and Propagation, vol. 30, pp. 535-540, 1982
[2] G. M. Rebeiz, "Millimeter-Wave and Terahertz Integrated CircuitAntennas", Proc. IEEE, vol. 80, pp. 1748-1770, 1992
[3] J. Zmuidzinas and H. G. LeDuc, \Quasi-Optical Slot Antenna SISMixers," IEEE Trans. Microwave Theory Tech., vol. 40, pp. 1797-1804,1992
[4] Q. Hu, C. A. Mears, and P. L. Richards, \Measurements of integratedtuning elements for SIS mixers with a Fourier transform spectrometer,"Int. J. IR and MM Waves, vol. 9, no. 4, pp. 303-320, 1988
[5] T. H. B�uttgenbach, R. E. Miller, M. J. Wengler, D. M. Watson, andT. G. Phillips, \A broadband low-noise SIS receiver for submillimeterastronomy," IEEE Trans. Microwave Theory Tech., vol. 36, no. 12, pp.1720-1726, 1988
[6] G. de Lange, J. J. Kuipers, T. M. Klapwijk, R. A. Panhuyzen, H. van deStadt, and M. W. M. de Graauw, \Superconducting resonator circuitsat frequencies above the gap frequency,"J. Appl. Phys., vol. 77, no. 4,pp. 1795-1804, 1995
[7] V. Y. Belitsky, S. W. Jacobsson, L. V. Filippenko, C. Holmstedt, V. P.Koshelets, and E. L. Kollberg, \Fourier transform spectrometer studies(300 -1000 GHz) of Nb-based quasi-optical SIS detectors," IEEE Trans.
Appl. Superconductivity, vol. 5, no. 3, pp. 3445-3451, 1995[8] M. Bin, M. C. Gaidis, J. Zmuidzinas, T. G. Phillips, and H. G. LeDuc,
\Low-noise 1 terahertz niobium superconducting tunnel junction mixerwith a normal metal tuning circuit," Appl. Phys. Lett., vol. 68, no. 12,pp. 1714-1716, 1996
[9] M. C. Gaidis, H. G. LeDuc, M. Bin, D. Miller, J. A. Stern, and J.Zmuidzinas, \Characterization of low-noise quasi-optical SIS mixers forthe submillimeter band," IEEE Trans. Microwave Theory Tech., vol.44, no. 7, pp. 1130-1139, 1996
[10] J.W. Kooi, M. Chan, B. Bumble, H.G. LeDuc, P. Scha�er, andT.G. Phillips, \230 and 492 GHz low-noise SIS wave-guide receiversemploying tuned NB/AlOx/Nb tunnel-junctions", Int. J. IR and MM
Waves vol. 16, pp. 2049-2068, 1995[11] E. Serabyn, T. G. Phillips, and C. R. Masson, \Surface �gure
measurements of radio telescopes with a shearing interferometer," Appl.Optics, vol. 30, no. 10, pp. 1227-1241, 1991
[12] SR-540 Optical Chopper, Stanford Research Systems, 1290-DReamwood Ave., Sunnyvale, CA 94089
[13] Filament #17-1079, Perkin Elmer Corp., 7421 Orangewood Ave.,
Int. J. IR MM Waves{ 16

Garden Grove, CA 92641.[14] Eccosorb AN-72, Emerson & Cuming, 869 Washington St., Canton,
MA 02021.[15] R. J. Bell, Introductory Fourier transform spectroscopy, Academic
Press: New York and London, 1972[16] Electric Cylinder model RS-2205 A-MS5-HC-Q2, Industrial Devices
Corporation, 64 Digital Drive, Novato, CA 94949; (800) 747-0064[17] Compumotor Low-Noise linear microstepping ampli�er (LN Drive),
Compumotor Division of Parker Hanni�n, 5500 Business Park Drive,Rohnert Park, CA 94928
[18] Linear Encoder LS-603, Bidirectional Counter VRZ-405, HeidenhainCorporation, 115 Commerce Drive, Schaumburg, IL 60173
[19] H.W. Schnopper & R.I. Thompson, \Fourier Spectrometers," inMethods of Experimental Physics 12A: Astrophysics, ed. by N. Carleton,Academic Press Inc., New York, 1974
[20] P. L. Richards, \Fourier transform spectroscopy," in Spectroscopic
Techniques for Far-infrared, Submillimeter, and Millimeter Waves,ed. by D. H. Martin, North-Holland Pub. Co., New York Wiley:Amsterdam, 1967
[21] O. E. Brigham, The fast Fourier transform, Englewood Cli�s, N. J.,Prentice-Hall, 1974
[22] SR-830 Lock In Ampli�er, Stanford Research Systems, 1290-DReamwood Ave., Sunnyvale, CA 94089
[23] LabVIEW, National Instruments, 6504 Bridge Point Parkway, Austin,TX 78730-5039 (512) 794-0100
[24] P-37951-00 Thermohygrometer, Cole-Parmer Instrument Co., 625 E.Bunker Ct., Vernon Hills, IL 60061
[25] Charles S. Williams, \Mirror misalignment in Fourier spectroscopyusing a Michelson interferometer with circular aperture," Appl. Optics,vol. 5, no. 6, pp. 1084-85, 1966
[26] Piezoelectric Tilt Positioner P-840, Physik Instrumente, Main U.S.o�ce, 3001 Redhill Ave. Bldg. 5-102, Costa Mesa, CA 92626
[27] Model 1104P, Uniphase Lasers, 163 Baypointe Parkway, San Jose, CA95134
[28] J. W. Kooi, M. S. Chan, M. Bin, B. Bumble, and H. G. LeDuc,\The development of an 850 GHz waveguide receiver using tuned SISjunctions on 1�m Si3N4 membranes," Int. J. IR and MM Waves, vol.16, pp. 349-362, 1995
[29] M. Bin, M. C. Gaidis, J. Zmuidzinas, T.G. Phillips & H.G. LeDuc,\Quasi-optical SIS mixers with normal metal tuning structures," IEEETrans. Appl. Superconductivity, vol. 7, pp3584-3588, 1997
[30] M. Bin, M. C. Gaidis, D. Miller, J. Zmuidzinas, T. G. Phillips, and H.
Int. J. IR MM Waves{ 17
G. LeDuc, \Design and characterization of a quasi-optical SIS receiverfor the 1 THz band," Proc. Seventh Intl. Symp. Space Terahertz Tech.,March 12-14, 1996 Charlottesville, VA 22903
[31] Infrared Labs, 1808 East 17th Street, Tucson, AZ 85719-6505; (520)622-7074
[32] D. J. Benford, J. W. Kooi, and E. Serabyn, \Spectroscopicmeasurements of optical components around 1 Terahertz", Proc. NinthIntl. Symp. Space Terahertz Tech., March 1998, JPL, Pasadena, CA
[33] M. Halpern, H. P. Gush, E. Wishnow, and V. De Cosmo, AppliedOptics, vol. 25, no. 6, pp. 565-570, 1986
[34] D. J. Benford, S. Wu, J. Pardo and E. Serabyn, 1999, Applied Optics,in preparation
[35] Francis Lord Optics, 33 Higginbotham Rd., Gladesville NSW 2111,Australia; 001-61-9807-1444
Int. J. IR MM Waves{ 18