Embed Size (px)
Citation preview

A Leading Global Health Care Group
7. internationaler RBI SchuldscheintagMarch 8, 2017 – Stuttgart

Safe Harbor Statement
This presentation contains forward-looking statements that are subject to various risks and uncertainties. Future results could differ materially from those described in these forward-looking statements due to certain factors, e.g. changes in business, economic and competitive conditions, regulatory reforms, results of clinical trials, foreign exchange rate fluctuations, uncertainties in litigation or investigative proceedings, and the availability of financing. Fresenius does not undertake any responsibility to update the forward-looking statements contained in this presentation.
27. internationaler RBI Schuldscheintag, March 2017, © Fresenius SE & Co. KGaA

Agenda
1 Company Overview
2 Business Segments
Fresenius Medical Care
Fresenius Kabi
Fresenius Helios
Fresenius Vamed
3 Financial Overview
4 Financing Facilities and Debt Structure
5 Acquisition of Quirónsalud
6 Summary and Outlook
37. internationaler RBI Schuldscheintag, March 2017, © Fresenius SE & Co. KGaA

Company Overview
47. internationaler RBI Schuldscheintag, March 2017, © Fresenius SE & Co. KGaA

Fresenius Group: A Global Leader in Health Care Products and Services
Sales €29.1 bn, net income1 €2.7 bnin 2016
Strong and well-diversified portfolio
Leading market positions
Global presence
Long-term opportunities in growing, non-cyclical markets
€29.1 bnEurope38%
North America47%
Asia-Pacific10%
Latin America4%
Africa1%
57. internationaler RBI Schuldscheintag, March 2017, © Fresenius SE & Co. KGaA
1 – Net income incl. attributable to non-controlling interest

Sales 2016
EBITDA 2016
~ 31% 100% 77%3100%3
€16,181 m
€3,084 m
€6,007 m
€1,479 m
€5,843 m
€877 m
€1,160 m
€80 m
Market Cap.4 €24.4 bn
S&P:Moody‘s:Fitch:
BBB- stableBaa3 stableBBB- stable
Sales 2016 €29.1 bn EBITDA €5.5 bnMarket Cap.1 €42.2 bnGroup EV2 €77.7 bn
67. internationaler RBI Schuldscheintag, March 2017, © Fresenius SE & Co. KGaA
Fresenius Group: Strong and Balanced Health Care Portfolio
1 – Based on market capitalization of FSE as of March 01, 2017 2 – Based on consolidated market capitalization of FSE and FME as of March 01, 2017 and Pro Forma consolidated net debt as of January 31, 2017 3 – Held by Fresenius ProServe GmbH, a wholly owned subsidiary of FSE4 – Based on market capitalization of FME as of March 01, 2017

2011 2012 2013 2014 2015 LTMJune2016
€ million
Sales 12%
EBIT 11%
Net Income 14%
+6% cc
+10% cc
+15% cc
20,331
3,045
1,778
16,361
2,563
1,408
19,290
3,075
1,707
29,038
4,327
2,694
23,231
3,158
1,831
3
5yr CAGR
7
27,626
3,958
2,362
1,2
1
7. internationaler RBI Schuldscheintag, March 2017, © Fresenius SE & Co. KGaA
Fresenius Group: Financial Results
2011 20132012 20152014 2016
1 – Before special items2 – Incl. attributable to non-controlling interest3 – 2011 sales were adjusted by -€161 m according to a U.S. GAAP accounting change
This solely relates to Fresenius Medical Care North America

87. internationaler RBI Schuldscheintag, March 2017, © Fresenius SE & Co. KGaA
Fresenius Group: Sustainable Organic Sales Growth
7%
8%
6%
3%
6%
7%
9%
6%
8% 8%
7%
4%
6%
4% 4%
6% 6%
2000 2001 2002 2003 2004 2005 2006 2007 2008 2009 2010 2011 2012 2013 2014 2015 2016

9
€ million
Fresenius Group:Key Financial Results 2016
2015 2016
Sales Net Income1,2EBIT1
+6% cc +10% cc +15% cc
3,958
4,327
2015 2016
27,626
29,083
2,362
2,694
2015 2016
7. internationaler RBI Schuldscheintag, March 2017, © Fresenius SE & Co. KGaA
1 – 2015 before special items2 – Incl. attributable to non-controlling interest, 2015 before special items

Business Segments
107. internationaler RBI Schuldscheintag, March 2017, © Fresenius SE & Co. KGaA

1970 1980 1990 2000 2010 2020E
Fresenius Medical Care: Global Market Leader in Dialysis
~3.8
2.0
0.9
0.5
0.10.01
Patients in million
~6% global patient growth p.a.~3.8 million patients by 2020 expected
World leader in dialysis products and services
treating 308,471 patients in 3,624 clinics worldwide1
Provides highest standard of patient care
Vertical integration High quality products & services Complete therapy offerings
Leader in growing market
Dialysis market growing 4% cc and estimated to reach around $100 bn by 2023
Patient growth driven by age, life style and higher life expectancy
Growth opportunities in emerging markets and value-based care
Industry Dynamics
117. internationaler RBI Schuldscheintag, March 2017, © Fresenius SE & Co. KGaA
1 – As of December 31, 2016

Europe, Middle East, AfricaProvider Patients Countries
59,800 26
22,600 15
19,500 1
19,200 22
7,000 1
4,800 4
2,300 3
Asia PacificProvider Patients Countries
29,300 12
5,600 6
5,200 1
4,100 1
3,300 5
610 2
North AmericaProvider Patients Countries
189,000 2
188,500 1
24,0002 1
15,2002 1
14,2002 1Other
7%
Latin AmericaProvider Patients Countries
30,400 7
8,600 3
5,100 3
5,200 2
1,530 2
12
Showai-Kai
7. internationaler RBI Schuldscheintag, March 2017, © Fresenius SE & Co. KGaA
Fresenius Medical Care: Leading in all Regions1
1 – Company data and internal estimates, as of December, 31 2016 (if not stated otherwise)2 – Company data and internal estimates, as of September, 30 2016

Fresenius Medical Care: Key Figures 2016
13
$ million 2016 2015 GrowthTotal Sales 17,911 16,738 +7%1
EBITDA 3,413 3,044 +12%margin 19.1% 18.2%
EBIT 2,638 2,327 +13%margin 14.7% 13.9%
Interest, net -406 -391 -4%
EBT 2,232 1,936 +15%
Taxes -683 -623 -10%
Non-controlling interest -306 -284 -8%
Net Income2 1,243 1,029 +21%3
7. internationaler RBI Schuldscheintag, March 2017, © Fresenius SE & Co. KGaA
1 – 7% organic growth, 1% acquisitions, -1% currency effects2 – Net income attributable to shareholders of Fresenius Medical Care AG & Co. KGaA3 – +16% adjusted by settlement costs for an agreement in principle related to GranuFlo in 2015 and acquisitions effects
Comprehensive product portfolio for critically and chronically ill patients:
Generic I.V. Drugs
Clinical Nutrition
Infusion Therapy
Medical Devices / Transfusion Technology
Global addressable market: >€33 bn
Leading market positions
Focus on organic growth driven by geographic product rollout and robust product pipeline
Aim to expand the business through selective acquisitions
€6.0 bn
2016 Sales by Region
Emerging Markets€1,702 m
28%
North America€2,170 m
36%
Europe€2,135 m
36%
147. internationaler RBI Schuldscheintag, March 2017, © Fresenius SE & Co. KGaA
Fresenius Kabi: A Worldwide Leading Hospital Supplier

742
893955
1,1011,143
1,084
1,446 1,479
2009 2010 2011 2012 2013 2014 2015 2016
3,086
3,6723,964
4,539
4,9965,146
5,950 6,007
2009 2010 2011 2012 2013 2014 2015 2016
24% 24% 24% 24%23%
21%
24%25%
2009 2010 2011 2012 2013 2014 2015 2016
Sales EBITDA1 EBITDA1 Margin
15
7-yr CAGR10%
7-yr CAGR10%
7. internationaler RBI Schuldscheintag, March 2017, © Fresenius SE & Co. KGaA
€ million € million
Fresenius Kabi: Strong Growth Track Record & High Profitability
1 – Before special items

Fresenius Kabi:Key Figures 2016
167. internationaler RBI Schuldscheintag, March 2017, © Fresenius SE & Co. KGaA
1 – 5% organic growth, -1% divestitures, -3% currency effects2 – Net income attributable to shareholders of Fresenius Kabi AG3 – 2015 before special items
€ million 2016 2015 GrowthTotal Sales 6,007 5,950 +1%1
EBITDA3 1,479 1,446 +2%margin 24.6% 24.3%
EBIT3 1,224 1,189 +3%margin 20.4% 20.0%
Interest, net -149 -184 +19%
EBT3 1,075 1,005 +7%
Taxes3 -323 -306 -6%
Non-controlling interest -36 -30 -20%
Net Income2,3 716 669 +7%

German Acute Care Hospital Market: ~€91 bn1, thereof 18% privatized
~6% share in German Acute Care Hospital Market
High-quality medical care
Solid organic growth based on growing number of admissions and reimbursement rate increases
Strong track record in hospital operations and acquisitions: targeting 12 − 15% EBIT margin within 6 years per individual clinic location
Negligible bad debt ratio due to comprehensiveinsurance coverage of German population
Largest Network with 112 Hospitals2
17
Maximum care hospitalsAcute care hospitalsAcute care hospitals/post-acute care clinicsPost-acute care clinicsCompany headquarters
7. internationaler RBI Schuldscheintag, March 2017, © Fresenius SE & Co. KGaA
Fresenius Helios: Leading Hospital Operator in Germany
1 – German Federal Statistical Office 2015; total costs, gross of the German hospitals less academic research and teaching2 – As of December 31, 2016

286318
369432
508
732
831877
2009 2010 2011 2012 2013 2014 2015 2016
Sales
7-yr CAGR13%
7-yr CAGR17%
187. internationaler RBI Schuldscheintag, March 2017, © Fresenius SE & Co. KGaA
€ millionEBITDA1
€ million
Fresenius Helios: Strong Growth Track Record & High Profitability
1 – Before special items2 – EBITDA Margin
2,416 2,520 2,665
3,200 3,393
5,244 5,578
5,843
2009 2010 2011 2012 2013 2014 2015 2016
~12%2
~15%2

197. internationaler RBI Schuldscheintag, March 2017, © Fresenius SE & Co. KGaA
1 – 4% organic growth, 1% acquisitions2 – Net income incl. attributable to shareholders of HELIOS Kliniken GmbH3 – 2015 before special items
€ million 2016 2015 GrowthTotal Sales 5,843 5,578 +5%1
EBITDA3 877 831 +6%margin 15.0% 14.9%
EBIT3 682 640 +7%margin 11.7% 11.5%
Interest, net -37 -48 +23%
EBT3 645 592 +9%
Taxes3 -100 -108 -7%
Non-controlling interest -2 -1 -100%
Net Income2,3 543 483 +12%
Fresenius Helios: Key Figures 2016

Specialized in project development, building hospital infrastructure and providing hospital services (technical services and operational management)
Track record:
>760 health care projects in 78 countries successfully completed
Services provided to > 550 hospitalsand 135,000 beds globally
Continuous demand for hospital infrastructure and operating efficiency
Key markets: Europe, Asia-Pacific, Africa
€1.2 bn
2016 Sales by Business
Services€566 m
49%
Projects€594 m
51%
207. internationaler RBI Schuldscheintag, March 2017, © Fresenius SE & Co. KGaA
Fresenius Vamed: A Leading Global Specialist in Hospital Projects and Services
Financial Overview
217. internationaler RBI Schuldscheintag, March 2017, © Fresenius SE & Co. KGaA

Fresenius Group: Key Figures 2016
22
€ million 2016 2015 Growth
Sales 29,083 27,626 +5%1
EBITDA2 5,500 5,073 +8%
EBIT2 4,327 3,958 +9%
Interest, net -582 -613 +5%
EBT2 3,745 3,345 +12%
Taxes2 -1,051 -983 -7%
Net Income2,3 2,694 2,362 +14%
Employees4 232,873 222,305
7. internationaler RBI Schuldscheintag, March 2017, © Fresenius SE & Co. KGaA
1 – 6% organic growth, 1% acquisitions, -1% divestitures, -1% currency effects2 – Before special items 3 – Net income incl. attributable to non-controlling interest4 – As of December, 31

3.2x
3.0x
2.7x
2.2x 2.3x
3.5x
3.0x
2.6x
3.6x
3.0x
2.6x
2.8x
2.5x 2.5x
3.4x
2.7x
2.4x
2.02.22.42.62.83.03.23.43.63.84.0
2001 2002 2003 2004 2005 Q1/06 2006 2007 2008 2009 2010 2011 2012 2013 2014 2015 2016
Fresenius Group: Proven Track Record of Deleveraging
Net Debt/EBITDA1
Acquisition of APP Pharmaceuticals
Acquisition ofRenal Care Group
Acquisition of hospitalsfrom Rhoen-Klinikum
23
Bottom half of 2.5-3.08
7. internationaler RBI Schuldscheintag, March 2017, © Fresenius SE & Co. KGaA
1 – At actual FX rates for both EBITDA and net debt2 – Pro forma acquisitions, before special items3 – Before special items4 – Adjusted due to debt issuance cost restatement (U.S. GAAP standard ASU 2015 – 03)5 – Pro forma excluding advances made for the acquisition of hospitals from Rhoen-Klinikum AG, before special items6 – Pro Forma the acquisition of Quirónsalud: 3.1x (at LTM average FX rates for both net debt and EBITDA)7 – Pro Forma acquisitions8 – Calculated at expected annual average exchange rates, for both net debt and EBITDA; without large unannounced acquisitions
2 2 2 4 2,4 4,5 2,4 3 6,7
Target 2017

Financing Facilities and Debt Structure
247. internationaler RBI Schuldscheintag, March 2017, © Fresenius SE & Co. KGaA
4
257. internationaler RBI Schuldscheintag, March 2017, © Fresenius SE & Co. KGaA
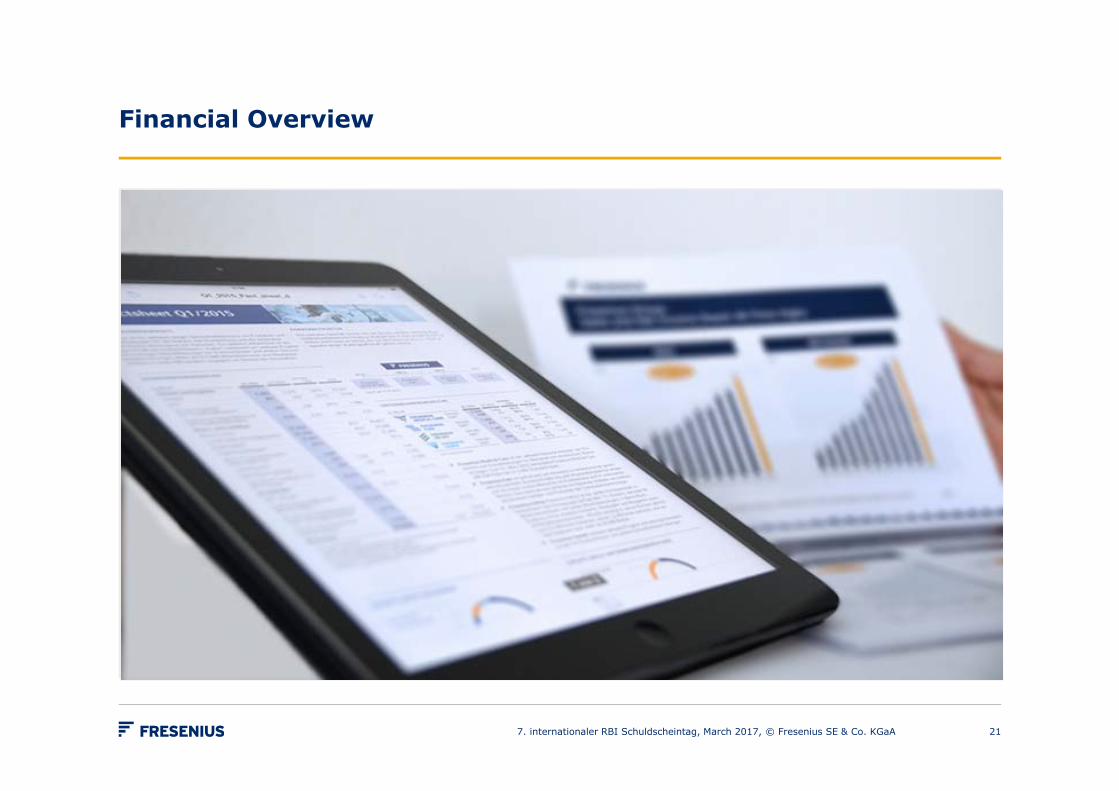
Fresenius Group: Capitalization – December 31, 2016 Pro Forma4
1 – Based on market capitalization for FSE and FMC as of March 01, 20172 – Before special items; pro forma acquisition of Quironsalud and FME acquisitions 3 – Exchange rate of 1.0541 as of December 31, 2016, except for market capitalization which uses exchange rate as of March 01, 20174 - Pro Forma the acquisition of Quironsalud: €2.6bn Senior Notes, €1.2bn Incremental credit facilities, €1.0bn Schuldschein loans, €500 million
Synthetic Convertible bonds, €110 million cash. Subject to working capital adjustments
in € million in $ million3 % of total cap EBITDA LTM x
FSE 2013 Credit Agreement: Revolver (€, US-$) 300 316 0.4% FSE 2013 Credit Agreement: Term Loan A (€, US-$) 2,487 2,622 3.2% Senior Notes (€, US-$) 5,369 5,659 6.9% Convertible Bonds 977 1,030 1.3% Schuldschein Loans 2,189 2,307 2.8% Commercial Paper 178 188 0.2% Other debt less total debt issuance costs, gross 496 523 0.6%
Total Debt (FSE excl. FMC), gross 11,996 12,645 15.4%
Cash (excl. FMC) 796 839 1.0%
Total debt (FSE excl. FMC), net 11,200 11,806 14.4%
Total FMC debt, net 7,423 7,825 9.6% Consolidation Adjustments (12) (13)
Total consolidated debt, net 18,611 19,618 24.0% 3.1x
Market capitalization1 59,066 62,215 76.0% 9.9x
Total capitalization 77,677 81,833 100.0% 13.0x FSE Group EBITDA2 Pro Forma 5,958

$ million
Maturity 2.9 years on
average
7. internationaler RBI Schuldscheintag, March 2017, © Fresenius SE & Co. KGaA 26
Fresenius Medical Care: Debt Maturity Profile1 December 31, 2016
1 – Based on utilization of major financing instruments
500822
1,064
500
966700
400
225
225
1,925
502
422
175
0
400
800
1,200
1,600
2,000
2,400
2,800
3,200
2017 2018 2019 2020 2021 2022 2023 2024
Senior Notes Credit Agreement Commercial Papers Equity-neutral convertible bonds A/R Facility

€ million
Maturity 4.9 years on
average
7. internationaler RBI Schuldscheintag, March 2017, © Fresenius SE & Co. KGaA 27
Fresenius Group excl. Fresenius Medical Care: Debt Maturity Profile1 December 31, 2016 Pro Forma2
800500
735 700
285
1150
700500
125401
263
324 393
55
422
207
268
287
287
1944
500
500
178
0
200
400
600
800
1,000
1,200
1,400
1,600
1,800
2,000
2,200
2,400
2,600
2,800
2017 2018 2019 2020 2021 2022 2023 2024 2025 2026 2027 2028 2029 2030 2031 2032
Commercial Papers Equity-neutral convertible bonds Credit Agreement Schuldschein Loans Senior Notes
1 – Based on utilization of major financing instruments2 – Pro Forma the acquisition of Quironsalud: €2.6bn Senior Notes, €1.2bn Incremental credit facilities, € 1.0bn Schuldschein loans and €500 million Synthetic
Convertible bonds

7. internationaler RBI Schuldscheintag, March 2017, © Fresenius SE & Co. KGaA 28
Fresenius Group:Debt Maturity Profile1 December 31, 2016 Pro Forma2
€ million
Maturity 4.1 years on
average
0
200
400
600
800
1,000
1,200
1,400
1,600
1,800
2,000
2,200
2,400
2,600
2,800
3,000
2017 2018 2019 2020 2021 2022 2023 2024 2025 2026 2027 2028 2029 2030 2031 2032
Fresenius Medical Care Fresenius excl. Fresenius Medical Care
1 – Based on utilization of major financing instruments2 – Pro Forma the acquisition of Quironsalud: €2.6bn Senior Notes, €1.2bn Incremental credit facilities, € 1.0bn Schuldschein loans and €500 million Synthetic
Convertible bonds

29
$ million
Senior Notes$4,923 57%Senior Secured
Credit Facilities$2,366 28%
Synthetic Convertible Bonds
$401 5%
AR Facility$175 2%
Commercial Paper$502 6%
Other Debt$205 2%
$8,572 m
Fresenius Medical Care: Financing Mix – December 31, 2016
7. internationaler RBI Schuldscheintag, March 2017, © Fresenius SE & Co. KGaA
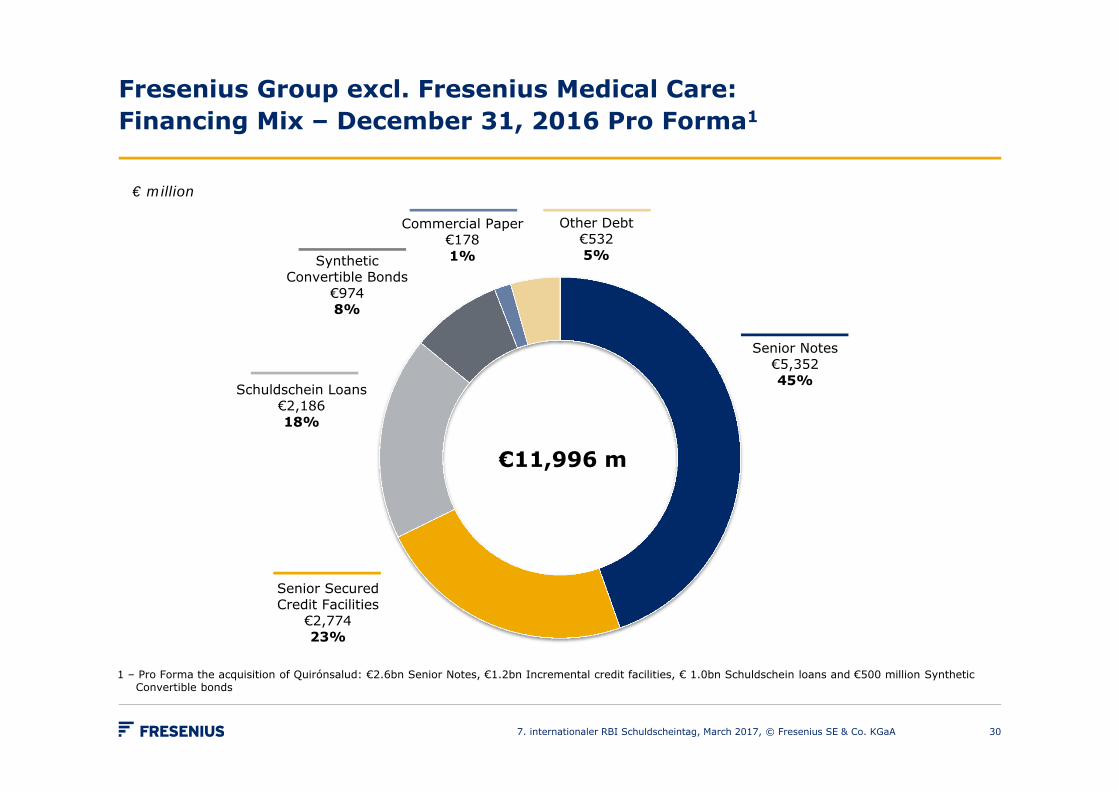
Senior Notes€5,35245%
Senior Secured Credit Facilities
€2,77423%
Schuldschein Loans€2,18618%
Synthetic Convertible Bonds
€9748%
Commercial Paper€1781%
Other Debt€5325%
Fresenius Group excl. Fresenius Medical Care:Financing Mix – December 31, 2016 Pro Forma1
30
€ million
€11,996 m
7. internationaler RBI Schuldscheintag, March 2017, © Fresenius SE & Co. KGaA
1 – Pro Forma the acquisition of Quirónsalud: €2.6bn Senior Notes, €1.2bn Incremental credit facilities, € 1.0bn Schuldschein loans and €500 million SyntheticConvertible bonds

Senior Notes €10,014
50%
Senior Secured Credit Facilities
€5,01825%
Schuldschein Loans€2,18611%
Synthetic Convertible Bonds
€1,3557%
Commercial Paper€6543%
Other Debt €8534%
31
€20,080 m
€ million
Fresenius Group: Financing Mix – December 31, 2016 Pro Forma1
1 – Pro Forma the acquisition of Quirónsalud: €2.6bn Senior Notes, €1.2bn Incremental credit facilities, € 1.0bn Schuldschein loans and €500 million SyntheticConvertible bonds
7. internationaler RBI Schuldscheintag, March 2017, © Fresenius SE & Co. KGaA

Acquisition of Quirónsalud
327. internationaler RBI Schuldscheintag, March 2017, © Fresenius SE & Co. KGaA

Acquisition Highlights
Market leader in size and quality with excellent growth prospects
Strong management team with proven trackrecord and ongoing commitment to Fresenius
Combination forms powerful platform for knowledge & best practice transfer
Substantial cost and growth synergies
Highly accretive from 2017 – leverage back to current levels after 1.5 years
337. internationaler RBI Schuldscheintag, March 2017, © Fresenius SE & Co. KGaA

Hospital Network With Clear Focus on Large Metropolitan Areas
34
43 hospitals, 39 outpatient centers ~300 ORP centers
€2,540 bn Sales (2016)
€461 m EBITDA (2016)~18% EBITDA Margin
6,600 beds and35,000 staff
9.4m outpatient admissions p.a.
320,000 inpatient admissions p.a.
>5>2 – 5>0.5 – 2
<0.5
Population per region (in m)
Madrid
Sevilla
Málaga
Bilbao
Saragossa
Barcelona
PalmaValencia
7. internationaler RBI Schuldscheintag, March 2017, © Fresenius SE & Co. KGaA

Structural Growth Drivers
Health care expenditure per capita in Spain below EU average
Close dovetailing of inpatient and outpatient care
Public – NHS (PPPs)
Expansion of existing facilities
Greenfield projects
Acquisition of private hospitals
7. internationaler RBI Schuldscheintag, March 2017, © Fresenius SE & Co. KGaA 35
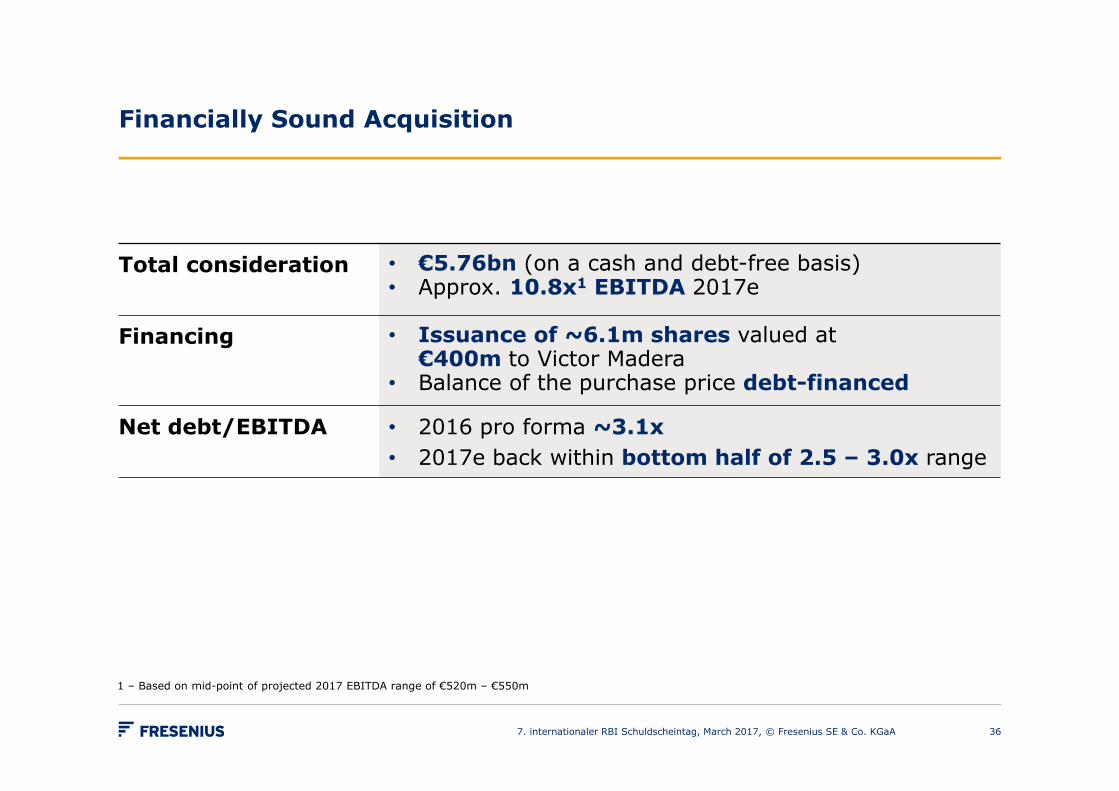
Financially Sound Acquisition
36
Total consideration • €5.76bn (on a cash and debt-free basis)• Approx. 10.8x1 EBITDA 2017e
Financing • Issuance of ~6.1m shares valued at €400m to Victor Madera
• Balance of the purchase price debt-financed
Net debt/EBITDA • 2016 pro forma ~3.1x• 2017e back within bottom half of 2.5 ‒ 3.0x range
7. internationaler RBI Schuldscheintag, March 2017, © Fresenius SE & Co. KGaA
1 – Based on mid-point of projected 2017 EBITDA range of €520m ‒ €550m

Acquisition Financing Quirónsalud:Financing Mix
37
Sources € million Uses € million
Equity1 400 Purchase Price2 5,760
Equity-neutral Convertible 500 Transaction Costs 50
Senior Notes 2,600
Schuldschein Loan 1,000
Senior Secured Credit Facilities
1,200
Cash 110
Total 5,810 Gesamt 5,810
7. internationaler RBI Schuldscheintag, March 2017, © Fresenius SE & Co. KGaA
1 – As portion of the purchase price payment2 – Subject to working capital adjustments

387. internationaler RBI Schuldscheintag, March 2017, © Fresenius SE & Co. KGaA
Summary and Outlook

Fresenius Group: 2017 Financial Outlook by Business Segment
39
20161 Base 2017e1
Sales growth4 (cc) 16,750 8% – 10%
Net income growth4,5 (cc) 1,144 7% – 9%
Sales growth (organic) 6,007 5% – 7%
EBIT growth (cc) 1,171 5% – 7%
Sales growth (organic) 5,8432 3% – 5%
Sales (reported) 5,8432 ~€8.6 billionthereof Quirónsalud3 ~€2.5 billion
EBIT 6832 1,020 –1,070thereof Quirónsalud3: EBIT of €300 to €320m (EBITDA €480 to €500m, amortization €80m, depreciation €100m)
Sales growth (organic) 1,160 5% – 10%
EBIT growth 69 5% – 10%
1 – All data according to IFRS2 – Helios Kliniken Germany, excluding Quirónsalud3 – 11 months consolidated
€ million except otherwise stated
7. internationaler RBI Schuldscheintag, March 2017, © Fresenius SE & Co. KGaA
4 – Excluding effects of the agreement with the U.S. Departments of Veterans Affairs and Justice
5 – Net income attributable to shareholders of Fresenius Medical Care & Co. KGaA

€ million except otherwise stated 20161 Base 2017e1
Sales growth (cc) 29,471 15% – 17%
Net income2 growth (cc) 1,560 17% – 20%
Fresenius Group: 2017 Financial Guidance
407. internationaler RBI Schuldscheintag, March 2017, © Fresenius SE & Co. KGaA
1 – All data according to IFRS2 – Net income attributable to shareholders of Fresenius SE & Co. KGaA

Aging Population and Increasing Healthcare Spending
• Aging population and higher incidence of chronic diseasesWorld population age 60+ will reach >2bn by 2050 (WHO)
• Increasing health expenditure per capita, 2014 vs. 2004 – USA $9,403 (+147%), China: $420 (+592%), India: $75 (+277%)1
• By 2022, one third of all global health expenditure will occur in Emerging Economies2
41
60+
1/3
7. internationaler RBI Schuldscheintag, March 2017, © Fresenius SE & Co. KGaA
1 – World Bank: Health expenditure per capita2 – World Economic Forum: Health Systems Leapfrogging in Emerging Economies – Project Paper (2014)3 – WHO: Global status report on non communicable diseases

2016 2017 2020
Fresenius Group: Ambitious Mid-Term Targets
2016 2017 2020
€ billion € million
Sales Net Income
Mid-point CAGR8.7%3
Mid-point CAGR10.5%3
29.5
47
1 – Mid-point of the 2017 sales guidance, adjusted for current exchange rates2 – Mid-point of the 2017 net income guidance, adjusted for current exchange rates3 – Calculated on the basis of the mid-point of the 2020 target range
At current exchange rates; excluding strategic acquisitions; at current IFRS rules
1,560
2,400
2,700
~35.0143
~1,8902
427. internationaler RBI Schuldscheintag, March 2017, © Fresenius SE & Co. KGaA

43
Diversified revenue and earnings base with four strong business segments
Global presence in growing,non-cyclical markets
Leading market positions
Proven ability to integrate acquisitions
Clear track record of and commitment to de-leveraging
Strong earnings development and cash
flow generation
7. internationaler RBI Schuldscheintag, March 2017, © Fresenius SE & Co. KGaA
Investment Highlights

447. internationaler RBI Schuldscheintag, March 2017, © Fresenius SE & Co. KGaA