Embed Size (px)
Citation preview

A
E
EC
M
21
Ju
Ve
A Le
ECO
CON1/Un
ark sche
140
ne 2015
ersion 1.0/S
vel
NOM
nit 1
eme
Stage: 1.0 F
MICS
Marke
inal
S
ets and MMarket Failure

Mark schemes are prepared by the Lead Assessment Writer and considered, together with the relevant questions, by a panel of subject teachers. This mark scheme includes any amendments made at the standardisation events which all associates participate in and is the scheme which was used by them in this examination. The standardisation process ensures that the mark scheme covers the students’ responses to questions and that every associate understands and applies it in the same correct way. As preparation for standardisation each associate analyses a number of students’ scripts. Alternative answers not already covered by the mark scheme are discussed and legislated for. If, after the standardisation process, associates encounter unusual answers which have not been raised they are required to refer these to the Lead Assessment Writer. It must be stressed that a mark scheme is a working document, in many cases further developed and expanded on the basis of students’ reactions to a particular paper. Assumptions about future mark schemes on the basis of one year’s document should be avoided; whilst the guiding principles of assessment remain constant, details will change, depending on the content of a particular examination paper. Further copies of this mark scheme are available from aqa.org.uk
Copyright © 2015 AQA and its licensors. All rights reserved. AQA retains the copyright on all its publications. However, registered schools/colleges for AQA are permitted to copy material from this booklet for their own internal use, with the following important exception: AQA cannot give permission to schools/colleges to photocopy any material that is acknowledged to a third party even for internal use within the centre.

MARK SCHEME – A LEVEL ECONOMICS – 2140 – ECON1 - JUNE 2015
3 of 21
AQA Advanced Subsidiary Economics
June 2015 ECON1/1
The following list indicates the correct answers used in marking the candidates’ responses.
KEY LIST
JUNE 2015 ECON1/1
1. B 9. D 17. C
2. A 10. D 18. C
3. C 11. C 19. A
4. C 12. A 20. C
5. B 13. B 21. C
6. B 14. A 22. A
7. D 15. C 23. B
8. D 16. B 24. A
25. D
MARK SCHEME – A LEVEL ECONOMICS – 2140 – ECON1 - JUNE 2015
4 of 21
Advanced Subsidiary Economics
June 2015 ECON1/2 Mark Scheme
Section B: Data Response
General Instructions Marks awarded to candidates should be in accordance with the following mark scheme and examiners should be prepared to use the full range of marks available. The mark scheme for most questions is flexible, permitting the candidate to score full marks in a variety of ways. Where the candidate’s response to a question is such that the mark scheme permits full marks to be awarded, full marks MUST be given. A perfect answer is not necessarily required for full marks. But conversely, if the candidate’s answer does not deserve credit, then no marks should be given. Occasionally, a candidate may respond to a question in a reasonable way, but the answer may not have been anticipated when the mark scheme was devised. In this situation, OR WHENEVER YOU HAVE ANY DOUBT ABOUT THE INTERPRETATION OF THE MARK SCHEME, you must in the first instance telephone your team leader to discuss how to proceed. Two approaches have been used in the construction of the mark scheme: (i) An issue based approach. The mark scheme for questions 01, 02, 03, 05, 06 and 07 of the
data response questions adopts this approach. The mark scheme lists the marks that can be awarded for particular issues (and associated development) that the candidate might include in the answer.
A levels approach. This approach is used for marking questions 04 and 08 of the data response questions. The Levels Mark Scheme on the next page identifies five levels representing differences in the quality of work. A range of marks is allocated at each level. First decide the level into which an answer falls. The level chosen should be the one which best fits the answer provided by the candidate. It is not intended that the answer should satisfy every statement in the level description. Then think in terms of awarding the mid-point mark which has been identified for that level (eg 13 marks for Level 3). Move up and down from this notional mark by considering the extent to which the answer meets the level description overall. Strength in one skill can outweigh weakness in another. When using the Levels Mark Scheme the marker must identify where a particular skill is being demonstrated. The key to be used to identify the skill is given after the levels descriptions. The question-specific mark scheme summarises the information which could be used to answer the question, but without attaching marks to particular issues.

MARK SCHEME – A LEVEL ECONOMICS – 2140 – ECON1 - JUNE 2015
5 of 21
LEVELS OF RESPONSE MARK SCHEME FOR USE WITH QUESTIONS 04 AND 08 ONLY
AS
LEVELS OF RESPONSE
AO1
KNOWLEDGE and UNDERSTANDING of theories, concepts
and terminology
AO2
APPLICATION of theories,
concepts and terminology
AO3
ANALYSIS of economic
problems and issues
AO4
EVALUATION of economic
arguments and evidence, making
informed judgements
Level 5 22-25 marks
(mid-point 24)
Good analysis and good evaluation
Good throughout the answer with few errors and weaknesses
Good application to issues
Good use of data to support answer
Relevant and precise with a clear and logical chain of reasoning
Good with a clear final judgement
Level 4 17-21 marks
(mid-point 19)
Good analysis but limited evaluation
OR
Good throughout the answer with few errors and weaknesses
Good application to issues
Good use of data to support answer
Relevant and precise with a clear and logical chain of reasoning
Limited but showing some appreciation of alternative points of view
Reasonable analysis and reasonable
evaluation
Good throughout much of the answer with few errors and weaknesses
Some good application to issues.
Some good use of data to support answer
Largely relevant and well organised with reasonable logic and coherence
Reasonable, showing an appreciation of alternative points of view
Level 3 10-16 marks
(mid-point 13)
Reasonable answer, including some correct
analysis but very limited evaluation
Satisfactory but some weaknesses shown
Reasonable application to issues
Reasonable use of data to support answer
Reasonably clear but may not be fully developed and is perhaps confused in places with a few errors present
Superficial, perhaps with some attempt to consider both sides of the issue(s)
Level 2 4-9 marks
(mid-point 7)
Weak with some understanding
Limited and some errors are made
Partial application to issues with some errors
Limited use of data to support answer
Partial but confused at times, lacking focus and development
Limited logic and coherence
A very basic and simplistic attempt is made which is unsupported by analysis
Level 1 0-3 marks
(mid-point 2)
Very weak
Weak with a number of errors
Little, if any, application to issues
No use of data to support answer
Poor and lacking clarity and focus
No relevant evaluation

MARK SCHEME – A LEVEL ECONOMICS – 2140 – ECON1 - JUNE 2015
6 of 21
THE KEY TO BE USED WHEN USING THE LEVELS MARK SCHEME D Where a particular economic term is correctly DEFINED in order to help the candidate to
answer the question properly. I Where a relevant ISSUE is raised by the candidate. K Where the candidate demonstrates KNOWLEDGE of recent developments or features of
the economy which help enhance the candidate’s response to the question. This should also be used where the candidate quotes relevant examples.
Ap Where the candidate demonstrates the ability to APPLY knowledge and CRITICAL
UNDERSTANDING to problems and issues. An Where the candidate demonstrates the ability to ANALYSE the problem using
appropriate economic ideas. E Where the candidate EVALUATES and makes judgements about the significance of
various issues and arguments.
QUALITY OF WRITTEN COMMUNICATION
Quality of Written Communication (QWC) will be assessed in Questions 04 and 08 only. Candidates will be assessed according to their ability to:
ensure that text is legible, and that spelling, grammar and punctuation are accurate, so that meaning is clear
select and use a form and style of writing appropriate to purpose and complex subject matter
organise information clearly and coherently, using specialist vocabulary when appropriate. No specific marks are awarded for QWC. However, examiners should take into account QWC when determining the mark to be awarded for an answer. This means an answer could be taken either up (for exceptional QWC) or down (for very poor QWC) by 1 mark (and no more).

MARK SCHEME – A LEVEL ECONOMICS – 2140 – ECON1 - JUNE 2015
7 of 21
EITHER
Context 1 Total for this Context: 50 marks
For an acceptable definition which needs to refer to both income and inequality eg
When there is an uneven distribution of money / flow of money / earnings coming
into households/individuals/economy/society
When the rewards paid to factors of production are not shared equally (unequal) between a country’s population/households.
5 marks
Full marks should be awarded to a candidate who demonstrates a clear understanding of the term ‘income inequality’ even if the definition is not exactly the same as the acceptable examples quoted above. If the definition is inaccurate or incomplete, a maximum of 4 marks can be awarded which may be broken down, for example as follows:
When there is a gap between the different household income (quintile) groups / rich and poor
3 marks
When the distribution of income is unequal/not shared equally. 3 marks
The flow of money coming into a household over a period of time. 3 marks
A reward paid to a factor of production. 2 marks
The value of a country’s total income/income per head of population. 1 mark
For an example: e.g. top quintile has average of £78 300, poorest quintile has £5400 – this does not need to be accurate.
1 mark max
An example of income, eg wages/rent/benefit (transfer) payments. max 1 mark
Whilst a diagram is not expected, some candidates may choose to use for example a Lorenz Curve, which should be awarded 2 marks for correct labelling and information shown. Do NOT reward references to EQUITY Maximum of 4 marks if definition is incomplete or inaccurate.
MAXIMUM FOR PART 01: 5 MARKS
01 Define the term ‘income inequality’. (Extract C, line 2).
[5 marks]

MARK SCHEME – A LEVEL ECONOMICS – 2140 – ECON1 - JUNE 2015
8 of 21
Award up to 4 marks each for each significant comparison made
Identifies a significant point of comparison.
Makes accurate use of the data to support the point of comparison identified.
Unit of measurement given accurately. There should be an acknowledgement in at least one point that this data is in index number format and / or % changes.
4 marks
Identifies a significant point of comparison.
Makes partially inaccurate use of the data to support the point of comparison identified.
However, no unit of measurement is given and/or the unit of measurement is used/applied inaccurately and/or the dates are not quoted or are inaccurate.
3 marks
Identifies a significant point of comparison.
Makes no correct use of the data to support the comparison identified. 2 marks
Identifies a significant feature of the data but no comparison is made.
Makes use of the data to support the feature identified.
Unit of measurement given accurately.
1 mark
If a candidate identifies more than two significant points of comparison, reward the best two. Significant points include:
Both income groups experienced growth in real disposable income over the period shown. The top income group grew from an index of 120 in 1981 to 245 in 2011, whereas the bottom income group grew from an index of 110 in 1981 to 190 in 2011.
Growth in real disposable income was most rapid for the top income group over the period shown, which experienced growth from an index of 120 in 1981 to 245 in 2011, 125 on the index or growth of 104%
The peak real disposable income for the top income group was in 2006 at 270 on the index, whereas the peak for the bottom income group was in 2009 at 190 on the index.
The lowest real disposable income for the top income group was in 1982 at 115 on the index, whereas the lowest for the bottom income group was in 1981 at 110 on the index.
The change in real disposable income was more volatile for the top income group with a range of 155, for example, than the bottom income group, with a range of 80 on the index.
Allow a margin of +/- 10 index points
MAXIMUM FOR PART 02: 8 MARKS
02 Using Extract A, identify two significant points of comparison between the changes in real household disposable income for the two income groups over the period shown.
[8 marks]

MARK SCHEME – A LEVEL ECONOMICS – 2140 – ECON1 - JUNE 2015
9 of 21
Define price/market mechanism, market economy, equilibrium price, scarce resources, signalling, rationing, incentive, demand, supply or any other relevant term:
1 mark per definition Maximum of 2 marks for
definitions Candidates inevitably will answer this question in different ways. They might start for example, with a reason why there is a cha nge in demand or supply (2 marks) and refer to the appropriate increase / decrease (2 marks).They might also choose to set the answer in context and use an example throughout. All these approaches are valid and should be rewarded accordingly.
Award 2 marks for each logical link in the chain of reasoning, eg
Price has three functions signalling rationing and incentive (2 marks). When price changes it sends a signal (2 marks) or provides information to firms, consumers and / or owners of factors of production (2 marks). A rise in price following an increase in demand (2 marks) might signal to producers that more of the good is required (2 marks) and this will provide an incentive for them to join the market (2 marks) as they expect that higher profits can be made (2 marks) so scarce resources are reallocated to that market (2 marks) this has the effect of increasing supply (2 marks) in the market and prices will fall again (2 marks) which is likely to encourage consumers to buy more of the good (2 marks). On the other hand an increase in the price of a good that is becoming more scarce (2 marks) will inevitably mean that some consumers are rationed out of the market (2 marks) as they can no longer afford to pay for the good (2 marks) and this might signal to firms that opportunities for profit are diminishing (2 marks) so they have an incentive to leave the market (2 marks) and reallocate scarce resources elsewhere (2 marks).
Up to 12 marks
Candidates can earn full marks without the help of a diagram, however, it is expected that many will draw at least one diagram. If so, and the diagram is referred to, marks should be awarded as follows to any relevant diagram up to a maximum of 3 marks.
For labelling both axes, original supply and demand curves, and co-ordinates drawn in at the initial equilibrium and labels such as P1 and Q1.
1 mark only
An accurately drawn shift of either/both the demand or the supply curve.
1 mark per shift (Max 2)
Co–ordinates drawn in at the new equilibrium and labels such as P2 and Q2.
1 mark
Any other relevant feature of the diagram (eg the amount of excess demand or supply at the original equilibrium).
1 mark per feature (Max 2)
03 Extract B, (lines 3 and 4) states that: ‘Changes in prices would coordinate the decisions between consumers and producers’. Explain how changes in prices allocate scarce resources in a market economy.
[12 marks]

MARK SCHEME – A LEVEL ECONOMICS – 2140 – ECON1 - JUNE 2015
10 of 21
Note: (i) To earn the first mark in the grids, all the listed tasks must have been attempted and been completed correctly.
(ii) For the task of labelling the axes, price and quantity, P and Q, QD & QS (but
not output, QD or QS), a monetary value such as a £ sign on the vertical axis are all acceptable. Price level is not acceptable.
Up to a MAXIMUM of 3 marks for diagram or diagrams
MAXIMUM FOR PART 0 3: 12 MARKS
MARK SCHEME – A LEVEL ECONOMICS – 2140 – ECON1 - JUNE 2015
11 of 21
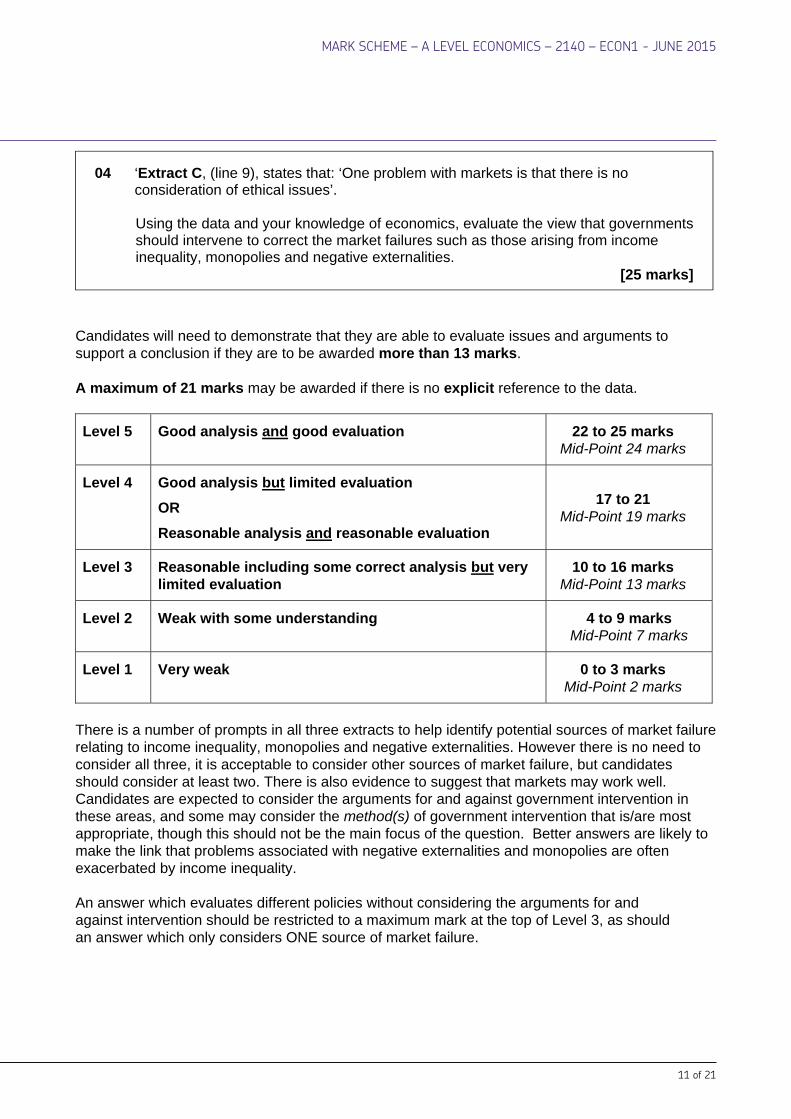
Candidates will need to demonstrate that they are able to evaluate issues and arguments to support a conclusion if they are to be awarded more than 13 marks. A maximum of 21 marks may be awarded if there is no explicit reference to the data.
Level 5 Good analysis and good evaluation 22 to 25 marks Mid-Point 24 marks
Level 4 Good analysis but limited evaluation
OR
Reasonable analysis and reasonable evaluation
17 to 21 Mid-Point 19 marks
Level 3 Reasonable including some correct analysis but very limited evaluation
10 to 16 marks Mid-Point 13 marks
Level 2 Weak with some understanding 4 to 9 marks Mid-Point 7 marks
Level 1 Very weak 0 to 3 marks Mid-Point 2 marks
There is a number of prompts in all three extracts to help identify potential sources of market failure relating to income inequality, monopolies and negative externalities. However there is no need to consider all three, it is acceptable to consider other sources of market failure, but candidates should consider at least two. There is also evidence to suggest that markets may work well. Candidates are expected to consider the arguments for and against government intervention in these areas, and some may consider the method(s) of government intervention that is/are most appropriate, though this should not be the main focus of the question. Better answers are likely to make the link that problems associated with negative externalities and monopolies are often exacerbated by income inequality. An answer which evaluates different policies without considering the arguments for and against intervention should be restricted to a maximum mark at the top of Level 3, as should an answer which only considers ONE source of market failure.
04 ‘Extract C, (line 9), states that: ‘One problem with markets is that there is no consideration of ethical issues’.
Using the data and your knowledge of economics, evaluate the view that governments should intervene to correct the market failures such as those arising from income inequality, monopolies and negative externalities.
[25 marks]

MARK SCHEME – A LEVEL ECONOMICS – 2140 – ECON1 - JUNE 2015
12 of 21
Issues and areas for discussion include:
Introduction Market failure Income inequality monopolies Negative externalities Government intervention The meaning/interpretation of ethical issues.
Developing the response to the question: (Application)
Drawing on the information in: o Extract A, B and C regarding income inequality and the link to
spending power, rationing out, necessities o Extract B regarding markets working well, effective allocation of
resources, choice o Extract C regarding ethical issues, the Will Hutton quote o Extract B regarding the demerit good, gambling, and the link to
income inequality o Extract B regarding monopoly power/regulation o drawing on the candidate’s own knowledge of examples of negative
externalities or problems of income inequality, for example, the recent discussion of a new law banning smoking in cars containing children, and the recent energy price rises.
Developing the response to the question: (Analysis)
Developing a chain of reasoning to explain: o why income inequality may be a source of market failure o why governments might wish to intervene to correct the market
failure o why governments should not intervene – government failure
arguments /opportunity cost/benefits of the market o why negative externalities are a source of market failure o why governments might wish to intervene to correct the market
failure o why governments should not intervene – government failure
arguments/opportunity cost/benefits of the market o the strengths/weaknesses of particular methods of government
intervention o use of externality diagrams to develop the analysis.
Evaluation
Questioning the assumptions made when developing the chains of reasoning outlined above
Discussing o whether markets work well in some areas and not others o whether government intervention works better in some markets
rather than others o the most appropriate method of government intervention o whether some market failures are worse than others and therefore
require greater intervention o the disagreements between individuals/governments–the
importance of subjectivity/normative economics o market failure versus government failure o how dealing with income inequality might help to deal with some of

MARK SCHEME – A LEVEL ECONOMICS – 2140 – ECON1 - JUNE 2015
13 of 21
the causes of negative externalities o evaluating the evidence in the data o overall evaluation of the case for versus the case against.
Examiners should note that credit can be given for basic evaluation if a candidate simply states but does not develop arguments for and against government intervention. Stronger evaluation is provided by candidates who are able to support arguments both for and against government intervention, and by clearly stating the assumptions underlying the arguments being used. Reward the relevant use of diagrams to support arguments, eg externalities diagrams.
USE THE DETAILED LEVELS MARK SCHEME ON PAGES 3 & 4 FOR FURTHER CLARIFICATION
MAXIMUM FOR PART 0 4: 25 MARKS

MARK SCHEME – A LEVEL ECONOMICS – 2140 – ECON1 - JUNE 2015
14 of 21
OR Context 2 Total for this Context: 50 marks
For an acceptable definition eg The fall in average/unit costs of production as the scale of production increases
as a result of improvements in the process of production.
The fall in average/unit costs of production as the scale of production increases as a result of the greater utilisation of capital.
The fall in average/unit costs of production as the scale of production increases
as a result of investment in new capital/machinery.
5 marks
Full marks should be awarded to a candidate who demonstrates a clear understanding of the term ‘technical economies of scale’ even if the definition is not exactly the same as the acceptable examples quoted above. If the definition is inaccurate or incomplete, maximum of 4 marks which may be broken down, for example as follows:
The fall in average/unit costs of production as the scale of production increases.
3 marks
The fall in costs of production as the scale of production increases as a result of the acquisition of larger scale machinery/plant, (ie no average/unit).
3 marks
The benefits to a firm of making greater use of technology/capital. 2 marks
The fall in costs of production as the scale of production increases (no average/ unit).
2 marks
The fall in average costs of production 2 marks
A diagram to illustrate economies of scale eg AC curve (no sr/lr distinction at AS) 1 for labels and 1 for information shown.
2 marks
The fall in costs of production 1 mark
The benefits to a firm of being big. 1 mark
Other examples of technical economies of scale e.g. increased dimensions / specialisation / new or better technology
1 mark max
Maximum of 4 marks if definition is incomplete or inaccurate
MAXIMUM FOR PART 05: 5 MARKS
05 Define the term ‘technical economies of scale’ (Extract E, lines 5 and 6).
[5 marks]

MARK SCHEME – A LEVEL ECONOMICS – 2140 – ECON1 - JUNE 2015
15 of 21
Award up to 4 marks each for each significant point made
Identifies a significant feature of the data. Makes accurate use of the data to support the point of comparison identified. Unit of measurement given accurately. There should be an acknowledgement in the answer that this data is in index number format and / or % changes.
4 marks
Identifies a significant point of comparison. Makes partially inaccurate use of the data to support the feature identified. However, no unit of measurement is given and/or the unit of measurement is used/applied inaccurately and/or the dates are not quoted or are inaccurate.
3 marks
Identifies a significant point of comparison. Makes no correct use of the data to support the comparison identified.
2 marks
Identifies a significant feature of the data but no comparison is made. Makes use of the data to support the feature identified. Unit of measurement given accurately.
1 mark
If a candidate identifies more than two significant points of comparison, reward the best two. Significant points include:
Labour productivity was lower in both the UK and Germany at the end of the period than the start. Labour productivity in the UK started from an index of 100 and ended with an index of 97.2, whereas in Germany labour productivity started from an index of 100 and ended with an index of 99.
Labour productivity in Germany was lowest in the first quarter of 2009 at 95.2 on the index, whereas labour productivity in the UK was lowest during quarter 4 of 2008 at 96.5 on the index.
Labour productivity was highest in the UK in quarter 1 and / or quarter 2 of 2008 and / or during quarter 2 of 2011 at an index of 100, whereas labour productivity was highest in Germany at the start of the period also at an index of 100.
06 Using Extract D, identify two significant points of comparison between changes in labour productivity in the UK and Germany over the period shown.
[8 marks]

MARK SCHEME – A LEVEL ECONOMICS – 2140 – ECON1 - JUNE 2015
16 of 21
The indices of labour productivity in the UK and Germany followed a very similar pattern, for example, both experienced falls during 2008, for Germany from 100 on the index to 98.1 by the end of the year, and for the UK from 100 on the index at the start to 96.8 by the end of the year, yet towards the end of the period from the start of 2012, labour productivity rose to 99 on the index, whereas labour productivity in the UK fell to 97.2 on the index.
Allow a margin of +/- 0.5 index points MAXIMUM FOR PART 06: 8 MARKS

MARK SCHEME – A LEVEL ECONOMICS – 2140 – ECON1 - JUNE 2015
17 of 21
Define specialisation, productivity, competitiveness, division of labour, productive efficiency, demand, supply or any other relevant term:
1 mark per definition Maximum of 2 marks for
definitions
Award 2 marks for each logical link in the chain of reasoning, eg
Specialisation allows the production process to be split into a number of different tasks (2 marks – do not reward if a definition mark has already been awarded) in the case of labour this is referred to as the division of labour (2 marks) so the workers are likely to become more highly skilled in a particular task (2 marks) which enables them to complete the task more quickly (2 marks) in addition the workers do not need to move from station to station which also saves time (2 marks) and leads to an increase in supply/output in the given time period (2 marks). As the workers specialise in one task it becomes cost effective to provide the necessary capital (2 marks) which may not have been affordable if it had to be provided to all workers (2 marks) which also allows them to produce goods more quickly (2 marks) and consequently productivity increases. As productivity increases the firm produces more units in the same time period (2 marks) which enables it to become more productively efficient (2 marks) and experience a fall in its average/unit costs of production (2 marks) consequently the firm is able to reduce its prices (2 marks) possibly to a price lower than that offered by its competitors (2 marks) which increases competitiveness.
Up to 12 marks
Candidates can earn full marks without the help of a diagram, however, if a diagram(s) is included – marks should be awarded as follows up to a maximum of 3 marks. For a demand and supply diagram.
For labelling both axes, original supply and demand curves, and co-ordinates drawn in at the initial equilibrium and labels such as P1 and Q1.
1 mark only
An accurately drawn rightward shift of the supply curve. 1 mark Co-ordinates drawn in at the new equilibrium and labels such as P2 and Q2.
1 mark
The amount of excess supply at the original equilibrium. 1 mark For a cost curve diagram For labelling both axes, average cost curve and initial average cost and output labels such as C1 and Q1.
1 mark only
Co–ordinates drawn in for a new level of average costs and output such as C2 and Q2.
1 mark
The productively efficient point 1 mark
07 Extract E, (lines 4 to 6), states that: ‘The firm operates two assembly lines: it has benefitted extensively from specialisation and technical economies of scale…’
Explain how specialisation may lead to increases in productivity and competitiveness.
[12 marks]

MARK SCHEME – A LEVEL ECONOMICS – 2140 – ECON1 - JUNE 2015
18 of 21
Note:(i) To earn the first mark in the grids, all the listed tasks must have been attempted and been completed correctly.
(ii) For the task of labelling the axes, price and quantity, P and Q, QD & QS (but
not output, QD or QS), a monetary value such as a £ sign on the vertical axis are all acceptable for the demand and supply diagram. Price level is not acceptable.
(iii) For the cost curve diagram: costs, average costs, a monetary value such as £,
output, quantity are acceptable. Price is not acceptable.
If the candidate does not deal with both ‘productivity’ and ‘competitiveness’, the explanation, including any diagrams, should be constrained to 8 marks, plus up to 2 marks for definitions.
Up to a MAXIMUM of 3 marks for diagram or diagrams
MAXIMUM FOR PART 0 7: 12 MARKS
MARK SCHEME – A LEVEL ECONOMICS – 2140 – ECON1 - JUNE 2015
19 of 21
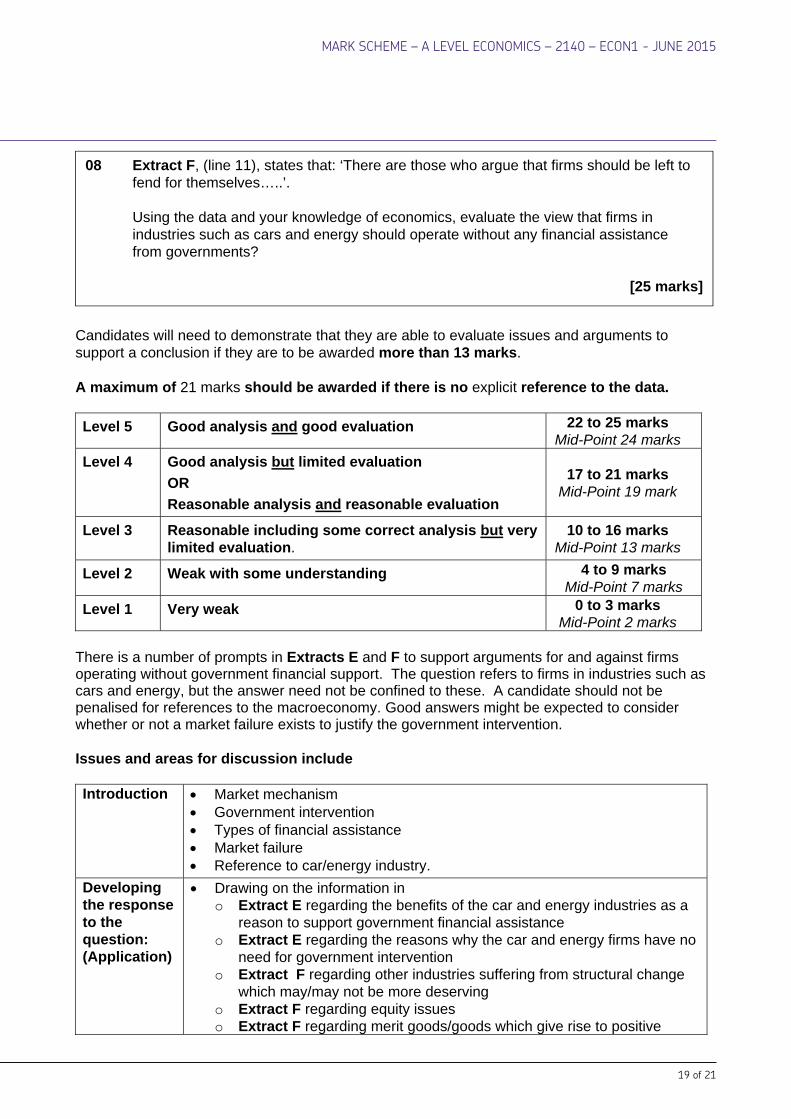
Candidates will need to demonstrate that they are able to evaluate issues and arguments to support a conclusion if they are to be awarded more than 13 marks. A maximum of 21 marks should be awarded if there is no explicit reference to the data.
Level 5 Good analysis and good evaluation 22 to 25 marks Mid-Point 24 marks
Level 4 Good analysis but limited evaluation
OR
Reasonable analysis and reasonable evaluation
17 to 21 marks Mid-Point 19 mark
Level 3 Reasonable including some correct analysis but very limited evaluation.
10 to 16 marks Mid-Point 13 marks
Level 2 Weak with some understanding 4 to 9 marks Mid-Point 7 marks
Level 1 Very weak 0 to 3 marks Mid-Point 2 marks
There is a number of prompts in Extracts E and F to support arguments for and against firms operating without government financial support. The question refers to firms in industries such as cars and energy, but the answer need not be confined to these. A candidate should not be penalised for references to the macroeconomy. Good answers might be expected to consider whether or not a market failure exists to justify the government intervention. Issues and areas for discussion include Introduction
Market mechanism Government intervention Types of financial assistance Market failure Reference to car/energy industry.
Developing the response to the question: (Application)
Drawing on the information in o Extract E regarding the benefits of the car and energy industries as a
reason to support government financial assistance o Extract E regarding the reasons why the car and energy firms have no
need for government intervention o Extract F regarding other industries suffering from structural change
which may/may not be more deserving o Extract F regarding equity issues o Extract F regarding merit goods/goods which give rise to positive
08 Extract F, (line 11), states that: ‘There are those who argue that firms should be left to fend for themselves…..’.
Using the data and your knowledge of economics, evaluate the view that firms in
industries such as cars and energy should operate without any financial assistance from governments?
[25 marks]
MARK SCHEME – A LEVEL ECONOMICS – 2140 – ECON1 - JUNE 2015
20 of 21
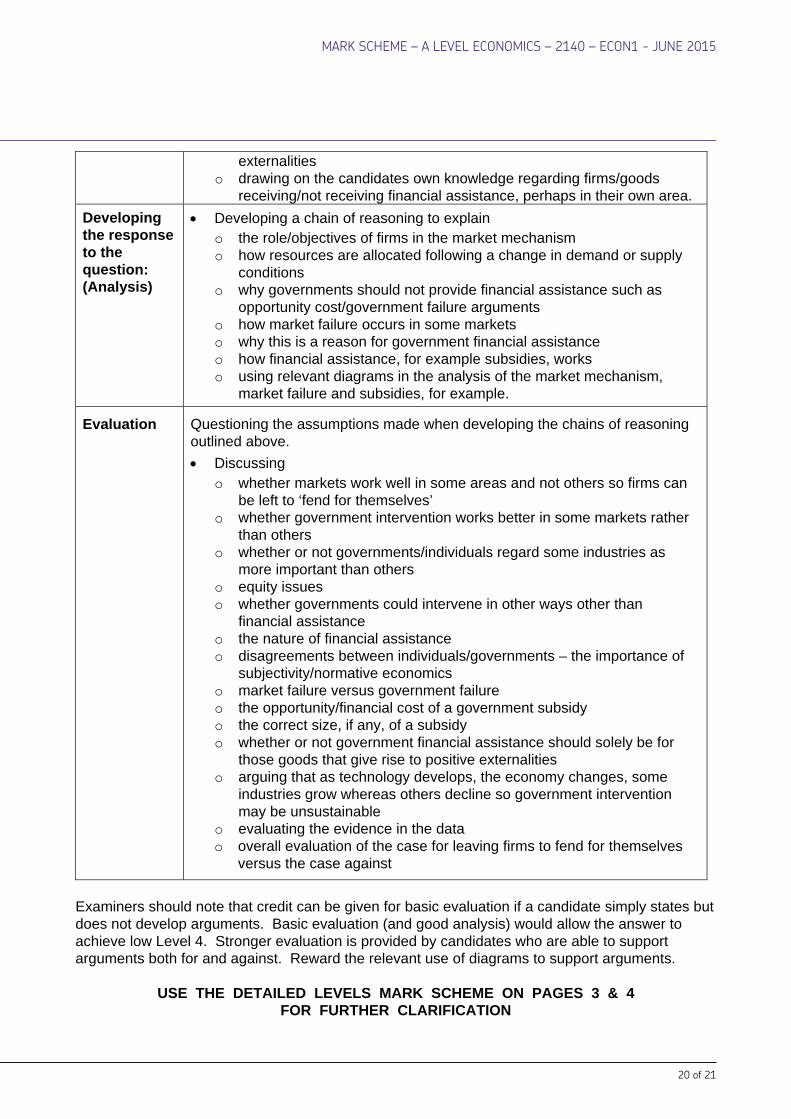
externalities o drawing on the candidates own knowledge regarding firms/goods
receiving/not receiving financial assistance, perhaps in their own area.
Developing the response to the question: (Analysis)
Developing a chain of reasoning to explain o the role/objectives of firms in the market mechanism o how resources are allocated following a change in demand or supply
conditions o why governments should not provide financial assistance such as
opportunity cost/government failure arguments o how market failure occurs in some markets o why this is a reason for government financial assistance o how financial assistance, for example subsidies, works o using relevant diagrams in the analysis of the market mechanism,
market failure and subsidies, for example.
Evaluation
Questioning the assumptions made when developing the chains of reasoning outlined above.
Discussing o whether markets work well in some areas and not others so firms can
be left to ‘fend for themselves’ o whether government intervention works better in some markets rather
than others o whether or not governments/individuals regard some industries as
more important than others o equity issues o whether governments could intervene in other ways other than
financial assistance o the nature of financial assistance o disagreements between individuals/governments – the importance of
subjectivity/normative economics o market failure versus government failure o the opportunity/financial cost of a government subsidy o the correct size, if any, of a subsidy o whether or not government financial assistance should solely be for
those goods that give rise to positive externalities o arguing that as technology develops, the economy changes, some
industries grow whereas others decline so government intervention may be unsustainable
o evaluating the evidence in the data o overall evaluation of the case for leaving firms to fend for themselves
versus the case against
Examiners should note that credit can be given for basic evaluation if a candidate simply states but does not develop arguments. Basic evaluation (and good analysis) would allow the answer to achieve low Level 4. Stronger evaluation is provided by candidates who are able to support arguments both for and against. Reward the relevant use of diagrams to support arguments.
USE THE DETAILED LEVELS MARK SCHEME ON PAGES 3 & 4
FOR FURTHER CLARIFICATION

MARK SCHEME – A LEVEL ECONOMICS – 2140 – ECON1 - JUNE 2015
21 of 21
MAXIMUM FOR PART 0 8: 25 MARKS