Embed Size (px)
Citation preview
A LIDAR Interactive Data Visualization for GroundAircraft Detection at Small Airports
Maria-Jesus LoboENAC
Toulouse, FranceEmail: [email protected]
Christophe HurterENAC
Toulouse, FranceEmail: [email protected]
Mathieu CousyENAC
Toulouse, FranceEmail: [email protected]
Abstract—Light Detection and Ranging (LIDAR) sensors arenowadays widely used for multiple applications such as au-tonomous driving, wind estimation and robots, however theiruse in airports has not yet been fully explored. Nevertheless,LIDAR sensors are decreasing in cost, and there are detectionalgorithms that could be useful in small airports. We presenta system to visualize and detect aircraft in small airfields. Thesystem enables an interactive calibration of the algorithm, andexploration of the results. The system has proven useful for thedetection and positioning of airplanes in the ENVISION Sesarproject.
Keywords—Visualization, LIDAR, aircraft
I. INTRODUCTION
A-SMGCS (Advanced-Surface Movement Guidance andControl Systems) are used in airports to control and monitoraircraft and vehicles in order to optimize capacity, efficiencyand safety [1]. They combine cooperative and non cooperativesensors. Their usage has grown in the last decade and theyare widely used in airports control towers. However, theirimplementation is not currently available at small airportsbecause of their high economic cost.
The ENVISION SESAR project aimed at implementing alow cost surveillance system using new low cost technologiesand the advances in detection algorithms, such as surveil-lance cameras and LIDAR sensors. The advances in imageprocessing techniques make it possible nowadays to achievereal time object detection in video streams. LIDAR sensorshave been successfully used in a wide set of applications,such as autonomous driving and forest classification and theircost is decreasing. To take advantage of both technologies, asystem consisting of an array of cameras, ADS-B (AutomaticDependent Surveillance-Broadcast) receptors and a LIDARsensor was studied in two different airports. The fusion ofthese data is displayed to the controller in an Airport OperatorA-CDM user interface. The preliminary results show that theproposed system can achieve detection of aircraft, vehiclesand persons at approximately 400 meters, 200 meters and 100meters respectively.
The system relies on machine learning techniques to classifyobjects in the video stream and on a segmentation algorithm[2] to detect objects in the LIDAR data. The LIDAR algorithmis complemented by a calibration phase to correctly filter outnoise, such as very small objects or false detections. To ease
this phase, we present a web-based interactive visualizationsystem that displays the point cloud and the detected objectsby the algorithm, and enables tunning the algorithm parametersinteractively.
This paper focus on the LIDAR contribution to the projectand is organized as follows. First, we present the relatedwork that studies the use of LIDAR sensors in airports, thevisualization techniques for 3D point clouds and an overviewof existing systems. Then, we give an overview of the EN-VISION project. Then, we present the implemented systemand features. Finally, because one of the main advantages ofusing a LIDAR sensor is its capability to work in low visibilityconditions, we present the results obtained during a field testin light rainy weather. The results suggest that the LIDARdetection algorithm provides high precision positioning for avehicle in this scenario. We finish with a discussion aboutthe limitations of the system and some perspectives for futurework.
II. RELATED WORK
A. Lidar usage in airports
The usage of LIDAR sensors in airports has gained interestrecently. For example, Toth et al. [3], [4] use four VelodyneVLP-16 sensors to detect aircraft in the taxiing lane, resultingin motion and position estimation. Mund et al.[5] explored theuse of a LIDAR sensor to detect foreign objects on airportaprons. They were focused on detecting small objects thatmight be hazardous, using a high resolution LIDAR. Theirresults suggest that the size of the reflective area of thetarget objects highly influences the resulting detection, and thatreflectivity might be more important than distance for objectdetection. They achieved good detection rates for medium andbig size standardized objects.
Our approach is similar to the one presented by Hoch etal. [3], but instead of using multiple LIDAR sensors, weuse only one as we focus on detecting only aircraft position,and not trajectory. Also, the configuration of the system isdifferent because the goal is to reproduce the ground radarinformation, and not to calculate precise trajectories. Further-more, the contribution of this paper lies more in the interactivevisualization of the point cloud, than in the detection algorithmand configuration of the system.
9th SESAR Innovation Days 2nd – 5th December 2019
ISSN 0770-1268
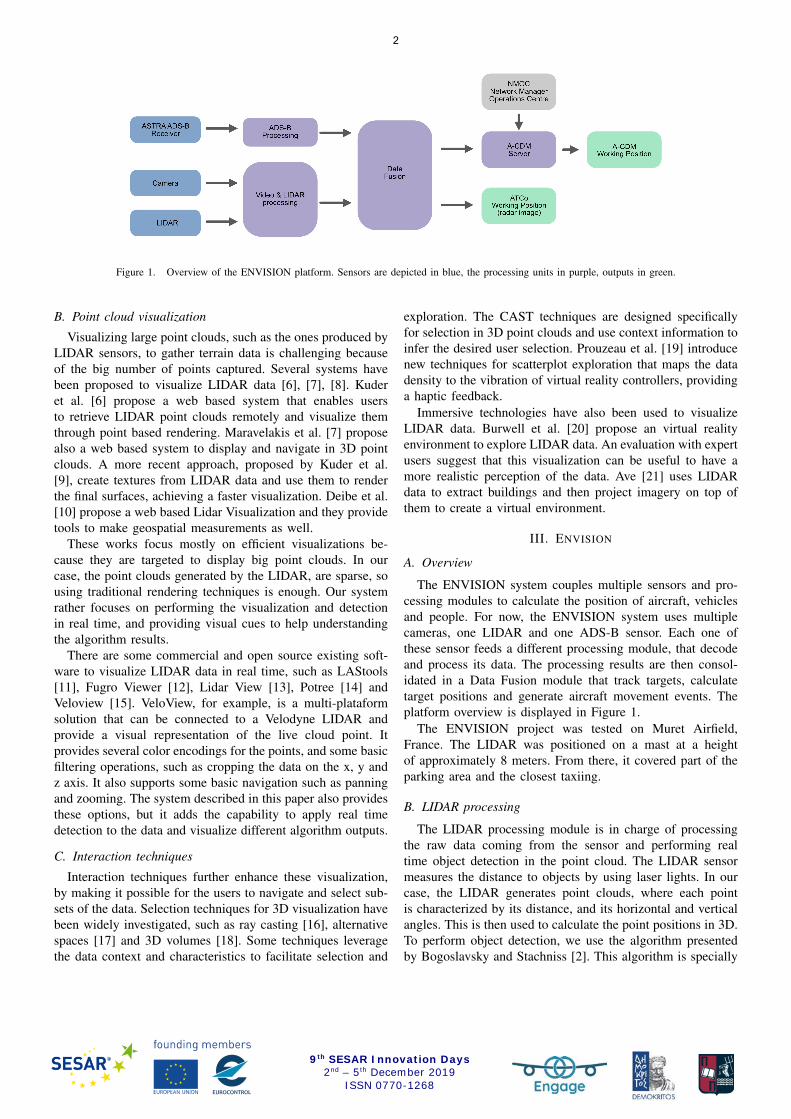
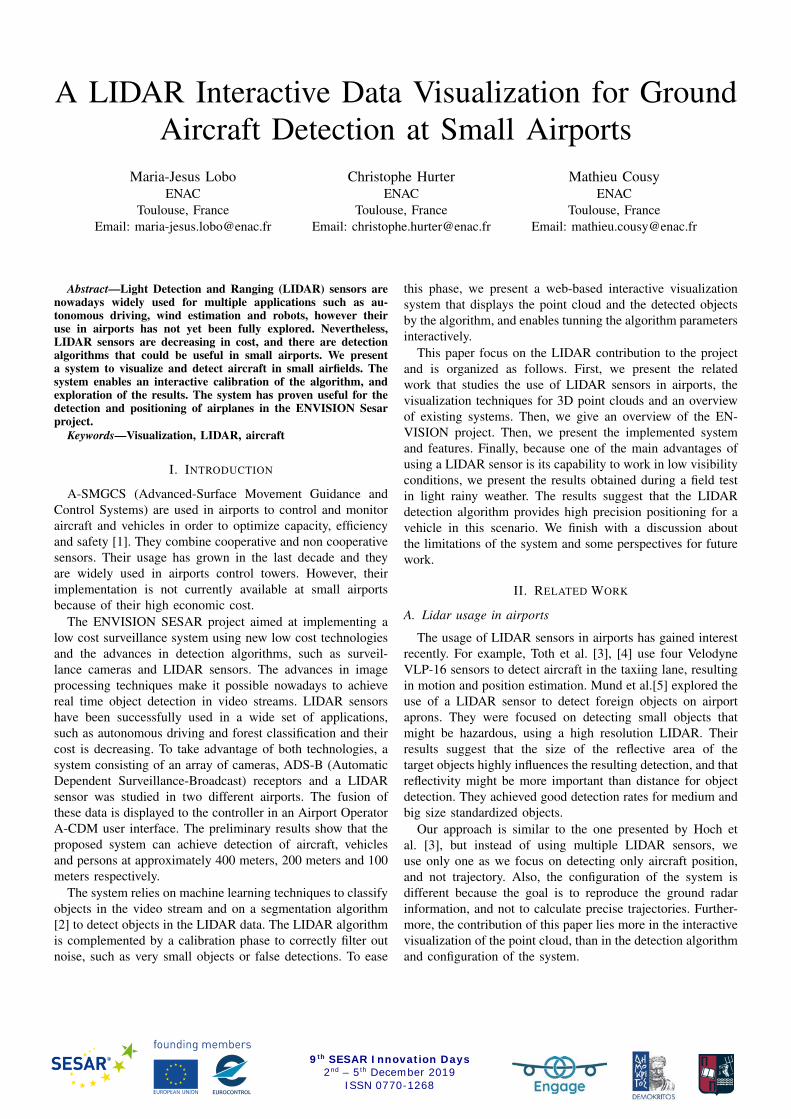
Figure 1. Overview of the ENVISION platform. Sensors are depicted in blue, the processing units in purple, outputs in green.
B. Point cloud visualization
Visualizing large point clouds, such as the ones produced byLIDAR sensors, to gather terrain data is challenging becauseof the big number of points captured. Several systems havebeen proposed to visualize LIDAR data [6], [7], [8]. Kuderet al. [6] propose a web based system that enables usersto retrieve LIDAR point clouds remotely and visualize themthrough point based rendering. Maravelakis et al. [7] proposealso a web based system to display and navigate in 3D pointclouds. A more recent approach, proposed by Kuder et al.[9], create textures from LIDAR data and use them to renderthe final surfaces, achieving a faster visualization. Deibe et al.[10] propose a web based Lidar Visualization and they providetools to make geospatial measurements as well.
These works focus mostly on efficient visualizations be-cause they are targeted to display big point clouds. In ourcase, the point clouds generated by the LIDAR, are sparse, sousing traditional rendering techniques is enough. Our systemrather focuses on performing the visualization and detectionin real time, and providing visual cues to help understandingthe algorithm results.
There are some commercial and open source existing soft-ware to visualize LIDAR data in real time, such as LAStools[11], Fugro Viewer [12], Lidar View [13], Potree [14] andVeloview [15]. VeloView, for example, is a multi-plataformsolution that can be connected to a Velodyne LIDAR andprovide a visual representation of the live cloud point. Itprovides several color encodings for the points, and some basicfiltering operations, such as cropping the data on the x, y andz axis. It also supports some basic navigation such as panningand zooming. The system described in this paper also providesthese options, but it adds the capability to apply real timedetection to the data and visualize different algorithm outputs.
C. Interaction techniques
Interaction techniques further enhance these visualization,by making it possible for the users to navigate and select sub-sets of the data. Selection techniques for 3D visualization havebeen widely investigated, such as ray casting [16], alternativespaces [17] and 3D volumes [18]. Some techniques leveragethe data context and characteristics to facilitate selection and
exploration. The CAST techniques are designed specificallyfor selection in 3D point clouds and use context information toinfer the desired user selection. Prouzeau et al. [19] introducenew techniques for scatterplot exploration that maps the datadensity to the vibration of virtual reality controllers, providinga haptic feedback.
Immersive technologies have also been used to visualizeLIDAR data. Burwell et al. [20] propose an virtual realityenvironment to explore LIDAR data. An evaluation with expertusers suggest that this visualization can be useful to have amore realistic perception of the data. Ave [21] uses LIDARdata to extract buildings and then project imagery on top ofthem to create a virtual environment.
III. ENVISION
A. Overview
The ENVISION system couples multiple sensors and pro-cessing modules to calculate the position of aircraft, vehiclesand people. For now, the ENVISION system uses multiplecameras, one LIDAR and one ADS-B sensor. Each one ofthese sensor feeds a different processing module, that decodeand process its data. The processing results are then consol-idated in a Data Fusion module that track targets, calculatetarget positions and generate aircraft movement events. Theplatform overview is displayed in Figure 1.
The ENVISION project was tested on Muret Airfield,France. The LIDAR was positioned on a mast at a heightof approximately 8 meters. From there, it covered part of theparking area and the closest taxiing.
B. LIDAR processing
The LIDAR processing module is in charge of processingthe raw data coming from the sensor and performing realtime object detection in the point cloud. The LIDAR sensormeasures the distance to objects by using laser lights. In ourcase, the LIDAR generates point clouds, where each pointis characterized by its distance, and its horizontal and verticalangles. This is then used to calculate the point positions in 3D.To perform object detection, we use the algorithm presentedby Bogoslavsky and Stachniss [2]. This algorithm is specially
2
9th SESAR Innovation Days 2nd – 5th December 2019
ISSN 0770-1268
ba
Alignment of the border of thebuilding with the roof lines visiblein the point cloud
Figure 2. Interface of the system. (a) Inspector area (b) Point cloud visualization. The background image can be used to find the rotation and position ofthe LIDAR.
suited to our use case because it performs fast detection onsparse point clouds.
To achieve fast segmentation, Bogoslavsky and Stachnisspropose to perform the detection on the 2D image generatedby the LIDAR rather than in the 3D point cloud. For this, thealgorithm starts by performing a classification to ignore thepoints that are on the ground. In our case, we use a plane fittingapproach. Then, for each point that is not in the ground, fourneighbors are considered: the two closest points coming fromthe same laser (horizontal neighbors) and the closest pointswith the same azimuth coming from the top and down lasers(vertical neighbors). With this, it is possible to build a graphwhere each point will have a maximum of four neighbors,depending of the distance between the points. For two pointsto be considered neighbors, the distance between them has tobe inferior to a distance threshold.
Once the graph is built, for each two neighbors, the betaangle is calculated, as the angle between the segments thatgoes through the LIDAR origin and the farthest point amongthe two neighbors, and the line going through the two points.This angle reflects the depth difference between the two points,if it is small the points are probably at different depths andthus probably belong to different objects. A beta threshold isdetermined to decide if two points belong to the same objector not.
Because this algorithm requires a calibration of the betathreshold and the distance threshold parameters, we designedand implemented an interactive visualization that enables usersto calibrate the algorithm. This system is described in the
following section.
IV. INTERACTIVE VISUALIZATION
The system was designed to support the design and imple-mentation of the LIDAR detection algorithm. Because of this,we draw four design requirements to enable users to explorethe LIDAR data and the algorithm results. These requirementsare inspired by existing visualization systems.
A. Design requirements
• Support navigation in the point cloud through basicoperations like pan and zoom.
• Support manipulation of the algorithm parameters andpresent the results directly in the visualization
• Support exploration of live and recorded data• Present visually cues to enable users to understand how
the algorithm work
B. Features
The final interface is depicted in Figure 2, and consistsof an inspector, so that the user can calibrate the algorithm,and a point cloud visualization, so that the user can explorethe data and the algorithm results. The point cloud visual-ization supports panning and zooming operations. Throughthe inspector, the user can tune the algorithm calibration andthe visualization. The specific features addressing the designrequirements are detailed next.
3
9th SESAR Innovation Days 2nd – 5th December 2019
ISSN 0770-1268
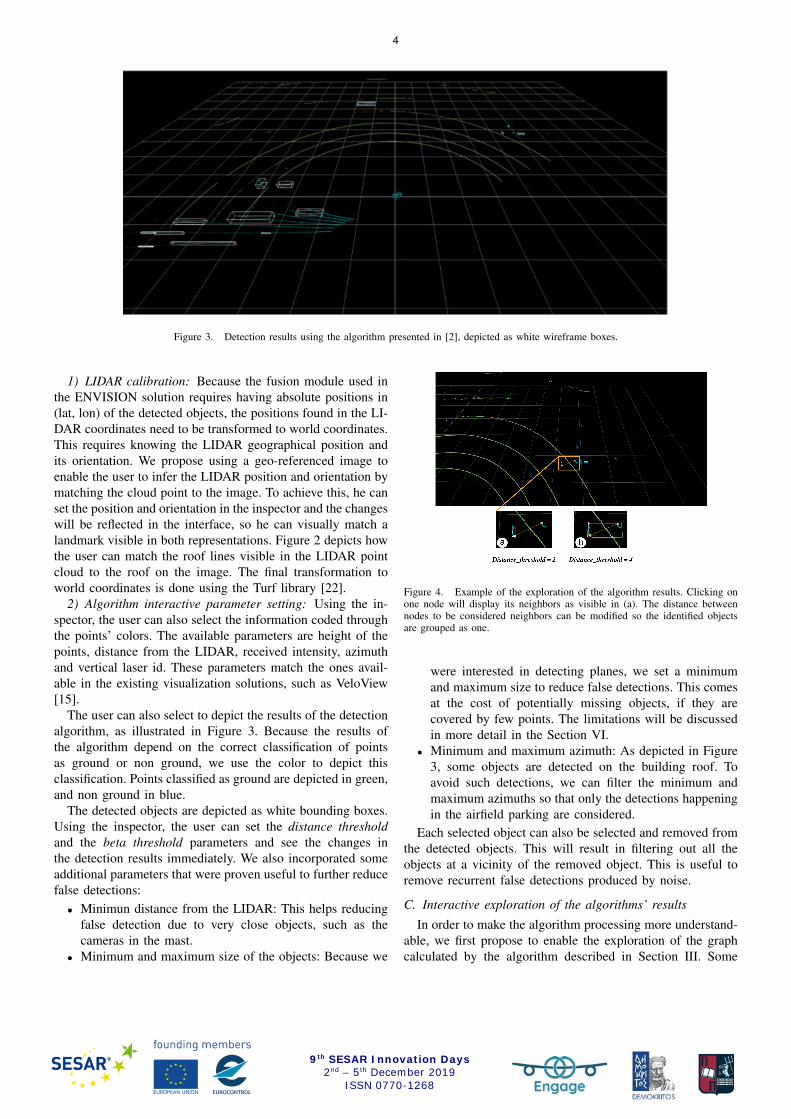
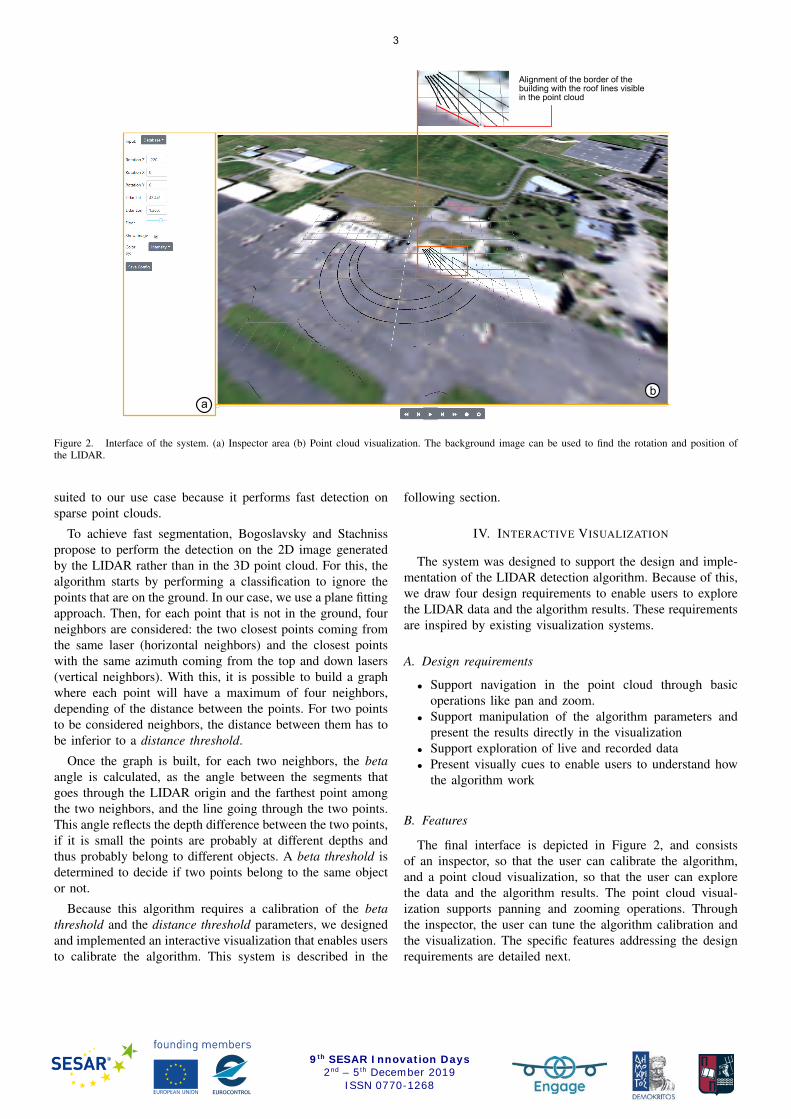
Figure 3. Detection results using the algorithm presented in [2], depicted as white wireframe boxes.
1) LIDAR calibration: Because the fusion module used inthe ENVISION solution requires having absolute positions in(lat, lon) of the detected objects, the positions found in the LI-DAR coordinates need to be transformed to world coordinates.This requires knowing the LIDAR geographical position andits orientation. We propose using a geo-referenced image toenable the user to infer the LIDAR position and orientation bymatching the cloud point to the image. To achieve this, he canset the position and orientation in the inspector and the changeswill be reflected in the interface, so he can visually match alandmark visible in both representations. Figure 2 depicts howthe user can match the roof lines visible in the LIDAR pointcloud to the roof on the image. The final transformation toworld coordinates is done using the Turf library [22].
2) Algorithm interactive parameter setting: Using the in-spector, the user can also select the information coded throughthe points’ colors. The available parameters are height of thepoints, distance from the LIDAR, received intensity, azimuthand vertical laser id. These parameters match the ones avail-able in the existing visualization solutions, such as VeloView[15].
The user can also select to depict the results of the detectionalgorithm, as illustrated in Figure 3. Because the results ofthe algorithm depend on the correct classification of pointsas ground or non ground, we use the color to depict thisclassification. Points classified as ground are depicted in green,and non ground in blue.
The detected objects are depicted as white bounding boxes.Using the inspector, the user can set the distance thresholdand the beta threshold parameters and see the changes inthe detection results immediately. We also incorporated someadditional parameters that were proven useful to further reducefalse detections:
• Minimun distance from the LIDAR: This helps reducingfalse detection due to very close objects, such as thecameras in the mast.
• Minimum and maximum size of the objects: Because we
Figure 4. Example of the exploration of the algorithm results. Clicking onone node will display its neighbors as visible in (a). The distance betweennodes to be considered neighbors can be modified so the identified objectsare grouped as one.
were interested in detecting planes, we set a minimumand maximum size to reduce false detections. This comesat the cost of potentially missing objects, if they arecovered by few points. The limitations will be discussedin more detail in the Section VI.
• Minimum and maximum azimuth: As depicted in Figure3, some objects are detected on the building roof. Toavoid such detections, we can filter the minimum andmaximum azimuths so that only the detections happeningin the airfield parking are considered.
Each selected object can also be selected and removed fromthe detected objects. This will result in filtering out all theobjects at a vicinity of the removed object. This is useful toremove recurrent false detections produced by noise.
C. Interactive exploration of the algorithms’ results
In order to make the algorithm processing more understand-able, we first propose to enable the exploration of the graphcalculated by the algorithm described in Section III. Some
4
9th SESAR Innovation Days 2nd – 5th December 2019
ISSN 0770-1268
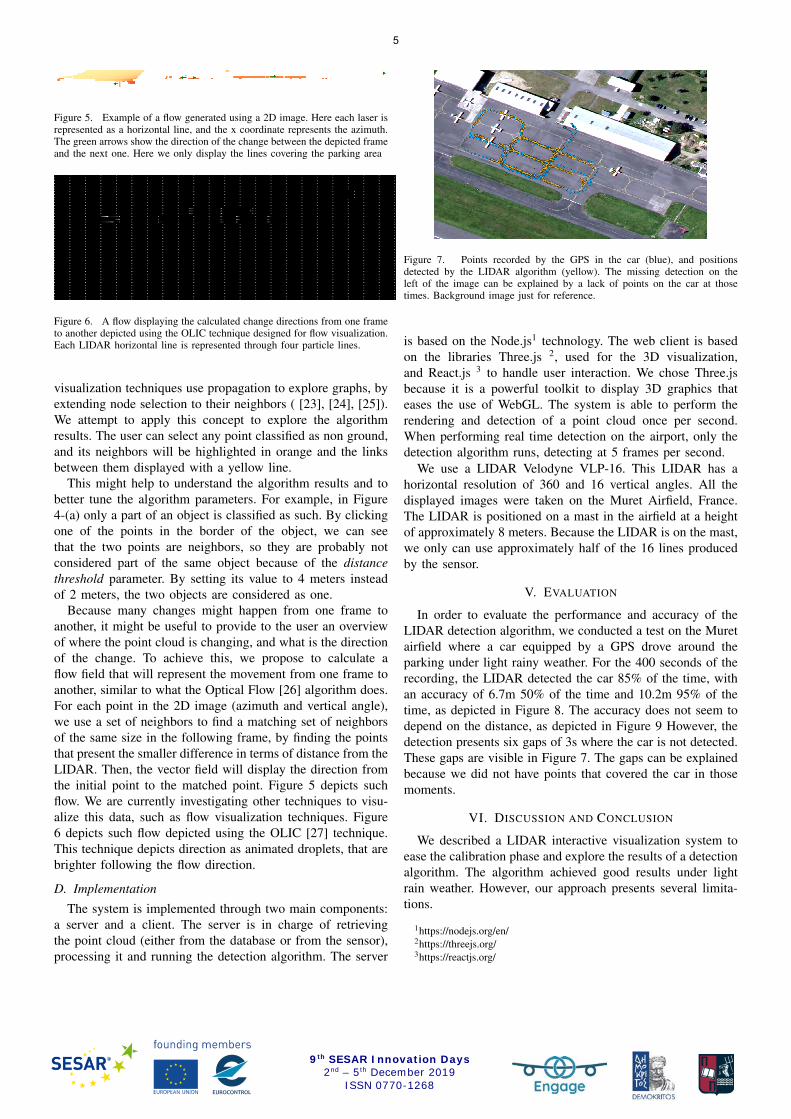
Figure 5. Example of a flow generated using a 2D image. Here each laser isrepresented as a horizontal line, and the x coordinate represents the azimuth.The green arrows show the direction of the change between the depicted frameand the next one. Here we only display the lines covering the parking area
Figure 6. A flow displaying the calculated change directions from one frameto another depicted using the OLIC technique designed for flow visualization.Each LIDAR horizontal line is represented through four particle lines.
visualization techniques use propagation to explore graphs, byextending node selection to their neighbors ( [23], [24], [25]).We attempt to apply this concept to explore the algorithmresults. The user can select any point classified as non ground,and its neighbors will be highlighted in orange and the linksbetween them displayed with a yellow line.
This might help to understand the algorithm results and tobetter tune the algorithm parameters. For example, in Figure4-(a) only a part of an object is classified as such. By clickingone of the points in the border of the object, we can seethat the two points are neighbors, so they are probably notconsidered part of the same object because of the distancethreshold parameter. By setting its value to 4 meters insteadof 2 meters, the two objects are considered as one.
Because many changes might happen from one frame toanother, it might be useful to provide to the user an overviewof where the point cloud is changing, and what is the directionof the change. To achieve this, we propose to calculate aflow field that will represent the movement from one frame toanother, similar to what the Optical Flow [26] algorithm does.For each point in the 2D image (azimuth and vertical angle),we use a set of neighbors to find a matching set of neighborsof the same size in the following frame, by finding the pointsthat present the smaller difference in terms of distance from theLIDAR. Then, the vector field will display the direction fromthe initial point to the matched point. Figure 5 depicts suchflow. We are currently investigating other techniques to visu-alize this data, such as flow visualization techniques. Figure6 depicts such flow depicted using the OLIC [27] technique.This technique depicts direction as animated droplets, that arebrighter following the flow direction.
D. Implementation
The system is implemented through two main components:a server and a client. The server is in charge of retrievingthe point cloud (either from the database or from the sensor),processing it and running the detection algorithm. The server
Figure 7. Points recorded by the GPS in the car (blue), and positionsdetected by the LIDAR algorithm (yellow). The missing detection on theleft of the image can be explained by a lack of points on the car at thosetimes. Background image just for reference.
is based on the Node.js1 technology. The web client is basedon the libraries Three.js 2, used for the 3D visualization,and React.js 3 to handle user interaction. We chose Three.jsbecause it is a powerful toolkit to display 3D graphics thateases the use of WebGL. The system is able to perform therendering and detection of a point cloud once per second.When performing real time detection on the airport, only thedetection algorithm runs, detecting at 5 frames per second.
We use a LIDAR Velodyne VLP-16. This LIDAR has ahorizontal resolution of 360 and 16 vertical angles. All thedisplayed images were taken on the Muret Airfield, France.The LIDAR is positioned on a mast in the airfield at a heightof approximately 8 meters. Because the LIDAR is on the mast,we only can use approximately half of the 16 lines producedby the sensor.
V. EVALUATION
In order to evaluate the performance and accuracy of theLIDAR detection algorithm, we conducted a test on the Muretairfield where a car equipped by a GPS drove around theparking under light rainy weather. For the 400 seconds of therecording, the LIDAR detected the car 85% of the time, withan accuracy of 6.7m 50% of the time and 10.2m 95% of thetime, as depicted in Figure 8. The accuracy does not seem todepend on the distance, as depicted in Figure 9 However, thedetection presents six gaps of 3s where the car is not detected.These gaps are visible in Figure 7. The gaps can be explainedbecause we did not have points that covered the car in thosemoments.
VI. DISCUSSION AND CONCLUSION
We described a LIDAR interactive visualization system toease the calibration phase and explore the results of a detectionalgorithm. The algorithm achieved good results under lightrain weather. However, our approach presents several limita-tions.
1https://nodejs.org/en/2https://threejs.org/3https://reactjs.org/
5
9th SESAR Innovation Days 2nd – 5th December 2019
ISSN 0770-1268
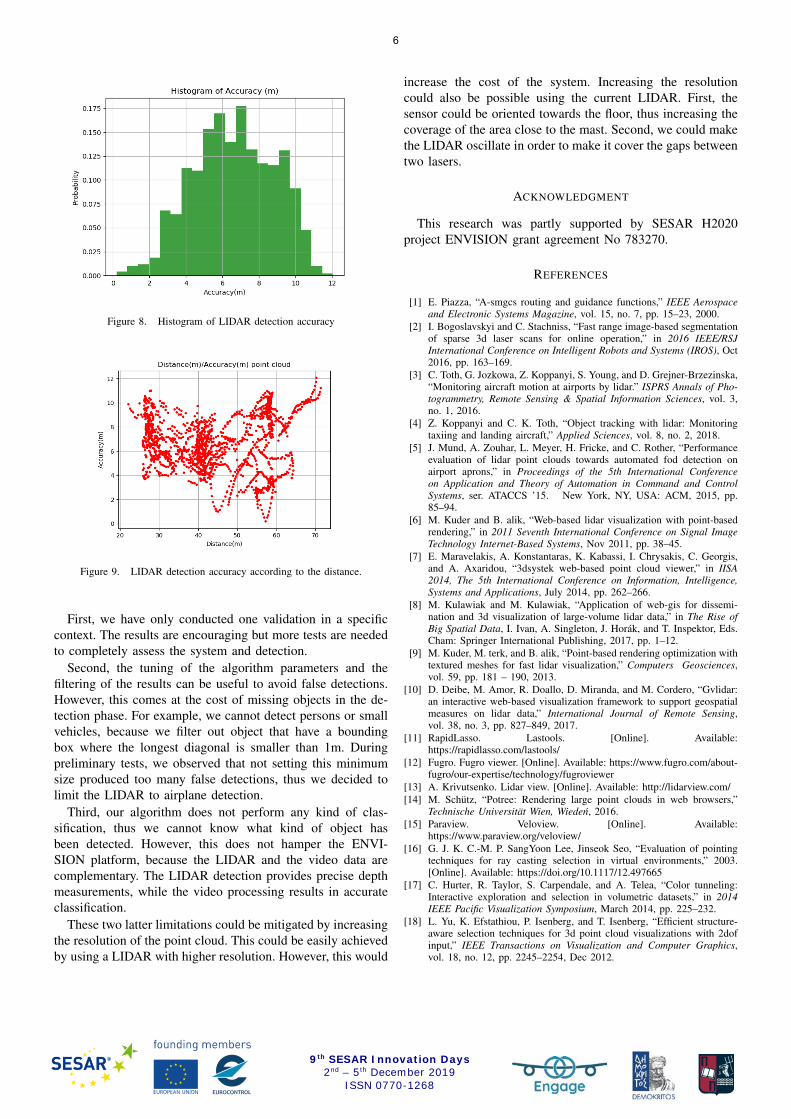
Figure 8. Histogram of LIDAR detection accuracy
Figure 9. LIDAR detection accuracy according to the distance.
First, we have only conducted one validation in a specificcontext. The results are encouraging but more tests are neededto completely assess the system and detection.
Second, the tuning of the algorithm parameters and thefiltering of the results can be useful to avoid false detections.However, this comes at the cost of missing objects in the de-tection phase. For example, we cannot detect persons or smallvehicles, because we filter out object that have a boundingbox where the longest diagonal is smaller than 1m. Duringpreliminary tests, we observed that not setting this minimumsize produced too many false detections, thus we decided tolimit the LIDAR to airplane detection.
Third, our algorithm does not perform any kind of clas-sification, thus we cannot know what kind of object hasbeen detected. However, this does not hamper the ENVI-SION platform, because the LIDAR and the video data arecomplementary. The LIDAR detection provides precise depthmeasurements, while the video processing results in accurateclassification.
These two latter limitations could be mitigated by increasingthe resolution of the point cloud. This could be easily achievedby using a LIDAR with higher resolution. However, this would
increase the cost of the system. Increasing the resolutioncould also be possible using the current LIDAR. First, thesensor could be oriented towards the floor, thus increasing thecoverage of the area close to the mast. Second, we could makethe LIDAR oscillate in order to make it cover the gaps betweentwo lasers.
ACKNOWLEDGMENT
This research was partly supported by SESAR H2020project ENVISION grant agreement No 783270.
REFERENCES
[1] E. Piazza, “A-smgcs routing and guidance functions,” IEEE Aerospaceand Electronic Systems Magazine, vol. 15, no. 7, pp. 15–23, 2000.
[2] I. Bogoslavskyi and C. Stachniss, “Fast range image-based segmentationof sparse 3d laser scans for online operation,” in 2016 IEEE/RSJInternational Conference on Intelligent Robots and Systems (IROS), Oct2016, pp. 163–169.
[3] C. Toth, G. Jozkowa, Z. Koppanyi, S. Young, and D. Grejner-Brzezinska,“Monitoring aircraft motion at airports by lidar.” ISPRS Annals of Pho-togrammetry, Remote Sensing & Spatial Information Sciences, vol. 3,no. 1, 2016.
[4] Z. Koppanyi and C. K. Toth, “Object tracking with lidar: Monitoringtaxiing and landing aircraft,” Applied Sciences, vol. 8, no. 2, 2018.
[5] J. Mund, A. Zouhar, L. Meyer, H. Fricke, and C. Rother, “Performanceevaluation of lidar point clouds towards automated fod detection onairport aprons,” in Proceedings of the 5th International Conferenceon Application and Theory of Automation in Command and ControlSystems, ser. ATACCS ’15. New York, NY, USA: ACM, 2015, pp.85–94.
[6] M. Kuder and B. alik, “Web-based lidar visualization with point-basedrendering,” in 2011 Seventh International Conference on Signal ImageTechnology Internet-Based Systems, Nov 2011, pp. 38–45.
[7] E. Maravelakis, A. Konstantaras, K. Kabassi, I. Chrysakis, C. Georgis,and A. Axaridou, “3dsystek web-based point cloud viewer,” in IISA2014, The 5th International Conference on Information, Intelligence,Systems and Applications, July 2014, pp. 262–266.
[8] M. Kulawiak and M. Kulawiak, “Application of web-gis for dissemi-nation and 3d visualization of large-volume lidar data,” in The Rise ofBig Spatial Data, I. Ivan, A. Singleton, J. Horak, and T. Inspektor, Eds.Cham: Springer International Publishing, 2017, pp. 1–12.
[9] M. Kuder, M. terk, and B. alik, “Point-based rendering optimization withtextured meshes for fast lidar visualization,” Computers Geosciences,vol. 59, pp. 181 – 190, 2013.
[10] D. Deibe, M. Amor, R. Doallo, D. Miranda, and M. Cordero, “Gvlidar:an interactive web-based visualization framework to support geospatialmeasures on lidar data,” International Journal of Remote Sensing,vol. 38, no. 3, pp. 827–849, 2017.
[11] RapidLasso. Lastools. [Online]. Available:https://rapidlasso.com/lastools/
[12] Fugro. Fugro viewer. [Online]. Available: https://www.fugro.com/about-fugro/our-expertise/technology/fugroviewer
[13] A. Krivutsenko. Lidar view. [Online]. Available: http://lidarview.com/[14] M. Schutz, “Potree: Rendering large point clouds in web browsers,”
Technische Universitat Wien, Wieden, 2016.[15] Paraview. Veloview. [Online]. Available:
https://www.paraview.org/veloview/[16] G. J. K. C.-M. P. SangYoon Lee, Jinseok Seo, “Evaluation of pointing
techniques for ray casting selection in virtual environments,” 2003.[Online]. Available: https://doi.org/10.1117/12.497665
[17] C. Hurter, R. Taylor, S. Carpendale, and A. Telea, “Color tunneling:Interactive exploration and selection in volumetric datasets,” in 2014IEEE Pacific Visualization Symposium, March 2014, pp. 225–232.
[18] L. Yu, K. Efstathiou, P. Isenberg, and T. Isenberg, “Efficient structure-aware selection techniques for 3d point cloud visualizations with 2dofinput,” IEEE Transactions on Visualization and Computer Graphics,vol. 18, no. 12, pp. 2245–2254, Dec 2012.
6
9th SESAR Innovation Days 2nd – 5th December 2019
ISSN 0770-1268
[19] A. Prouzeau, M. Cordeil, C. Robin, B. Ens, B. H. Thomas, and T. Dwyer,“Scaptics and highlight-planes: Immersive interaction techniques forfinding occluded features in 3d scatterplots,” in Proceedings of the 2019CHI Conference on Human Factors in Computing Systems, ser. CHI ’19.New York, NY, USA: ACM, 2019, pp. 325:1–325:12.
[20] C. Burwell, C. Jarvis, and K. Tansey, “The potential for using 3dvisualization for data exploration, error correction and analysis of lidarpoint clouds,” Remote Sensing Letters, vol. 3, no. 6, pp. 481–490, 2012.
[21] U. Neumann, S. You, J. Hu, B. Jiang, and J. Lee, “Augmented virtualenvironments (ave): Dynamic fusion of imagery and 3d models,” in IEEEVirtual Reality, 2003. Proceedings. IEEE, 2003, pp. 61–67.
[22] Turfjs. Turf. [Online]. Available: https://github.com/Turfjs/turf[23] J. Heer and D. Boyd, “Vizster: visualizing online social networks,” in
IEEE Symposium on Information Visualization, 2005. INFOVIS 2005.,Oct 2005, pp. 32–39.
[24] M. J. McGuffin and I. Jurisica, “Interaction techniques for selecting andmanipulating subgraphs in network visualizations,” IEEE Transactionson Visualization and Computer Graphics, vol. 15, no. 6, pp. 937–944,Nov 2009.
[25] A. Prouzeau, A. Bezerianos, and O. Chapuis, “Evaluating multi-userselection for exploring graph topology on wall-displays,” IEEE Trans-actions on Visualization and Computer Graphics, vol. 23, no. 8, pp.1936–1951, Aug 2017.
[26] B. K. Horn and B. G. Schunck, “Determining optical flow,” ArtificialIntelligence, vol. 17, no. 1, pp. 185 – 203, 1981.
[27] R. Wegenkittl, E. Groller, and W. Purgathofer, “Animating flow fields:rendering of oriented line integral convolution,” in Proceedings. Com-puter Animation ’97 (Cat. No.97TB100120), June 1997, pp. 15–21.
7
9th SESAR Innovation Days 2nd – 5th December 2019
ISSN 0770-1268