Embed Size (px)
Citation preview

A Life Cycle Assessment of the PureCell Stationary Fuel Cell System: Providing a Guide for Environmental Improvement
Jaap van Rooijen
Report No. CSS06-09
June 30, 2006
TM

A Life Cycle Assessment of the PureCell™ Stationary Fuel Cell System:
Providing a Guide for Environmental Improvement
By:
Jaap van Rooijen
University of Michigan Ann Arbor
June 30th, 2006
A report of the Center for Sustainable Systems Report No. CSS06-09
Faculty Advisors: Gregory A. Keoleian, Associate Professor Leiden University Advisor: Drs. Ing. Rene Kleijn

Document Description
A Life Cycle Assessment of the PureCell™ Stationary Fuel Cell System: Providing a Guide for Environmental Improvement Jaap van Rooijen Center for Sustainable Systems, Report No. CSS06-09 University of Michigan, Ann Arbor, Michigan June 30, 2006 100 pp., 78 tables, 37 figures, 7 appendices This document is available online at: http://css.snre.umich.edu
Center for Sustainable Systems School of Natural Resources and Environment University of Michigan 440 Church Street, Dana Building Ann Arbor, MI 48109-1041 Phone: 734-764-1412 Fax: 734-647-5841 Email: [email protected] Web: http://css.snre.umich.edu
© Copyright 2006 by the Regents of the University of Michigan
Executive Summary The PureCell™ Model 200 Power Solution (formerly the PC25™) is a stationary power system manufactured by UTC Power. It uses a 200 kW phosphoric acid fuel cell with a lifetime of 85,000 hours and it has an internal natural gas steam reforming system. The PureCell™ system can operate in both grid-connected and grid-independent mode and it also provides the option of heat recovery. When it functions as a combined heat and power (CHP) system, efficiency of 80% is achieved. Since 1991, more than 275 PureCell™ power systems have been installed at various locations around the world. UTC Power is currently redesigning the system and would value having a life cycle assessment (LCA) to highlight opportunities for improvement of its environmental performance. LCA can clarify which stages in the product life cycle and which elements of the product cause the most environmental pressure. Product development and improvement is therefore one of its direct applications. The LCA results show that the use phase has by far the biggest environmental impact. The input of natural gas in the steam reforming process and the CO2 emissions caused by this process are the main contributors to the use phase impact. Maximizing the hydrogen output of the steam reforming process and increasing the efficiency of the electrochemical reaction in the fuel cell stack are therefore the main opportunities to improve the environmental performance of the PureCell™ system. LCA results for a separate analysis of the manufacturing phase show that the fuel cell stack is responsible for almost half of the environmental impact of the manufacturing phase. The main cause is the high amount of energy used in the fuel cell stack manufacturing process. The biggest impacts per material in the manufacturing phase are caused by platinum used in the fuel cell stack, copper used in the power conditioning and control devices, and stainless steel 304 used for manifold applications. In the case of platinum especially it is beneficial to pursue a high recycling rate, since the environmental impact of recycled platinum is much smaller than that of raw platinum. The end-of-life phase has a small environmental impact compared to the use and manufacturing phases. This report also includes an analysis of two scenarios as opportunities for environmental improvement of the PureCell™ system. One scenario analyzes the effect of using renewable hydrogen from wind energy instead of using hydrogen from natural gas steam reforming. The environmental impact is highly dependent on hydrogen transport from the wind turbine site to the PureCell™ system site. However, if a transport distance of 100 miles is assumed, a decrease in the total PureCell™ system life cycle environmental impact by a factor 7 is reached. The second scenario analyzes an alternative end-of-life treatment including reuse of PureCell™ system components and maximizing platinum recycling. Component reuse impacts both the end-of-life phase (less output to waste management) and the manufacturing phase (less input of materials and energy) and shows a 16% decrease in the aggregated environmental impact of the manufacturing and end-of-life phase. The use phase impact is not taken into account here because the alternative end-of-life scenario aims only at reducing the environmental impact of the manufacturing and end-of-life phase.

2
Acknowledgements This research was performed at the Center for Sustainable Systems, University of Michigan. I would like to thank Gregory Keoleian for inviting me and for his guidance during my stay. I am also thankful to all other members of the Center for Sustainable Systems, especially David Spitzley and Helaine Hunscher, for their support on diverse occasions. Furthermore I would like to thank René Kleijn, firstly for helping me find this research subject and secondly for his long-distance guidance and support in this research. Last but certainly not least, I would like to thank the people at UTC Power, especially my ‘contact person’ Erika Herz, for their help in this research and for their hospitality during my visits to UTC Power.

3
Table of Contents Executive Summary .......................................................................................................... 1 Acknowledgements ........................................................................................................... 2 Table of Contents .............................................................................................................. 3 List of Figures .................................................................................................................... 6 List of Tables ..................................................................................................................... 8 Chapter 1 – Introduction................................................................................................ 11 Chapter 2 - Procedures ................................................................................................... 13
LCA Software ............................................................................................................... 13 Data Collection ............................................................................................................. 13 Allocation Procedures ................................................................................................... 13 Impact Assessment........................................................................................................ 14
Chapter 3 - Goal and Scope ........................................................................................... 15 Goal of the Study .......................................................................................................... 15 Function and Functional Unit ....................................................................................... 15 System Boundaries........................................................................................................ 16
Manufacturing Phase ........................................................................................................................ 16 Use Phase ........................................................................................................................................... 17 End-of-Life Phase.............................................................................................................................. 19 SimaPro System Boundaries ............................................................................................................ 19
Chapter 4 - Inventory Analysis ...................................................................................... 20 Flow Diagram ............................................................................................................... 20
Inventory Tables ............................................................................................................................... 21 Steel Data ........................................................................................................................................... 21 Processing Data ................................................................................................................................. 21 Manufacturing Phase ........................................................................................................................ 21
Air blower ...................................................................................................................................... 23 Air valve subassembly .................................................................................................................... 24 Cabinet ventilation fan ................................................................................................................... 24 Cell stack shipping bracket ............................................................................................................ 25 Condenser ...................................................................................................................................... 25 Cell Stack Assembly (CSA) ............................................................................................................. 25 Electrical Control System (ECS) .................................................................................................... 29 Enclosure ....................................................................................................................................... 30 Frame ............................................................................................................................................. 30 Fuel compartment ventilation fan .................................................................................................. 31 Harnesses and cables ..................................................................................................................... 31 Integrated Low-temperature Shift converter (ILS) ......................................................................... 32 Misc. small parts ............................................................................................................................ 33 Power Conditioning System (PCS)................................................................................................. 34 Piping ............................................................................................................................................. 34 Piping insulation ............................................................................................................................ 35 Reformer ......................................................................................................................................... 35 Steam ejector .................................................................................................................................. 36 Thermal Management System (TMS) ............................................................................................. 36 Water Treatment System (WTS) ..................................................................................................... 37
Scrap Rates ........................................................................................................................................ 37 Steel scrap ...................................................................................................................................... 38 Copper scrap .................................................................................................................................. 39

4
Use Phase ........................................................................................................................................... 40 PureCell™ System Installation ...................................................................................................... 40 Electricity Generation .................................................................................................................... 41 PureCell™ System Maintenance .................................................................................................... 43
End-of-Life Phase.............................................................................................................................. 44 Chapter 5 - Impact Assessment and Interpretation .................................................... 46
Impact and Damage Categories .................................................................................... 46 Impact Assessment Steps .............................................................................................. 47 PureCell™ System LCA Results and Interpretation .................................................... 48
PureCell™ System Life Cycle LCA Results ................................................................................... 48 PureCell™ System Use Phase LCA Results ................................................................................... 51 PureCell™ System Manufacturing Phase LCA Results ................................................................ 53 PureCell™ System CSA (Cell Stack Assembly) LCA Results ...................................................... 57 PureCell™ System LCA Results without Allocated Energy Use for CSA Production ............... 61
Contribution and Sensitivity Analysis .......................................................................... 64 Contribution Analysis ....................................................................................................................... 65 Sensitivity Analysis ........................................................................................................................... 67 Eco-indicator 99 Robustness Analysis ............................................................................................. 70 Sensitivity Analysis for Assumptions .............................................................................................. 71
Conclusions ................................................................................................................... 75 Chapter 6 - Opportunities and Implementation in LCA ............................................ 77
Renewable Hydrogen from Wind Energy ..................................................................... 77 System Description ............................................................................................................................ 77 Inventory Tables ............................................................................................................................... 79 Results ................................................................................................................................................ 83
100 Miles Transport Scenario ........................................................................................................ 83 1000 Miles Transport Scenario ...................................................................................................... 86
Conclusions ........................................................................................................................................ 88 Alternative End-of-Life Scenario ................................................................................. 89
Changes in SimaPro Model .............................................................................................................. 89 Results ................................................................................................................................................ 92 Conclusions ........................................................................................................................................ 94
Chapter 7 - Final Conclusions ....................................................................................... 96 References ........................................................................................................................ 99 Appendices ..................................................................................................................... 101
Appendix A: PureCell™ System Manufacturing Phase Aggregated Inventory Table102 Appendix B: PureCell™ System Use Phase Inventory Tables................................... 104 Appendix C: PureCell™ System End-of-Life Phase Inventory Table ....................... 105 Appendix D: PureCell™ System Processes Imported in SimaPro ............................. 106
Steel cold rolled coil IISI [8] ............................................................................................................106 Stainless Steel 304 2B IISI [8] .........................................................................................................107 Stainless Steel 316 2B IISI [8] .........................................................................................................109 Graphite PureCell™ system [15] ....................................................................................................110 Electric Components PureCell™ system [16] ................................................................................111 MI250 Inverter [16] .........................................................................................................................111 Semiconductor chip PureCell™ system [17] .................................................................................117 Semiconductor wafer PureCell™ system [17] ...............................................................................117 Silicon wafer PureCell™ system [17] .............................................................................................119 Electric motor PureCell™ system [11] ...........................................................................................119 Aluminum (primary) produced in the USA [6] .............................................................................120 Platinum recycled PureCell™ system [13] .....................................................................................122 Activated carbon PureCell™ system [20] ......................................................................................122

5
Appendix E: PureCell™ System Life Cycle CO2-equivalent Emissions and Energy Use..................................................................................................................................... 123 Appendix F: UTC Power South Windsor Electricity Mix .......................................... 124 Appendix G: Calculations for the PureCell™ System Hydrogen Consumption ........ 125

6
List of Figures Figure 3-1: Manufacturing phase system boundary .......................................................... 17 Figure 3-2: Use phase system boundary ........................................................................... 18 Figure 3-3: End-of-Life phase system boundary .............................................................. 19 Figure 4-1: Flow diagram PureCell™ system LCA model .............................................. 20 Figure 4-2: PureCell™ subsystem and component breakdown ........................................ 22 Figure 4-3: UTC Power platinum internal recycling ........................................................ 27 Figure 5-1: PureCell™ system life cycle, weighted results for the impact categories ..... 49 Figure 5-2: PureCell™ system life cycle, weighted results for the damage categories .... 49 Figure 5-3: PureCell™ system life cycle, single score results showing contribution of impact categories .............................................................................................................. 50 Figure 5-4: PureCell™ system life cycle, single score results showing contribution of damage categories ............................................................................................................. 50 Figure 5-5: PureCell™ system use phase, weighted results for the impact categories .... 51 Figure 5-6: PureCell™ system use phase, weighted results for the damage categories ... 51 Figure 5-7: PureCell™ system use phase, single score results showing contribution of impact categories .............................................................................................................. 52 Figure 5-8: PureCell™ system use phase, single score results showing contribution of damage categories ............................................................................................................. 52 Figure 5-9: PureCell™ System manufacturing phase SimaPro network .......................... 54 Figure 5-10: PureCell™ system manufacturing phase, single score results showing contribution of impact categories...................................................................................... 55 Figure 5-11: PureCell™ system manufacturing phase, single score results showing contribution of damage categories .................................................................................... 55 Figure 5-12: PureCell™ system manufacturing phase, overview of total environmental impact per material ........................................................................................................... 56 Figure 5-13: PureCell™ system CSA SimaPro network .................................................. 57 Figure 5-14: PureCell™ system CSA, weighted results for the impact categories .......... 58 Figure 5-15: PureCell™ system CSA, weighted results for the damage categories......... 58 Figure 5-16: PureCell™ system CSA, single score results showing contribution of the impact categories .............................................................................................................. 59 Figure 5-17: PureCell™ system CSA, single score results showing contribution of damage categories ............................................................................................................. 59 Figure 5-18: PureCell™ system CSA, overview of total environmental impact per material ............................................................................................................................. 60 Figure 5-19: PureCell™ system CSA without allocated energy use, SimaPro network .. 61 Figure 5-20: PureCell™ system CSA without allocated energy use, overview of total environmental impact per material ................................................................................... 62 Figure 5-21: PureCell™ system manufacturing phase without allocated energy use for CSA production, SimaPro network ................................................................................... 63 Figure 5-22: PureCell™ system manufacturing phase without allocated energy use for CSA production, overview of total environmental impact per material ........................... 64 Figure 5-23: PureCell™ system manufacturing phase, overview of total environmental impact per material, 95% platinum recycling ................................................................... 72

7
Figure 6-1: Wind/electrolysis system as used in NREL study [31] .................................. 78 Figure 6-2: United States wind resource map ................................................................... 79 Figure 6-3: PureCell™ system use phase renewable hydrogen SimaPro network, 100 miles scenario.................................................................................................................... 83 Figure 6-4: PureCell™ system life cycle renewable hydrogen SimaPro network, 100 miles scenario.................................................................................................................... 84 Figure 6-5: -25 Use phase renewable hydrogen SimaPro network, 1000 miles scenario . 86 Figure 6-6: PureCell™ system life cycle renewable hydrogen SimaPro network, 1000 miles scenario.................................................................................................................... 87 Figure 6-7: PureCell™ system end-of-life phase including reuse SimaPro network ....... 91 Figure 0-1: NPCC US projected capacity fuel mix – summer 2010 ............................... 124

8
List of Tables Table 4-1: Air blower inventory data ................................................................................ 23 Table 4-2: Air valve subassembly inventory data ............................................................. 24 Table 4-3: Cabinet ventilation fan inventory data ............................................................ 24 Table 4-4: Cell stack shipping bracket inventory data ...................................................... 25 Table 4-5: Condenser inventory data ................................................................................ 25 Table 4-6: Cell Stack Assembly (CSA) inventory data .................................................... 26 Table 4-7: Electrical Control System (ECS) inventory data ............................................. 29 Table 4-8: Enclosure inventory data ................................................................................. 30 Table 4-9: Frame inventory data ....................................................................................... 30 Table 4-10: Fuel compartment ventilation fan inventory data .......................................... 31 Table 4-11: Harnesses and cables inventory data ............................................................. 31 Table 4-12: Integrated Low-temperature Shift converter (ILS) inventory data ............... 32 Table 4-13: Misc. small parts inventory table .................................................................. 33 Table 4-14: Power Conditioning System (PCS) inventory data ....................................... 34 Table 4-15: Piping inventory data ..................................................................................... 34 Table 4-16: Piping insulation inventory data .................................................................... 35 Table 4-17: Reformer inventory list ................................................................................. 35 Table 4-18: Steam ejector inventory data ......................................................................... 36 Table 4-19: Thermal Management System (TMS) inventory data ................................... 36 Table 4-20: Water Treatment System (WTS) inventory data ........................................... 37 Table 4-21: Steel scrap inventory data .............................................................................. 39 Table 4-22: Copper scrap inventory data .......................................................................... 39 Table 4-23: PureCell™ system installation inventory data .............................................. 40 Table 4-24: 200 kWh electricity generation inventory data ............................................. 41 Table 4-25: 17,000,000 kWh electricity generation inventory data ................................. 42 Table 4-26: PureCell™ system maintenance inventory data ............................................ 43 Table 4-27: PureCell™ system end-of-life phase, materials to waste treatment .............. 44 Table 5-1: Contribution analysis per phase for PureCell™ system life cycle single score result .................................................................................................................................. 65 Table 5-2: Contribution analysis per material process for PureCell™ system life cycle single score result .............................................................................................................. 65 Table 5-3: Contribution analysis per material process for PureCell™ system manufacturing phase single score result ........................................................................... 66 Table 5-4: Contribution analysis per material process for PureCell™ system use phase single score result .............................................................................................................. 66 Table 5-5: Contribution analysis per material process for PureCell™ system end-of-life phase single score result .................................................................................................... 67 Table 5-6: 1% Perturbation in natural gas usage, PureCell™ system use phase single score result ........................................................................................................................ 68 Table 5-7: 1% Perturbation in CO2 emissions, PureCell™ system use phase single score result .................................................................................................................................. 68 Table 5-8: 1% Perturbation in allocated energy for CSA production, PureCell™ system manufacturing phase single score result ........................................................................... 68

9
Table 5-9: 1% Perturbation in total platinum input, PureCell™ system manufacturing phase single score result .................................................................................................... 69 Table 5-10: 1% Perturbation in copper input, PureCell™ system manufacturing phase single score result .............................................................................................................. 69 Table 5-11: PureCell™ system life cycle single score results for three Eco-indicator 99 perspectives ....................................................................................................................... 71 Table 5-12: 95% Platinum recycling rate, PureCell™ system manufacturing phase single score result ........................................................................................................................ 71 Table 5-13: 0.5 Steel scrap rate, PureCell™ system manufacturing phase single score result .................................................................................................................................. 72 Table 5-14: Transport scenario to Koln, Germany, PureCell™ system manufacturing phase single score result .................................................................................................... 73 Table 5-15: PureCell™ system end-of-life phase, scrap metal output ............................. 74 Table 5-16: Scrap metal output, PureCell™ system end-of-life phase single score result74 Table 6-1: Renewable hydrogen from wind energy NREL inventory data ...................... 80 Table 6-2: 200 kWh electricity generation inventory data, renewable hydrogen ............. 81 Table 6-3:17,000,000 kWh electricity generation inventory data, renewable hydrogen .. 81 Table 6-4: Steel scrap inventory data, renewable hydrogen ............................................. 82 Table 6-5: PureCell™ system use phase, steam reforming vs. renewable hydrogen single score results, 100 miles scenario ....................................................................................... 84 Table 6-6: PureCell™ system life cycle, steam reforming vs. renewable hydrogen single score results, 100 miles scenario ....................................................................................... 85 Table 6-7: PureCell™ system use phase, steam reforming vs. renewable hydrogen single score results, 1000 miles scenario ..................................................................................... 87 Table 6-8: PureCell™ system life cycle, steam reforming vs. renewable hydrogen single score results, 1000 miles scenario ..................................................................................... 88 Table 6-9: PCS SimaPro waste scenario ........................................................................... 90 Table 6-10: PureCell™ system PCS disposal scenario including reuse ........................... 90 Table 6-11: ILS Platinum and palladium data 98% recycling .......................................... 92 Table 6-12: PureCell™ system end-of-life phase, without vs. with reuse single score results ................................................................................................................................ 93 Table 6-13: PureCell™ system manufacturing phase, current PureCell™ system vs. ILS Pt & Pd 98% recycling single score results ...................................................................... 93 Table 6-14: Original vs. alternative end-of-life scenario, PureCell™ system manufacturing phase and end-of-life phase single score results aggregated .................... 94 Table 0-1: PureCell™ system manufacturing phase aggregated inventory table ........... 103 Table 0-2: PureCell™ system installation inventory data .............................................. 104 Table 0-3: 17,000,000 kWh electricity generation inventory data ................................. 104 Table 0-4: PureCell™ system maintenance inventory data ............................................ 105 Table 0-5: PureCell™ system end-of-life phase, materials to waste treatment .............. 106 Table 0-6: Steel cold rolled coil IISI............................................................................... 107 Table 0-7: Stainless Steel 304 2B IISI ............................................................................ 108 Table 0-8: Stainless Steel 316 2B IISI ............................................................................ 110 Table 0-9: Graphite PureCell™ system .......................................................................... 110 Table 0-10: Electric Components PureCell™ system .................................................... 111 Table 0-11: MI250 Inverter ............................................................................................ 117

10
Table 0-12: Semiconductor chip PureCell™ system ...................................................... 117 Table 0-13: Semiconductor wafer PureCell™ system .................................................... 118 Table 0-14: Silicon wafer PureCell™ system................................................................. 119 Table 0-15: Electric motor PureCell™ system ............................................................... 119 Table 0-16: Aluminum (primary) produced in the USA ................................................ 121 Table 0-17: Platinum recycled PureCell™ system ......................................................... 122 Table 0-18: Activated carbon PureCell™ system........................................................... 122 Table 0-19: PureCell™ system CO2-equivalent emissions ............................................ 123 Table 0-20: PureCell™ system energy use ..................................................................... 123

11
Chapter 1 – Introduction More people are becoming conscious of the fact that our non-renewable energy resources are declining, and that we therefore have to switch to (more) renewable resources to satisfy our energy demand. In 2003 only 8% of the world primary energy production came from renewable sources [1]. A technology that is currently seen as a possible contribution to solve this problem and that has been subject to increasing support is fuel cell technology. Fuel cells have the potential to cover a large market, since the opportunities include stationary, mobile and portable applications. Fuel cell stacks generally use hydrogen as a fuel (although there also exist other possible fuel types), which is at present produced through steam reforming of natural gas. Since natural gas is a non-renewable energy resource – with the exception of small volumes harvested from landfills and anaerobic digesters – one should realize that today’s fuel cells are non-renewable energy systems. However, they still have a better environmental performance when compared with conventional power plants [2]. Furthermore, both the promise of steam reforming of natural gas with carbon sequestration and of an emerging hydrogen economy in which an increasing share of the hydrogen is produced by renewable resources will only enhance the environmental performance of fuel cells. The fuel cell system that is assessed in this report is UTC Power’s PureCell™ Model 200 Power Solution system (formerly the PC25™), a 200 kW stationary phosphoric acid fuel cell. The PureCell™ system has an internal natural gas steam reforming system. Since 1991, more than 275 PureCell™ power systems have been sold, with various applications including a New York City police station and a major postal facility in Alaska. The standard PureCell™ system is a grid-connected unit that operates in parallel with the electric utility grid. The unit can also be purchased to operate either in grid-connected or grid-independent mode switching between modes automatically or on command. The PureCell™ system is a source of reliable and assured power, and it can therefore be used as a back-up power system or as a power source for remote locations. PureCell™ power systems also have the option of heat recovery. A standard PureCell™ power system is equipped with a thermal management system that provides up to 925,000 Btu/hr at 140 degrees Fahrenheit (equal to 271 kW at 60 degrees Celsius). There is also a high grade heat recovery option that provides up to 475,000 Btu/hr at up to 250 degrees Fahrenheit (equal to 139 kW at 121 degrees Celsius) [3]. Whereas the electrical efficiency of the PureCell™ system is close to 40% based on lower heating value (LHV), the total efficiency with heat recovery exceeds 80%. UTC is in the process of redesigning the system and would value having a Life Cycle Assessment (LCA) highlight opportunities for improvement when regarding its environmental performance. LCA is a systematic analysis of product life cycles from an environmental point of view. It was developed into an ISO-standard (the ISO 14040-series) in the late 1990’s [4]. An LCA can clarify which stages in the product life cycle
12
and which elements of the product cause the most environmental pressure. Product development and improvement is therefore one of its direct applications. In addition to the actual LCA of the PureCell™ system this report also describes two potential changes in the product system’s life cycle which lead to an improvement in its environmental performance. These two alternatives are: using renewable hydrogen from wind power and improving the end-of-life scenario from an environmental perspective by reusing components and maximizing platinum recycling. Each of these changes has been separately included in the LCA model in order to quantify the potential environmental improvement relative to the current PureCell™ system. Chapter 2 discusses the procedures that are followed in order to provide a consistent LCA. These procedures include data collection, data allocation and impact assessment. In Chapter 3 the goal and scope of this research are defined, including a specification of the functional unit and the system boundaries. Chapter 4 provides the inventory analysis, describing how the LCA is modeled, which data are used and which calculations and assumptions were necessary for the inventory modeling. In Chapter 5 the impact assessment step in LCA is explained, and results are shown followed by an interpretation of these results. Also a contribution and sensitivity analysis is performed. Two opportunities for environmental improvement are analyzed in Chapter 6, including LCA results and interpretation. Chapter 7 provides the final conclusions of this research project.

13
Chapter 2 - Procedures LCA Software The software that was used to model the PureCell™ system LCA is SimaPro 6.0. This LCA tool was developed by PRe Consultants, an independent private company in the Netherlands. SimaPro (System for Integrated environMental Assessment of PROducts) is currently the most widely used software for LCA studies worldwide [5].
Data Collection Collection of data is an important part of LCA. One could say that the scientific quality of the final LCA results can only be as high as the quality of the data that are used. The objective must therefore be to work with data as specific as possible. Since this LCA represents a UTC Power product, primary data were collected from UTC Power wherever possible. However, many of the components in the PureCell™ system are not manufactured by UTC Power but by supplying companies, which made the data collection more difficult and time-consuming. Therefore, in many cases data from generic Life Cycle Inventory (LCI) databases have been used. In general, a strategy of hierarchical preference regarding data collection has been used:
1. Data obtained from UTC Power. 2. Data from LCI databases especially derived with the geographical location of
UTC Power in mind. This means: applying the hierarchy described in point 3 up to and including 7, and incorporating UTC-specific data in case they can be made more relevant to the PureCell™ system.
3. Data from the Franklin database in SimaPro. This database contains late 1990’s inventory data for North American materials, energy and transport.
4. Data from the online National Renewable Energy Laboratory (NREL) Life Cycle Inventory Database [6]. This is a publicly available database developed in close cooperation with the U.S. government and industry. It includes data from the Franklin database.
5. Data from other databases in SimaPro, determined on a case-by-case basis to provide the most relevant information.
6. Data from other non-SimaPro databases. 7. Data obtained by internet research.
Even though this strategy for data collection was systematically applied, some of the data used in the LCA are still incomplete or have been subject to sometimes major assumptions. In the inventory analysis for each PureCell™ system component these data gaps and assumptions are described as transparently and precisely as possible.
Allocation Procedures Data on overhead energy use (electricity and natural gas) could only be provided by UTC Power in aggregate for the entire plant, which precluded a bottom-up allocation. A top-down approach was used, allocating overhead energy to the PureCell™ system by

14
determining the facility area related to PureCell™ system manufacturing as a share of the total facility area.
Impact Assessment Impact assessment is the phase in LCA aimed at understanding and evaluating the magnitude and significance of the potential environmental impacts of the product system. A number of different impact assessment methods have been developed. For this report, the Eco-indicator 99 method was used. Eco-indicator 99 is an endpoint-oriented method, which means that value-based modeling assumptions are included. In SimaPro, Eco-indicator 99 offers the option to analyze the LCA results both per impact category and per damage category. Impact categories include for example carcinogens, climate change and ecotoxicity. There are three damage categories in Eco-indicator 99: human health, ecosystem quality and resources. These damage categories are obtained by grouping and adding the impact categories, in order to allow a wide variety of impacts to be aggregated to a small number of environmental scores. The Eco-indicator 99 methodology comes in three different versions: the egalitarian, the hierarchist and the individualist perspective. These three versions are based on the perspective of cultural theory, and reflects the fact that the judgment of environmental problems is not objective [7]. In this research, the hierarchist perspective was used as the default method. The other two perspectives were used as a robustness analysis. An endpoint-oriented impact assessment method including value-based modeling assumptions was chosen to make the results more comprehensible for a wider audience. Since this research was primarily aimed at revealing the specifics of the environmental footprint of the PureCell™ system to UTC Power, comprehensibility was seen as an important criterion. Eco-indicator 99 is a widely accepted impact assessment method, and it offers a transparent overview of LCA results. Furthermore, the option of choosing one out of three perspectives provided the opportunity to do a robustness analysis of the LCA’s end results. For all these reasons, Eco-indicator 99 was chosen as the impact assessment method for this research.

15
Chapter 3 - Goal and Scope Goal of the Study The objective of this project is to provide a guide for environmental improvement of the PureCell™ power system. By using LCA to model the product life cycle, the ‘hotspots’ that contribute to the present environmental footprint of the product are identified. By targeting these hotspots, opportunities for improving the environmental footprint can be explored. An analysis of the targeted hotspots is given in Chapter 5 - Impact Assessment and Interpretation. Subsequent to the impact assessment results, two feasible opportunities for environmental improvement within the scope of this research were modeled in SimaPro: 1) using renewable hydrogen from wind power and 2) improving the end-of-life scenario from an environmental perspective by reusing components and maximizing platinum recycling. The goal of this part of the research is to quantify the potential environmental improvement for both opportunities relative to the current PureCell™ system.
Function and Functional Unit The primary function of the PureCell™ system is electricity production. In addition, the PureCell™ system provides the option of heat recovery. The PureCell™ system can thus be operated as a combined heat and power (CHP) system. The PureCell™ system is used as a power supply system for remote locations where there is no connection to the electricity grid, however, it still requires that a constant supply of natural gas is available. It is also used as a source for back-up power; within this application, the PureCell™ system can function as a constant or as an intermittent power supply. Also, within this application the PureCell™ system can function with a connection to the electricity grid as well as grid-independent. In the near future, the function of stationary fuel cells may become more significant, since they are constant and reliable energy conversion systems and they can therefore compensate for increased shares of fluctuating renewable energy sources used for the electricity grid. This research aims at modelling the life cycle of one PureCell™ power system. The functional unit therefore is:
• One PureCell™ power system, generating 200 kW of electricity, 480 Volt, 60 Hz, and providing optional heat recovery of 271 kW at 60 degrees Celsius, with a lifetime of 85,000 hrs.
Most of the PureCell™ systems which are currently in use have a projected lifetime of 40,000 hrs, and this model is commonly referred to within UTC Power as the PC25 C. The PC25 C is now out of production, and it is planned to utilize a new cell stack design and a new low shift converter for the steam reforming process (together with some other minor design changes), which will result in the PC25 D. These design changes give the PC25 D an expected lifetime of 85,000 hrs. The data that are used in this LCA are based on the PC25 D system. The decision to study the PC25 D was made by UTC Power.

16
System Boundaries Ideally an LCA includes all economic and environmental inputs and outputs that are part of the product’s life cycle. However, in practice it usually turns out that this is an impossible task. Therefore it is necessary to define the system boundary and indicate which processes and/or material flows are not included in the LCA. In order to create a transparent overview of the system boundary, it is described separately for the manufacturing phase, the use phase and the End-of-Life (EoL) phase.
Manufacturing Phase An inventory table of the PureCell™ system manufacturing phase should include:
• The materials used for components and parts • The processes (e.g., cold transforming of steel, molding of plastic, transport) used
for the product manufacturing • Overhead energy and other non-product materials • The emissions caused and waste generated by product manufacturing
The PureCell™ system is a product for which all components except the fuel cell stack are manufactured by external suppliers. This requires that part of the data have to be obtained from these external suppliers. Experience from previous LCA’s tells that this is a difficult and time-consuming task; therefore, it was decided not to approach these external suppliers but to work with data from UTC Power and databases instead. Although all PureCell™ system components except the fuel cell stack are manufactured by external suppliers, the design of most of these components has been made by UTC Power engineers. This means that UTC Power was able to provide most of the data described above. Data that could not be obtained for the manufacturing phase are:
• Overhead energy and other non-product materials used at the facilities of the external suppliers
• Transport of materials and parts to the facilities of the external suppliers • Manufacturing emissions and waste at the external suppliers not accounted for in
the SimaPro database manufacturing processes • Manufacturing emissions and waste at UTC Power (e.g., anode, coolers, flow
fields) except for the cathode manufacturing emissions and waste Transport of PureCell™ system components from the external suppliers to UTC Power however is included in the LCA. Some data on manufacturing emissions and waste at UTC Power were available, but useful data for the LCA model could not be retrieved (except for the cathode manufacturing) due to unknown waste stream concentrations and the difficulty of allocation. Capital goods used for PureCell™ system manufacturing are not included in the LCA.
17
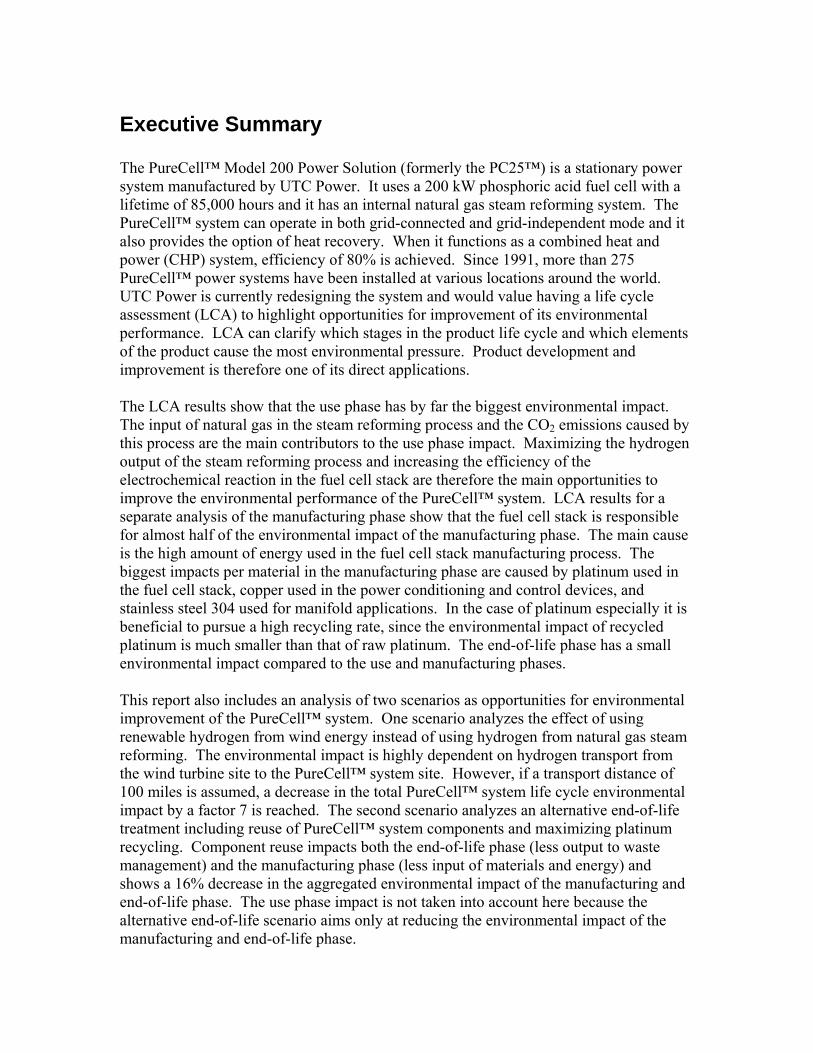
Figure 3-1 indicates the manufacturing phase system boundary.
Figure 3-1: Manufacturing phase system boundary
Use Phase An inventory table of the PureCell™ system use phase should include:
• The natural gas input for the PureCell™ system lifetime • The emissions from the steam reforming process • The installation materials and processes for installing the PureCell™ system at the
client’s site • Components and parts that need to be replaced during the PureCell™ system
lifetime • Waste generated by maintenance activities • Transport-related: of PureCell™ system from UTC Power to client, of installation
materials to PureCell™ system site, of maintenance components to PureCell™ system site, and of replaced components and maintenance waste to waste treatment

18
Most of these data were obtained from UTC Power reports, manuals and personal interviews. However, obtaining the transport-related data was problematic. The PureCell™ system sites differ significantly per client. Due to the both regional and globalized market of the PureCell™ system (site locations include Hartford, CT, but also cities in Germany and Japan), making an assumption about the transport distance to the site location does not correctly reflect a realistic situation. Therefore the use phase transport data listed below are not included in the base case LCA. However, in order to get an idea of the possible significance of PureCell™ system transport from UTC Power to clients, a scenario where the PureCell™ system is transported to Koln, Germany, is included as an option in the LCA model. Koln is chosen because this is one of the actual site locations of the PureCell™ system. The results obtained by including this scenario are shown in the ‘Sensitivity Analysis for Assumptions’ section of Chapter 5. Figure 3-2 indicates the use phase system boundary and activities.
Figure 3-2: Use phase system boundary

19
End-of-Life Phase An inventory table of the PureCell™ system end-of-life phase should include:
• The materials that are recycled • The materials that are going to landfill • The materials that are going to another waste treatment • Transport of materials (some still as components) to waste treatment facility
For the end-of-life (EoL) phase the waste treatment processes in SimaPro databases are used. Energy use and emissions are already taken into account in these waste treatment processes, so they do not have to be included in the inventory table. Since the end-of-life phase is not yet defined, assumptions are made about which percentage of each material goes to which waste treatment process. Regarding transport, the same problem as in the use phase arises. Due to the variety of site locations, it is not realistic to make any assumptions here. Therefore the following data for the end-of-life phase are not included in the LCA:
• Transport of materials/components to their particular waste treatment facility. Figure 3-3 indicates the end-of-life phase system boundary.
Figure 3-3: End-of-Life phase system boundary
SimaPro System Boundaries In this LCA extensive use was made of the SimaPro databases. Boundaries for elemental flows to and from nature as well as other geographical boundaries representing the product system, are defined by these databases. As much as possible databases that were representative to the geographical location of UTC Power were used.
20
Chapter 4 - Inventory Analysis This chapter shows how the LCA is modeled in SimaPro, which data are used, and which calculations and assumptions were necessary for the inventory modeling. A description of the inventory analysis is provided for each life cycle phase (manufacturing, use and end-of-life phase). First, the flow diagram of the modeled process is given, and then each distinct process is described in terms of data, calculations and assumptions.
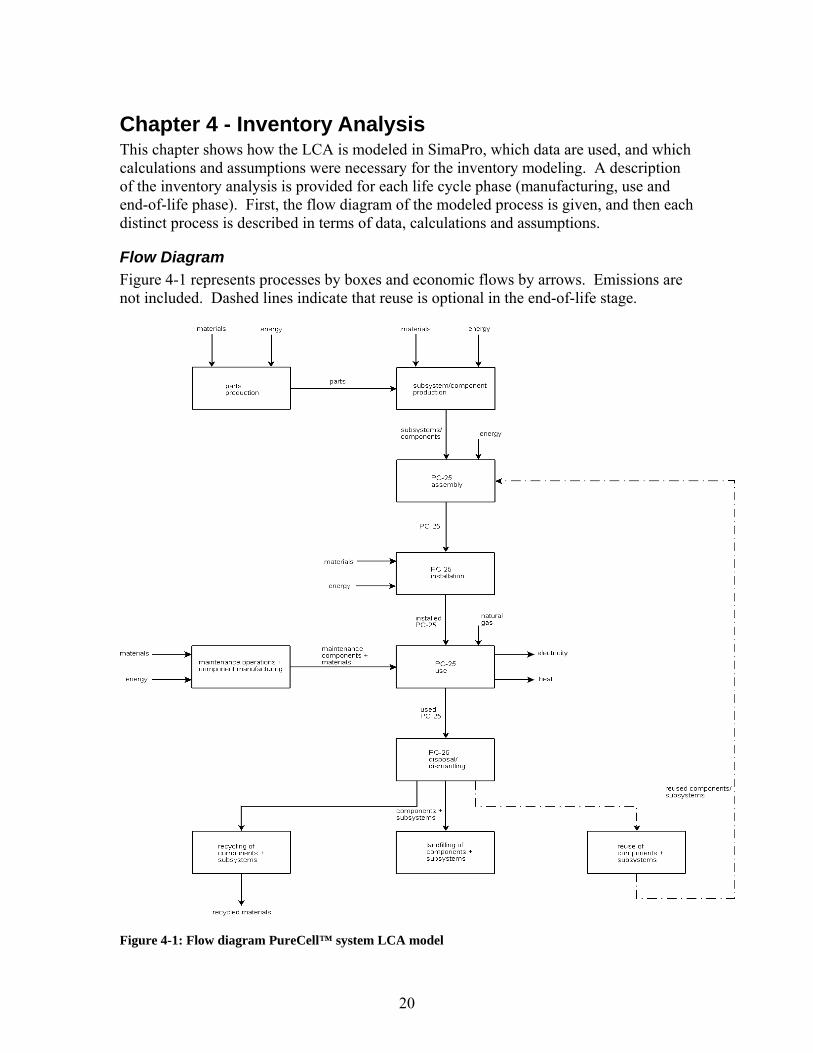
Flow Diagram Figure 4-1 represents processes by boxes and economic flows by arrows. Emissions are not included. Dashed lines indicate that reuse is optional in the end-of-life stage.
Figure 4-1: Flow diagram PureCell™ system LCA model

21
Inventory Tables The inventory tables show which data are used in the SimaPro model, giving a transparent view of what assumptions are made and where the data gaps are. Also, the calculations that were necessary to obtain certain data are described. First the steel data and processing data are described separately because they appear in almost all of the PureCell™ subsystems/components inventory tables.
Steel Data Approximately two thirds of the total weight of the PureCell™ system is made up of steel (carbon steel and stainless steel). In fact, steel is used in almost all of the PureCell™ subsystems/components. Therefore the steel data are described separately here. Three different types of steel are used in the PureCell™ system, and they appear in the inventory tables as:
• Steel cold rolled coil IISI • Stainless Steel 304 2B IISI • Stainless Steel 316 2B IISI
These steel data do not come from a SimaPro database, but are provided by the International Iron and Steel Institute, IISI [8]. IISI data are used in this LCA because they are reliable and up-to-date. The data include the recycled input of steel scrap into the steel manufacturing process. However, the ‘recycling credit’ is not included in these data. ‘Recycling credit’ is a methodology developed by the International Stainless Steel Forum (ISSF) in order to include the benefit of making more recycled material available for future use. The number to be assessed is obtained by the following formula:
• Recycled material released for new use at end-of-life – (minus) Recycled material used during manufacturing [9].
Because the recycled material released for new use at end-of-life is not defined for the PureCell™ system, and because subsystem/component reuse will also be part of the PureCell™ system end-of-life scenario, the ‘recycling credit’ is not included in the steel data for this LCA.
Processing Data In most of the inventory tables, data on material processing appears. Except for the Cell Stack Assembly (CSA), all subsystems and components were manufactured at an external supplier’s facility. All the material processing data are therefore based on personal interviews with UTC Power and modeled using the generic SimaPro databases.
Manufacturing Phase For the SimaPro model, the PureCell™ system is divided into a number of subsystems and components, as shown in Figure 4-2.

22
Figure 4-2: PureCell™ subsystem and component breakdown For each of these subsystems/components the LCI data is described. It should be noted here that the cooling module is not included in the LCA. The cooling module is a 1700 lb three fan air device with the function to reject power plant waste heat to the atmosphere. On the one hand, the cooling module is not part of the PureCell™ system, and it is neither manufactured nor assembled by UTC Power. Furthermore, the proposed 1700 lb cooling module is merely optional; it is also possible to use a cooling tower or other heat sink in lieu of the cooling module [10]. On the other hand, the function of the cooling module within the system cannot be denied, and should therefore theoretically be included when this LCA is to be regarded as representative for a stationary fuel cell system. However, no cooling module data are available, and it is deemed to be more valuable to exclude the cooling module from the LCA, and explicitly state this, than to include it by making coarse assumptions.

23
Air blower The process air blower provides high capacity air flows to key components like the CSA and the reformer in the PureCell™ system. Table 4-1 shows the air blower inventory data.1 Materials/Assemblies Amount Unit Electric motor PureCell™ system 80 lb Steel cold rolled coil IISI 50 lb Aluminum (primary) produced in the USA (NREL) 17.5 lb Aluminum 100% recycled ETH U PureCell™ system 17.5 lb Total 165 lb Processes Amount Unit Truck (single) diesel FAL (Franklin) 74 tmi2 Rolling steel I PureCell™ system 50 lb Cold transforming steel PureCell™ system 50 lb Turning steel PureCell™ system 50 lb Cold transforming Al I, PureCell™ system 35 lb Turning aluminum I, PureCell™ system 35 lb
Table 4-1: Air blower inventory data
• The air blower electric motor has a power of 5 hp and is estimated to weigh 80 lb. Internet research led to the assumption that a 5 hp electric motor weighs approximately 80 lb. The data used to model this electric motor in SimaPro came from a published environmental product declaration by ABB Motors [11].
• The percentage of recycled aluminum as input for the aluminum manufacturing process is assumed to 50%. This assumption is based on the recycling rate of aluminum cans in the United States in 2004 [12]. In the inventory table therefore two types of aluminum appear (primary and 100% recycled) in order to include this 50% recycled input in the LCA model.
• The approved source of supply is 900 miles from UTC Power, transporting 165 lb, which is equal to 74 tmi.
1 The origin of the processes in the inventory tables is described in more detail in Appendix A through D. 2 tmi = ton-mile; 1 tmi transports 1 ton over 1 mile. Note that this is an American ton (or short ton), which is 2000 lb or 907.18474 kg.

24
Air valve subassembly The air valve subassembly includes the control valves of the PureCell™ air processing system. Materials/Assemblies Amount Unit Steel cold rolled coil IISI 65 lb Stainless Steel 316 2B IISI 30 lb PP granulate average B250 PureCell™ system 10 lb Total 105 lb Processes Amount Unit Truck (single) diesel FAL (Franklin) 4.2 tmi Injection molding PureCell™ system 10 lb Forging steel PureCell™ system 95 lb
Table 4-2: Air valve subassembly inventory data
• PP granulate average B250 represents the production process of polypropylene into components for the air valve assembly by injection molding.
• The control valves are manufactured 80 miles from UTC Power, transporting 105 lb, which is equal to 4.2 tmi.
Cabinet ventilation fan The cabinet ventilation fan blows filtered ambient air into and through the PureCell™ system’s cabinet compartment. Materials/Assemblies Amount Unit Steel cold rolled coil IISI 250 lb Electric motor PureCell™ system 50 lb Total 300 lb Processes Amount Unit Rolling steel I PureCell™ system 250 lb Cold transforming steel PureCell™ system 250 lb Turning steel PureCell™ system 250 lb
Table 4-3: Cabinet ventilation fan inventory data
• Electric motor was assumed to weigh 50 lb and to be of the same power as the motor in the fuel compartment ventilation fan (1.5 hp). Internet research led to the assumption that a 1.5 hp electric motor weighs approximately 50 lb.
• Transport unknown.

25
Cell stack shipping bracket Materials/Assemblies Amount Unit Steel cold rolled coil IISI 120 lb Total 120 lb Processes Amount Unit Cold transforming steel PureCell™ system 120 lb Electric welding steel 5 PureCell™ system 2 m
Table 4-4: Cell stack shipping bracket inventory data
• Transport unknown
Condenser The function of the condenser is to condense water vapor as a product of combustion upon exit from the reformer burner and from the cathode. The reformer and cathode exhaust products including uncondensed steam exit the condenser through the roof of the power plant. Materials/Assemblies Amount Unit Stainless Steel 304 2B IISI 1150 lb Stainless Steel 316 2B IISI 200 lb Total 1350 lb Processes Amount Unit Truck (single) diesel FAL (Franklin) 606 tmi Rolling steel I PureCell™ system 1350 lb Cold transforming steel PureCell™ system 1350 lb Electric welding steel 3 PureCell™ system 10 m
Table 4-5: Condenser inventory data
• The estimate of 10 m electric welding was based on the size of the condenser. • The condenser is manufactured 900 miles from UTC Power, transporting 1350 lb,
which is equal to 606 tmi.
Cell Stack Assembly (CSA) The CSA is where the electrochemical reaction between hydrogen and oxygen takes place to produce electric power. The waste heat that is produced is removed by cooling

26
water and can be recovered in order to provide heating or cooling energy. The depleted fuel stream is used to provide heat required for the steam reforming process. Materials/Assemblies Amount Unit Platinum I PureCell™ system proprietary g Platinum recycled PureCell™ system proprietary g Steel cold rolled coil IISI 3535 lb Stainless Steel 304 2B IISI 425 lb PTFE (Teflon®) PureCell™ system 0 lb PE granulate average B250 PureCell™ system 467.7 lb Carbon black ETH U PureCell™ system 179.9 lb Graphite PureCell™ system 3784 lb Copper ETH U PureCell™ system 74 lb Glass fiber I PureCell™ system 500 lb Phosphoric acid ETH U PureCell™ system 251 lb Silicium carbide PureCell™ system 1903 lb Total 11123 lb Processes Amount Unit Cold transforming steel PureCell™ system 3535 lb Cold transforming steel PureCell™ system 425 lb UTC South Windsor electricity mix 66180 kWh Heat from natural gas FAL 311000000 Btu Waste to treatment LT waste to chemical landfill 681.4 kg Waste to chemical landfill 681.4 kg
Table 4-6: Cell Stack Assembly (CSA) inventory data Some of the materials and numbers in the inventory table need further explanation. The manufacturing phase of the CSA is described in more detail than the other subassemblies/components since the CSA is manufactured by UTC Power at the facility in South Windsor. Platinum The use of platinum in the PureCell™ system’s fuel cell stack was modeled in a special way in order to make the LCA results more synoptic and transparent. Platinum has an extremely high environmental impact, and as a result the platinum input has a high contribution to the environmental impact of the CSA. SimaPro only offers the option to model platinum input from primary production (i.e., 0% recycling), although the recycling rate for a fuel cell is likely to be up to 98% [13]. One option is to model the platinum input from primary production and to include the 98% recycling rate in the PureCell™ system end-of-life phase. This leads to a high environmental impact in the

27
manufacturing phase and a high negative environmental impact in the end-of-life phase because of platinum recycling. It does however not represent the platinum cycle for the PureCell™ system correctly. UTC Power aims to recollect the CSA’s and extract the platinum for reuse, resulting in a UTC Power internal recycling process. A schematic of this ‘internal lease’ cycle is shown in Figure 4-3.
Figure 4-3: UTC Power platinum internal recycling Thus, 2% of the platinum input into the CSA manufacturing process was raw platinum and 98% was recycled. Recycled platinum was modeled in SimaPro with LCI data from [13]. Teflon® LCI data for the production of Teflon® could not be found. Polyethylene (PE granulate average B250 PureCell™ system) was used in the LCA model instead. An investigation by the United States EPA is running regarding the chemical PFOA (perfluorooctanoic acid) [14], which is both used and emitted in the production process of Teflon®. PFOA is very persistent in the environment, and is shown to cause developmental and other adverse effects in laboratory animals. Recognizing the fact that a significant amount of Teflon® is used (467.7 lb), one must realize that substituting Teflon® with polyethylene probably leads to an underestimation of the modeled environmental impact of Teflon®. Graphite LCI data for modeling the graphite production process was obtained by EIO-LCA (Economic Input-Output LCA) [15] because no process for graphite was included in the SimaPro databases and no other literature containing LCI data on graphite production could be found. With this method LCI data are calculated based on a product category and the cost in dollar value to make the output. For graphite, the category ‘Carbon and graphite product manufacturing’ was selected with a product value of $6,924 (UTC

28
Power data for 2005 value, which was converted to 1997 value to match the EIO-LCA model). Although this value is the cost price for UTC Power and not the output value, the application of this economic value to EIO-LCA was seen as the best way to obtain LCI data on the graphite production process. Electricity and natural gas allocation Data on electricity and natural gas usage were only available as one number for the entire UTC Power facility. Therefore they had to be allocated to the PureCell™ system production. The allocation was done by area; 43,224 ft2 out of 300,000 ft2 (total facility area) is used for PureCell™ system manufacturing, which is 14.4%. Because 2001 was the last full year of PureCell™ system production the electricity and natural gas usage data for this year were used. In 2001, 29 PureCell™ system power plants were produced.
• 2001 electricity usage: 13,328,000 kWh. This means that
kWhkWh 66180000,328,13*29144.0
=⎟⎠⎞
⎜⎝⎛ was used per produced PureCell™
system. The electricity is specified as ‘UTC South Windsor electricity mix’, representing the grid electricity mix applicable to Connecticut (see Appendix F).
• 2001 natural gas usage: 608,000 CCF. One CCF is equal to 100 cubic feet, which
means that cuftCCF 900,301100*000,608*29144.0
=⎟⎠⎞
⎜⎝⎛ is used per produced
PureCell™ system. Given the fact that the heating value of natural gas is 1030 Btu/cuft this leads to the number of 311,000,000 Btu per produced PureCell™ system.
The electricity and natural gas data are included in the CSA inventory table although part of the electricity and natural gas consumption is used for PureCell™ system assembly and for overhead like facility heating and lighting. However, cell stack manufacturing is an energy intensive process and therefore it is assumed that by far the largest part of the electricity and natural gas consumption is used for CSA manufacturing. Cathode production waste In the cathode production process a large amount of hazardous waste water is produced. This waste water is hazardous because the hexavalent chromium ( )(VICr ) concentration is 10.2 mg/liter, which exceeds the allowed concentration by law of 5.0 mg/liter. (NOTE: An internal review questioned the valence of the chromium.) The cathode production for 15 power plants resulted in 2700 gallons of hazardous waste water (2006 data). 2700 Gallons is equal to 10221 liter, and divided by 15 this gives a hazardous waste water production of 681.4 liter or 681.4 kg per power plant. In SimaPro it is not possible to specify the concentration of )(VICr in the waste water; it is only possible to specify the amount of waste that is sent to a particular waste treatment process. Hence, 681.4 kg waste is sent for chemical treatment and disposal (modeled as landfill disposal although liquid waste cannot be landfilled directly). This number appears twice in the inventory table because both the short-term and long-term effects are taken into account. The

29
short-term process describes the emissions during waste treatment. Long term emissions are those expected after 150 years, when the landfill site is not controlled anymore.
Electrical Control System (ECS) The electrical control system provides complete control over the PureCell™ system’s DC power system. It also functions as a power distribution system, distributing power internally for CSA maintenance and distributing power to the PureCell™ system site or to the grid. Materials/Assemblies Amount Unit Steel cold rolled coil IISI 1000 lb Copper ETH U PureCell™ system 300 lb Electric Components PureCell™ system 150 lb Total 1450 lb Processes Amount Unit Truck (single) diesel FAL (Franklin) 725 tmi Cold transforming steel PureCell™ system 1000 lb Electric welding steel 5 PureCell™ system 5 m Copper wire PureCell™ system 300 lb
Table 4-7: Electrical Control System (ECS) inventory data
• 300 lb of copper is used in the ECS. Most of this copper is used for copper wire; therefore it is assumed that 300 lb of copper is processed into copper wire.
• The electric components in the ECS are modeled in SimaPro by using data for a 250W inverter. This inverter is used in a photovoltaic system, and an inventory list for the production was made for an earlier study performed at the Center for Sustainable Systems, University of Michigan [16]. The inverter electric components give a relatively accurate representation of the electric components used in the PureCell™ system, because they have the same function in both systems. The semiconductor devices in the inverter were however only specified in number. Therefore, another study is used to obtain and model the semiconductor production inventory data in SimaPro [17]. Both sets of inventory data are combined and scaled up linearly by mass in order to model the PureCell™ system electric components.
• The ECS is manufactured 1000 miles from UTC Power, transporting 1450 lb, which is equal to 725 tmi.

30
Enclosure The enclosure shelters the power plant from the ambient environment. It also separates the fuel cell stack compartment from the other PureCell™ subsystems and components. Materials/Assemblies Amount Unit Steel cold rolled coil IISI 3490 lb Paint ETH U PureCell™ system 10 lb Total 3500 lb Processes Amount Unit Truck (single) diesel FAL (Franklin) 805 tmi Rolling steel I PureCell™ system 3490 lb Cold transforming steel PureCell™ system 3490 lb
Table 4-8: Enclosure inventory data
• The steel enclosure is covered with powder paint. The amount of paint used for the enclosure is estimated at 10 lb. Data from the SimaPro ETH-ESU database are used here, which gives a rough estimate of the composition of paint.
• The enclosure is manufactured 460 miles from UTC Power, transporting 3500 lb, which is equal to 805 tmi.
Frame The frame functions as the skeleton of the PureCell™ system and provides attachment points for the different components. Materials/Assemblies Amount Unit Steel cold rolled coil IISI 3795 lb Paint ETH U PureCell™ system 5 lb Total 3800 lb Processes Amount Unit Truck (single) diesel FAL (Franklin) 760 tmi Cold transforming steel PureCell™ system 3795 lb Electric welding steel 5 PureCell™ system 10 m
Table 4-9: Frame inventory data
• The amount of paint used for the enclosure is estimated at 5 lb. • The frame is manufactured 400 miles from UTC Power, transporting 3800 lb,
which is equal to 760 tmi.

31
Fuel compartment ventilation fan The fuel compartment ventilation fan draws ambient air out of the fuel cell stack compartment to prevent buildup of combustible gases. Materials/Assemblies Amount Unit Electric motor PureCell™ system 50 lb Aluminum (primary) produced in the USA 25 lb Aluminum 100% recycled ETH U PureCell™ system 25 lb Steel cold rolled coil IISI 50 lb Total 150 lb Processes Amount Unit Truck (single) diesel FAL (Franklin) 56 tmi Cold transforming steel PureCell™ system 50 lb Turning steel PureCell™ system 50 lb Cast work, non-ferro, PureCell™ system 50 lb
Table 4-10: Fuel compartment ventilation fan inventory data
• A 1.5 hp electric motor is used and was assumed to weigh 50 lb. • The fuel compartment ventilation fan is manufactured 750 miles from UTC
Power, transporting 150 lb, which is equal to 56 tmi. • The ventilation fan has a cast aluminum housing; steel is used for the rest of the
construction. The ‘Cast work, non-ferro, PureCell™ system’ represents the casting of the aluminum.
Harnesses and cables This inventory table represents the materials that are used for the manifold applications of wires, cables and their insulation. Materials/Assemblies Amount Unit Copper ETH U PureCell™ system 100 lb PET ETH U PureCell™ system 85 lb Total 185 lb Processes Amount Unit Copper wire PureCell™ system 100 lb Extrusion I 85 lb
Table 4-11: Harnesses and cables inventory data

32
• The ‘PET ETH U, adapted to US represents the plastic that is used for insulation. This plastic is assumed to be polyester, since the material properties of polyester allow it to be used in temperatures up to 200 degrees Celsius (unlike PVC) [18], which is the operating temperature of a phosphoric acid fuel cell.
• Copper was processed into copper wire, and polyester was assumed to be extruded into the required form.
• Transport unknown.
Integrated Low-temperature Shift converter (ILS) The ILS is part of the fuel processing system. Its functions include: fuel desulphurization via the hydrodesulphurizer catalyst bed, carbon monoxide reduction via the shift converter catalyst bed and process steam superheating by removing heat from the reformer process fuel exit gas. Materials/Assemblies Amount Unit Stainless Steel 304 2B IISI 2683 lb Steel cold rolled coil IISI 2029 lb Copper ETH U PureCell™ system 268 lb Zinc oxide PureCell™ system 174 lb (Zinc) 139.2 lb Aluminum oxide PureCell™ system 63.8 lb Platinum I PureCell™ system 22.6 g Palladium I PureCell™ system 8.8 g Aluminum oxide PureCell™ system 137.9 lb Zinc oxide PureCell™ system 1074 lb (Zinc) 859.2 lb Glass fiber I PureCell™ system 85 lb Total 6515 lb Processes Amount Unit Truck (single) diesel FAL (Franklin) 1303 tmi Rolling steel I PureCell™ system 2683 lb Rolling steel I PureCell™ system 2029 lb Cold transforming steel PureCell™ system 2683 lb Cold transforming steel PureCell™ system 2029 lb Electric welding steel 5 PureCell™ system 5 m
Table 4-12: Integrated Low-temperature Shift converter (ILS) inventory data The steel is used to manufacture the vessel which contains the catalyst beds. The glass fiber is used as insulation. The hydrodesulphurizer catalyst bed is an alumina substrate (137.9 lb) with platinum and palladium catalyst (22.6 g and 8.8 g respectively). A zinc-oxide bed (1074 lb) is used to remove the hydrogen sulfide. The shift converter catalyst bed is made of copper (268 lb) on an alumina substrate (63.8 lb) and zinc-oxide (174 lb).

33
• Zinc-oxide is not included in the SimaPro databases, and no data on zinc-oxide production were found elsewhere. Although zinc-oxide appears as such in the inventory table, this process only includes zinc input and no emissions. The amount of zinc in zinc-oxide is determined by stoichiometric calculations: zinc-oxide ( ZnO ) has a total molecular mass of 81 u, since the atomic mass of zinc is 65 u and oxygen is 16 u. The mass ratio of zinc in zinc-oxide is therefore 65/81, which is 80%. In the zinc-oxide process the zinc input is therefore modeled as 0.8 lb zinc per 1 lb zinc-oxide, which leads to 139.2 lb and 859.2 lb zinc for the ILS catalyst beds. It should be noted that the use of this zinc-oxide process leads to a significant underestimation of the contribution of zinc-oxide to the environmental footprint of the PureCell™ system.
• The ILS is manufactured 400 miles from UTC Power, transporting 6515 lb, which is equal to 1303 tmi.
Misc. small parts This inventory table represents the miscellaneous small parts that are used in the PureCell™ system. Materials/Assemblies Amount Unit Steel cold rolled coil IISI 35 lb Stainless Steel 304 2B IISI 15 lb Stainless Steel 316 2B IISI 15 lb PP granulate average B250 PureCell™ system 35 lb Total 100 lb Processes Amount Unit Cold transforming steel PureCell™ system 65 lb Injection molding PureCell™ system 35 lb
Table 4-13: Misc. small parts inventory table
• ‘PP granulate average B250 PureCell™ system’ represents the polypropylene parts, which are processed by injection molding.
• Transport unknown.

34
Power Conditioning System (PCS) The PCS converts unregulated DC power into three phase utility grade power. It provides harmonic control and protects the power plant from out of limits conditions. Materials/Assemblies Amount Unit Steel cold rolled coil IISI 3950 lb Copper ETH U PureCell™ system 1800 lb Electric Components PureCell™ system 200 lb Total 5950 lb Processes Amount Unit Truck (single) diesel FAL (Franklin) 2977 tmi Cold transforming steel PureCell™ system 3950 lb Electric welding steel 5 PureCell™ system 5 m Copper wire PureCell™ system 1800 lb
Table 4-14: Power Conditioning System (PCS) inventory data
• The electric components in the PCS are modeled in the same way as the electric components in the ECS, based on the inventory data of a 250 W inverter in a photovoltaic system.
• The PCS is manufactured 1000 miles from UTC Power, transporting 5950 lb, which is equal to 2977 tmi.
Piping Materials/Assemblies Amount Unit Steel cold rolled coil IISI 430 lb Total 430 lb Processes Amount Unit Cold transforming steel PureCell™ system 430 lb Truck (single) diesel FAL (Franklin) 54 tmi
Table 4-15: Piping inventory data
• The pipes are manufactured 250 miles from UTC Power, transporting 430 lb, which is equal to 54 tmi.

35
Piping insulation Materials/Assemblies Amount Unit Glass fiber I PureCell™ system 200 lb Total 200 lb
Table 4-16: Piping insulation inventory data
• Transport unknown.
Reformer The reformer is a vessel that converts superheated steam and desulphurized natural gas (from the ILS) into a hydrogen-rich stream by steam reforming. A nickel on lanthanum stabilized alumina catalyst is used. Materials/Assemblies Amount Unit Lanthanum PureCell™ system proprietary Stainless Steel 304 2B IISI 2615 lb Steel cold rolled coil IISI 195 lb Zeolite ETH U PureCell™ system 326 lb Aluminum oxide PureCell™ system 273 lb Nickel enriched ETH U PureCell™ system proprietary Total 3500 lb Processes Amount Unit Truck (single) diesel FAL (Franklin) 700 tmi Rolling steel I PureCell™ system 2615 lb Electric welding steel 5 PureCell™ system 5 m Cold transforming steel PureCell™ system 2615 lb Cold transforming steel PureCell™ system 195 lb
Table 4-17: Reformer inventory list The reformer vessel is made of stainless steel 304; the vessel is insulated internally with zeolite. The reformer catalyst for the steam reforming reaction is nickel on lanthanum stabilized alumina. The total weight of the catalyst materials is 364 lb. The remaining 273 lb is alumina.
• The reformer is manufactured 400 miles from UTC Power, transporting 3500 lb, which is equal to 700 tmi.

36
Steam ejector The steam ejector is a mechanical device that mixes desulphurized natural gas and steam for the steam reforming reaction in the reformer. Materials/Assemblies Amount Unit Stainless Steel 304 2B IISI 100 lb Total 100 lb Processes Amount Unit Truck (single) diesel FAL (Franklin) 50 tmi Cast work PureCell™ system 100 lb
Table 4-18: Steam ejector inventory data
• The steam ejector is manufactured 1000 miles from UTC Power, transporting 100 lb, which is equal to 50 tmi.
Thermal Management System (TMS) The TMS maintains a proper cell stack temperature, it supplies steam to the fuel processing system (ILS and reformer) and it provides the customer with the heat recovery option. Materials/Assemblies Amount Unit Steel cold rolled coil IISI 880 lb Stainless Steel 304 2B IISI 150 lb Stainless Steel 316 2B IISI 20 lb Steel cold rolled coil IISI 950 lb Stainless Steel 316 2B IISI 250 lb Total 2250 lb Processes Amount Unit Truck (single) diesel FAL (Franklin) 281 tmi Rolling steel I PureCell™ system 1050 lb Cold transforming steel PureCell™ system 1050 lb Electric welding steel 3 PureCell™ system 5 m Cold transforming steel PureCell™ system 1200 lb
Table 4-19: Thermal Management System (TMS) inventory data The TMS consists of a steam drum subassembly (with a total weight of 1050 lb; 880 lb carbon steel, 150 lb SS 304 and 20 lb SS 316) and other complementary components (950 lb carbon steel and 250 lb SS 316).

37
• The TMS is manufactured 250 miles from UTC Power, transporting 2250 lb,
which is equal to 281 tmi.
Water Treatment System (WTS) The WTS provides high purity water to the cell stack assembly (CSA) cooling loop. It also collects condensate from the condenser, strips 2CO from the entering condensate, removes organic particles and minerals and filters out particulates. Materials/Assemblies Amount Unit Steel cold rolled coil IISI 200 lb Glass fiber I PureCell™ system 135 lb Total 335 lb Processes Amount Unit Cold transforming steel PureCell™ system 200 lb Electric welding steel 3 PureCell™ system 5 m
Table 4-20: Water Treatment System (WTS) inventory data
• Glass fiber is used as insulation material. • Transport unknown.
Scrap Rates Most of the materials that appear in the inventory tables are not raw materials, but materials that already went through a manufacturing process (e.g., steel and aluminum). These material manufacturing processes, including, for example, emissions and energy input, are generally included in the way these materials are modeled in SimaPro. However, the weights that appear in the inventory tables described in this chapter are based on a weight breakdown of the PureCell™ system. Thus, so far only the materials that actually end up in the final product have been taken into account. But in the manufacturing processes of the PureCell™ subsystems and components a certain amount of scrap is produced which does not end up in the final product. Scrap rates for the majority of the materials were not included in the PureCell™ system LCA model at all. Many of the PureCell™ subsystem and component manufacturing processes are very specific, and due to the fact that the PureCell™ subsystems and components come from external suppliers these data are simply not available. The scrap rates that are included in this LCA are for steel and copper. The criterion to include the steel scrap rate is its high weight percentage relative to the total PureCell™ system; the copper scrap rate is included because it has a significant weight contribution and a relatively high environmental impact.

38
Steel scrap The scrap rate that was used to calculate the inventory data for the LCA comes from the automotive industry [19]. The scrap rate is defined as:
• Amount of scrap produced divided by amount of input material used in manufacturing process.
For steel in the automotive industry this rate is 0.35, so for every 65 lb of steel in the final product, 35 lb steel scrap is produced. The amount of steel in the final PureCell™ system is:
• Steel cold rolled coil IISI: 21142 lb • Stainless Steel 304 2B IISI: 7143 lb • Stainless Steel 316 2B IISI: 515 lb • Aggregated this is 28800 lb steel.
A scrap rate of 0.35 means that total steel used in the manufacturing process is:
lblb 4430065.0
28800= , from which lblb 1550544300*35.0 = is produced into steel scrap.
This 15505 lb steel scrap consists of:
• 11385 lb Steel cold rolled coil IISI • 3845 lb Stainless Steel 304 2B IISI • 275 lb Stainless Steel 316 2B IISI.
The steel that is scrapped also went through the steel manufacturing processes, so these also have to be taken into account. From the 28800 lb steel that is in the PureCell™ system,
• 28660 underwent the ‘Cold transforming steel PureCell™ system’ process (99.5%)
• 13500 underwent the ‘Rolling steel I PureCell™ system’ process (47%) • Other steel manufacturing processes are negligible and are not taken into account.
So, to the SimaPro steel scrap process, the following numbers have to be added:
• lblb 1543015505*995.0 = ‘Cold transforming steel PureCell™ system’ • lblb 729015505*47.0 = ‘Rolling steel I PureCell™ system’.
Finally, the produced steel scrap is assumed to be recycled. This recycling process includes the transport, shredding and melting of the steel to be recycled. These numbers result in the SimaPro inventory in Table 4-21.

39
Materials Amount Unit Steel cold rolled coil IISI 11385 lb Stainless Steel 304 2B IISI 3845 lb Stainless Steel 316 2B IISI 275 lb Total 15505 lb Processes Cold transforming steel PureCell™ system 15430 lb Rolling steel I PureCell™ system 7290 lb Waste to treatment Steel scrap to Recycling Ferro metals 15505 lb
Table 4-21: Steel scrap inventory data
Copper scrap For the copper scrap production only the copper processing for the PCS (1800 lb), ECS (300 lb) and Harnesses and Cables (100 lb) are taken into account. Together this is 2200 lb of copper. The copper scrap rate for the manufacturing of the electric components is already included in the ‘Electric Components PureCell™ system’ process. The other processes are unknown. A copper scrap rate of 0.1 for the copper wiring process is assumed. The total amount of copper used in the copper wiring process then becomes:
lblb 24449.0
2200= , from which lblb 2442444*1.0 = is produced into copper scrap.
This 244 lb of copper scrap also underwent the copper wiring process, which is therefore also included in the copper scrap process. Like the steel scrap, the copper scrap is also assumed to be recycled. These numbers result in the inventory table below. Materials Amount Unit Copper ETH U PureCell™ system 244 lb Total 244 lb Processes Copper wire, adapted to USA 244 lb Waste to treatment Copper scrap to Recycling Non-ferro metals 244 lb
Table 4-22: Copper scrap inventory data

40
Use Phase In SimaPro, the use phase is divided into PureCell™ system installation, electricity generation and PureCell™ system maintenance processes. For each of these three processes the LCI data are described.
PureCell™ System Installation To install the PureCell™ system at its site location several preparations are needed. The installation materials below are included in the PureCell™ system inventory. Materials Amount Unit Steel cold rolled coil IISI 132 lb Stainless Steel 304 2B IISI 114 lb Propylene glycol ETH U PureCell™ system 476 lb Activated carbon PureCell™ system 60 lb Concrete PureCell™ system 7940 lb Water decarbonized ETH U 992 lb Nitrogen 185 lb Total 9899 lb Processes Cold transforming steel PureCell™ system 132 lb Cold transforming steel PureCell™ system 114 lb
Table 4-23: PureCell™ system installation inventory data The steel (132 lb) is used for 12 nitrogen bottles, containing 200 cubic feet of standard industrial grade nitrogen each. In total this is 2400 cubic feet of nitrogen, which is equal to 185 lb. The nitrogen is used to purge the fuel processing system and the anode and cathode spaces during power plant startup and shutdown. The stainless steel 304 (114 lb) is used for two 55-gallon drums that are used for storing waste liquid. Propylene glycol, which is used in the thermal management system, is typically stored in plastic or painted CSTL drums. The density of propylene glycol is 1.04 times the density of water, leading to a weight of 476 lb. The activated carbon (60 lb) is used for water treatment. Data for modeling the activated carbon production in SimaPro come from an internet source [20]. The concrete is used for the foundation. The ground area of the PureCell™ system is 15.6 m2; assuming the thickness of the concrete layer to be 0.1 m, then roughly 1.5 m3 concrete (equal to 7940 lb) is needed. 75 Gallons of decarbonized water are needed to fill up the thermal management system, and another 45 gallons to fill up the water storage, which equals 992 lb of decarbonized water in total. Also a minimum of 11 ft3 of nuclear mixed resin (Rohm and Haas IRN-150) is needed to fill the water treatment system bottles. However, data on this type or an equal type of resin could not be found; this 11 ft3 of nuclear mixed resin is therefore not included in the LCA.

41
Electricity Generation The input of natural gas and the emissions caused by the steam reforming process are taken into account here. Table 4-24 gives the natural gas input and the emissions for the production of 200 kWh, which is equal to running the PureCell™ system for one hour. These data are given to show which calculations were used to determine the emissions. Thereafter these data are scaled up to the PureCell™ system lifetime of 85,000 hrs in order to provide the inventory data which are needed to describe the PureCell™ system’s total life cycle. Products Amount Unit Generated electricity, 480 Volt, 60 Hz 200 kWh Produced heat at 140 F 271.025 kWh Materials/fuels Natural gas FAL (Franklin) 2050 cuft 3 Emissions to air NOx 0.0032 lb CO 0.0046 lb CO2 112.2 kg non-methane hydrocarbon (NMHC) 0.000072 lb
Table 4-24: 200 kWh electricity generation inventory data The natural gas input and the emission of xNO , CO and NMHC are data measured by UTC Power [21]. The 2CO emissions however are calculated, since no measured data are available. The calculations are based on the assumption that natural gas is 100% 4CH . In practice, this is usually around 95%, with the other 5% mainly including ethane, nitrogen, and higher order hydrocarbons. Another assumption is that all the carbon input results in 2CO output, thereby neglecting the CO and NMHC emissions. The calculations are based on the steam reforming and low shift reactions:
224 3HCOOHCH +→+ (steam reforming)
222 HCOOHCO +→+ (shift reaction) This results in the following overall reaction:
2224 42 HCOOHCH +→+
3 cuft = cubic feet
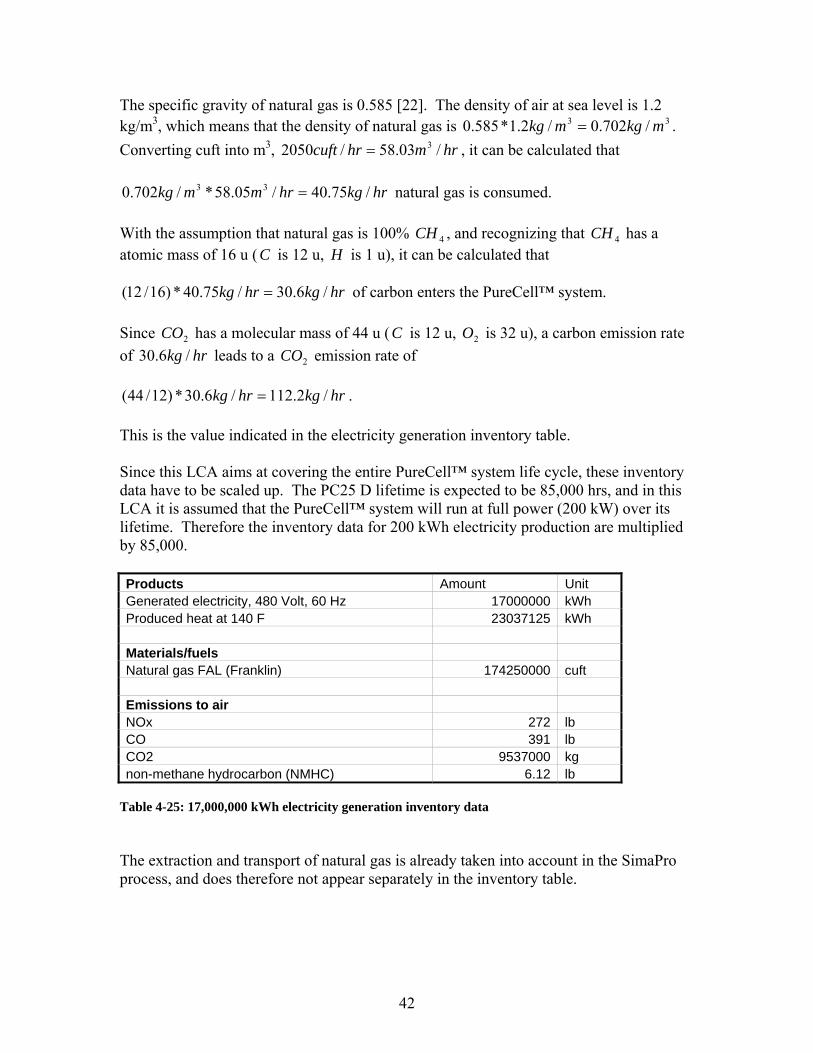
42
The specific gravity of natural gas is 0.585 [22]. The density of air at sea level is 1.2 kg/m3, which means that the density of natural gas is 33 /702.0/2.1*585.0 mkgmkg = . Converting cuft into m3, hrmhrcuft /03.58/2050 3= , it can be calculated that
hrkghrmmkg /75.40/05.58*/702.0 33 = natural gas is consumed. With the assumption that natural gas is 100% 4CH , and recognizing that 4CH has a atomic mass of 16 u (C is 12 u, H is 1 u), it can be calculated that
hrkghrkg /6.30/75.40*)16/12( = of carbon enters the PureCell™ system. Since 2CO has a molecular mass of 44 u (C is 12 u, 2O is 32 u), a carbon emission rate of hrkg /6.30 leads to a 2CO emission rate of
hrkghrkg /2.112/6.30*)12/44( = . This is the value indicated in the electricity generation inventory table. Since this LCA aims at covering the entire PureCell™ system life cycle, these inventory data have to be scaled up. The PC25 D lifetime is expected to be 85,000 hrs, and in this LCA it is assumed that the PureCell™ system will run at full power (200 kW) over its lifetime. Therefore the inventory data for 200 kWh electricity production are multiplied by 85,000. Products Amount Unit Generated electricity, 480 Volt, 60 Hz 17000000 kWh Produced heat at 140 F 23037125 kWh Materials/fuels Natural gas FAL (Franklin) 174250000 cuft Emissions to air NOx 272 lb CO 391 lb CO2 9537000 kg non-methane hydrocarbon (NMHC) 6.12 lb
Table 4-25: 17,000,000 kWh electricity generation inventory data The extraction and transport of natural gas is already taken into account in the SimaPro process, and does therefore not appear separately in the inventory table.

43
PureCell™ System Maintenance Several maintenance activities are needed to keep the fuel cell functioning properly over its entire lifetime. Maintenance activities included in the inventory table are the replacement of activated carbon for water treatment and the hexavalent chromium emissions caused by cleaning the condenser. Other maintenance activities include replacing the Rohm and Haas resin for water treatment, a quarterly replacement of air filters and other replacements which are done on a case-by-case basis (e.g., blowers and fans). These are however not included in the LCA because no data on these activities are available. Materials Amount Unit Waste treatment Activated carbon PureCell™ system 1852.5 lb Total 1852.5 lb Waste to treatment inorganic general 1852.5 lb Landfill Compostables chromium compounds 570 kg LT waste to chemical landfill chromium compounds 570 kg Waste to chemical landfill
Table 4-26: PureCell™ system maintenance inventory data The activated carbon for water treatment is replaced three times a year. Initially, 60 lb activated carbon is used in the PureCell™ system. The maintenance data are based on a PureCell™ system lifetime of 85,000 hrs. In the definition of the PureCell™ system lifetime 8000 hrs is regarded as one year (vs. 8760 actual hours); this means that the lifetime in years is 10 5/8 year. The total amount of activated carbon needed for maintenance then becomes: lblblblb 5.1852180*8
5)180*9(120 =++ .
The activated carbon waste is indicated as ‘inorganic general’ and is assumed to end up in landfills. The condenser is cleaned annually resulting in waste water containing hexavalent chromium. Per annual cleaning 15 to 30 gallons of waste water are produced with a hexavalent chromium concentration below 5%. For the calculations it is assumed that 15 gallons with a 5% hexavalent chromium concentration are produced annually. 15 Gallons is equal to 57 liter or 57 kg. With 10 annual cleanings, this results in 570 kg waste water to treatment, containing 28.5 kg )(VICr . This is a conservative estimate: it is expected that most of this is Cr (III). Although the waste is described as ‘chromium compounds’, the SimaPro software only recognizes the amount of waste and the waste treatment it is sent to. This means that it is not possible in SimaPro to include the exact amount of hexavalent chromium in the model. The 570 kg waste is assumed to go to landfill; it appears twice in the inventory table because both the short-term and long-term effects are taken into account.

44
End-of-Life Phase For every PureCell™ subassembly or component a waste scenario has been defined in SimaPro. These waste scenarios determine to which type of waste treatment a particular material is sent. Thus, every PureCell™ subassembly/component is broken down into materials again, which are thereafter sent to a waste treatment process. SimaPro databases are used to model these waste treatment processes. The energy and emissions related to the disassembly of the PureCell™ system into the materials which are sent to waste treatment are not taken into account. In SimaPro, the amount of material that is sent to a certain waste treatment process is not specified in absolute weight but in a percentage of the total amount of the material. For instance, in the model 90% of all copper is sent to a recycling process and 10% is sent to landfill. This percentage is then applied to every PureCell™ subassembly/component waste scenario. The table below is therefore not an inventory table, but a table that indicates to which waste treatment process the materials of every PureCell™ subassembly/component are sent. Material Waste treatment Percentage Steel cold rolled coil IISI Recycling Ferro metals 100%Stainless Steel 304 2B IISI Recycling Ferro metals 100%Stainless Steel 316 2B IISI Recycling Ferro metals 100%Copper ETH U PureCell™ system Recycling Non-ferro 90%Copper ETH U PureCell™ system Copper (inert) to landfill 10%Aluminum (primary) produced in the USA Recycling aluminum B250 90%Aluminum (primary) produced in the USA Landfill Aluminum B250 (1998) 10%Aluminum 100% recycled ETH U PureCell™ system Recycling aluminum B250 90%Aluminum 100% recycled ETH U PureCell™ system Landfill Aluminum B250 (1998) 10%Nickel enriched ETH U PureCell™ system Recycling Non-ferro 90%Nickel enriched ETH U PureCell™ system Unspecified 10%Graphite PureCell™ system Waste to special waste incinerator 100%Carbon black ETH U PureCell™ system Waste to special waste incinerator 100%PTFE (Teflon®) Waste to special waste incinerator 100%Glass fiber I PureCell™ system Landfill Glass B250 (1998) 100%Zeolite ETH U PureCell™ system Zeolite (inert) to landfill 100%PP granulate average B250 PureCell™ system Landfill PP B250 (1998) 100%PET ETH U PureCell™ system Landfill PET B250 100%Electric Components PureCell™ system Unspecified 100%Other materials Unspecified 100%
Table 4-27: PureCell™ system end-of-life phase, materials to waste treatment The end-of-life phase of the PureCell™ system is at present undefined except for the fact that the CSA platinum is recycled. The recycling rates in Table 4-27 are based on rates that are common in the end-of-life management of automobiles. Approximately two thirds of the total weight of an automobile is made up of steel. Other significant
45
materials in an automobile are non-ferrous metals (e.g., aluminum and copper), plastics and fluids. From an end-of-life perspective the PureCell™ system is therefore assumed to resemble an automobile in order to include recycling rates in the SimaPro model. In the automobile industry virtually all steel is recovered for reuse and recycling. As a result, over recent years the recycling rate has approached 100% [23]. Therefore the PureCell™ system steel recycling rate is assumed to be 100%. Regarding aluminum, nearly 90% of automotive aluminum is recovered and recycled [24]. The remaining 10% is part of the automobile shredder residue (ASR) which is disposed in landfills. For both copper and nickel no recycling rates for the automobile industry were found. It is therefore assumed that copper and nickel waste management is comparable to aluminum waste management, which means that 90% is recycled and 10% disposed in landfills. Landfill of nickel is left unspecified because no appropriate waste treatment process in SimaPro is available. Graphite, carbon black and Teflon® are not considered to be within the scope of automobile end-of-life management. In the SimaPro model they are assumed to be incinerated. Graphite and Teflon® are mixed together before they are manufactured into bipolar and cooling plates. The carbon black is a porous structure to disperse the platinum catalyst and to provide maximum gas diffusion. In a 2002 journal article [25] possibilities are explored for chemical extraction and subsequent recycling of membrane and bipolar plate materials. This is however not (yet) representative for today’s situation; at present these materials most probably end up in waste incineration. Glass fiber, zeolite, polypropylene (PP) and polyethylene (PET) are assumed to end up in landfill, because in the automobile industry these are the kind of materials that are part of the ASR. Furthermore, relatively small amounts of these materials are used in the PureCell™ system and they are relatively inexpensive, which increases the probability that they end up in landfill. Since the exact composition of the PureCell™ system electrical components is unknown, it is decided to leave the waste treatment unspecified. This means that the mass of the waste stream is taken into account, but no inputs and emissions are defined for the waste treatment process. The same method is applied for remaining materials. As explained in the description of the CSA inventory table, platinum recycling is already taken into account as an ‘internal recycling’ in the manufacturing phase. It does therefore not appear in the waste treatment table.

46
Chapter 5 - Impact Assessment and Interpretation Impact assessment is the phase in which the set of results of the inventory analysis is further processed and interpreted in terms of environmental impacts and societal preferences [26]. These environmental impacts and societal preferences are expressed in a list of impact categories. For this LCA the Eco-indicator 99 impact assessment method is used. Within the Eco-indicator 99 method the impact categories are already defined. Furthermore, Eco-indicator 99 groups the results of the impact categories into three damage categories. In this chapter, first a description of the impact and damage categories is given. Thereafter the different steps in impact assessment are explained as well as how these steps lead to LCA results. Then the actual PureCell™ system LCA results are shown followed by an interpretation of these results. For the LCA results the default hierarchist version of Eco-indicator 99 is used. Finally, a contribution and sensitivity analysis is performed, followed by conclusions based on the results in this chapter.
Impact and Damage Categories The following impact categories are defined in Eco-indicator 99 (every impact category is concisely explained) [7]:
• Carcinogens (substances which are cancer-causing upon exposure) • Respiratory organics (can also be described as summer smog; summer smog is
caused by a mixture of pollutants from road vehicles, fuels to provide electricity and heating, and vapors from petrol and certain industrial premises. Summer smog occurs as nitrogen dioxide and particles in urban areas; action of sunlight on these pollutants forms low-level ozone close to the ground. It also occurs in rural and suburban areas, mainly as ozone and particles.) [27]
• Respiratory inorganics (can also be described as winter smog; winter smog is caused by a mixture of pollutants from road vehicles and from fuels used to provide electricity and heating. Pollutants build up at ground level in urban areas because a ‘lid’ of cold air above the warm air traps the pollutants.) [27]
• Climate change (a change in temperature and weather patterns. Current science indicates a link between climate change over the last century and human activity, specifically the burning of fossil fuels)
• Radiation (ionizing radiation related to the releases of radioactive material to the environment)
• Ozone layer (the release of substances such as CFC’s which break down stratospheric ozone and result in increased UV radiation levels)
• Ecotoxicity (the toxic stress on ecosystems denoted as a Potentially Affected Fraction (PAF) of species)
• Acidification/Eutrophication (acidification and eutrophication are caused by depositions of inorganic substances such as sulphates, nitrates and phosphates. These depositions occur mainly through air and directly into water. The primary effect is the change in nutrient level and acidity in the soil.)

47
• Land use (this impact category assesses the impact of land-cover changes on ecosystems. Also land occupation and land transformation is distinguished.)
• Minerals (impact category that assesses the relation between availability and quality of minerals. In this category the decrease in mineral concentration as a result of extraction is modeled.)
• Fossil fuels (impact category that assesses the relation between availability and quality of fossil fuels. In this category the decrease in fossil fuel concentration as a result of extraction is modeled.)
Eco-indicator 99 provides the option to group the results of the impact categories into three damage categories: human health, ecosystem quality and resources. The results of the impact categories can be added because all impact categories that refer to the same damage category, e.g., human health, have the same unit, e.g., DALY, Disability Adjusted Life Years. The human health result is obtained by adding the results of the carcinogens, respiratory organics, respiratory inorganics, climate change, radiation and ozone layer impact categories. The ecosystem quality result is obtained by adding the results of the ecotoxicity, acidification/eutrophication and land use impact categories. The resources result is obtained by adding the results of the minerals and fossil fuels impact categories.
Impact Assessment Steps Generally impact assessment includes four steps: classification, characterization, normalization and weighting. The grouping of impact category results into damage categories in Eco-indicator 99 can be seen as a fifth step. These impact assessment steps are already defined and modeled in Eco-indicator 99; therefore only a generic description of these steps is given here. For a more detailed description of the impact assessment steps in Eco-indicator 99 the reader is referred to [7]. In the classification step the environmental interventions qualified and quantified by the input of data in the inventory analysis are assigned on a qualitative basis to the aforementioned impact categories [26]. Environmental interventions are defined as human interventions in the environment, either physical, chemical or biological. Environmental interventions are linked to the materials, assemblies, processes and waste treatments that are selected in SimaPro, and they include in particular resource extraction, emissions and land use. The characterization step quantifies the environmental interventions assigned to an impact category in terms of a common unit for that impact category, allowing aggregation into a single score [26]. For instance, the common unit used in the climate change impact category is ‘kg 2CO equivalents’. In this way the contribution of all relevant substances to climate change can be quantified into one number of kg 2CO equivalents. In the normalization step the magnitude of the characterization results is calculated relative to reference information. The main aim of normalization is to better understand the relative importance and magnitude of the results of the characterization step. Eco-

48
indicator 99 uses European normalization values. In SimaPro no impact assessment method with U.S. normalization values is available; the optional normalization value sets either reflect Europe or the world. It was therefore decided that using European normalization values gives the best approximation of the U.S. situation. Weighting is based on value choices, as numerical factors are assigned to the normalized impact category results (e.g., by an expert panel) according to their relative importance. The normalized results are multiplied by these factors, leading to either a set of weighted results for the impact categories or a single aggregated result reflecting the complete life cycle of the product system.
PureCell™ System LCA Results and Interpretation In the SimaPro model the life cycle of the PureCell™ system was divided into three phases: the manufacturing phase, the use phase and the end-of-life phase. Weighted LCA results indicate the contribution of each life cycle phase to the impact and damage categories. Single score results show the environmental impact of the three life cycle phases relative to each other. Also, in order to create a more transparent view on what contributes to the environmental impact of the use phase and the manufacturing phase, the LCA results for these two life cycle phases are shown separately. The end-of-life phase will receive more attention in Chapter 6. Furthermore, based on the LCA results for the manufacturing phase, to show the results for the CSA (Cell Stack Assembly) separately too.
PureCell™ System Life Cycle LCA Results In Figure 5-1 the weighted results for the impact categories are shown. In Figure 5-2 the results for the impact categories are aggregated in order to show the damage categories.

49
Figure 5-1: PureCell™ system life cycle, weighted results for the impact categories
Figure 5-2: PureCell™ system life cycle, weighted results for the damage categories It becomes clear that the ‘Fossil fuels’ impact category is by far the largest contributor to the PureCell™ system life cycle’s environmental impact. The second most significant contribution to the environmental impact comes from the ‘Respiratory inorganics’ impact category.

50
In Figures 5-3 and 5-4 a more direct view is given on the relative magnitude of the environmental impacts of the three life cycle phases.
Figure 5-3: PureCell™ system life cycle, single score results showing contribution of impact categories
Figure 5-4: PureCell™ system life cycle, single score results showing contribution of damage categories

51
The use phase of 85,000 hrs has an extremely high environmental impact relative to the manufacturing and end-of-life phase. Therefore the LCA results for the PureCell™ system use phase are analyzed separately in the next section.
PureCell™ System Use Phase LCA Results Figure 5-5 shows the weighted results for the impact categories and Figure 5-6 shows the weighted results for the damage categories.
Figure 5-5: PureCell™ system use phase, weighted results for the impact categories
Figure 5-6: PureCell™ system use phase, weighted results for the damage categories

52
Due to the extremely high contribution of the use phase to the life cycle environmental impact, Figures 5-5 and 5-6 are almost identical in shape to Figures 5-1 and 5-2. A more direct view on the relative magnitude of the environmental impacts of PureCell™ system installation, maintenance and the generation of electricity is given is Figures 5-7 and 5-8.
Figure 5-7: PureCell™ system use phase, single score results showing contribution of impact categories
Figure 5-8: PureCell™ system use phase, single score results showing contribution of damage categories

53
It becomes clear that ‘Installation Materials PureCell™ system’ and ‘Maintenance PureCell™ system’ as they are modeled in SimaPro do not have a significant contribution to the environmental impact of the use phase, and therefore not to the environmental impact of the life cycle either. The ‘Generated Electricity, 400 Volt, 60 Hz’ process represents the input of natural gas to the fuel processing system and the emissions caused by the steam reforming process. Referring to Figure 5-7, the contributions of the impact categories ‘Fossil fuels’, ‘Respiratory inorganics’, ‘Carcinogens’ and ‘Acidification/Eutrophication’ to the total environmental impact of ‘Generated Electricity, 400 Volt, 60 Hz’ are almost entirely caused by the delivery of natural gas and its depletion as a resource. The contribution of the impact category ‘Climate change’ is caused by the emissions of the steam reforming process, particularly
2CO emissions.
PureCell™ System Manufacturing Phase LCA Results Although it is shown in Figure 5-3 and 5-4 that the manufacturing phase only has a small contribution to the environmental impact of the PureCell™ system life cycle, it is still valuable to assess the environmental impact of the manufacturing phase separately as well. Since the PureCell™ system is primarily an electricity-providing system using a non-renewable resource (natural gas) as a fuel, it is not surprising that the use phase has by far the highest environmental impact. One could argue that at present the steam reforming process is unavoidable for an economically feasible fuel cell system, and that therefore the environmental impact caused by the consumption of natural gas and the emissions of the steam reforming process is unavoidable, too.4 If the use phase is seen as an unavoidable burden, the attention shifts to the PureCell™ system manufacturing and end-of-life phase. The LCA results for the manufacturing phase are analyzed in this section. Figure 5-9 gives a visual representation of the manufacturing phase network as it is modeled in SimaPro. Not all assemblies and processes are included in the figure; only the biggest contributors are shown. The percentages in the boxes are percentages of the total environmental impact of the PureCell™ system manufacturing phase. It can be seen that the CSA is responsible for almost half of the total environmental impact. A separate analysis of the LCA results for the CSA will be given in the next section.
4 LCA results for the hypothetical situation of a PC25 running on renewable hydrogen are given in chapter 6.

54
Figure 5-9: PureCell™ System manufacturing phase SimaPro network This network figure is shown with the intention to clarify that a small number of subassemblies in the PureCell™ system make up a big part of the total environmental impact. Due to the high number of subassemblies in the PureCell™ system it is hard to put all the results in one transparent figure. Therefore only the subassemblies with the highest environmental impact are shown in the figures below. Together these seven subassemblies are responsible for 95% of the total environmental impact of the manufacturing phase. The subassemblies that are not shown in the figures each have a contribution of 0.9% or less.

55
Figure 5-10: PureCell™ system manufacturing phase, single score results showing contribution of impact categories
Figure 5-11: PureCell™ system manufacturing phase, single score results showing contribution of damage categories Steel scrap is not a real subassembly but a process to include the steel scrap rate in the PureCell™ system subassembly production. It is included in Figures 5-10 and 5-11 in order to show its significant contribution.
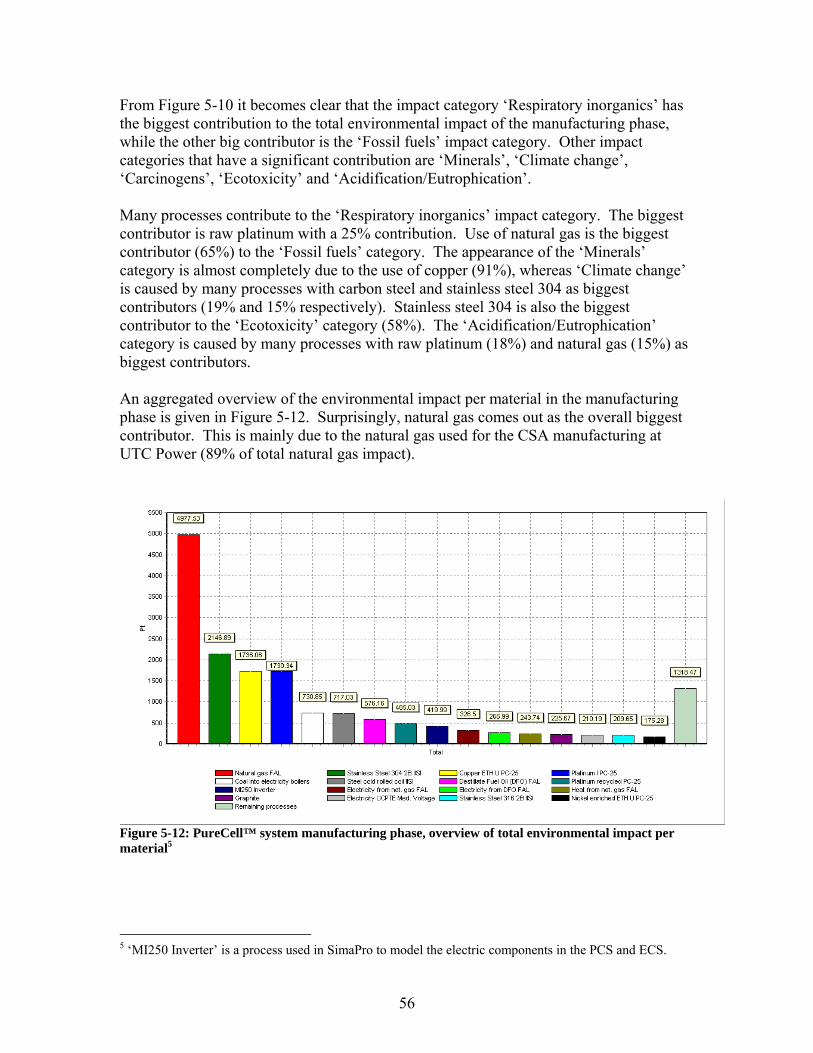
56
From Figure 5-10 it becomes clear that the impact category ‘Respiratory inorganics’ has the biggest contribution to the total environmental impact of the manufacturing phase, while the other big contributor is the ‘Fossil fuels’ impact category. Other impact categories that have a significant contribution are ‘Minerals’, ‘Climate change’, ‘Carcinogens’, ‘Ecotoxicity’ and ‘Acidification/Eutrophication’. Many processes contribute to the ‘Respiratory inorganics’ impact category. The biggest contributor is raw platinum with a 25% contribution. Use of natural gas is the biggest contributor (65%) to the ‘Fossil fuels’ category. The appearance of the ‘Minerals’ category is almost completely due to the use of copper (91%), whereas ‘Climate change’ is caused by many processes with carbon steel and stainless steel 304 as biggest contributors (19% and 15% respectively). Stainless steel 304 is also the biggest contributor to the ‘Ecotoxicity’ category (58%). The ‘Acidification/Eutrophication’ category is caused by many processes with raw platinum (18%) and natural gas (15%) as biggest contributors. An aggregated overview of the environmental impact per material in the manufacturing phase is given in Figure 5-12. Surprisingly, natural gas comes out as the overall biggest contributor. This is mainly due to the natural gas used for the CSA manufacturing at UTC Power (89% of total natural gas impact).
Figure 5-12: PureCell™ system manufacturing phase, overview of total environmental impact per material5
5 ‘MI250 Inverter’ is a process used in SimaPro to model the electric components in the PCS and ECS.

57
In the next section the LCA results for the CSA alone are analyzed. There it will become clear why the contribution of natural gas is so high. The other big overall contributors to the environmental impact of the manufacturing phase are stainless steel 304, copper and raw platinum. Furthermore it can be seen that several processes representing electricity and heat needed for the material/component production processes also have a significant contribution. These processes will also receive more attention in the next section on LCA results for the CSA.
PureCell™ System CSA (Cell Stack Assembly) LCA Results The LCA results for the CSA are analyzed separately here because in Figure 5-9 it is shown that the CSA is responsible for almost half of the total environmental impact of the manufacturing phase. Figure 5-13 is a similar network figure but this time for the CSA alone.
Figure 5-13: PureCell™ system CSA SimaPro network As stated earlier the CSA is responsible for 89% of the total natural gas impact shown in Figure 5-12. In the network figure above it can directly be seen why so much natural gas is used in the CSA manufacturing process; it is both used as an input for the ‘UTC South Windsor electricity mix’ process (explained in Appendix F) and for the ‘Heat from nat. gas FAL’ process. These two processes have been modeled in SimaPro by using the allocation procedure described in Chapter 4 - Inventory Analysis. Figure 5-14 shows the PureCell™ system CSA weighted results for the impact categories and Figure 5-15 shows the weighted results for the damage categories.

58
Figure 5-14: PureCell™ system CSA, weighted results for the impact categories
Figure 5-15: PureCell™ system CSA, weighted results for the damage categories

59
Figures 5-16 and 5-17 show the PureCell™ system CSA single score results for the impact and damage categories, respectively.
Figure 5-16: PureCell™ system CSA, single score results showing contribution of the impact categories
Figure 5-17: PureCell™ system CSA, single score results showing contribution of damage categories The LCA results for the CSA are heavily influenced by the allocated electricity and heat from natural gas used at the UTC Power facility in South Windsor. Together they are
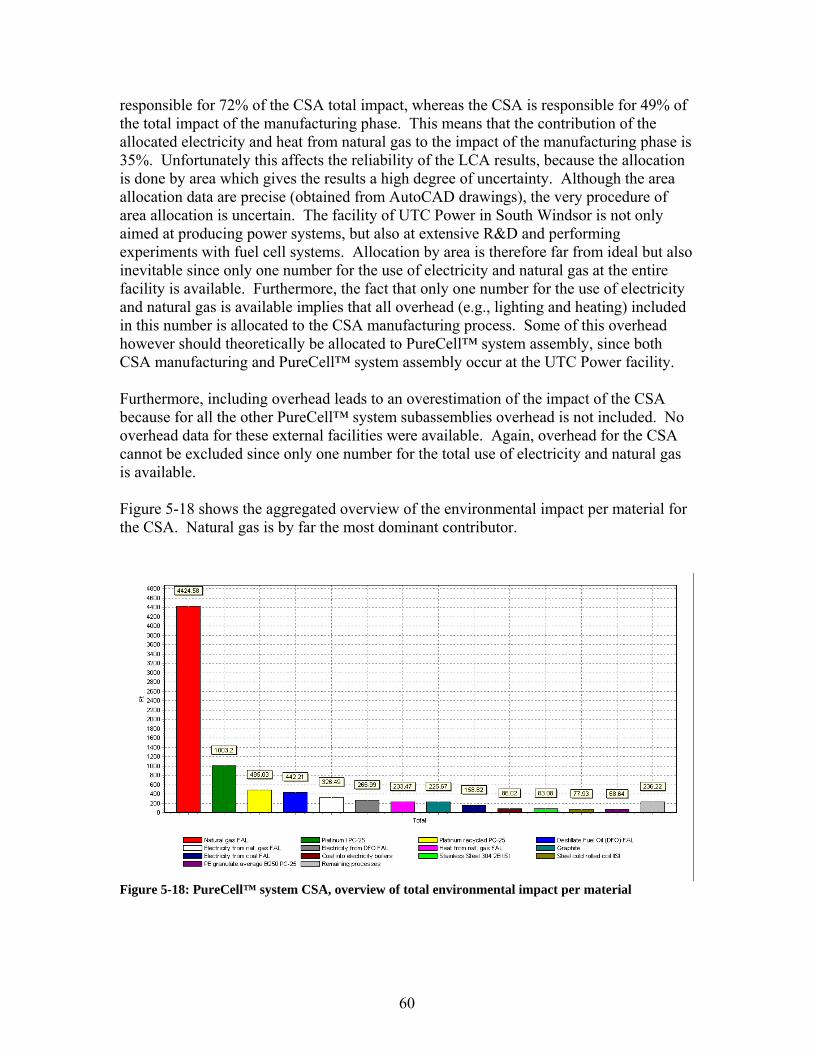
60
responsible for 72% of the CSA total impact, whereas the CSA is responsible for 49% of the total impact of the manufacturing phase. This means that the contribution of the allocated electricity and heat from natural gas to the impact of the manufacturing phase is 35%. Unfortunately this affects the reliability of the LCA results, because the allocation is done by area which gives the results a high degree of uncertainty. Although the area allocation data are precise (obtained from AutoCAD drawings), the very procedure of area allocation is uncertain. The facility of UTC Power in South Windsor is not only aimed at producing power systems, but also at extensive R&D and performing experiments with fuel cell systems. Allocation by area is therefore far from ideal but also inevitable since only one number for the use of electricity and natural gas at the entire facility is available. Furthermore, the fact that only one number for the use of electricity and natural gas is available implies that all overhead (e.g., lighting and heating) included in this number is allocated to the CSA manufacturing process. Some of this overhead however should theoretically be allocated to PureCell™ system assembly, since both CSA manufacturing and PureCell™ system assembly occur at the UTC Power facility. Furthermore, including overhead leads to an overestimation of the impact of the CSA because for all the other PureCell™ system subassemblies overhead is not included. No overhead data for these external facilities were available. Again, overhead for the CSA cannot be excluded since only one number for the total use of electricity and natural gas is available. Figure 5-18 shows the aggregated overview of the environmental impact per material for the CSA. Natural gas is by far the most dominant contributor.
Figure 5-18: PureCell™ system CSA, overview of total environmental impact per material

61
The use of electricity and natural gas at the UTC Power facility is included in the LCA because it represents the energy use in the CSA manufacturing process. Energy used in the production processes for the other PureCell™ system subassemblies and components is also included where possible. And although the modeled energy use for CSA production seems to be very high, it should be noted that fuel cell stack production is indeed an energy intensive process. Two previous fuel cell system LCAs both state that energy used in the cell stack production is of high significance in the LCA results, and that energy saving in the stack production is a primary focus in the cell stack life cycle improvement [28], [29]. Therefore it was decided that to get the closest approximation to a realistic situation the allocated energy for CSA production should be included. However, in order to give a transparent view on the significance of this decision, the next section gives LCA results for the CSA and for the manufacturing phase when the allocated energy use for CSA production is excluded.
PureCell™ System LCA Results without Allocated Energy Use for CSA Production Figure 5-19 shows the SimaPro network for the CSA when the allocated electricity and heat from natural gas is excluded.
Figure 5-19: PureCell™ system CSA without allocated energy use, SimaPro network

62
It is obvious that the attention now shifts to the platinum, even though a 98% recycling rate is assumed. Figure 5-20 shows the impact per material for the CSA. The results for the materials physically present in the PureCell™ system remain the same. Natural gas and other processes related to electricity and heat production for the CSA manufacturing now have a much smaller contribution.
Figure 5-20: PureCell™ system CSA without allocated energy use, overview of total environmental impact per material

63
Given that the CSA was responsible for almost half of the total environmental impact of the manufacturing phase, it is also interesting to analyze the effect of excluding the allocated energy on the manufacturing phase LCA results. Figure 5-21 shows the SimaPro network for this situation.
Figure 5-21: PureCell™ system manufacturing phase without allocated energy use for CSA production, SimaPro network The contribution of the CSA has gone down from 49.2% to 21.2%. Furthermore, the PCS now has become the biggest contributor at 24.1%, for which mainly copper and electric components are responsible.

64
Figure 5-22 shows the impact per material for the manufacturing phase.
Figure 5-22: PureCell™ system manufacturing phase without allocated energy use for CSA production, overview of total environmental impact per material6 It can be seen that the contribution of natural gas has gone down drastically. The biggest contributor now is stainless steel 304, followed by copper and raw platinum.
Contribution and Sensitivity Analysis Interpretation of LCA results for a one product alternative without uncertainty data includes performing contribution and sensitivity analyses. In a contribution analysis the results are decomposed into contributing elements. It is a way of testing results against what one would intuitively expect, and it also shows for which data it is important to have precise knowledge. In a sensitivity analysis (also known as perturbation or marginal analysis) inherently unstable elements are investigated. This is done by changing input data by 1% and determining how much this changes the result. The application-oriented purpose of a sensitivity analysis is to indicate the most promising opportunities for redesign and prevention strategies. The analysis-oriented purpose is to discover to which input data the LCA results are most sensitive; precise knowledge of these input data is most important for the LCA [30]. In this section both a contribution and a sensitivity analysis are performed. Also, the three different Eco-indicator 99 perspectives (egalitarian, hierarchist and individualist) are used to do what in the Eco-indicator 99 methodology is called a robustness analysis. Furthermore, changes in three major assumptions in the LCA model are applied in order to analyze how sensitive the results are to these assumptions.
6 ‘MI250 Inverter’ is a process used in SimaPro to model the electric components in the PCS and ECS.

65
Contribution Analysis The contribution analysis is performed at the single score level. Normalized values were multiplied by weighting factors and added to obtain a single score, representing the total environmental impact for all impact categories aggregated. The results are analyzed separately for each life cycle phase. Table 5-1 shows the life cycle contribution analysis per life cycle phase. Unit Score % Total 1.14E+06 100% Manufacturing phase 1.65E+04 1.45% Use phase 1.12E+06 98.2% End-of-life phase -421 -0.04%
Table 5-1: Contribution analysis per phase for PureCell™ system life cycle single score result Table 5-2 shows the life cycle contribution analysis per material process. Only the ten biggest contributors are shown. Material Process Score % Total of all processes 1.14E+06 100% Natural gas FAL 1.07E+06 94% Generated electricity, 480 Volt, 60 Hz 5.25E+04 4.6% Stainless Steel 304 2B IISI 2.17E+03 0.19% Copper ETH U PureCell™ system 1.74E+03 0.15% Platinum I PureCell™ system 1.73E+03 0.15% Coal into electricity boilers 731 0.06% Steel cold rolled coil IISI 720 0.06% Electricity UCPTE Med. Voltage 580 0.05% Destillate Fuel Oil (DFO) FAL 576 0.05% Platinum recycled PureCell™ system 485 0.04%
Table 5-2: Contribution analysis per material process for PureCell™ system life cycle single score result The process ‘Generated electricity, 480 Volt, 60 Hz’ represents the emissions caused by the steam reforming process. 2CO emissions cause 99% of the 4.6% life cycle single score contribution of this process. The influence of the 85,000 hrs use phase is enormous when looking at the entire life cycle. Both the data for natural gas usage and PureCell™ system emissions (except 2CO ) were obtained from a UTC Power PureCell™ system performance report, and can therefore be seen as precise and reliable. The calculations for the 2CO emissions are shown in Chapter 4 - Inventory Analysis. For these calculations some assumptions had to be made which give the 2CO emission data a degree of uncertainty.

66
Table 5-3 shows the manufacturing phase contribution analysis per material process. Material Process Score % Total of all processes 1.65E+04 100% Natural gas FAL 4.98E+03 30% Stainless Steel 304 2B IISI 2.15E+03 13% Copper ETH U PureCell™ system 1.74E+03 11% Platinum I PureCell™ system 1.73E+03 10% Coal into electricity boilers 731 4.4% Steel cold rolled coil IISI 717 4.3% Destillate Fuel Oil (DFO) FAL 576 3.5% Platinum recycled PureCell™ system 485 2.9% MI250 Inverter 420 2.5% Electricity from nat. gas FAL 327 1.9%
Table 5-3: Contribution analysis per material process for PureCell™ system manufacturing phase single score result The single score results in this table are the same as pictured in Figure 5-12. As mentioned before, the contribution of natural gas and other processes related to electricity and heat is uncertain. However, no better data are available. The data for the materials physically present in the PureCell™ system come from a PureCell™ system weight breakdown sheet provided by UTC Power. Table 5-4 shows the use phase contribution analysis per material process. Material Process Score % Total of all processes 1.12E+06 100% Natural gas FAL 1.07E+06 95% Generated electricity, 480 Volt, 60 Hz 5.25E+04 4.7%
Table 5-4: Contribution analysis per material process for PureCell™ system use phase single score result Only the two biggest contributors are shown here. The other modeled processes for PureCell™ system installation and maintenance all have a contribution of less than 0.01%. Table 5-5 shows the end-of-life phase contribution analysis per material process. Waste treatment processes from SimaPro databases are used to model the PureCell™ system end-of-life phase. The material processes appearing in Table 5-5 are therefore not input data but part of the SimaPro waste treatment processes.

67
Material Process Total % Total of all processes -421 100% Electricity UCPTE Med. Voltage 390 -93% Crude oil production onshore U 99.5 -24% Crude oil production offshore U 80.3 -19% Waste to special waste incinerator U 48.1 -11% Zinc -286 68% Natural gas B -285 68% Crude coal B -156 37% Electricity UCPTE High Voltage -97.5 23% Sinter pellet -54.6 13% Coke S -54.2 13%
Table 5-5: Contribution analysis per material process for PureCell™ system end-of-life phase single score result Both positive and negative percentages appear in Table 5-5. This is because some processes in the end-of-life phase increase the environmental impact of the PureCell™ system, whereas other processes decrease the environmental impact. A decrease means that use of resources like natural gas and coal is avoided (e.g., by incineration with heat recovery) or that materials that are recycled in the end-of-life phase can be used as input for other processes, thereby avoiding the need for raw materials as input (e.g., recycling of steel). The positive percentages represent the energy used in or the emissions caused by the waste treatment processes in the end-of-life phase. Zinc appears in the table because for the ‘Recycling Non-ferro’ process it is assumed that the product from the recycling process is comparable with zinc from an environmental point of view. The recycling process of copper is therefore modeled as having a zinc output. This shows how limited the options are in SimaPro for modeling the end-of-life phase. In the ‘Sensitivity Analysis for Assumptions’ section in this chapter the metal recycling processes from SimaPro databases are replaced by processes that model a scrap metal output. In this way the ‘Recycling Non-ferro’ process containing poor data is avoided and it will be shown what the effect of this different approach is on the LCA results for the end-of-life phase.
Sensitivity Analysis The sensitivity analysis is also performed at the single score level. Results of a sensitivity analysis are investigated for natural gas usage and 2CO emissions in the use phase, and for allocated energy for CSA production, platinum and copper in the manufacturing phase. First a 1% perturbation in natural gas use of the PureCell™ system is analyzed. This means that the natural gas input in the use phase in SimaPro is changed; the result of this

68
perturbation is also evaluated by looking at the use phase single score result for the total environmental impact.
input single score
result multiplier
original 2050 cuft/hr 1.12E+06 n/a 1% perturbation 2070.5 cuft/hr 1.13E+06 0.89
Table 5-6: 1% Perturbation in natural gas usage, PureCell™ system use phase single score result The multiplier shows the extent to which a perturbation of a certain input parameter propagates into a certain output result. For example, if an increase of 1% in an input parameter leads to an increase of 2% in an output result, the multiplier is 2 [30]. So, increasing the natural gas usage by 1% leads to an increase in the use phase single score result for the total environmental impact of 0.89%. Table 5-7 shows the effect of a 1% perturbation in 2CO emissions on the use phase total environmental impact.
input single score result
multiplier
original 112.2 kg/hr 1.12E+06 n/a 1% perturbation 113.322 kg/hr 1.12E+06 0
Table 5-7: 1% Perturbation in CO2 emissions, PureCell™ system use phase single score result As can be seen, a 1% perturbation in 2CO emissions does not influence the three significant digits used in SimaPro to indicate the use phase total environmental impact. Table 5-8 shows the effect of a 1% perturbation in both the allocated electricity and the allocated heat from natural gas for CSA production on the manufacturing phase single score result.
input single score result
multiplier
original 66180 kWh 1.65E+04 n/a 311E+06 Btu 1% perturbation 66841.8 kWh 1.66E+04 0.61 314.11E+06 Btu
Table 5-8: 1% Perturbation in allocated energy for CSA production, PureCell™ system manufacturing phase single score result

69
Increasing the allocated electricity and heat from natural gas by 1% leads to an increase in the manufacturing phase single score result for the total environmental impact of 0.61%. Table 5-9 shows the effect of a 1% perturbation in the total platinum input (raw and recycled, CSA and ILS) on the manufacturing phase single score result.
input single score result
multiplier
original 31.18 g (raw, CSA) 1.65E+04 n/a 1527.82 g (recycled, CSA) 22.6 g (raw, ILS) 1% perturbation 31.4918 (raw, CSA) 1.65E+04 0 1543.0982 g (recycled, CSA) 22.826 g (raw, ILS)
Table 5-9: 1% Perturbation in total platinum input, PureCell™ system manufacturing phase single score result Table 5-10 shows the effect of a 1% perturbation in the copper input for the PCS, ECS and Harnesses and Cables. These are the same copper inputs that are considered in the copper scrap process. The 1% perturbation is also applied to the copper input for the copper scrap process itself.
input single score result
multiplier
original 1800 lb (PCS) 1.65E+04 n/a 300 lb (ECS) 100 lb (Harn. & Cabl.) 244 lb (Copper scrap) 1% perturbation 1818 lb (PCS) 1.65E+04 0 303 lb (ECS) 101 lb (Harn. & Cabl.) 246.44 lb (Copper scrap)
Table 5-10: 1% Perturbation in copper input, PureCell™ system manufacturing phase single score result A 1% perturbation in the platinum and copper input does not change the single score result of the manufacturing phase. The results of the sensitivity analysis show that a decrease in the natural gas usage of the PureCell™ system will lead to the most significant environmental improvement in the PureCell™ system use phase. Maximizing the hydrogen output of the steam reforming process and increasing the efficiency of the electrochemical reaction in the fuel cell stack

70
are the main opportunities for reducing the environmental impact of the PureCell™ system use phase. Regarding the manufacturing phase, the sensitivity analysis shows that reducing the energy used for CSA production has the most potential for reduction of environmental impact. One should keep in mind that these data have higher uncertainty than many others modeled in the LCA.
Eco-indicator 99 Robustness Analysis Eco-indicator 99 provides the choice between three different perspectives on impact assessment. The default perspective is the hierarchist perspective in which LCA impact assessment is based on facts that are backed up by scientific and political bodies with sufficient recognition; for example, the IPCC (Intergovernmental Panel on Climate Change) provides widely accepted guidelines for climate change. The individualist perspective includes only proven cause-effect relations, and when relevant only the short-term perspective is used. The preference for proven relationships is the attitude of individualists to consider each limit as negotiable. For human health issues age-weighting is used, since in the individualist perspective a person is valued higher at the age between 20 and 40 years. The egalitarian perspective consistently uses the precautionary principle, in case of doubt, an environmental impact is included. Egalitarians do not accept guidance from internationally accepted scientific or political organizations. A very long term perspective is used as egalitarians do not accept that future problems can be avoided. This version is the most comprehensive version, but it also has the largest data uncertainties as sometimes data are included on which consensus is lacking [7]. This report does not debate the merits of each perspective. The LCA results are obtained using the default hierarchist perspective which works according to consensus building processes and a balanced view of long- and short-term perspectives, which is how most impact assessment models work [7]. The LCA results for all three perspectives are analyzed here in order to find out how important the influence of the choice of perspective is. It is therefore also a form of sensitivity analysis. Table 5-11 shows the life cycle single score results, both by life cycle phases and impact categories.
Hierarchist Egalitarian Individualist Total 1.14E+06 9.33E+05 6.96E+05 per life cycle phase Manufacturing phase 1.65E+04 1.58E+04 9.63E+04 Use phase 1.12E+06 9.19E+05 6.01E+05 End-of-life phase -421 -1.76E+03 -1.43E+03 per impact category Carcinogens 2.16E+04 1.61E+04 2.84E+04 Resp. organics 1.40E+03 1.04E+03 3.32E+03 Resp. inorganics 2.50E+05 1.87E+05 4.14E+05 Climate change 6.35E+04 4.73E+04 1.55E+05 Radiation 0.484 0.361 0.0893 Ozone layer 1.2 0.891 2.47 Ecotoxicity 1.32E+03 1.65E+03 345 Acidification/Eutrophication 1.74E+04 2.18E+04 1.24E+04
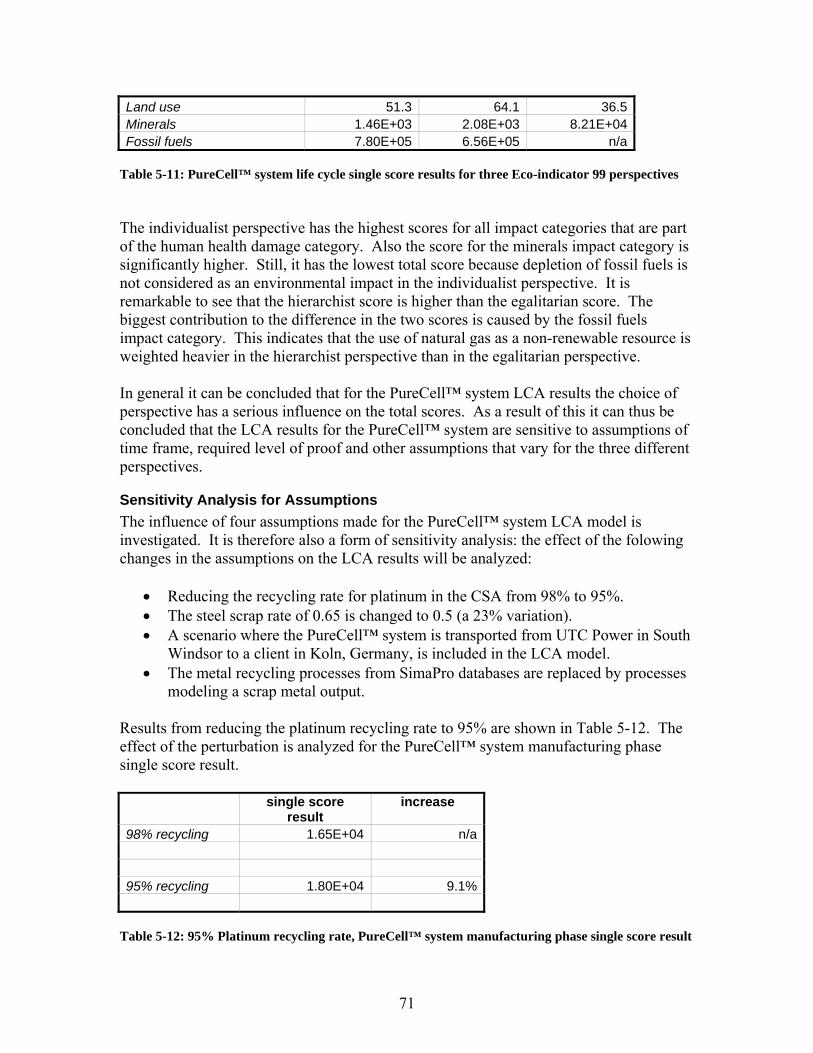
71
Land use 51.3 64.1 36.5 Minerals 1.46E+03 2.08E+03 8.21E+04 Fossil fuels 7.80E+05 6.56E+05 n/a
Table 5-11: PureCell™ system life cycle single score results for three Eco-indicator 99 perspectives The individualist perspective has the highest scores for all impact categories that are part of the human health damage category. Also the score for the minerals impact category is significantly higher. Still, it has the lowest total score because depletion of fossil fuels is not considered as an environmental impact in the individualist perspective. It is remarkable to see that the hierarchist score is higher than the egalitarian score. The biggest contribution to the difference in the two scores is caused by the fossil fuels impact category. This indicates that the use of natural gas as a non-renewable resource is weighted heavier in the hierarchist perspective than in the egalitarian perspective. In general it can be concluded that for the PureCell™ system LCA results the choice of perspective has a serious influence on the total scores. As a result of this it can thus be concluded that the LCA results for the PureCell™ system are sensitive to assumptions of time frame, required level of proof and other assumptions that vary for the three different perspectives.
Sensitivity Analysis for Assumptions The influence of four assumptions made for the PureCell™ system LCA model is investigated. It is therefore also a form of sensitivity analysis: the effect of the folowing changes in the assumptions on the LCA results will be analyzed:
• Reducing the recycling rate for platinum in the CSA from 98% to 95%. • The steel scrap rate of 0.65 is changed to 0.5 (a 23% variation). • A scenario where the PureCell™ system is transported from UTC Power in South
Windsor to a client in Koln, Germany, is included in the LCA model. • The metal recycling processes from SimaPro databases are replaced by processes
modeling a scrap metal output. Results from reducing the platinum recycling rate to 95% are shown in Table 5-12. The effect of the perturbation is analyzed for the PureCell™ system manufacturing phase single score result.
single score result
increase
98% recycling 1.65E+04 n/a 95% recycling 1.80E+04 9.1%
Table 5-12: 95% Platinum recycling rate, PureCell™ system manufacturing phase single score result
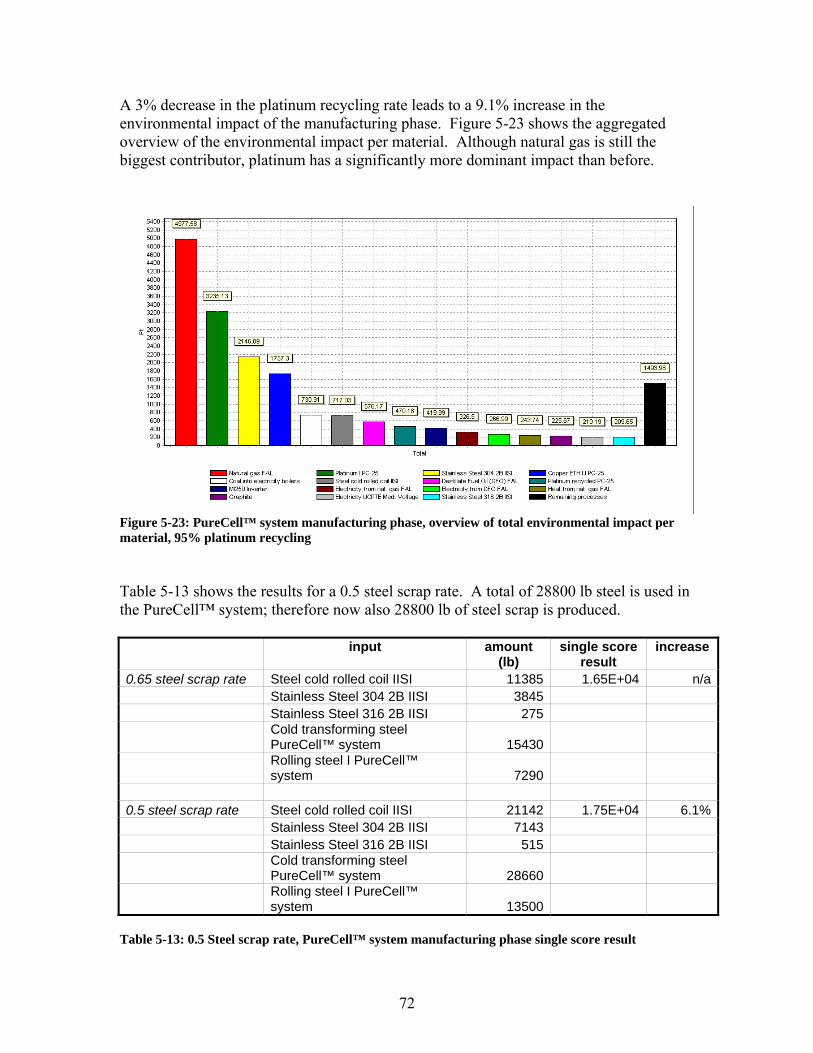
72
A 3% decrease in the platinum recycling rate leads to a 9.1% increase in the environmental impact of the manufacturing phase. Figure 5-23 shows the aggregated overview of the environmental impact per material. Although natural gas is still the biggest contributor, platinum has a significantly more dominant impact than before.
Figure 5-23: PureCell™ system manufacturing phase, overview of total environmental impact per material, 95% platinum recycling Table 5-13 shows the results for a 0.5 steel scrap rate. A total of 28800 lb steel is used in the PureCell™ system; therefore now also 28800 lb of steel scrap is produced.
input amount (lb)
single score result
increase
0.65 steel scrap rate Steel cold rolled coil IISI 11385 1.65E+04 n/a Stainless Steel 304 2B IISI 3845 Stainless Steel 316 2B IISI 275
Cold transforming steel PureCell™ system 15430
Rolling steel I PureCell™ system 7290
0.5 steel scrap rate Steel cold rolled coil IISI 21142 1.75E+04 6.1% Stainless Steel 304 2B IISI 7143 Stainless Steel 316 2B IISI 515
Cold transforming steel PureCell™ system 28660
Rolling steel I PureCell™ system 13500
Table 5-13: 0.5 Steel scrap rate, PureCell™ system manufacturing phase single score result

73
Using a steel scrap rate of 0.5 (a 23% variation) leads to a 6.1% increase in the environmental impact of the manufacturing phase. The influence of including a transport scenario to a client in Koln, Germany, is shown in Table 5-14. It can be debated whether transport from manufacturer to client should be included in the manufacturing or the use phase. For this analysis it is included in the manufacturing phase, and the effect of including the transport scenario is analyzed for the PureCell™ system manufacturing phase single score result. Due to the high relative impact of the use phase, including the transport scenario there will not change the use phase results. Therefore the significance of the PureCell™ system transport to a client can be better understood if it is included in the manufacturing phase.
input amount (tmi)
single score result
increase
without transport scenario n/a n/a 1.65E+04 n/a with transport scenario Truck (single) diesel FAL 1979 1.68E+04 1.82% Ocean freighter FAL 69267 Truck (single) diesel FAL 3166
Table 5-14: Transport scenario to Koln, Germany, PureCell™ system manufacturing phase single score result It is assumed that the PureCell™ system is shipped from Boston to Rotterdam. The total weight of the PureCell™ system is 39576 lb.
• The PureCell™ system is transported by truck from South Windsor to Boston. This is 100 miles, transporting 39576 lb, which is equal to 1979 tmi.
• The PureCell™ system is shipped from Boston to Rotterdam. This is approximately 3500 miles, transporting 39576 lb, which is equal to 69267 tmi.
• The PureCell™ system is transported by truck from Rotterdam to Koln. This is 160 miles, transporting 39576 lb, which is equal to 3166 tmi.
Including the transport scenario to a client in Koln, Germany, led to a 1.82% increase in the environmental impact of the manufacturing phase. Since the manufacturing phase is responsible for 1.45% of the life cycle environmental impact, including the transport scenario leads to a 0.03% increase in the life cycle environmental impact. In the contribution analysis it was shown that the end-of-life phase results are heavily influenced by the metal recycling processes. The data used for these recycling processes are however of low quality. Therefore the effects of EoL changes on LCA results were analyzed. In this different approach the waste treatment of the PureCell™ system metals stops at the point where scrap metal is the output instead of complete recycling into ready-to-use materials, thereby avoiding the use of SimaPro recycling processes. Table 5-15 shows the changes in the PureCell™ system metal waste treatment as compared with Table 4-27.

74
Material Waste treatment Percentage Steel cold rolled coil IISI Iron scrap output 100% Stainless Steel 304 2B IISI Stainless steel scrap output 100% Stainless Steel 316 2B IISI Stainless steel scrap output 100% Copper ETH U PureCell™ system Copper scrap output 90%Copper ETH U PureCell™ system Copper (inert) to landfill 10% Aluminum (primary) produced in the USA Aluminum scrap output 90%Aluminum (primary) produced in the USA Landfill Aluminum B250 (1998) 10% Aluminum 100% recycled ETH U PureCell™ system Aluminum scrap output 90%Aluminum 100% recycled ETH U PureCell™ system Landfill Aluminum B250 (1998) 10% Nickel enriched ETH U PureCell™ system Nickel scrap output 90%Nickel enriched ETH U PureCell™ system Unspecified 10%
Table 5-15: PureCell™ system end-of-life phase, scrap metal output The scrap output is modeled using the metal scrap processes in the IDEMAT database in SimaPro. In every scrap output process shown in Table 5-15 electricity is added for shredding and separating the scrap. The amounts of electricity used for shredding and separating scrap are 97 kJ/kg and 26 kJ/kg respectively, as given by [19]. This results in a total amount of electricity used of 123 kJ/kg. Table 5-16 shows the end-of-life phase result when the metal waste treatment is modeled as scrap output. single score result increase (in benefit) Metal recycling processes -421 n/a Scrap metal output processes -745 77%
Table 5-16: Scrap metal output, PureCell™ system end-of-life phase single score result The scrap output approach in the end-of-life phase leads to an increase in the environmental benefit of 324 points, which is a 77% increase. If one however takes the aggregated moduli (i.e., the absolute values) of both positive and negative scores in the original end-of-life phase results, 651 points in positive values and 1072 in negative values resulting in an aggregated value of 1723 points, the 324 points increase in environmental benefit is equal to a 19% increase. With respect to the PureCell™ system

75
life cycle, this increase of 324 points in environmental benefit leads to a -0.03% decrease in the life cycle environmental impact.
Conclusions When the environmental impacts of the three life cycle phases (manufacturing, use and end-of-life phase) are shown relative to each other, it becomes clear that the use phase is by far the biggest contributor. The input of natural gas and the emission of 2CO over the 85,000 hrs lifetime are the main causes for this contribution. A decrease in natural gas usage of the PureCell™ system while maintaining the same power output will therefore lead to the most significant environmental improvement in the PureCell™ system life cycle. As shown in the 2CO calculations in Chapter 4 - Inventory Analysis, the input of natural gas is directly linked with the emission of 2CO . This means that maximizing the hydrogen output of the steam reforming process and increasing the efficiency of the electrochemical reaction in the fuel cell stack are the main opportunities for reducing the environmental impact of the PureCell™ system life cycle. One should realize here that the environmental impact of the use phase modeled in SimaPro is the environmental impact of producing 200 kW electricity for 85,000 hrs, or 17,000,000 kWh. The environmental impact is not expressed in burden per kWh7. Although increasing the PureCell™ system lifetime leads to a higher environmental impact of the PureCell™ ���!�hand to a lower environmental impact per kWh for the PureCell™ system life cycle. If the manufacturing phase is analyzed separately it becomes clear that the CSA (Cell Stack Assembly) is responsible for almost half of the environmental impact. The main cause is the high amount of energy used in the CSA production process. Other big contributors are the PCS (Power Conditioning System) and the ILS (Integrated Low-temperature Shift converter). The end-of-life phase has a small environmental impact compared to the use and manufacturing phase. In terms of ‘hotspots’ referred to in the description of the goal of the study, for the PureCell™ system life cycle these are the natural gas usage and, to a lesser extent, 2CO emissions in the use phase. As described above, decreasing the natural gas input while maintaining the same power output has a beneficial effect on both of these hotspots. The impact of the 2CO emissions can also be avoided through carbon sequestration. This means that 2CO is not emitted but captured and stored. The procedure of capturing and storing 2CO will however bring its own environmental impact, so a separate analysis and a trade-off are required to determine the benefit of carbon sequestration. For the manufacturing phase the major hotspot is the energy used in the CSA production process. Other hotspots are platinum, stainless steel 304, copper and electric components. In case of platinum it is especially beneficial to increase the recycling rate
7 In Appendix E the CO2-equivalent emissions per kWh and the energy use per kWh are shown for the PC25 life cycle. The total amount of CO2-equivalent emissions and energy use per life cycle phase is also shown.

76
(or at least achieve the assumed 98% recycling rate), since the environmental impact of recycled platinum is much smaller than that of raw platinum. In Chapter 6 the LCA model will be used to analyze the environmental improvement effected by two different scenarios. First the effect of using renewable hydrogen from wind energy is shown. This means that no natural gas is required as input in the use phase, and also no steam reforming system is needed. Second the effect of a different end-of-life scenario is shown. In this scenario SimaPro is used to model reuse of certain components. Furthermore it is assumed in this scenario that the platinum and palladium in the ILS is also recycled with a recycling rate of 98%.

77
Chapter 6 - Opportunities and Implementation in LCA This chapter consists of two parts. In the first part the opportunity of using renewable hydrogen from wind energy as a fuel for the PureCell™ system is described and data from a National Renewable Energy Lab (NREL) report on LCA of renewable hydrogen production via wind/electrolysis are implemented in the SimaPro model. Changes in the PureCell™ system inventory tables are explained and the new LCA results are analyzed and compared with results obtained by using the original model based on steam reforming of natural gas. The second part describes the opportunity of improving the end-of-life scenario from an environmental perspective. SimaPro is used to model a hypothetical scenario of reusing the steam ejector, steam drum, frame, enclosure, PCS and ECS subassemblies. The steam drum is part of the thermal management system (TMS). The improved end-of-life scenario also includes a 98% recycling rate for the platinum and palladium in the ILS. This means that the ILS platinum and palladium are modeled in SimaPro in the same way as the CSA platinum. Palladium is a platinum group metal (PGM). PGMs have similar physical and chemical properties and tend to occur together in the same mineral deposits; therefore the 98% recycling rate is applied to platinum as well as palladium.
Renewable Hydrogen from Wind Energy The benefits of using renewable hydrogen compared to the present PureCell™ system are that no natural gas is required as input in the use phase and that emissions caused by the steam reforming process are avoided. Of course the system required to produce hydrogen from wind energy also has negative impacts on the environment. Data from an LCA done by NREL [31] for a wind/electrolysis system are used here to model these impacts The wind/electrolysis system considered in the NREL LCA replaces the steam reforming system and the use phase input and emissions of the current PureCell™ system.
System Description The system that is modeled in SimaPro is the same as the system examined in the NREL report. This system is shown in Figure 6-1. Using a wind/electrolysis system in combination with stationary fuel cells results in a constant source of energy supply and it can therefore compensate for increased shares of fluctuating renewable energy sources.

78
Figure 6-1: Wind/electrolysis system as used in NREL study [31] Material requirements and design data for this system were taken from electrolyzer and wind turbine manufacturers. For the LCI data the material production processes required to construct the wind turbines, electrolyzer and hydrogen storage tanks were taken into account. The electricity grid as shown in Figure 6-1 transports the electricity from the wind turbine site to the electrolyzer where it is converted into hydrogen with an efficiency of 85% (based on HHV). The electricity grid as a capital good is not taken into account in the LCA. The system operation was determined using class 5 wind data from the upper Midwest region of the United States. The system has a fixed lifetime, and the LCI data for resource consumption, emissions and energy requirement of the system are expressed in g/kg 2H or MJ/kg 2H . This means that these LCI data can easily be implemented in the PureCell™ system in order to model the required hydrogen production. Several electrical losses were subtracted from the gross amount of electricity produced by the wind turbines. These losses include transmission losses of the grid, electricity required to pump the deionized water in the electrolyzer and electricity required to compress the hydrogen. Hydrogen transport from the electrolyzer site to the PureCell™ system sites is not included in the NREL system. This will therefore be added separately in the form of transport by trailer. In the NREL system the hydrogen is compressed to a pressure of 20 MPa (or 197 atm). Hydrogen can be transported both in compressed (at present up to 200 atm [32]) and liquefied form. Liquefied hydrogen has the advantage of having a much higher energy density than compressed hydrogen, and is thus more efficient to transport, but at the same time it has the disadvantage that hydrogen liquefaction is a very energy intensive process. Using today's technology, liquefaction consumes 30% or more of the energy content of the hydrogen, dependent on the size of the liquefaction facility [32]. In a very small liquefaction plant (less than hrkgLH /5
2) the energy needed to liquefy
hydrogen may even exceed the HHV energy of hydrogen [33]. Moreover, some of the stored and transported liquefied hydrogen will be lost through evaporation, dependent on the surface-to-volume ratio of the storage tank. Due to the complexity of the hydrogen liquefaction process and of the transport of liquefied hydrogen, it is considered outside

79
the scope of this research to analyze the environmental impact of this option. Transport of compressed hydrogen at 200 atm is included in the LCA model in addition to the LCI data from the NREL system. Assessing the environmental impact of liquefied hydrogen transport as part of the PureCell™ system using renewable hydrogen from wind energy is recommended for further research. The compressed hydrogen transport by truck is based on the assumption that, if renewable hydrogen from wind energy would at present be used as a fuel for the PureCell™ system, the hydrogen would be produced at the wind turbine site and thereafter be transported by truck to its destination. As mentioned before, the system operation was determined using class 5 wind data. Figure 6-2 shows a U.S. wind resource map with the wind power classifications.
Figure 6-2: United States wind resource map Based on this map it is assumed that when 1000 miles of hydrogen transport is taken into account any place in the United States can be supplied with hydrogen from class 5 wind energy. On the other hand, not all PureCell™ system locations will be at a 1000 miles distance from a class 5 wind turbine site. Therefore two hydrogen transport scenarios are analyzed, one for a 100 miles transport distance and one for 1000 miles.
Inventory Tables Regarding the inventory, first of all the use phase data are changed. The input of natural gas and the emissions of the steam reforming process are replaced by an input of renewable hydrogen. Transport of hydrogen is also included. The PureCell™ system installation and maintenance processes remain the same. In the manufacturing phase the

80
subassemblies that make up the fuel processing system are removed from the SimaPro model because their function is now superfluous. The removed subassemblies are the reformer, the ILS and the steam ejector. The rest of the PureCell™ system is assumed to remain the same. As mentioned before, the LCI data for the wind/electrolysis system are expressed in g/kg 2H or MJ/kg 2H . In SimaPro the production of renewable hydrogen is therefore modeled for 1 kg of hydrogen. The inventory data for the production of renewable hydrogen from wind energy are shown in Table 6-1. Products Amount Unit Hydrogen from wind energy NREL 1 kg Resources coal FAL 0.2147 kg iron (ore) 0.2122 kg scrap, external 0.1742 kg limestone 0.3666 kg natural gas FAL 0.0162 kg crude oil FAL 0.0483 kg water 26.7 kg energy (undef.) 0.65 MJ Emissions to air CO2 0.95 kg CO 0.9 g methane 0.3 g NOx 4.7 g N2O 0.05 g non-methane hydrocarbon (NMHC) 4.4 g particulates (unspecified) 28.7 g SOx 6.1 g Final waste flows solid waste 223 g
Table 6-1: Renewable hydrogen from wind energy NREL inventory data Now it needs to be calculated how much hydrogen the PureCell™ system uses per hour, or in other words, how much hydrogen does the PureCell™ system require to produce 200 kWh of electricity. Detailed calculations showing how this number was obtained can be found in Appendix G. In the SimaPro model of the PureCell™ system using renewable hydrogen the hydrogen consumption rate of hrkg /035.15 is used, as shown in Table 6-2.
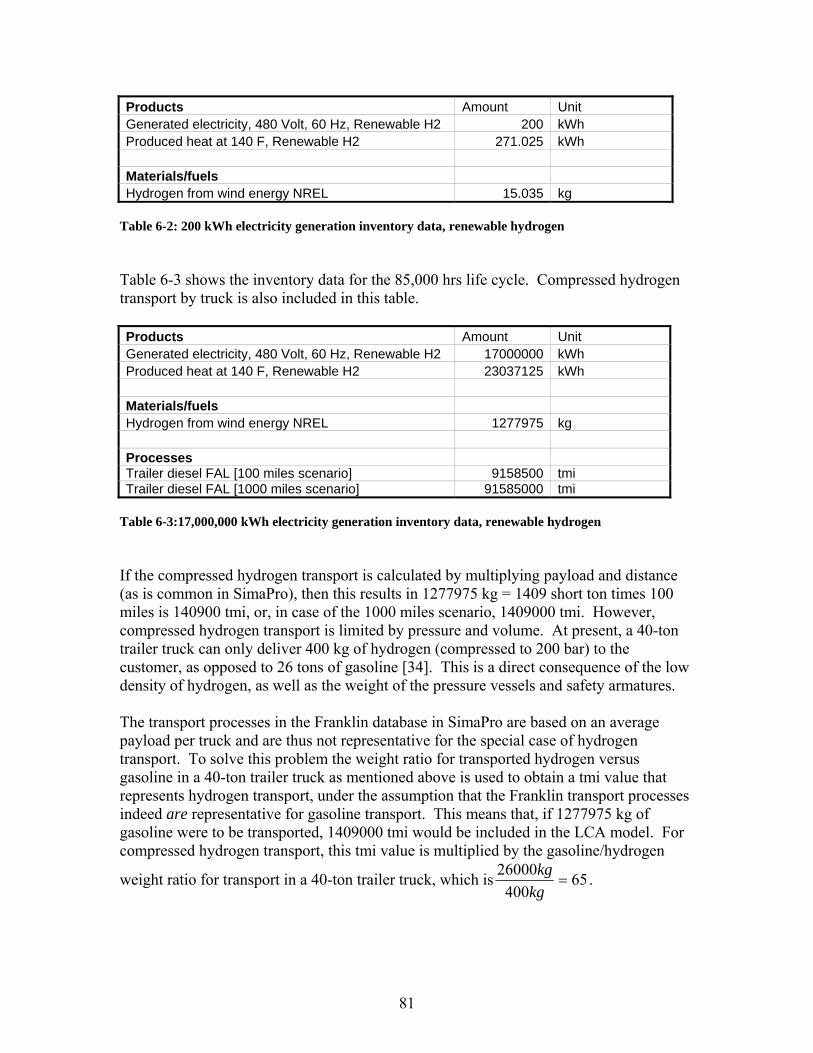
81
Products Amount Unit Generated electricity, 480 Volt, 60 Hz, Renewable H2 200 kWh Produced heat at 140 F, Renewable H2 271.025 kWh Materials/fuels Hydrogen from wind energy NREL 15.035 kg
Table 6-2: 200 kWh electricity generation inventory data, renewable hydrogen Table 6-3 shows the inventory data for the 85,000 hrs life cycle. Compressed hydrogen transport by truck is also included in this table. Products Amount Unit Generated electricity, 480 Volt, 60 Hz, Renewable H2 17000000 kWh Produced heat at 140 F, Renewable H2 23037125 kWh Materials/fuels Hydrogen from wind energy NREL 1277975 kg Processes Trailer diesel FAL [100 miles scenario] 9158500 tmi Trailer diesel FAL [1000 miles scenario] 91585000 tmi
Table 6-3:17,000,000 kWh electricity generation inventory data, renewable hydrogen If the compressed hydrogen transport is calculated by multiplying payload and distance (as is common in SimaPro), then this results in 1277975 kg = 1409 short ton times 100 miles is 140900 tmi, or, in case of the 1000 miles scenario, 1409000 tmi. However, compressed hydrogen transport is limited by pressure and volume. At present, a 40-ton trailer truck can only deliver 400 kg of hydrogen (compressed to 200 bar) to the customer, as opposed to 26 tons of gasoline [34]. This is a direct consequence of the low density of hydrogen, as well as the weight of the pressure vessels and safety armatures. The transport processes in the Franklin database in SimaPro are based on an average payload per truck and are thus not representative for the special case of hydrogen transport. To solve this problem the weight ratio for transported hydrogen versus gasoline in a 40-ton trailer truck as mentioned above is used to obtain a tmi value that represents hydrogen transport, under the assumption that the Franklin transport processes indeed are representative for gasoline transport. This means that, if 1277975 kg of gasoline were to be transported, 1409000 tmi would be included in the LCA model. For compressed hydrogen transport, this tmi value is multiplied by the gasoline/hydrogen
weight ratio for transport in a 40-ton trailer truck, which is 65400
26000=
kgkg .

82
For the 100 miles scenario, this then results in tmitmi 915850065*140900 = . For the 1000 miles scenario this results in tmitmi 9158500065*1409000 = . The transport process is modeled in SimaPro as ‘Trailer diesel FAL’ because the transport of compressed hydrogen is comparable to the transport of gasoline in a trailer truck. The compressed hydrogen pressure as an NREL system output is 20 MPa which is equal to the 200 bar assumed for transport. The removal of the reformer, ILS and steam ejector subassemblies also causes a change in the steel scrap process. Less steel is used in the PureCell™ system production and therefore less steel scrap is produced. Revised inventory data for this process are shown in Table 6-4. For the copper scrap process only the PCS, ECS and Harnesses and Cables subassemblies were taken into account, so this process doesn’t change. Materials Amount Unit Steel cold rolled coil IISI 10255 lb Stainless Steel 304 2B IISI 1000 lb Stainless Steel 316 2B IISI 275 lb Total 11530 lb Processes Cold transforming steel PureCell™ system 11472 lb Rolling steel I PureCell™ system 5419 lb Waste to treatment Steel scrap to Recycling Ferro metals 11530 lb
Table 6-4: Steel scrap inventory data, renewable hydrogen The amount of steel in the final PureCell™ system without the fuel processing system is:
• Steel cold rolled coil IISI: 19047 lb • Stainless Steel 304 2B IISI: 1854 lb • Stainless Steel 316 2B IISI: 515 lb • Aggregated this is 21416 lb steel.
With a scrap rate of 0.35, this means that a total amount of 11530 lb steel scrap is produced, from which:
• 10255 lb is Steel cold rolled coil IISI • 1000 lb is Stainless Steel 304 2B IISI • 275 lb is Stainless Steel 316 2B IISI.
And for the manufacturing processes:
• 0.995 * 11530 lb = 11472 lb ‘Cold transforming steel PureCell™ system’ • 0.47 * 11530 lb = 5419 lb ‘Rolling steel I PureCell™ system’.

83
Results The SimaPro results for the PureCell™ system using renewable hydrogen from wind energy instead of natural gas will be shown for both the use phase and the total life cycle, and for both the 100 miles and 1000 miles transport scenario.
100 Miles Transport Scenario Figure 6-3 shows the SimaPro network for the use phase with renewable hydrogen when 100 miles of compressed hydrogen transport are modeled.
Figure 6-3: PureCell™ system use phase renewable hydrogen SimaPro network, 100 miles scenario The use phase environmental impact is mainly due to hydrogen transport (64.7%) and hydrogen production (35%). The impact of the PureCell™ system installation and maintenance processes is relatively small, responsible for only 0.31% of the impact of the use phase. Table 6-5 compares the use phase single score results for the current PureCell™ system with the results for the PureCell™ system using renewable hydrogen. The last column shows the percentages of the scores for the PureCell™ system using renewable hydrogen relative to the scores of the current PureCell™ system.
Impact category Current PureCell™ system single score
result
Renewable H2 PureCell™ system single score
result
Percentage of current system
Total 1.12E+06 1.40E+05 13% Carcinogens 2.08E+04 1.93E+02 0.9%

84
Resp. organics 1.41E+03 1.23E+02 8.7%Resp. inorganics 2.44E+05 5.97E+04 24%Climate change 6.29E+04 1.23E+04 20%Radiation 0.0234 0.0234 100%Ozone layer 0.314 0.0526 17%Ecotoxicity 697 54.9 7.9%Acidification/ Eutrophication 1.69E+04 7.32E+03 43%Land use 5.85 5.85 100%Minerals 0.418 188 4.5E+04%Fossil fuels 7.74E+05 6.03E+04 7.8%
Table 6-5: PureCell™ system use phase, steam reforming vs. renewable hydrogen single score results, 100 miles scenario The total single score results show that the environmental impact of the PureCell™ system use phase is decreased by a factor 8 when renewable hydrogen is used as a fuel for the PureCell™ system. The results per impact category show that the impact categories ‘Fossil fuels’, ‘Respiratory inorganics’ and ‘Climate change’ have the most significant absolute decrease in impact. The only impact category that shows an increased impact is the ‘Minerals’ impact category, due to the resources that are required to manufacture the wind/electrolysis system. Figure 6-4 shows the SimaPro network for the PureCell™ system life cycle with renewable hydrogen when 100 miles of compressed hydrogen transport are modeled.
Figure 6-4: PureCell™ system life cycle renewable hydrogen SimaPro network, 100 miles scenario

85
The network shows that the use phase is still the biggest contributor to the life cycle environmental impact. However, the relative contribution of the use phase has gone down from 98.6% to 91.5%, and the relative contribution of the manufacturing phase has gone up from 1.45% to 8.68%. In Table 6-6 the life cycle single score results for the current PureCell™ system are compared with the results for the PureCell™ system using renewable hydrogen. The last column shows the percentages of the scores for the PureCell™ system using renewable hydrogen relative to the scores of the current PureCell™ system.
Impact category Current PureCell™ system single score
result
Renewable H2 PureCell™ system single score
result
Percentage of current system
Total 1.14E+06 1.53E+05 13% Carcinogens 2.16E+04 3.93E+02 1.8%Resp. organics 1.40E+03 117 8.4%Resp. inorganics 2.50E+05 6.45E+04 26%Climate change 6.40E+04 1.32E+04 21%Radiation 0.484 0.437 90%Ozone layer 1.2 0.776 65%Ecotoxicity 1.32E+03 352 27%Acidification/ Eutrophication 1.74E+04 7.73E+03 44%Land use 51.7 36.8 71%Minerals 1.46E+03 1.46E+03 100%Fossil fuels 7.80E+05 6.54E+04 8.4%
Table 6-6: PureCell™ system life cycle, steam reforming vs. renewable hydrogen single score results, 100 miles scenario The total single score results show that the environmental impact of the PureCell™ system life cycle is decreased by a factor 7 when renewable hydrogen is used as a fuel for the PureCell™ system and a 100 miles transport scenario is assumed.

86
1000 Miles Transport Scenario Figure 6-5 shows the SimaPro network for the use phase with renewable hydrogen when 1000 miles of compressed hydrogen transport are modeled.
Figure 6-5: -25 Use phase renewable hydrogen SimaPro network, 1000 miles scenario The network shows that in the 1000 miles transport scenario the use phase environmental impact is mainly due to hydrogen transport (94.8%). Hydrogen production only accounts for 5.13%. PureCell™ system installation and maintenance are together responsible for 0.04% of the total environmental impact of the use phase. In Table 6-7 the use phase single score results for the current PureCell™ system are compared with the results for the PureCell™ system using renewable hydrogen. The last column shows the percentages of the scores for the PureCell™ system using renewable hydrogen relative to the scores of the current PureCell™ system.
Impact category Current PureCell™ system single score
result
Renewable H2 PureCell™ system single score
result
Percentage of current system
Total 1.12E+06 9.56E+05 85% Carcinogens 2.08E+04 1.66E+03 8.0%Resp. organics 1.41E+03 1.23E+03 87%Resp. inorganics 2.44E+05 3.70E+05 152%Climate change 6.29E+04 6.13E+04 97%Radiation 0.0234 0.0234 100%

87
Ozone layer 0.314 0.272 87%Ecotoxicity 697 478 69%Acidification/ Eutrophication 1.69E+04 4.33E+04 256%Land use 5.85 5.85 100%Minerals 0.418 188 4.5E+04%Fossil fuels 7.74E+05 4.78E+05 62%
Table 6-7: PureCell™ system use phase, steam reforming vs. renewable hydrogen single score results, 1000 miles scenario The total single score results show that the environmental impact of the PureCell™ system use phase is decreased by a factor 1.2 when renewable hydrogen is used as a fuel for the PureCell™ system. The results per impact category show that the ‘Fossil fuels’ and ‘Carcinogens’ impact categories have the most significant absolute decrease in impact. The most significant absolute increase in impact occurs in the ‘Respiratory inorganics’ and the ‘Acidification/Eutrophication’ impact categories. Figure 6-6 shows the SimaPro network for the PureCell™ system life cycle with renewable hydrogen when 1000 miles of compressed hydrogen transport are modeled.
Figure 6-6: PureCell™ system life cycle renewable hydrogen SimaPro network, 1000 miles scenario The network shows that in the life cycle of a PureCell™ system running on renewable hydrogen with a 1000 miles transport scenario the use phase is still the biggest contributor to the life cycle environmental impact. Due to the removal of the reformer,
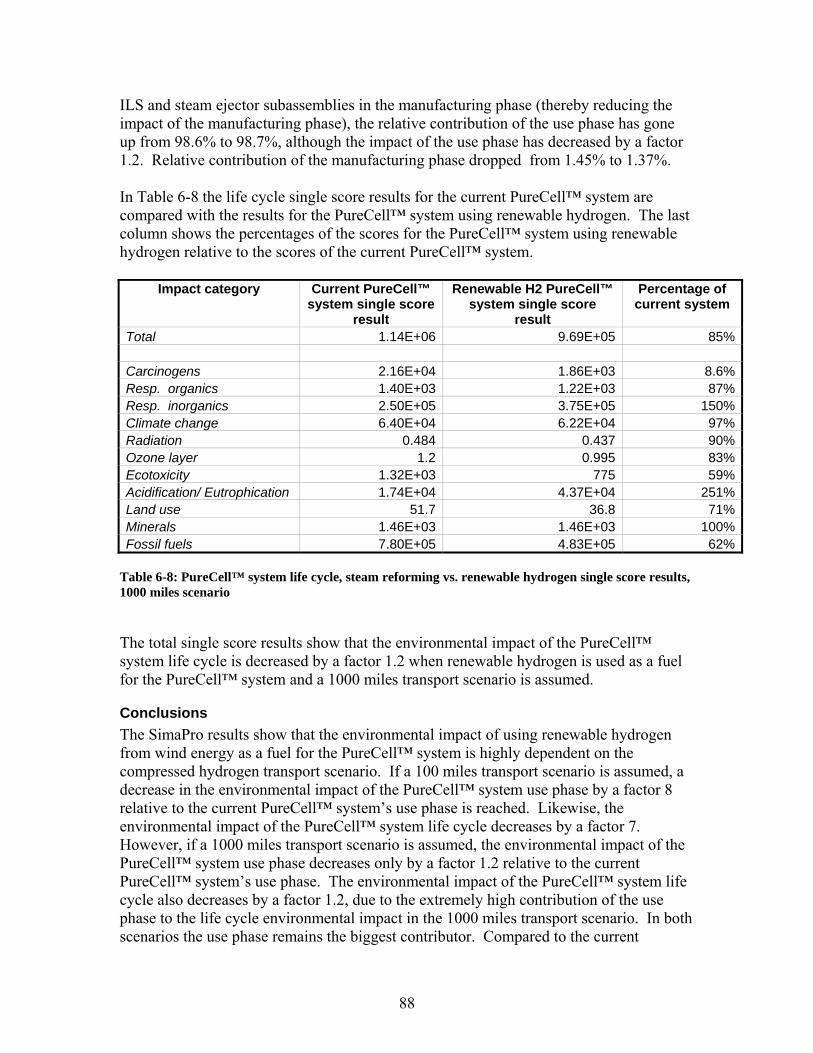
88
ILS and steam ejector subassemblies in the manufacturing phase (thereby reducing the impact of the manufacturing phase), the relative contribution of the use phase has gone up from 98.6% to 98.7%, although the impact of the use phase has decreased by a factor 1.2. Relative contribution of the manufacturing phase dropped from 1.45% to 1.37%. In Table 6-8 the life cycle single score results for the current PureCell™ system are compared with the results for the PureCell™ system using renewable hydrogen. The last column shows the percentages of the scores for the PureCell™ system using renewable hydrogen relative to the scores of the current PureCell™ system.
Impact category Current PureCell™ system single score
result
Renewable H2 PureCell™ system single score
result
Percentage of current system
Total 1.14E+06 9.69E+05 85% Carcinogens 2.16E+04 1.86E+03 8.6%Resp. organics 1.40E+03 1.22E+03 87%Resp. inorganics 2.50E+05 3.75E+05 150%Climate change 6.40E+04 6.22E+04 97%Radiation 0.484 0.437 90%Ozone layer 1.2 0.995 83%Ecotoxicity 1.32E+03 775 59%Acidification/ Eutrophication 1.74E+04 4.37E+04 251%Land use 51.7 36.8 71%Minerals 1.46E+03 1.46E+03 100%Fossil fuels 7.80E+05 4.83E+05 62%
Table 6-8: PureCell™ system life cycle, steam reforming vs. renewable hydrogen single score results, 1000 miles scenario The total single score results show that the environmental impact of the PureCell™ system life cycle is decreased by a factor 1.2 when renewable hydrogen is used as a fuel for the PureCell™ system and a 1000 miles transport scenario is assumed.
Conclusions The SimaPro results show that the environmental impact of using renewable hydrogen from wind energy as a fuel for the PureCell™ system is highly dependent on the compressed hydrogen transport scenario. If a 100 miles transport scenario is assumed, a decrease in the environmental impact of the PureCell™ system use phase by a factor 8 relative to the current PureCell™ system’s use phase is reached. Likewise, the environmental impact of the PureCell™ system life cycle decreases by a factor 7. However, if a 1000 miles transport scenario is assumed, the environmental impact of the PureCell™ system use phase decreases only by a factor 1.2 relative to the current PureCell™ system’s use phase. The environmental impact of the PureCell™ system life cycle also decreases by a factor 1.2, due to the extremely high contribution of the use phase to the life cycle environmental impact in the 1000 miles transport scenario. In both scenarios the use phase remains the biggest contributor. Compared to the current

89
PureCell™ system, the relative contribution of the use phase to the total life cycle impact decreases from 98.6% to 91.5% for the 100 miles transport scenario, but it increases from 98.6% to 98.7% for the 1000 miles transport scenario. Compressed hydrogen transport is responsible for 64.7% of the use phase impact in the 100 miles transport scenario, and for 94.8% of the use phase impact in the 1000 miles transport scenario.
Alternative End-of-Life Scenario In this section, improvement of the environmental performance of the PureCell™ system through reuse of certain PureCell™ system subassemblies and through maximizing platinum recycling is analyzed. Some of the PureCell™ system subassemblies have an indefinite lifetime and can possibly be reused. If for instance a subassembly is reused once then its environmental impact in the manufacturing phase is shared by two PureCell™ systems. Even though only 22.6 g platinum and 8.8 g palladium are used in the ILS it may still be worthwhile to recycle these materials due to the extremely high environmental impact per kg for PGMs (platinum group metals). Likewise as for the CSA platinum, a 98% recycling rate is assumed and implemented in the SimaPro model. Regarding reuse, there are however some difficulties involved which have to be kept in mind. First of all there are technological difficulties. For example, in case of frame subassembly reuse, parts of the frame where the nuts and bolts are attached can rust and break, making the frame useless. In case of reuse these kinds of technological difficulties should therefore be taken into account in the design and manufacturing stage to ensure an increased lifetime. Second, there are also economical difficulties. In some (or even many) cases it may not be economically worthwhile to reuse subassemblies or components. In case of the enclosure subassembly, for example, this will need to be shipped, stripped, cleaned and re-painted before reuse, which will be more expensive than manufacturing a new enclosure. Finally, reuse also raises the question of liability. Within a conventional supplier/buyer system, the buyer will never want to buy a product in which not all components are new. This is because the liability shifts to the buyer whenever the product is bought. Ways to get around this are providing a guaranteed product lifetime or using a leasing contract. This issue will be further addressed in the conclusion of this section. This alternative end-of-life scenario is intended to show the significance of the opportunities of reusing subassemblies and maximizing platinum recycling when looking at the environmental impact of the PureCell™ system. SimaPro is used to develop a preliminary model. A more detailed assessment is required to explore this strategy further.
Changes in SimaPro Model The subassemblies that are reused in this alternative scenario are the steam ejector, steam drum subassembly (part of the TMS), frame, enclosure, PCS and ECS. The decision to include reuse of these subassemblies in the SimaPro model is based on discussions on reuse opportunities with people at UTC Power. The PCS is taken as an example in order to show how the subassembly reuse is modeled in SimaPro. Table 6-9 shows the PCS waste scenario as it is modeled in SimaPro.

90
PCS waste scenario 1 kg Separated waste Recycling Ferro metals Steel cold rolled coil IISI 100% Landfill Ferro metals Steel cold rolled coil IISI 0% Recycling Non-ferro Copper ETH U PureCell™ system 90% Copper (inert) to landfill U Copper ETH U PureCell™ system 10% Remaining waste Unspecified 100%
Table 6-9: PCS SimaPro waste scenario In the original PureCell™ system LCA model the PCS was fully ‘sent’ to this waste scenario in the PureCell™ system end-of-life phase. The recycling rates correlate with those mentioned in Chapter 4 - Inventory Analysis, and the unspecified remaining waste represents the electric components in the PCS. In the alternative end-of-life scenario the PCS is for 50% sent to the waste scenario shown above and for 50% sent to PCS reuse, as shown in Table 6-10. This means that the PCS will be reused once, and half of the PCS environmental impact in the manufacturing phase is now subtracted (thus being an environmental benefit) from the environmental impact of the end-of-life phase. In this way the environmental impact of both the PCS manufacturing and the PCS disposal are evenly divided between a current PureCell™ system and a hypothetical PureCell™ system in the future. Note that the benefit of reuse appears in the end-of-life phase and not in the manufacturing phase. Assembly Amount Unit PCS 1 p Waste scenarios Percentage PCS waste scenario 50% Reuses Percentage PCS reuse 50%
Table 6-10: PureCell™ system PCS disposal scenario including reuse Figure 6-7 shows the SimaPro network for the PureCell™ system end-of-life phase including reuse. Only the subassemblies and processes with the biggest contribution to the end-of-life phase environmental impact are exposed. The light blue boxes show that SimaPro models reuse by subtracting half of the environmental impact of the subassembly in the manufacturing phase from the end-of-life phase environmental impact.

91
Figure 6-7: PureCell™ system end-of-life phase including reuse SimaPro network Figure 6-7 shows that, in particular, the reuse of the PCS and ECS has a big influence on the end-of-life phase environmental impact. Results will be analyzed in more detail in the ‘Results’ paragraph.

92
The 98% recycling of ILS platinum and palladium in the alternative end-of-life scenario also requires changes in the SimaPro model. Table 6-11 shows the LCI data for the ILS platinum and palladium when 98% is recycled. current ILS 98% recycling Platinum I PureCell™ system 22.6 g 0.452 g Palladium I PureCell™ system 8.8 g 0.176 g Platinum recycled PureCell™ system 0 g 22.148 g Palladium recycled PureCell™ system 0 g 8.624 g
Table 6-11: ILS Platinum and palladium data 98% recycling The recycled platinum is modeled in SimaPro with LCI data from [13]. The process inventory is specified in Appendix D. For the palladium recycling process the same data are used as for the platinum recycling, as both materials are PGMs and have similar physical and chemical properties.
Results Results of the alternative end-of-life scenario are shown for the end-of-life phase, the manufacturing phase and for the end-of-life and manufacturing phase aggregated. The benefit of subassembly reuse is shown in the end-of-life phase results, whereas the benefit of 98% ILS platinum and palladium recycling is shown in the manufacturing phase results. Table 6-12 shows a comparison of end-of-life phase results for the original LCA model versus the LCA model with the alternative end-of-life scenario. The last column shows the percentages of the scores for the PureCell™ system with reuse scenario relative to the scores of the current PureCell™ system without reuse scenario. The percentages represent the increase or decrease in the absolute value of the scores, thereby considering negative scores as positive environmental benefits and positive scores as positive environmental impacts.
Impact category Without reuse single score result
With reuse single score result
Percentage of current system
Total -421 -2.20E+03 523% Carcinogens -221 -145 66%Resp. organics -13.7 -11.3 82%Resp. inorganics -44.9 -671 1.5E+03%Climate change -2.44 -154 6.3E+03%Radiation 0.083 -0.0441 n/aOzone layer 0.187 0.0573 31%Ecotoxicity -6.06 -60.9 1.0E+03%
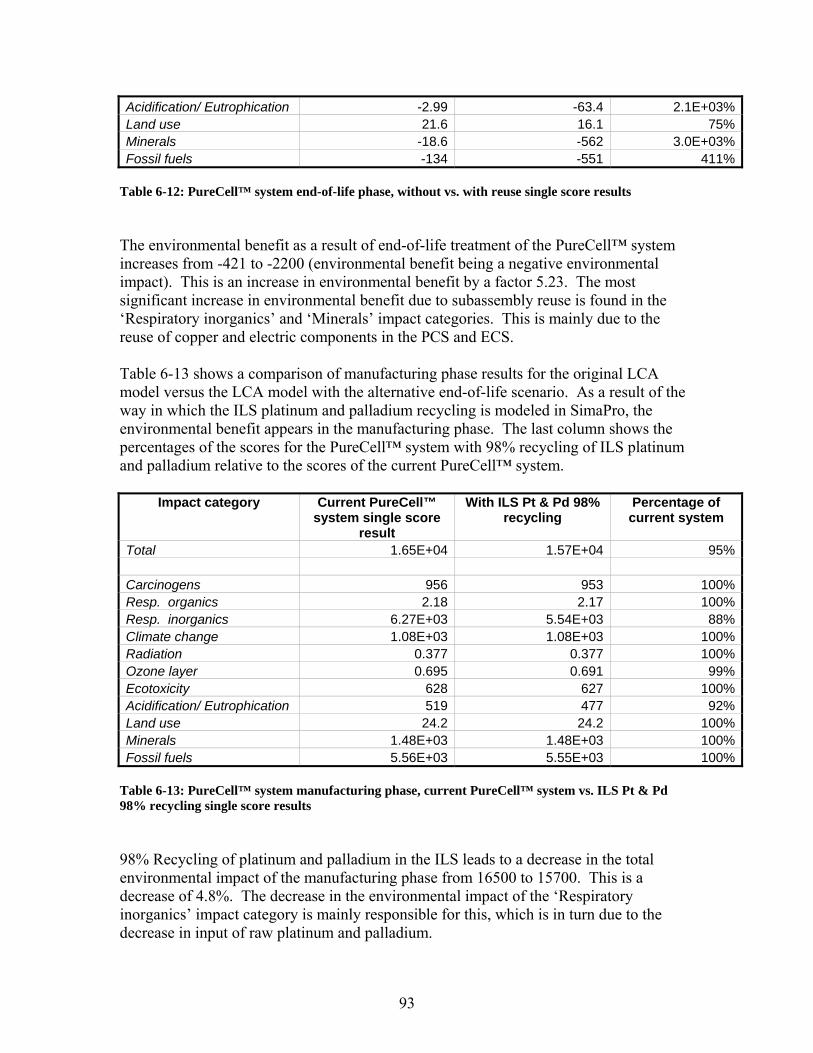
93
Acidification/ Eutrophication -2.99 -63.4 2.1E+03%Land use 21.6 16.1 75%Minerals -18.6 -562 3.0E+03%Fossil fuels -134 -551 411%
Table 6-12: PureCell™ system end-of-life phase, without vs. with reuse single score results The environmental benefit as a result of end-of-life treatment of the PureCell™ system increases from -421 to -2200 (environmental benefit being a negative environmental impact). This is an increase in environmental benefit by a factor 5.23. The most significant increase in environmental benefit due to subassembly reuse is found in the ‘Respiratory inorganics’ and ‘Minerals’ impact categories. This is mainly due to the reuse of copper and electric components in the PCS and ECS. Table 6-13 shows a comparison of manufacturing phase results for the original LCA model versus the LCA model with the alternative end-of-life scenario. As a result of the way in which the ILS platinum and palladium recycling is modeled in SimaPro, the environmental benefit appears in the manufacturing phase. The last column shows the percentages of the scores for the PureCell™ system with 98% recycling of ILS platinum and palladium relative to the scores of the current PureCell™ system.
Impact category Current PureCell™ system single score
result
With ILS Pt & Pd 98% recycling
Percentage of current system
Total 1.65E+04 1.57E+04 95% Carcinogens 956 953 100%Resp. organics 2.18 2.17 100%Resp. inorganics 6.27E+03 5.54E+03 88%Climate change 1.08E+03 1.08E+03 100%Radiation 0.377 0.377 100%Ozone layer 0.695 0.691 99%Ecotoxicity 628 627 100%Acidification/ Eutrophication 519 477 92%Land use 24.2 24.2 100%Minerals 1.48E+03 1.48E+03 100%Fossil fuels 5.56E+03 5.55E+03 100%
Table 6-13: PureCell™ system manufacturing phase, current PureCell™ system vs. ILS Pt & Pd 98% recycling single score results 98% Recycling of platinum and palladium in the ILS leads to a decrease in the total environmental impact of the manufacturing phase from 16500 to 15700. This is a decrease of 4.8%. The decrease in the environmental impact of the ‘Respiratory inorganics’ impact category is mainly responsible for this, which is in turn due to the decrease in input of raw platinum and palladium.

94
Table 6-14 shows a comparison of aggregated manufacturing and end-of-life phase results for the original end-of-life scenario with the alternative end-of-life scenario. The use phase environmental impact is left out in order to show the significance of the implementation of the alternative end-of-life scenario.
Impact category Original end-of-life scenario
Alternative end-of-life scenario
Percentage of current system
Total 1.61E+04 1.35E+04 84% Carcinogens 735 808 110%Resp. organics -11.6 -9.09 78%Resp. inorganics 6.23E+03 4.87E+03 78%Climate change 1.08E+03 922 85%Radiation 0.46 0.333 72%Ozone layer 0.881 0.748 85%Ecotoxicity 621 566 91%Acidification/ Eutrophication 516 413 80%Land use 45.8 40.4 88%Minerals 1.46E+03 917 63%Fossil fuels 5.43E+03 5.00E+03 92%
Table 6-14: Original vs. alternative end-of-life scenario, PureCell™ system manufacturing phase and end-of-life phase single score results aggregated The alternative end-of-life scenario leads to a decrease in this aggregated environmental impact from 16100 to 13500. This is a decrease of 16%.
Conclusions Implementation of the alternative end-of-life scenario described above results in a 16% decrease in the environmental impact of the PureCell™ system manufacturing and end-of-life phase aggregated. Reuse of the steam ejector, steam drum, frame, enclosure, PCS and ECS subassemblies is responsible for an 11% decrease, and 98% recycling of the platinum and palladium in the ILS is responsible for a 5% decrease. However, if one looks at the effect of the alternative end-of-life scenario on the environmental impact of the PureCell™ system life cycle (i.e., if the use phase is included) then the decrease is only 0.23% due to the high contribution of the use phase to the life cycle environmental impact. As mentioned before, liability issues make the option of reuse more than just a technological problem. A buyer will never want to buy a product in which not all components are new unless the product has a guaranteed period of functioning. One way to solve this problem is to sell PureCell™ system’s with a guaranteed lifetime. Another way is to use a leasing system, where the client leases a PureCell™ system for an agreed price while leaving the liability for the system to function to UTC Power. In this way UTC Power determines which subassemblies or components can be reused, while at the same time product reliability and customer satisfaction are maintained. For complex

95
products that consist of many different components with different lifetimes, leasing can be a solution that enhances subassembly or component reuse and thus reduces the product’s environmental impact.

96
Chapter 7 - Final Conclusions In this research an LCA was performed on the PureCell™ power system. The PureCell™ system is a phosphoric acid fuel cell system manufactured by UTC Power, located in South Windsor, Connecticut. Data for the LCA were collected in collaboration with UTC Power, and the LCA was modeled using SimaPro software. The objective of this project was to provide a guide for environmental improvement of the PureCell™ power system. The approach to accomplish this objective was divided into two steps. In the first step the ‘hotspots’ that contribute to the present environmental profile of the product were identified by using LCA to model the product life cycle. An analysis of the targeted hotspots was given in the Chapter 5 - Impact Assessment and Interpretation. Looking at the LCA results for the PureCell™ system life cycle, it became clear that the 85,000 hrs use phase has an extremely high environmental impact relative to the manufacturing and end-of-life phase. In fact, the use phase is responsible for 98% of the PureCell™ system life cycle’s total environmental impact. This is mainly due to the use of natural gas as a fuel (and its depletion as a resource) and the emissions caused by the steam reforming process. When the PureCell™ system manufacturing phase was analyzed separately it was shown that the CSA (Cell Stack Assembly) is responsible for 49% of the total environmental impact of the manufacturing phase. The CSA is followed by the PCS (Power Conditioning System, 16%) and the ILS (Integrated Low-temperature Shift converter, 11%). If one looks at the energy fuel and material level instead of the subassembly level, natural gas turns out to be by far the biggest contributor to the manufacturing phase impact. This is mainly due to the natural gas used for CSA manufacturing at UTC Power. Materials with a big contribution to the environmental impact of the manufacturing phase are stainless steel 304, copper and raw platinum. LCA results for the CSA were also analyzed separately because the CSA is responsible for 49% of the total environmental impact of the manufacturing phase. The electricity and natural gas used for CSA manufacturing are the main contributors to this 49%. Together they are responsible for 72% of the CSA total impact. Thus, the contribution of electricity and natural gas to the impact of the manufacturing phase is 35%. It should however be kept in mind that due to the allocation procedure these electricity and natural gas data have a high degree of uncertainty, as described in Chapter 5. To accomplish the second project objective, opportunities for improving the environmental footprint were explored. Based on the results shown in Chapter 5 - Impact Assessment and Interpretation, two feasible opportunities within the scope of this research were modeled in SimaPro. These two opportunities were: using renewable hydrogen from wind power and improving the end-of-life scenario from an environmental perspective by reusing components and maximizing platinum recycling.

97
The goal of this part of the research was to quantify the potential environmental improvement for both opportunities relative to the current PureCell™ system. Data from an LCA done by NREL for a wind/electrolysis system were used to model the opportunity for using renewable hydrogen from wind power. The wind/electrolysis system considered in the NREL LCA replaced the steam reforming system and the use phase input and emissions of the current PureCell™ system. The hydrogen was assumed to be transported by truck and in compressed form to the PureCell™ system locations. Both a 100 mile and a 1000 miles transport scenario were implemented in the LCA model. SimaPro results show that using renewable hydrogen from wind energy as a fuel for the PureCell™ system instead of natural gas provides a decrease in the environmental impact of the PureCell™ system life cycle by a factor 7 for the 100 miles transport scenario and a decrease by a factor 1.2 for the 1000 miles transport scenario. In the renewable hydrogen use phase, compressed hydrogen transport is responsible for 64.7% of the use phase impact in the 100 miles transport scenario, and for 94.8% of the use phase impact in the 1000 miles transport scenario. The distance over which the hydrogen has to be transported is therefore an important factor for the environmental impact of a PureCell™ system using renewable hydrogen from wind energy. In the alternative end-of-life scenario the steam ejector, steam drum (part of the TMS), frame, enclosure, PCS and ECS subassemblies were assumed to be reused. Furthermore, a 98% recycling rate was assumed for the platinum and palladium in the ILS. Results show that implementation of this alternative end-of-life scenario results in a 16% decrease in the environmental impact of the PureCell™ system manufacturing and end-of-life phase aggregated. Reuse is responsible for an 11% decrease and ILS platinum and palladium recycling is responsible for a 5% decrease. The effect of the alternative end-of-life scenario on the environmental impact of the PureCell™ system life cycle is however only a decrease of 0.23%. Based on the overall results of this study, a number of recommendations for environmental improvement of the PureCell™ system can be made to UTC Power. The biggest possibilities for improving the environmental performance of the PureCell™ system clearly lie in the use phase. The biggest impacts in the use phase occur due to the steam reforming of natural gas. Within the current PureCell™ system, increasing the efficiency of the steam reforming process and increasing the electrical efficiency of the fuel cell stack will both lead to a decrease in natural gas usage and therefore also to a decrease in the emissions caused by the steam reforming process, thereby significantly reducing the PureCell™ system life cycle’s environmental impact. A second option is to use hydrogen from renewable energy, as it is described in this report for the case of hydrogen from wind energy. A third option to improve the PureCell™ system’s environmental performance in the use phase is carbon sequestration. Although this option is not analyzed in this report, the LCA results show that emissions caused by the steam reforming process are responsible for 4.6% of the life cycle environmental impact of the PureCell™ system. 99% of this overall impact of the steam reforming process is caused by 2CO emissions. Therefore

98
carbon sequestration can theoretically lead to a maximum decrease of 4.6% in the environmental impact of the PureCell™ system life cycle, dependent on the environmental impact of the carbon sequestration system. Regarding the manufacturing phase, platinum deserves the most attention. A decrease in the amount of platinum used in the PureCell™ system leads to a significant decrease in the environmental impact of the manufacturing phase. The platinum recycling rate also has a big influence on the environmental impact, and maximizing the platinum recycling rate is therefore a major opportunity for improvement. Furthermore the LCA results show that the CSA manufacturing process is very energy intensive. It therefore appears to be worthwhile to make the CSA manufacturing process more energy efficient. However, this conclusion is based on data with a high degree of uncertainty. Finally, reuse of certain subassemblies looks promising from an environmental point of view. Although many difficulties are involved with the option of reuse, it is worth considering.

99
References 1. Energy Information Administration (EIA), Annual Energy Review 2004: World
Primary Energy Production, 1970-2003. 2004, http://www.eia.doe.gov. 2. Pehnt, M., Life Cycle Analysis of Fuel Cell System Components. Handbook of
Fuel Cells - Fundamentals, Technology and Applications, 2003. 4(13): p. 1293-1317.
3. UTC Power, A United Technologies Company. 2006, www.utcpower.com. 4. ISO, Environmental management - Life cycle assessment - Principles and
framework. 1997, International Organization for Standardization: Geneva. 5. PRe Consultants, Life cycle tools to improve environmental performance. 2006,
www.pre.nl. 6. National Renewable Energy Laboratory (NREL), Life-Cycle Inventory Database.
2006, http://www.nrel.gov/lci/database/. 7. Goedkoop, M. and R. Spriensma, The Eco-indicator 99: A damage oriented
method for Life Cycle Impact Assessment, Methodology Report. 2001, PRé Consultants B.V.: Amersfoort, NL.
8. Aboussouan, L. and S. Malm, IISI LCA data. 2006, International Iron and Steel Institute.
9. Fujii, H., et al., How to quantify the environmental profile of stainless steel, in SETAC North America 26th Annual Meeting. 2005.
10. UTC Power, PureCell 200TM Commercial Fuel Cell Power System. 2003. 11. ABB Motors A/S, Environmental Product Declaration for Electric Motor Type
90S 4 Pole, E. Just, Editor. 1999, http://library.abb.com/global. 12. The Aluminum Association Inc. 2006, www.aluminum.org. 13. AEA Technology, Platinum and hydrogen for fuel cell vehicles, U.K.
Department for Transport, Editor. 2006. 14. U.S. Environmental Protection Agency, Perfluorooctanoic Acid (PFOA) and
Fluorinated Telomers. 2006, http://www.epa.gov/opptintr/pfoa/. 15. Carnegie Mellon Green Design Institute, Economic Input-Output Life Cycle
Assessment. 2006, http://www.eiolca.net/. 16. Lewis, G.M., et al., PV-BILD: A Life Cycle Environmental and Economic
Assessment Tool for Building-Integrated Photovoltaic Installations. 1999, National Science Foundation / Lucent Technologies Industrial Ecology Grant.
17. Williams, E.D., R.U. Ayres, and M. Heller, The 1.7 Kilogram Microchip: Energy and Material Use in the Production of Semiconductor Devices. Environmental Science & Technology, 2002. 36(24): p. 5504-5510.
18. MWS Wire Industries, Insulation Specification Cross Reference Table. 2006, http://www.mwswire.com/insspec.htm.
19. Keoleian, G.A., et al., Industrial Ecology of the Automobile: A Life Cycle Perspective. 1997, Society of Automotive Engineers: Warrendale, PA.
20. TIFAC, Activated Carbon Production Plant. 2006, www.tifac.org.in. 21. UTC Power, PC25 200 kW Fuel Cell Power Plant, Major Systems and
Components Description. 2006. 22. Union Gas, Chemical Composition of Natural Gas. 2006, www.uniongas.com.

100
23. Steel Recycling Institute, Steel: Driving Auto Recycling Success. 2006, http://www.recycle-steel.org/cars.html: Pittsburgh.
24. U.S. Environmental Protection Agency, Municipal Solid Waste: Automotive Parts. 2006, http://www.epa.gov/garbage/auto.htm.
25. Handley, C., N.P. Brandon, and R. van der Vorst, Impact of the European Union vehicle waste directive on end-of-life options for polymer electrolyte fuel cells. Journal of Power Sources, 2002. 106: p. 344-352.
26. Heijungs, R., Advanced Course on LCA. 2005, CML: Leiden. 27. Department of the Environment and Transport and the Regions, Winter Smog
Summer Smog. 1998, http://www.defra.gov.uk/environment/airquality/smog/index.htm.
28. Pehnt, M., Life Cycle Assessment of Fuel Cell Stacks. International Journal of Hydrogen, 2001. 26: p. 91-101.
29. Lunghi, P. and R. Bove, Life Cycle Assessment of a Molten Carbonate Fuel Cell Stack. 2003, Universita degli Studi di Perugia.
30. Heijungs, R., UNEP LCA Training Kit, Module F: Interpretation. 2005, CML: Leiden.
31. Spath, P.L. and M.K. Mann, Life Cycle Assessment of Renewable Hydrogen Production via Wind/Electrolysis. 2004, NREL: Golden.
32. U.S. Department of Energy, E.E.a.R.E., Hydrogen, Fuel Cells & Infrastructure Technologies Program. 2006, http://www.eere.energy.gov/hydrogenandfuelcells/delivery/current_technology.html#trucks.
33. Bossel, U., B. Eliasson, and G. Taylor, The Future of the Hydrogen Economy: Bright or Bleak? 2003, http://www.oilcrash.com/articles/h2_eco.htm.
34. Bossel, U. and B. Eliasson, Energy and the Hydrogen Economy. 2003. 35. Larminie, J. and A. Dicks, Fuel Cell Systems Explained. 2nd ed. 2003.

101
Appendices

102
Appendix A: PureCell™ System Manufacturing Phase Aggregated Inventory Table Table 0-1 below gives the aggregated weights of the PureCell™ system input materials in the manufacturing phase. The databases from which these processes are selected are also mentioned. The database PureCell™ system consists of data that do not come from a generic SimaPro database; these processes were imported in SimaPro especially for this research project and are specified in Appendix D. The processes that come from generic SimaPro databases but have ‘PC25’ added to their description are adapted to the geographical location of UTC Power if this was considered to be relevant. An example is adapting the electricity input in a material production process to the U.S. average electricity mix. Materials/Assemblies Amount (kg) SimaPro database Steel cold rolled coil IISI 1.48E+04 PC25 Recycling Ferro metals (recycling steel scrap) 7.03E+03 Data Archive Stainless Steel 304 2B IISI 4.98E+03 PC25 Graphite 1.72E+03 PC25 Copper ETH U PureCell™ system 1.15E+03 ETH-ESU 96 Silicium carbide I PureCell™ system 863 IDEMAT 2001 Zinc oxide PureCell™ system 566 PC25 Zinc I PureCell™ system 453 IDEMAT 2001 Glass fiber I PureCell™ system 418 IDEMAT 2001 Stainless Steel 316 2B IISI 358 PC25 Aluminum oxide PureCell™ system 215 BUWAL250 PE granulate average B250 PureCell™ system 212 BUWAL250 Electric Components PureCell™ system 159 PC25 Zeolite ETH U PureCell™ system 148 ETH-ESU 96 Phosphoric acid ETH U PureCell™ system 114 ETH-ESU 96 Recycling Non-ferro (recycling copper scrap) 111 Data Archive Carbon black ETH U 81.6 ETH-ESU 96 Electric motor PureCell™ system 81.6 PC25 Nickel enriched ETH U PureCell™ system 38.8 ETH-ESU 96 PET ETH U PureCell™ system 38.6 ETH-ESU 96 Aluminum (primary) produced in the USA 20.7 PC25 Aluminum 100% recycled ETH U PureCell™ system 20.7 ETH-ESU 96 PP granulate average B250 20.4 BUWAL250 Paint ETH U PureCell™ system 6.8 ETH-ESU 96 Lanthanum PureCell™ system 2.22 Raw material Platinum recycled PureCell™ system 1.53 PC25 Platinum I PureCell™ system 0.0538 IDEMAT 2001 Palladium I PureCell™ system 0.0088 IDEMAT 2001 Total 3.40E+04 Processes

103
Cold transforming steel PureCell™ system 1.99E+04 Data Archive Rolling steel I PureCell™ system 9.44E+03 IDEMAT 2001 Copper wire PureCell™ system 1.11E+03 Data Archive Turning steel PureCell™ system 159 Data Archive Cast work, non-ferro PureCell™ system 68 Data Archive Injection molding PureCell™ system 43.1 IDEMAT 2001 Forging steel PureCell™ system 43.1 Data Archive Turning aluminum I PureCell™ system 15.9 IDEMAT 2001 Cold transforming Al I PureCell™ system 15.9 IDEMAT 2001 Electric welding steel 5 PureCell™ system 150 m Data Archive Electric welding steel 3 PureCell™ system 37 m Data Archive Heat from nat. gas FAL 3.28E+05 MJ Franklin USA 98 UTC South Windsor electricity mix 2.38E+05 MJ PC25 Truck (single) diesel FAL (Franklin) 1.18E+04 tkm Franklin USA 98
Table 0-1: PureCell™ system manufacturing phase aggregated inventory table

104
Appendix B: PureCell™ System Use Phase Inventory Tables Materials Amount (lb) SimaPro database Steel cold rolled coil IISI 132 PC25 Stainless Steel 304 2B IISI 114 PC25 Propylene glycol ETH U PureCell™ system 476 ETH-ESU 96 Activated carbon PureCell™ system 60 PC25 Concrete PureCell™ system 7940 IDEMAT 2001 Water decarbonized ETH U 992 ETH-ESU Nitrogen 185 Raw material Total 9899 Processes Cold transforming steel PureCell™ system 132 Data Archive Cold transforming steel PureCell™ system 114 Data Archive
Table 0-2: PureCell™ system installation inventory data Products Amount SimaPro database Generated electricity, 480 Volt, 60 Hz 17000000 kWh PC25 Produced heat at 140 F 23037125 kWh PC25 Materials/fuels Natural gas FAL (Franklin) 174250000 cuft Franklin USA 98 Emissions to air NOx 272 lb Airborne emission CO 391 lb Airborne emission CO2 9537000 kg Airborne emission non-methane hydrocarbon (NMHC) 6.12 lb Airborne emission
Table 0-3: 17,000,000 kWh electricity generation inventory data Materials Amount Waste treatment SimaPro databaseActivated carbon PureCell™ system 1852.5 lb
PC25
Total 1852.5 lb Waste to treatment inorganic general 1852.5 lb Landfill Compostables Data Archivechromium compounds 570 kg LT waste to chemical landfill ETH-ESU 96chromium compounds 570 kg Waste to chemical landfill ETH-ESU 96

105
Table 0-4: PureCell™ system maintenance inventory data
Appendix C: PureCell™ System End-of-Life Phase Inventory Table Material Waste treatment SimaPro database %Steel cold rolled coil IISI Recycling Ferro metals Data Archive 100% Stainless Steel 304 2B IISI Recycling Ferro metals Data Archive 100% Stainless Steel 316 2B IISI Recycling Ferro metals Data Archive 100% Copper ETH U PureCell™ system Recycling Non-ferro Data Archive 90%Copper ETH U PureCell™ system Copper (inert) to landfill ETH-ESU 96 10% Aluminum (primary) produced in the USA Recycling aluminum B250 BUWAL 250 90%Aluminum (primary) produced in the USA Landfill Aluminum B250 (1998) BUWAL 250 10% Aluminum 100% recycled ETH U PureCell™ system Recycling aluminum B250 BUWAL 250 90%Aluminum 100% recycled ETH U PureCell™ system Landfill Aluminum B250 (1998) BUWAL 250 10% Nickel enriched ETH U PureCell™ system Recycling Non-ferro Data Archive 90%Nickel enriched ETH U PureCell™ system Unspecified BUWAL 250 10%
Graphite PureCell™ system Waste to special waste incinerator ETH-ESU 96 100%
Carbon black ETH U PureCell™ system
Waste to special waste incinerator ETH-ESU 96 100%
PTFE (Teflon®) Waste to special waste incinerator ETH-ESU 96 100%
Glass fiber I PureCell™ system Landfill Glass B250 (1998) BUWAL 250 100% Zeolite ETH U PureCell™ system Zeolite (inert) to landfill ETH-ESU 96 100% PP granulate average B250 PureCell™ system Landfill PP B250 (1998) BUWAL 250 100% PET ETH U PureCell™ system Landfill PET B250 BUWAL 250 100%

106
Electric Components PureCell™ system Unspecified BUWAL 250 100% Other materials Unspecified BUWAL 250 100%
Table 0-5: PureCell™ system end-of-life phase, materials to waste treatment
Appendix D: PureCell™ System Processes Imported in SimaPro This appendix contains the input data of the processes that were imported in SimaPro especially for the PureCell™ system research project.
Steel cold rolled coil IISI [8] Products Steel cold rolled coil IISI 1 kg Resources coal FAL 0.747546 kg dolomite 0.028108 kg iron (in ore) 1.85785 kg natural gas FAL 0.041579 kg crude oil FAL 0.039205 kg scrap, external 0.102475 kg water 20.5351 kg energy from hydro power 0.321558 MJ energy (undef.) 4.4966 MJ Emissions to air Cd 6.63E-05 g CO2 (fossil) 2.43815 kg CO 30.4184 g Cr 0.0038 g dioxin (TEQ) 2.04E-08 g HCl 0.072779 g H2S 0.081512 g Pb 0.003689 g Hg 6.61E-05 g Methane 0.731735 g NOx (as NO2) 3.01092 g N2O 0.127983 g particulates (unspecified) 1.893079 g SOx (as SO2) 2.86906 g VOC 0.145793 g Zn 0.003553 g Emissions to water

107
NH4+ 0.043917 g NH3 (as N) 0.04 g Cd 7.25E-05 g Cr 0.000107 g COD 0.27784 g Fe 0.037039 g Pb 2.32E-05 g Ni 0.000228 g Nitrogen 0.023711 g P 0.003154 g suspended substances 0.230015 g Zn 0.002066 g Final waste flows solid waste 1.69622 kg
Table 0-6: Steel cold rolled coil IISI
Stainless Steel 304 2B IISI [8] Products Stainless Steel 304 2B IISI 1000 kg Resources chromium (ore) 175.2 kg coal FAL 1129.6 kg dolomite 49.4 kg iron (ore) 277 kg lignite 58.7 kg limestone 210.7 kg manganese (ore) 19.1 kg molybdenum (ore) 1.1 kg natural gas FAL 266.8 kg nickel (ore) 57.9 kg crude oil FAL 217.3 kg steel scrap 774 kg water (process) 62846.6 kg water 17700.7 kg energy from hydro power 2038.6 MJ Emissions to air CO2 (fossil) 6100000 g CO 10047.6 g Cr 91.9 g Cr (VI) 0.1 g dioxin (TEQ) 0.000009 g

108
Mo 5.4 g Ni 77.9 g NOx (as NO2) 14209.1 g particulates (unspecified) 6936.5 g SOx (as SO2) 46415.1 g silicates 362.5 g Emissions to water Acid as H+ 83.5 g Al 22.7 g NH4+ 54 g NH3 (as N) 50 g Cd 0.2 g Cl- 6884.4 g Cr 11.2 g Cr (VI) 8.1 g COD 1756.8 g Cu 0.6 g fluoride ions 125.6 g hydrocarbons (misc) 65.5 g Fe 147 g Pb 1.9 g Mn 6.7 g Mo 2.5 g Ni 8.5 g nitrate 3261.4 g nitrogen 3984.9 g P 4.7 g S 1498.2 g Sn 0.3 g Zn 3.5 g Final waste flows solid waste 3356.4 kg steel waste 169.1 kg
Table 0-7: Stainless Steel 304 2B IISI

109
Stainless Steel 316 2B IISI [8] Products Stainless Steel 316 2B IISI 1000 kg Resources chromium (ore) 170.4 kg coal FAL 1187 kg dolomite 51.9 kg iron (ore) 274.8 kg lignite 52.3 kg limestone 269.8 kg manganese (ore) 19.5 kg molybdenum (ore) 29.5 kg natural gas FAL 325.1 kg nickel (ore) 97.7 kg crude oil FAL 277.1 kg steel scrap 769.2 kg water (process) 110808.3 kg water 15563.9 kg energy from hydro power 3452.2 MJ energy (undef.) 155.4 MJ Emissions to air CO2 (fossil) 6500000 g CO 11628.9 g Cr 108.1 g Cr (VI) 0.1 g dioxin (TEQ) 0.000018 g Mo 14.2 g Ni 129.3 g NOx (as NO2) 16468.5 g particulates (unspecified) 9548.9 g SOx (as SO2) 70939.6 g silicates 399.2 g Emissions to water Acid as H+ 83.1 g Al 28.8 g NH4+ 53.5 g NH3 (as N) 50 g Cd 0.1 g Cl- 7366.4 g Cr 8.9 g Cr (VI) 10.6 g COD 1871.9 g Cu 0.7 g fluoride ions 114.1 g

110
hydrocarbons (misc) 78.5 g Fe 123.6 g Pb 2.7 g Mn 8.4 g Mo 5.9 g Ni 11.6 g nitrate 2805.7 g nitrogen 10036.6 g P 2.4 g S 1623.1 g Sn 0.3 g Zn 3 g Final waste flows solid waste 14461 kg steel waste 158.9 kg
Table 0-8: Stainless Steel 316 2B IISI
Graphite PureCell™ system [15] Products Graphite 3784 lb Resources energy from hydro power 0.0144 TJ energy from coal 0.019 TJ energy from natural gas 0.02 TJ energy from fossil 0.005 TJ energy from oil 0.006 TJ Emissions to air CO2 (fossil) 5.01 ton CO 0.487 ton SO2 0.018 ton NOx 0.013 ton VOC 0.029 ton particulates (PM10) 0.004 ton Final waste flows toxic waste 3.07 kg
Table 0-9: Graphite PureCell™ system
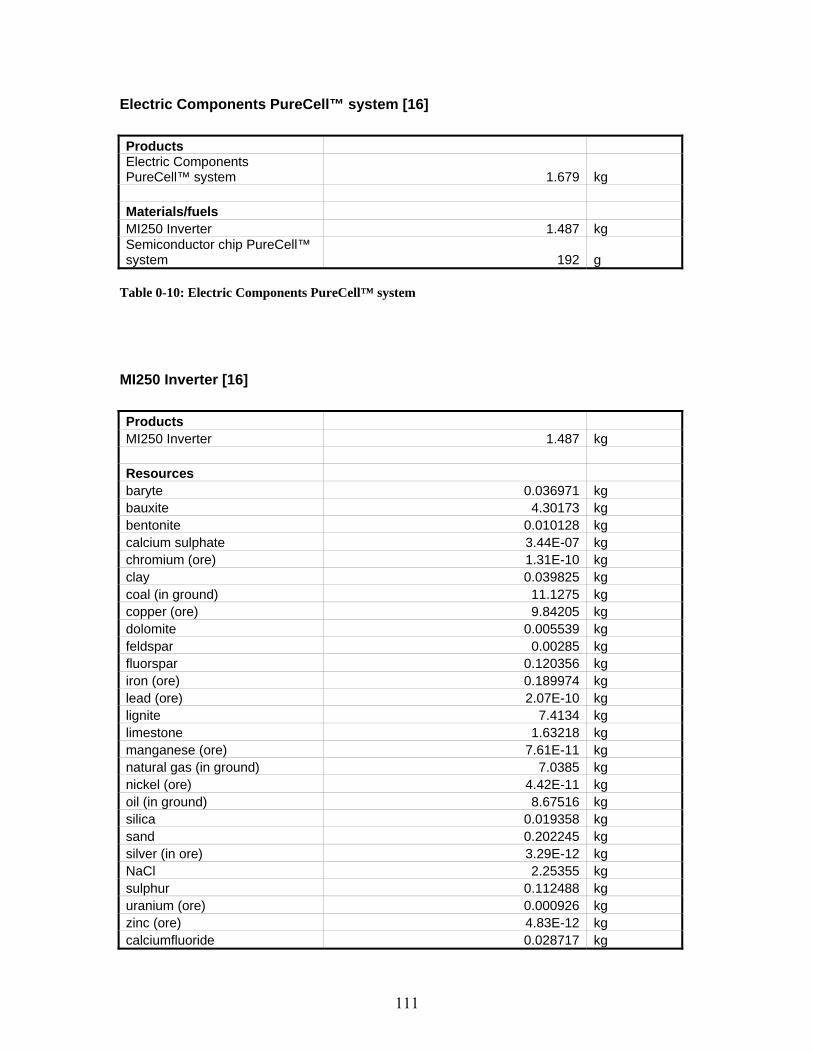
111
Electric Components PureCell™ system [16] Products Electric Components PureCell™ system 1.679 kg Materials/fuels MI250 Inverter 1.487 kg Semiconductor chip PureCell™ system 192 g
Table 0-10: Electric Components PureCell™ system
MI250 Inverter [16] Products MI250 Inverter 1.487 kg Resources baryte 0.036971 kg bauxite 4.30173 kg bentonite 0.010128 kg calcium sulphate 3.44E-07 kg chromium (ore) 1.31E-10 kg clay 0.039825 kg coal (in ground) 11.1275 kg copper (ore) 9.84205 kg dolomite 0.005539 kg feldspar 0.00285 kg fluorspar 0.120356 kg iron (ore) 0.189974 kg lead (ore) 2.07E-10 kg lignite 7.4134 kg limestone 1.63218 kg manganese (ore) 7.61E-11 kg natural gas (in ground) 7.0385 kg nickel (ore) 4.42E-11 kg oil (in ground) 8.67516 kg silica 0.019358 kg sand 0.202245 kg silver (in ore) 3.29E-12 kg NaCl 2.25355 kg sulphur 0.112488 kg uranium (ore) 0.000926 kg zinc (ore) 4.83E-12 kg calciumfluoride 0.028717 kg

112
glass cullet 0.007194 kg scrap, external 3.22E-06 kg water 1125 kg wood 0.260316 kg SO2 0.022159 kg Materials/fuels Gravel ETH U PureCell™ system 4.70E-05 kg Kaolin B250 0.018211 kg Iron sulfate ETH U 5.21647 kg Iron 0.65073 g Explosives ETH U 9.61E-06 kg Glass fibre I PureCell™ system 0.01 kg Epoxy resin I 0.1 kg Emissions to air acetaldehyde 5.50E-05 g acetic acid 0.000222 g acetone 5.50E-05 g ethyne 2.82E-07 g aldehydes 0.00145 g alkanes 3.22454 g alkenes 1.14E-05 g Al 5.47E-06 g ammonia 0.230425 g Sb 1.19E-09 g Aromatic HC 0.062011 g As 0.001778 g Ba 9.82E-05 g benzaldehyde 2.00E-13 g benzene 0.1816 g benzo(a)pyrene 1.29E-08 g Be 2.09E-06 g B 5.37E-07 g Br 1.05E-07 g butane 0.001559 g butene 1.81E-05 g Cd 0.000319 g Ca 3.22E-05 g CO2 (fossil) 74535.6 g CO 95.5524 g CxHy halogenated 0.45223 g Cl2 8.26E-06 g Cr (III) 6.18E-06 g Cr 1.24E-08 g cobalt 1.27E-05 g Cu 0.140897 g cyanides 1.95E-09 g

113
dioxin (TEQ) 9.99E-12 g ethane 0.038142 g ethanol 0.00011 g ethylbenzene 1.81E-05 g ethylene 0.04406 g fluoride 0.931602 g formaldehyde 0.000167 g CxHy halogenated 5.94E-20 g HALON-1301 0.002857 g heptane 0.00018 g hexane 0.000361 g hydrocarbons (misc) 116.1 g H2 2.62581 g HCl 6.05563 g HF 0.675021 g H2S 0.14532 g I 2.68E-08 g Fe 0.294527 g La 1.71E-09 g Pb 0.158428 g Mg 1.94E-06 g Mn 0.000353 g mercaptans 6.42E-08 g Hg 0.000121 g metals 0.312141 g methane 168.104 g methanol 0.000187 g Mo 6.17E-06 g Ni 0.009713 g NOx (as NO2) 190.1 g N2O 1.36447 g organic substances 2.68641 g particulates (unspecified) 178.283 g pentane 0.00092 g phenol 1.53E-12 g P 4.86E-08 g P2O5 3.25E-11 g PAH's 0.04511 g K 9.98E-07 g propane 0.003224 g propionaldehyde 5.50E-13 g propionic acid 6.89E-10 g propylene 3.64E-05 g Sc 5.80E-10 g Se 4.66E-06 g Si 1.32646 g Na 0.000289 g Sr 1.06E-07 g SOx (as SO2) 1627.35 g

114
tar 4.32E-11 g Tl 5.31E-10 g Th 1.09E-09 g Sn 3.42E-10 g Ti 1.90E-07 g toluene 0.000124 g U 1.30E-06 g V 0.001685 g xylene 7.23E-05 g Zn 1.34101 g Zr 8.13E-10 g Emissions to water Acid as H+ 47.9719 g alkanes 0.000129 g alkenes 1.19E-05 g Al 15.4362 g NH3 (as N) 0.575399 g AOX 0.001236 g hydrocarbons (misc) 0.061227 g As 0.292035 g Ba 2.20988 g baryte 7.001 g benzene 0.041318 g BOD 3.2684 g B 1.61E-05 g Cd 0.000223 g calcium ions 24.7978 g Cs 2.29E-07 g Cl- 464.332 g CxHy chloro 2.10E-11 g Cr (III) 9.10E-08 g Cr 0.028041 g Cr (VI) 1.85E-05 g Co 5.62E-09 g COD 20.7878 g Cu 0.075887 g cyanide 0.004744 g dissolved substances 7.40714 g DOC 0.088207 g ethyl benzene 2.37E-05 g fluoride ions 0.104275 g formaldehyde 2.66E-13 g hexachloroethane 3.70E-17 g hydrocarbons (misc) 9.75E-06 g inorganic general 37.4785 g I 9.89E-05 g Fe 16.3057 g Pb 0.088786 g

115
Mg 10.4668 g Mn 5.42E-05 g Hg 0.001074 g metallic ions 1.41459 g dichloromethane 6.00E-08 g Mo 4.11E-07 g Ni 0.014022 g nitrate 2.99091 g nitrite 0.019485 g N-tot 0.07837 g oil 7.9478 g dissolved organics 0.001922 g other organics 0.099081 g phenol 0.000129 g phenol 0.049571 g phenols 6.97E-05 g phosphate 1.0088 g P 4.11E-06 g P2O5 9.69E-10 g PAH's 0.02025 g K 5.15672 g salts 25.5652 g fats/oils 1.56528 g Se 4.11E-07 g SiO2 2.15E-08 g Ag 5.93E-07 g Na 143.741 g Sr 2.00006 g sulphates 147.378 g sulphide 0.010452 g SO3 0.010718 g S 5.58E-10 g H2SO4 0.930463 g SO3 1.03E-10 g suspended substances 49.1142 g tetrachloroethene 9.03E-14 g Ti 2.26E-07 g TOC 9.09628 g toluene 0.00853 g 1,1,1-trichloroethane 2.04E-13 g trichloroethene 5.60E-12 g triethylene glycol 6.91E-06 g V 4.11E-07 g VOC as C 0.000346 g waste water (vol) 3.51 l xylene 0.00093 g Zn 0.164672 g Emissions to soil
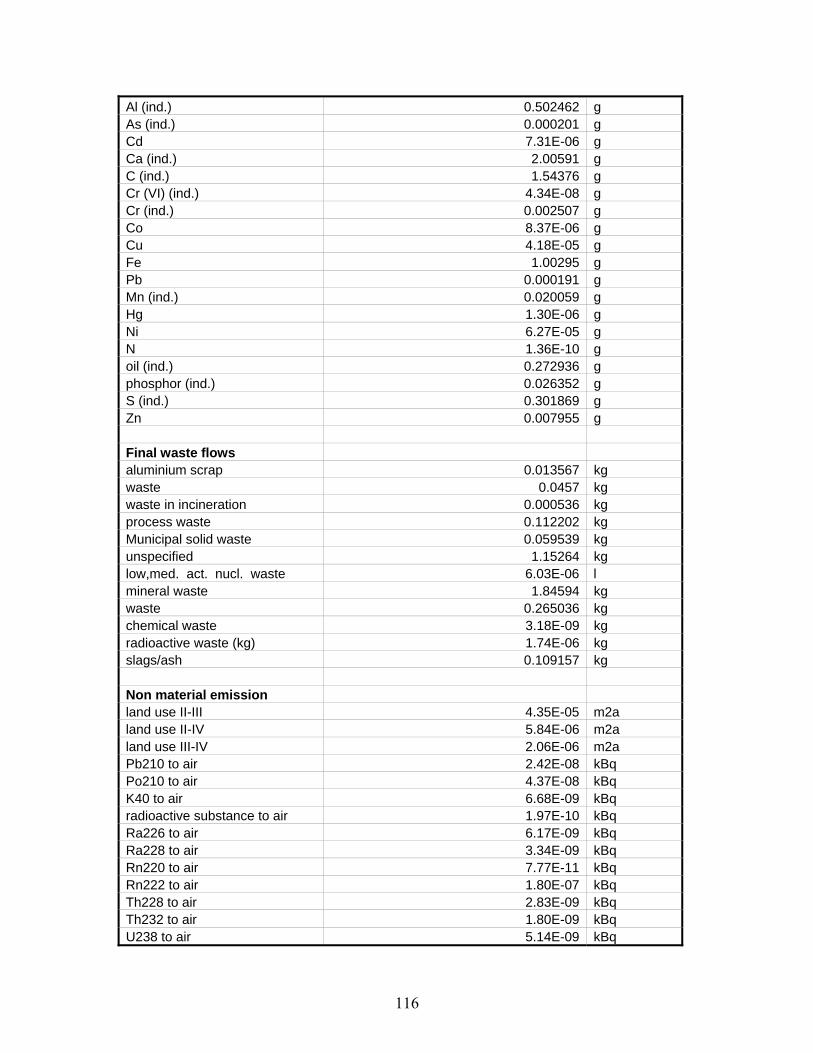
116
Al (ind.) 0.502462 g As (ind.) 0.000201 g Cd 7.31E-06 g Ca (ind.) 2.00591 g C (ind.) 1.54376 g Cr (VI) (ind.) 4.34E-08 g Cr (ind.) 0.002507 g Co 8.37E-06 g Cu 4.18E-05 g Fe 1.00295 g Pb 0.000191 g Mn (ind.) 0.020059 g Hg 1.30E-06 g Ni 6.27E-05 g N 1.36E-10 g oil (ind.) 0.272936 g phosphor (ind.) 0.026352 g S (ind.) 0.301869 g Zn 0.007955 g Final waste flows aluminium scrap 0.013567 kg waste 0.0457 kg waste in incineration 0.000536 kg process waste 0.112202 kg Municipal solid waste 0.059539 kg unspecified 1.15264 kg low,med. act. nucl. waste 6.03E-06 l mineral waste 1.84594 kg waste 0.265036 kg chemical waste 3.18E-09 kg radioactive waste (kg) 1.74E-06 kg slags/ash 0.109157 kg Non material emission land use II-III 4.35E-05 m2a land use II-IV 5.84E-06 m2a land use III-IV 2.06E-06 m2a Pb210 to air 2.42E-08 kBq Po210 to air 4.37E-08 kBq K40 to air 6.68E-09 kBq radioactive substance to air 1.97E-10 kBq Ra226 to air 6.17E-09 kBq Ra228 to air 3.34E-09 kBq Rn220 to air 7.77E-11 kBq Rn222 to air 1.80E-07 kBq Th228 to air 2.83E-09 kBq Th232 to air 1.80E-09 kBq U238 to air 5.14E-09 kBq

117
radioactive substance to water 1.82E-12 kBq Ra224 to water 4.95E-05 kBq Ra226 to water 9.89E-05 kBq Ra228 to water 9.89E-05 kBq Th228 to water 0.000198 kBq
Table 0-11: MI250 Inverter
Semiconductor chip PureCell™ system [17] Products Semiconductor chip PureCell™ system 2 g Materials/fuels Semiconductor wafer PureCell™ system 0.14 g Copper ETH U PureCell™ system 1.2 g Epoxy resin I 0.7 g Copper ETH U PureCell™ system8 29 g Epoxy resin I 17 g Electricity/heat Electricity avg. kWh USA 0.54 kWh Waste to treatment copper waste 29 g plastic production waste 17 g
Table 0-12: Semiconductor chip PureCell™ system
Semiconductor wafer PureCell™ system [17] Products Semiconductor wafer PureCell™ system 0.088 g Resources water (process) 20 kg
8 Semiconductor chip packaging: copper input resulting in scrap

118
Materials/fuels Silicon wafer PureCell™ system 0.16 g Chemicals inorganic ETH U PureCell™ system 0.0093 g Ammonia ETH U 0.012 g Chlorine ETH U 0.0048 g HCl ETH U 0.005 g HF ETH U 0.00095 g Chemicals inorganic ETH U PureCell™ system 0.20725 g HF ETH U 2.84 g Phosphoric acid ETH U PureCell™ system 2.07 g HF ETH U 0.13 g Nitric acid ETH U 0.83 g Sulphuric acid B250 7.5 g HCl ETH U 0.91 g Ammonia ETH U 0.22 g NaOH ETH U, PureCell™ system 0.33 g Chemicals inorganic ETH U PureCell™ system 14.2 g NaOH ETH U, PureCell™ system 7.6 g Electricity/heat Electricity avg. kWh USA 1.5 kWh Heat from nat. gas FAL 1 MJ Emissions to air HF 2.97 g HCl 0.91 g phosphoric acid 2.07 g ammonia 0.23 g Cl2 0.0048 g HNO3 0.83 g H2SO4 7.5 g Emissions to water inorganic general 14.4 g Final waste flows water 17 kg solid waste 7.8 kg
Table 0-13: Semiconductor wafer PureCell™ system

119
Silicon wafer PureCell™ system [17] Products Silicon wafer PureCell™ system 1 kg Materials/fuels Silicon I, PureCell™ system 9.4 kg Electricity/heat Electricity avg. kWh USA 2100 kWh
Table 0-14: Silicon wafer PureCell™ system
Electric motor PureCell™ system [11] Products Electric motor PureCell™ system9 8.31 kg Resources resin glue 0.02 kg Materials/fuels Steel cold rolled coil IISI 5.35 kg Aluminum (primary) produced in the USA 0.14 kg Aluminium 100% recycled ETH U PureCell™ system 0.14 kg G-AlSi8Cu3 (380) I 1.45 kg Copper ETH U PureCell™ system 1.13 kg Wood board ETH U PureCell™ system 0.07 kg Paint ETH U, PureCell™ system 0.01 kg Electricity/heat Electricity avg. kWh USA 456 MJ
Table 0-15: Electric motor PureCell™ system
9 Data for production of a 1 hp motor.
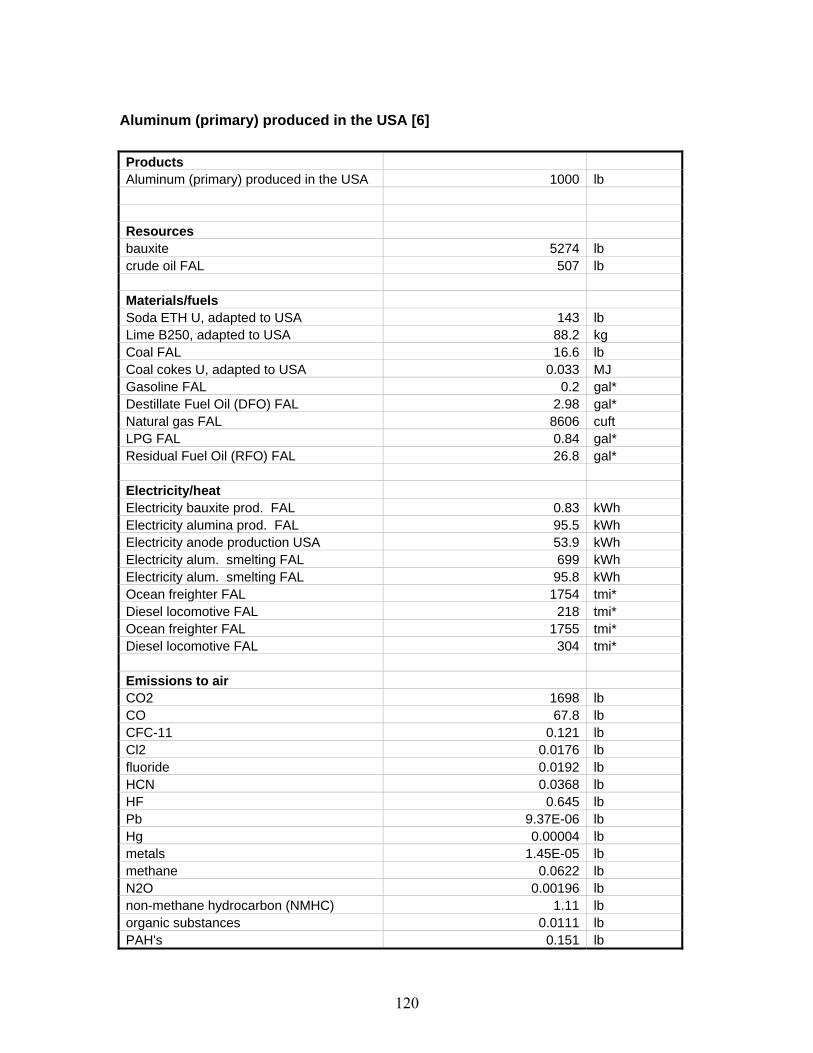
120
Aluminum (primary) produced in the USA [6] Products Aluminum (primary) produced in the USA 1000 lb Resources bauxite 5274 lb crude oil FAL 507 lb Materials/fuels Soda ETH U, adapted to USA 143 lb Lime B250, adapted to USA 88.2 kg Coal FAL 16.6 lb Coal cokes U, adapted to USA 0.033 MJ Gasoline FAL 0.2 gal* Destillate Fuel Oil (DFO) FAL 2.98 gal* Natural gas FAL 8606 cuft LPG FAL 0.84 gal* Residual Fuel Oil (RFO) FAL 26.8 gal* Electricity/heat Electricity bauxite prod. FAL 0.83 kWh Electricity alumina prod. FAL 95.5 kWh Electricity anode production USA 53.9 kWh Electricity alum. smelting FAL 699 kWh Electricity alum. smelting FAL 95.8 kWh Ocean freighter FAL 1754 tmi* Diesel locomotive FAL 218 tmi* Ocean freighter FAL 1755 tmi* Diesel locomotive FAL 304 tmi* Emissions to air CO2 1698 lb CO 67.8 lb CFC-11 0.121 lb Cl2 0.0176 lb fluoride 0.0192 lb HCN 0.0368 lb HF 0.645 lb Pb 9.37E-06 lb Hg 0.00004 lb metals 1.45E-05 lb methane 0.0622 lb N2O 0.00196 lb non-methane hydrocarbon (NMHC) 1.11 lb organic substances 0.0111 lb PAH's 0.151 lb
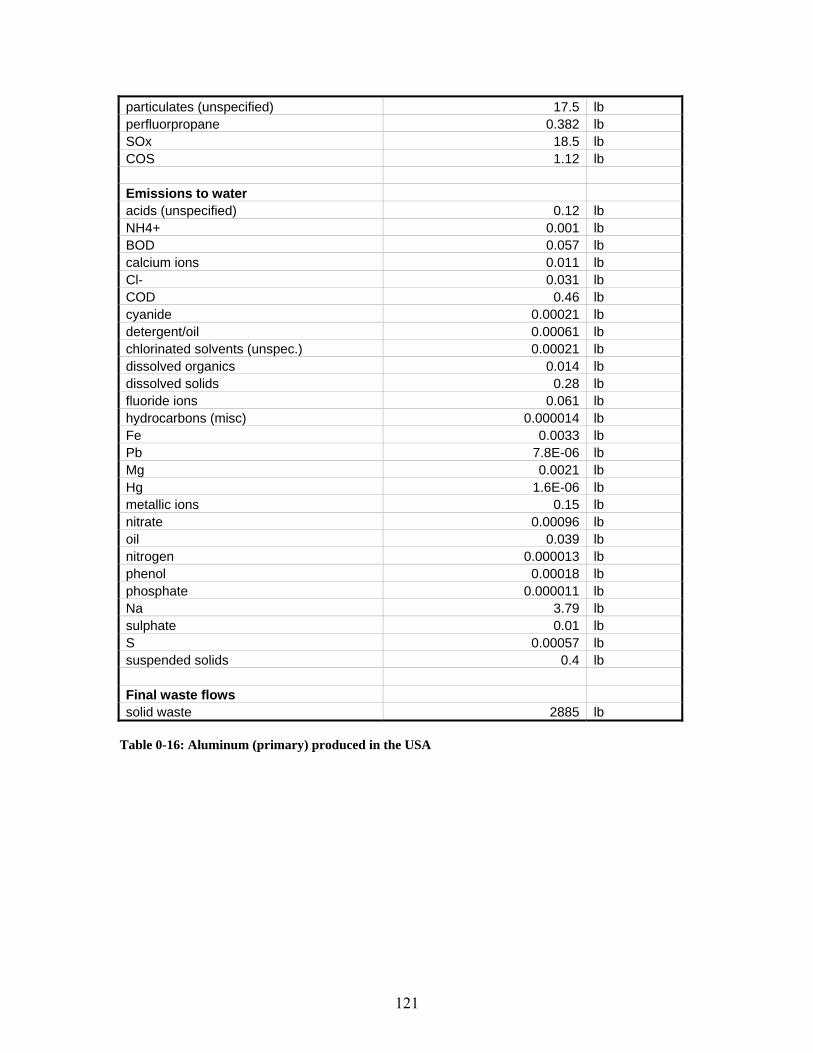
121
particulates (unspecified) 17.5 lb perfluorpropane 0.382 lb SOx 18.5 lb COS 1.12 lb Emissions to water acids (unspecified) 0.12 lb NH4+ 0.001 lb BOD 0.057 lb calcium ions 0.011 lb Cl- 0.031 lb COD 0.46 lb cyanide 0.00021 lb detergent/oil 0.00061 lb chlorinated solvents (unspec.) 0.00021 lb dissolved organics 0.014 lb dissolved solids 0.28 lb fluoride ions 0.061 lb hydrocarbons (misc) 0.000014 lb Fe 0.0033 lb Pb 7.8E-06 lb Mg 0.0021 lb Hg 1.6E-06 lb metallic ions 0.15 lb nitrate 0.00096 lb oil 0.039 lb nitrogen 0.000013 lb phenol 0.00018 lb phosphate 0.000011 lb Na 3.79 lb sulphate 0.01 lb S 0.00057 lb suspended solids 0.4 lb Final waste flows solid waste 2885 lb
Table 0-16: Aluminum (primary) produced in the USA

122
Platinum recycled PureCell™ system [13] Products Platinum recycled PureCell™ system10 0.98 kg Resources energy (undef.) 43700 MJ Emissions to air SO2 0.207 ton
Table 0-17: Platinum recycled PureCell™ system
Activated carbon PureCell™ system [20] Products Activated carbon PureCell™ system 650 ton Resources coconuts 2000 ton water 1800 ton Materials/fuels Electricity avg. kWh USA 792 MJ Nat. gas into industr. boilers 19069917 cuft
Table 0-18: Activated carbon PureCell™ system
10 This process represents the energy used and SO2 emitted in the platinum recycling process. In this way platinum becomes a 98% 'lease' material rather than an input material.

123
Appendix E: PureCell™ System Life Cycle CO2-equivalent Emissions and Energy Use A disadvantage of the Eco-indicator 99 impact assessment method is that the midpoint results of the characterization step are hidden. The 2CO -equivalent emissions are therefore calculated using the PureCell™ system inventory data. For the 2CO -equivalent emissions only 2CO and methane are taken into account. This assumption was validated by using other SimaPro impact assessment methods, which showed that 2CO -equivalent emissions for the PureCell™ system are practically entirely made up of 2CO and methane emissions. The GWP (Global Warming Potential) characterization factor used dNote_Jaap.enl" path="H:\EndNote_Jaap.enl">EndNote_Jaap.enl<co-indicator 99 method. Table 0-19 shows the 2CO -equivalent emissions (total as well as per kWh) for the PureCell™ system life cycle and for the three life cycle phases. The emissions per kWh are calculated by dividing the total emissions by 17,000,000. This is the number of kWh produced by the PureCell™ system over an 85,000 hrs lifetime. Total (kg) per kWh (g/kWh) Life cycle 11,610,992 683 Manufacturing phase 197,658 11.6 Use phase 11,412,900 671 End-of-life phase 434 0.03
Table 0-19: PureCell™ system CO2-equivalent emissions The energy use over the PureCell™ system life cycle is also hidden in the Eco-indicator 99 method. The three impact assessment methods in SimaPro that do show the energy use are Eco-indicator 95, CML 1992 and Ecopoints 97. All three methods show the exact same numbers for PureCell™ system energy use and they are therefore assumed to be consistent with the Eco-indicator 99 method as well. Table 0-20 shows the energy use (total as well as per kWh) for the PureCell™ system life cycle and for the three life cycle phases. MJ LHV means that the energy use is calculated with the lower heating values of the fuels used. Total (MJ LHV) per kWh (MJ LHV) Life cycle 2.21E+08 13.0 Manufacturing phase 2.70E+07 0.16 Use phase 2.18E+08 12.8 End-of-life phase -6.22E+05 -0.04
Table 0-20: PureCell™ system energy use

124
Appendix F: UTC Power South Windsor Electricity Mix The electricity used at the UTC Power facility in South Windsor, Connecticut, is modeled in SimaPro as ‘UTC South Windsor electricity mix’. The electric utility in Connecticut is NPCC, Northeast Power Coordinating Council. The grid electricity mix modeled in SimaPro is based on the Figure 0-1 below, showing the prospect for the grid in 2010.
Figure 0-1: NPCC US projected capacity fuel mix – summer 2010 The percentage described as dual fuel is assumed to come from natural gas, since Connecticut (and other states in New England) relies primarily on natural gas.

125
Appendix G: Calculations for the PureCell™ System Hydrogen Consumption In this appendix it is calculated how much hydrogen the PureCell™ system uses per hour, or in other words, how much hydrogen the PureCell™ system requires producing 200 kWh of electricity. The calculations are based on the electrical efficiency of the PureCell™ system, which is 40% [21]. The definition of electrical efficiency is:
f
el -.
h-
fuel of moleper producedenergy electrical
Δ=η [35],
where fh−
Δ− is the enthalpy of formation, which is in this case the LHV (lower heating value) of hydrogen. The electrical efficiency is based on the LHV of hydrogen. The LHV of hydrogen is molkJ83.241− [35]. With an electrical efficiency of 40% and a hydrogen LHV of molkJ83.241− , it can be calculated that the electrical energy produced per mole of hydrogen is
molkJmolkJ /732.96/83.241*4.0 = . With this number the required moles of hydrogen per hour can be calculated:
hrmol
molkWh
kW /2.7443
3600732.96200
=⎟⎠⎞
⎜⎝⎛
.
Given that the molar mass of hydrogen ( 2H ) is 2.02 u this is equal to
hrkguhrmol /035.1502.2*/2.7443 = . This number is used in SimaPro to model the hourly hydrogen consumption of the PureCell™ system. Another way to determine the consumption of hydrogen is to use stoichiometric calculations. In this way the hydrogen output of the steam reforming process can be calculated. In Chapter 4 - Inventory Analysis the steam reforming and low shift reactions were used to calculate the 2CO emission rate. The steam reforming and low shift reactions are:
224 3HCOOHCH +→+ (steam reforming)
222 HCOOHCO +→+ (shift reaction) And this results in the following overall reaction:
2224 42 HCOOHCH +→+

126
Based on the assumption that natural gas is 100% 4CH it was calculated that the current PureCell™ system consumes hrkg /75.40 natural gas. This number was used to calculate a 2CO emission rate of hrkg /2.112 . The overall steam reforming reaction shows that four moles of 2H are produced for every mole of 2CO . Given that the molar mass of 2CO is 44 u and the molar mass of 2H is 2 u it can be calculated that
hrkghrkg /4.20/2.112*44
2*4=⎟
⎠⎞
⎜⎝⎛
of hydrogen is produced by steam reforming of natural gas in the PureCell™ system. If this number is used to check the number obtained from the calculations based on the electrical efficiency of the fuel cell it becomes clear that the latter is significantly lower ( hrkg /035.15 ). The main cause for this is most probably the assumption that natural gas is 100% 4CH . In reality, natural gas also contains small amounts of nitrogen and 2CO , which means that less hydrogen can be formed per kg of natural gas than is assumed here. Another cause for the deficit between the numbers calculated above is the idealized assumption that four moles of 2H are formed for every mole of 4CH . The shift reaction as given above however is an equilibrium reaction which is never shifted completely to the right, which means that there is never a 100% overall reaction as shown above. In other words, the assumption that all carbon is emitted as 2CO leads to an overestimation of the amount of produced hydrogen. Due to the fact that the shift reaction is never completely shifted to the right, a small amount of carbon will be emitted as CO . This also means that less hydrogen can be formed per kg of natural gas than is assumed here. The calculations for the hydrogen production rate of the steam reforming process and for the hydrogen consumption rate of the fuel cell stack can be used to calculate the efficiency of the steam reforming process:
%7.734.20
035.15==SMRη
In the SimaPro model of the PureCell™ system using renewable hydrogen the hydrogen consumption rate of hrkg /035.15 is used, as shown in Table 6-2.