Embed Size (px)
Citation preview

30th International North Sea Flow Measurement Workshop 23 – 26 October 2012
1
A Liquid Condensate ppm Water Analyzer – New Technology for Monitoring Coalescing Processes
Bentley Scott, Phase Dynamics, Inc. Enrique Capone, Phase Dynamics, Inc.
Graham Ison, Woodside Energy Joel Choy, Woodside Energy
ABSTRACT
Measurement of water percentage during gas well condensate water removal by coalescing filters is a key to prevent hydrates from forming in offshore pipelines. Although various methods of measurement have been investigated, the uncertainty of the water percentage measurement at ppm levels is large even with manual sampling. The challenge of measuring the water percentage of a flowing liquid condensate stream cannot be solved using prior technologies as they are either compromised by water slugs or the sensitivity to ppm levels exceeds even the temperature compensation required to achieve these levels of resolution. Sampling and Karl Fisher titration are typically used by site operators to verify ppm levels of water percentage. These techniques have been proven to have accuracy limitations between 100 and 500 ppm levels of moisture in condensate making practical verification of the analyzer performance challenging. This prevents assessment and control of dehydration facilities on offshore platforms where it has become mandatory to control the water level before sub-sea lines return to onshore facilities. Discussion and lessons learned from testing on an offshore platform in Australia will be presented. A new method will be described which allows for reproducible real time measurements at the ppm level. The application of this method on offshore facilities will be described along with the patented technology involved. Discussion of real world issues in calibration and verification will be included. 1 INTRODUCTION The Woodside Angel Gas and Condensate Project lie 115km off Western Australia, inshore from the North Rankin and Goodwyn fields. Angel's development consisted of drilling three subsea production wells, installing an unmanned processing platform and exporting the gas and condensate through a new pipeline and then to the existing trunkline. The Angel development is a new offshore processing platform which is controlled and powered remotely from the existing North Rankin A platform located 50km away. Angel is designed as a Not Normally Manned facility, a Woodside first, including gas dehydration and condensate dewatering processing facilities. Angel’s contribution is about 800 mmscf/day of gas and 50,000 bpd of condensate. An online water-in-condensate (WIC) analysis is required to minimize the total water from entering the pipeline to effectively eliminate water based corrosion and hydrate formation. Previous methods of measurement have difficulty in handling water in liquid products at parts-per-million (ppm) levels. The issues include lack of sensitivity at this level, inability to handle a water slug and the complexity of some systems which are practically a laboratory in a box. Previous methods include: sampling with laboratory titration, turbidity, flashing to gas and measuring with chilled mirror or dew point analyzer. This latest method uses existing activated aluminum oxide with the physics of measurement implemented using a microwave cross section measurement. Initial testing was done at the Goodwyn platform and then later at the Angel platform. At both sites a manual sample was obtained through a by pass ½” tubing line and then processed in a laboratory using a CA-21 Mitsubishi Moisture Meter. This paper will describe the new technology and test results.

30th International North Sea Flow Measurement Workshop 23 – 26 October 2012
2
2 PPM LEVEL MEASUREMENT ISSUES Measuring ppm levels in liquid products has not been one with many choices in the past. This is mostly due to the unreliability of existing methods of measurement. One of the most used is the capacitance sensor with a metal oxide of aluminum made into a dielectric sandwich between two electrodes. This technique will be further discussed as the material and basic physics forms the basis for the new measurement. Other methods such as membranes, acoustical wave devices and optical systems each have their issues with liquids. Cloud point or turbidity is also used but is complicated by contaminants and solubility versus temperature. Turbidity is only applicable to free water in petroleum products. The solubility of water in condensate is typically above 300 ppm. Other measurement methods include obtaining samples from an in-line sampler and using laboratory titration to obtain results. The lab results are highly dependent upon methods and in many cases false readings were obtained from atmospheric moisture entry into the sample apparatus. The laboratory sample at Woodside was 4 ml of liquid. A 100 ppm volume of water represents 0.4 x10⁻⁶ liter of water in 4 ml. As condensate flashes at atmospheric conditions and cools the surface of the connection to the process, atmospheric condensation can easily be deposited on the surfaces of the mating connections. 2.1 Typical Capacitance ppm Sensor An aluminum metal substrate is formed, chemically etched and a very thin layer of aluminum oxide is created. Then a very thin (porous) layer of deposited gold is formed on the top to form the second electrode with the aluminum base being the first electrode. These two electrodes form a capacitor and the ambient moisture is adsorbed and de-adsorbed by the aluminum oxide. Water is of high dielectric constant and therefore is seen as an increase in the capacitance or impedance. These tend to offer poor long term stability as the thin film oxide continues to change with time and contamination. Normally aluminum oxide moisture sensors must be re-calibrated regularly. [1] They are also easily damaged by high moisture levels as these are either trapped under the permeable deposit of gold or it further oxides the aluminum substrate. In addition any electrically conductive contaminant will create errors in measurement. Any mechanical distortion will also impact measurement. A typical sensor structure is given in Figure 1. [2]
Figure 1. Typical Aluminum Oxide Dew Point System These systems work very well in a natural gas environment as the water percentage does not typically come in slugs or high moisture content. Although some vendors claim to use these in liquid service, they will not last long. There are other structures and methods using aluminum oxide which will not be covered in this paper as they do not pertain to ppm moisture in liquid measurement. 2.2 The New Approach Aluminum oxide has unique properties that allow it to adsorb and de-adsorb moisture with respect to the ambient and this has made it effective in dew point sensors. In order to overcome the issues of trapped moisture under the metallization and other technical issues a
Aluminum Substrate
Aluminum Oxide Layer
Gold Metallization

30th International North Sea Flow Measurement Workshop 23 – 26 October 2012
3
new approach was taken. The aluminum oxide is utilized as a bead structure and placed into a microwave system where the energy is transmitted throughout the cross sectional area. There is no metallization to capture the moisture and the sensitivity and response time are dependent upon bead size, flow rate and wavelength. Figure 2 shows an outline of the basic system with the round particles being aluminum oxide beads with a sinusoid microwave signal applied across the bed.
Figure 2. Aluminum Oxide Microwave System 2.3 The Physics Behind Aluminum Oxide Van der Waals forces are attractive or repulsive forces between molecules and partially explain the chemistry behind this measurement. Aluminum oxide likes polar molecules such as water and methanol and will actually remove water from its association with hydrocarbons which is typically noted as “solution water.” Therefore this measurement includes any free water plus solution water. The first patent on using Al2O3 for measurement was issued in 1963 to Clifford Stover [3]. It describes how to build and activate the substrate. Although improvements to the structure have been made the basic device has not changed from that time. Additional improvements to the reproducibility were made with a patent in 1984 [4] by using passivation and tempering of the resulting device. Adsorption is a phenomenon of surface attraction which allows the water to be retained or held inside. If you spill a glass of water on your shirt the adsorbed water is held by the fibers. Absorption is the chemical integration of the water into a system. Drink a glass of water and you are absorbing it. Aluminum oxide adsorbs and de-adsorbs the water relative to the ambient moisture content so it is a continuing and reversible process. The system is constantly changing with the ambient moisture until the adsorption into and out of the Al2O3 is equal which is then at equilibrium. Any change in the system pressure, temperature or concentration of the fluid molecules will alter the concentration equilibrium point. It is a preferential process and the more adsorbable molecules such as water will displace and cause the system to de-adsorb other less desirable such as methanol. It is a reversible process which is selective and most important a concentrating process. It is the concentration of the water at ppm levels which provides for the ability to measure minute levels of moisture in the various systems using aluminum oxide. In order to calibrate a system a continuous level of constant ppm levels must be maintained as the aluminum oxide is adsorbing a portion of it until equilibrium is reached. This point will be further investigated in another section. The selection of Al2O3 provides a large active surface area with micro-pores, a non-toxic and insoluble substrate, a hard abrasion resistant material and in bead form is perfect for flowing condensate through. F-1 is a highly porous form of Al2O3 that will adsorb and hold moisture without change in form or properties. High resistance to shock and abrasion are important characteristics in this application as the beads are physically loaded with a piston and spring to maintain packing density. Flow rates of 4-10 liters per minute are typical with a pressure drop of approximately 1 bar is normal. The static adsorptive capacity of F-1 is 15 to 17% of its dry weight at a room humidity of 60%. In this system it occupies approximately 86% of the volume in the measurement area using 1/16 inch (7 mesh) balls.

30th International North Sea Flow Measurement Workshop 23 – 26 October 2012
4
Microwave properties of Al2O3 are excellent as a substrate for building high frequency circuits because it has a zero temperature coefficient versus frequency, a moderate dielectric constant of 9 and low energy loss. Condensate has a low loss and dielectric constant around 2.3. The accumulation of water in the pores of the Al2O3 allow a multiplying effect which provides typical sensitivities of 15 MHz per 200 ppm and this forms the basis of the measurement. 3.0 Initial Testing in Propane and Iso-Butane Original product development took place because of one long term customer using the standard water analyzer in propane and Iso-butane service needed increased sensitivity. A product pipeline was experiencing larger amounts of water over time but unable to identify when it came from during the day. The experimental ppm analyzer was installed at a measurement skid and the results showed the problem existed during the late night hours almost every day. The pipeline was independently owned and product was fed into the stream from another region. Once the problem was identified the solution was found. This analyzer remained in the line after this point for over two years with reproducible performance. Nothing more could be said about uncertainty since there were no laboratory samples and the standard test method at site was to drain the strainer and look for a teaspoon of free water. It was an engineering prototype which proved the concept. Since the original problem was solved the customer decided to not purchase the system. Onshore pipelines have proven to be very reluctant to purchase without a demanding necessity. The good obtained from this test was the proof of concept and long term stability. 4.0 Parallel Testing in Drying Beds During this same time frame a test with a major supplier of gas drying beds was implemented. The purpose of this test was to detect the breakthrough of the moisture front as natural gas was dehydrated in a molecular sieve vertical bed. Instead of placing the beads inside the analyzer the microwave portion was slotted so that when the vessel is filled the analyzer will contain the beads. Molecular sieve is a more aggressive type of dehydrating media that once it adsorbs the moisture it will not release it except at very high temperatures. These systems must be taken off line and regenerated once the moisture front moves through the bed. An analyzer system was placed one third from the top of the bed (dehydration has the gas rising vertically through the bed) to detect when the moisture front comes through to signal it is time for regeneration. Another analyzer system was placed in the lower one third in order to detect when the reverse cycle (very hot gas for regeneration is moved through from the top of the bed) is complete and the molecular sieve is regenerated. By knowing for certain where the moisture front is located with time energy can be saved and bed life can be greatly extended. Data was conclusive and very interesting. The systems remained installed until the next change out of bed material 3 years later. From a product perspective no one wanted to move into the future. 5.0 Initial Condensate Trial Goodwyn Platform in Au stralia A temporary installation was done on the Goodwyn Platform with the sample tubing coming from the outlet of the coalescers then going to a sample station downstream of the analyzer. This sample station was configured as shown in Figure 3 with a photo in Figure 4. 5.1 Sample Station Goodwyn and Angel Platforms There were several problems with this lab sample station as it was easily a water trap due to the low flow rate and vertical orientation with the sample point at the bottom. The top portion was flushed at full flow (approximately 9 liters/minute) for one minute then the bottom portion was flushed with 2 liters/minute which was limited by a restrictor then the sample valves were closed. This flow restrictor was removed after many samples showed no trend of decreasing water ppm which was seen with the analyzer. Lab data began to trend properly after this point although the spread between samples pulled concurrently was large. The sample trap was then removed using quick connects on both sides and then taken to the laboratory. A needle assembly was attached and inserted into the Karl Fisher Titration system (Mettler) with

30th International North Sea Flow Measurement Workshop 23 – 26 October 2012
5
a cap on the opposite end. The first valve was opened slowly to release the sample and then the second was opened after the bubbling was complete. The assembly was then removed from the titrator and then dry nitrogen was blown through the assembly to remove any remaining moisture and sample. One of the controls used during the trial was to ensure samples were taken by the same individual throughout the trial period.
Figure 3. Sample Station Layout Figure 4. Photo of Sample Station
Figure 5. Laboratory KF and Sample Apparatus
30th International North Sea Flow Measurement Workshop 23 – 26 October 2012
6
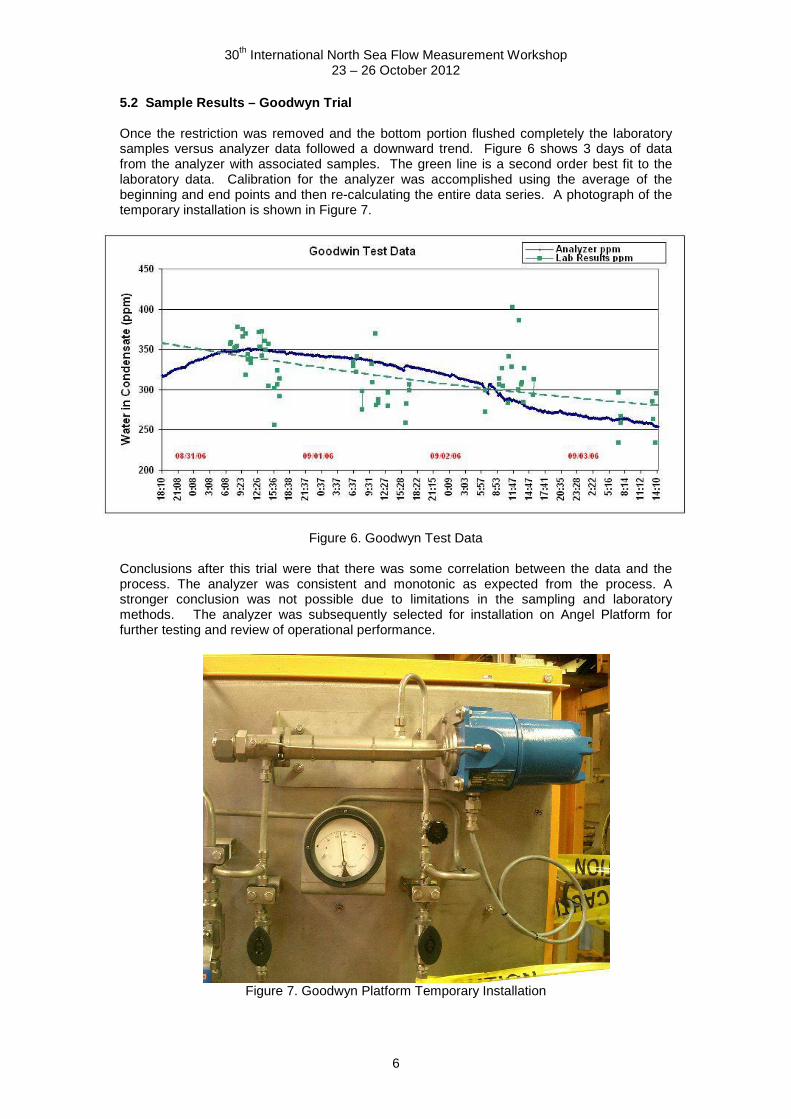
5.2 Sample Results – Goodwyn Trial Once the restriction was removed and the bottom portion flushed completely the laboratory samples versus analyzer data followed a downward trend. Figure 6 shows 3 days of data from the analyzer with associated samples. The green line is a second order best fit to the laboratory data. Calibration for the analyzer was accomplished using the average of the beginning and end points and then re-calculating the entire data series. A photograph of the temporary installation is shown in Figure 7.
Figure 6. Goodwyn Test Data
Conclusions after this trial were that there was some correlation between the data and the process. The analyzer was consistent and monotonic as expected from the process. A stronger conclusion was not possible due to limitations in the sampling and laboratory methods. The analyzer was subsequently selected for installation on Angel Platform for further testing and review of operational performance.
Figure 7. Goodwyn Platform Temporary Installation

30th International North Sea Flow Measurement Workshop 23 – 26 October 2012
7
5.3 Sensitivity to Water The change in frequency for this case was approximately 5 MHz for 100 ppm change in water. The system was operating at 530 MHz as its fundamental frequency which was chosen due to the length of the coaxial active region containing the Al2O3. With expected reproducibility of better than 100 KHz this provides for excellent sensitivity. 5.4 Sensitivity to Density Changes in the Condensat e Density was measured during the various data with variations of 608 kg/m3 to 612 kg/m3 without affecting the baseline ppm measurement. The reason for this is the cross section area is approximately 88% aluminum oxide with a fixed dielectric constant of 9 with the condensate occupying the remainder of the volume with a dielectric constant of 2.2. It has been shown in the past that the affect of a change of 1 kg/m3 in density changes the apparent water percentage 0.03% (300 ppm or 0.0003). [5] In this application the area of the dielectric that is exhibiting the density change (condensate) is 12%. The aluminum oxide is concentrating the moisture by accumulating it in the 88% of the remaining area and its density does not change with temperature as it is a rigid crystalline structure. An estimate of the concentrating factor can be obtained by knowledge of the sensitivity of a standard analyzer with full bore measurement (no beads). It has a sensitivity to free water in oil with a change of 2 MHz / 1% change in water versus 71 KHz / 1 ppmv (710,000,000 Hz / 1%) at the same frequency with the beads for the ppm analyzer. The moisture concentration factor is therefore 710,000,000 / 2,000,000 = 355 times. Using these numbers a rough estimate of the effect could be determined by using these values in equation 1. The result shows a small density effect.
0.0003 / 1kg/m3 x 0.12 / 355 = 0.1 ppmv / 1kg/m3 (1) 5.5 Sensitivity to Liquid Temperature The microwave properties of aluminum oxide are virtually zero as it is a crystalline structure. Since the condensate occupies a small portion of the volume the change of its microwave properties with temperature can be calculated from its apparent change of density. Since this relationship has already been shown to be very small the overall affect of temperature is nil. The first testing at Goodwyn the temperature variation was 29 to 31 deg C and there was no correlation between temperature changes and the apparent parts-per-million of water. Additional discussion of this will be in a following section. Temperature is measured by a RTD in the analyzer fluid section in case even lower ppm resolution is required in the future. 5.5 Stability of Electronics Versus Temperature and Aging Long term stability has been explored in the past and a conservative estimate of the minimum repeatable frequency at 500 MHz is +/- 50 kHz. This is due to the clock resolution and counting methods used in the measurement electronics. Ambient temperature compensation has been accomplished by heating of the microwave component area to 80 deg C at all times. This is higher than the maximum ambient temperature. A sun shield is suggested to further reduce any ambient affects. Some systems have been returned to the factory after 14 years in the field with drift of less than 200 kHz from when they were initially tested. This aging number is difficult to quantify because the 50 ohm standard used to establish the base frequency has changed in vendor and style across the years. Any changes in the style or electrical lengths between vendors would be seen as a frequency change. The worst change seen without other circuit issues has been 500 kHz. This could easily be attributed to operator, 50 ohm loads and methods. 6.0 Installation and Long Term Data From Angel Pla tform The Goodwyn testing was successful enough to proceed with plans to install a system on the Angel Platform. The analyzer was required to monitor and assure the process of dehydration was within set limits. Without this monitoring at Angel it would be possible that undetected water or hydrates would enter the pipeline leading to corrosion and potential consequences to
30th International North Sea Flow Measurement Workshop 23 – 26 October 2012
8
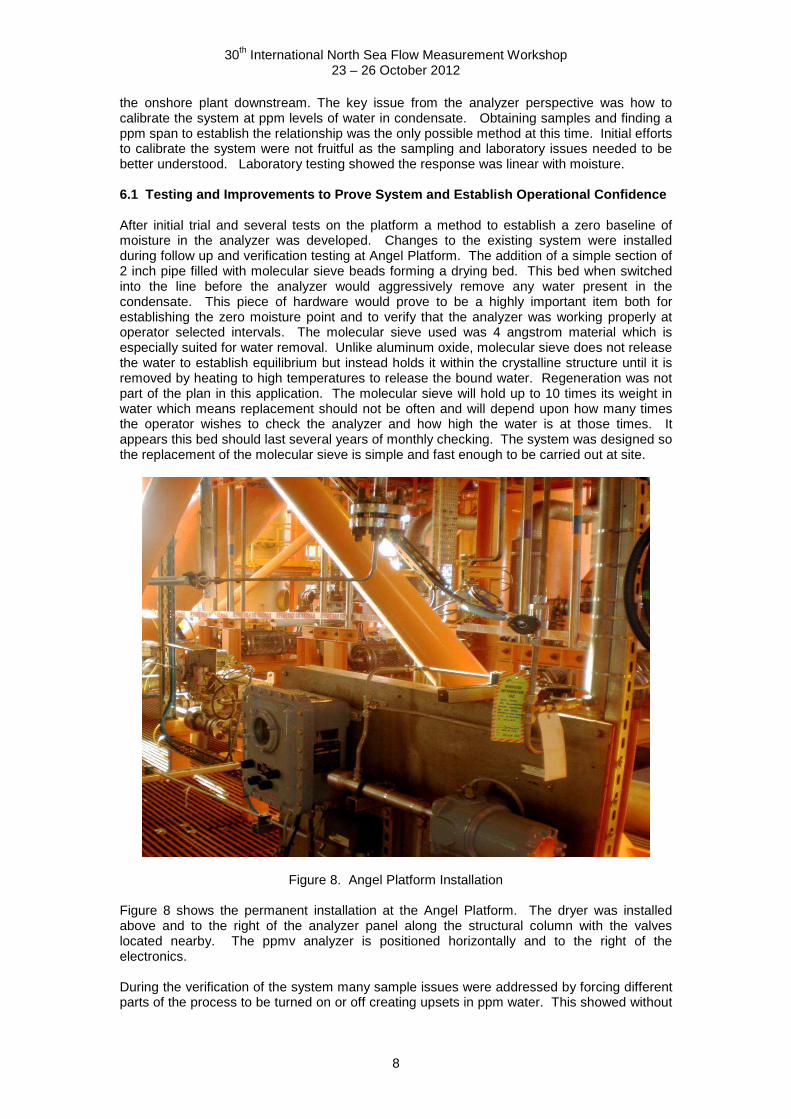
the onshore plant downstream. The key issue from the analyzer perspective was how to calibrate the system at ppm levels of water in condensate. Obtaining samples and finding a ppm span to establish the relationship was the only possible method at this time. Initial efforts to calibrate the system were not fruitful as the sampling and laboratory issues needed to be better understood. Laboratory testing showed the response was linear with moisture. 6.1 Testing and Improvements to Prove System and E stablish Operational Confidence After initial trial and several tests on the platform a method to establish a zero baseline of moisture in the analyzer was developed. Changes to the existing system were installed during follow up and verification testing at Angel Platform. The addition of a simple section of 2 inch pipe filled with molecular sieve beads forming a drying bed. This bed when switched into the line before the analyzer would aggressively remove any water present in the condensate. This piece of hardware would prove to be a highly important item both for establishing the zero moisture point and to verify that the analyzer was working properly at operator selected intervals. The molecular sieve used was 4 angstrom material which is especially suited for water removal. Unlike aluminum oxide, molecular sieve does not release the water to establish equilibrium but instead holds it within the crystalline structure until it is removed by heating to high temperatures to release the bound water. Regeneration was not part of the plan in this application. The molecular sieve will hold up to 10 times its weight in water which means replacement should not be often and will depend upon how many times the operator wishes to check the analyzer and how high the water is at those times. It appears this bed should last several years of monthly checking. The system was designed so the replacement of the molecular sieve is simple and fast enough to be carried out at site.
Figure 8. Angel Platform Installation
Figure 8 shows the permanent installation at the Angel Platform. The dryer was installed above and to the right of the analyzer panel along the structural column with the valves located nearby. The ppmv analyzer is positioned horizontally and to the right of the electronics. During the verification of the system many sample issues were addressed by forcing different parts of the process to be turned on or off creating upsets in ppm water. This showed without

30th International North Sea Flow Measurement Workshop 23 – 26 October 2012
9
question that it was very difficult to match analyzer ppm levels to laboratory results. Lab results often showed spurious increases in values and it was felt that these were most likely due to atmospheric sources rather than true process changes. The sample system was 4-5 ml total and therefore it takes only a minute amount of introduced water to make it non representative of the actual process. 6.2 Process Variations to Prove Results It quickly became obvious that validity of the lab results must be assessed against other process variables such as mass balances and operational experiences. The tubing from the process was changed at the same time the dryer was added to allow more than one position within the process to feed the ppm analyzer. The water in condensate concentration upstream of the coalescers should be greater than the concentrations downstream. In addition the solubility of water in condensate increases with temperature and the ability to control fans in the process would also allow process variations which should be reflected in the ppm analyzer results.

30th International North Sea Flow Measurement Workshop 23 – 26 October 2012
10
Figure 9. Switch cooling fans OFF
Figure 9 shows the results when first the two cooler fans were turned off and then a third was turned off. As expected the ppm water increased at each event along with the increasing temperature.
Figure 10. Fans Back ON
When the fans were turned back on the next day the moisture level decreased as expected. Figure 10 shows this data along with the change in temperature. In both instances the response time was remarkably quick considering the system had to adsorb the moisture. The only explanation for this is the bead size used in the bed was very small in order to have the largest surface area exposed to the liquid and the flow rate was sufficient. The molecular sieve played a large part in the final validation of the analyzer. The most conclusive part of the testing was when the molecular sieve was switched into the line. The ppm reading started to decrease almost instantaneously and within 50 minutes went to zero ppm water. This can be seen in Figure 11.

30th International North Sea Flow Measurement Workshop 23 – 26 October 2012
11
Figure 11. Molecular Sieve Zero Check
Figure 12. Switch Connections Upstream and Bypass PWCS System
The next task to prove the analyzer from process variables was to switch from down stream to upstream fluids from the process to the analyzer. Process line modifications on the sample tubing were in place to enable the analyzer to obtain fluids from both sides of the coalescers. The theory was that the upstream condensate stream should have a higher water concentration than the stream exiting the system. Figure 12 shows the results. The final test was to partially bypass the Primary Water/Condensate Separator (PWCS) by opening the bypass valve to 35% open. As seen in Figure 12 this increased the water seen at the analyzer to around 340 ppm. The noise in the data is most likely free water moving through the system and all data points earlier being solution water.

30th International North Sea Flow Measurement Workshop 23 – 26 October 2012
12
6.3 Conclusions From Angel Platform Testing Initial calibration coefficients for the polynomial equation relating analyzer frequency to ppm moisture was generated using the molecular drying sieve for the zero ppm point. A second point for the linear equation was obtained through process upsets and knowledge of vendor parameters for the coalescer systems with the laboratory results only used as a general comparison. With these methods a reasonable calibration was obtained and proven with additional process variations. The resulting correlation provided a sensitivity of 1 MHz = 14 ppmv by volume of water (1ppmv = 71 kHz). The focus of having this analyzer on line is to monitor the process and to determine if there are any upsets which would require personnel to address by their presence on the platform. 6.4 Angel Analyzer Performance Since Initial Insta llation in 2009 The system has been running continuously since the initial set up in 2009. Figure 13 is an example of typical monitoring using the analyzer on Angel. This time frame was selected as the platform was shut down for maintenance and then one well at a time was brought back online as part of a routine well testing program. The response of the analyzer can be seen reacting to the change in the condensate flow-rate and quality for each well being brought online before achieving stable trend. No changes in settings or materials have been necessary since the installation in 2009.
Figure 13. Angel Platform 2012 Maintenance Start Up
KF laboratory checks are still being performed on roughly a 6 weekly basis during routine preventative maintenance campaigns mobilized to the Angel platform. To minimize the risk of sampling error and false readings a set of 6 pressurized samples are taken during each visit and transported to an onshore lab for analysis. The results are then compared to the analyzer output from the process historian, and provide a relative indication that the condensate stream is below the maximum water tolerance. Keeping in mind the uncertainties in laboratory measurement discussed earlier, these spot checks are used as an additional indicator as part of the water management of the pipeline. Table 1 is an extract of analyzer and laboratory data for comparison for 2011.

30th International North Sea Flow Measurement Workshop 23 – 26 October 2012
13
Table 1. Angel Analyzer vs KF Lab testing
With the exceptions of the samples taken 15/5/2011 and 22/3/2011 there has been a good agreement with the laboratory data given the KF lab results spread. This is most noticeable August 2011 and later, with the high condensate reading of 528 ppm which was considered as an outlier. Laboratory results during March and May 2011 were consistently lower than the analyzer reading. Both the lab and analyzer were within maximum water tolerance and therefore did not necessitate any further operator intervention. Operationally the overall responsiveness demonstrated by the analyzer to process changes was considered the primary control to water ingress of the pipeline. The KF laboratory results which vary in the order of +/- 200ppm were considered acceptable after understanding the real laboratory uncertainty.
7.0 Test and Field Operational Conclusions Initial field trials demonstrated the feasibility of this analyzer for use in condensate service. Various issues addressed during the trials assisted in obtaining a field calibration which proved to be reasonable although not easy to accomplish. Long term the analyzer has remained stable and responsive over a 3 year period without any adjustments or attention. Sampling methods were found to contain many issues which could easily lead to very large errors. Additions of multiple analyzer feed points to provide selectable process points for further comparison and verification was accomplished during a process shut down. A molecular sieve bed was designed to allow selection into the stream ahead of the ppm analyzer to create a check and zero point. Secondary calibration and verifications were carried out using process variable upsets which could be understood and defined. Successful implementation offshore allowed unattended operation to monitor the moisture output to the subsea link therefore preventing potential hydrate formation and primarily potential corrosion problems from occurring. 8.0 Factory Calibration Method Developed After Fie ld Trials Since calibration at the site is very difficult, methods to calibrate at the factory were explored. Since the zero point can be obtained at the field using the molecular sieve bed the most important factor is the slope. Earlier experiments at the factory determined the slope is linear with frequency but establishing a flow loop where the ppm level is maintained constantly was not obvious. The reason for the requirement to maintain the ppm level as a constant is due to the aluminum oxide taking up moisture until equilibrium is established. Since it is adsorbing moisture from the flowing stream to establish a fixed point of solution moisture the stream must be replenished after the analyzer. It is recognized that for a given solvent the maximum amount of water adsorbed is fixed at a specific temperature. The problem is that chemical tables were not found for the specific solvents used and laboratory samples were proven to have a large uncertainty.
Date/Time WIC
Analyzer ppm
Lab (average)
ppm
Lab min ppm
Lab max ppm
20/12/11 0800 128.2 130.5 93.0 168.0
22/11/11 1000 157.9 110.5 101.0 120.0
3/10/11 1015 169.3 181.0 140.0 222.0
23/8/11 1320 170.1 323.5 119.0 528.0
26/7/11 0740 217.9 166.0 90.0 242.0
15/5/11 1620 262.0 160.0 142.0 178.0
22/3/11 1500 337.0 76.5 35.0 118.0
21/1/11 1440 338.6 261.0 143.0 379.0

30th International North Sea Flow Measurement Workshop 23 – 26 October 2012
14
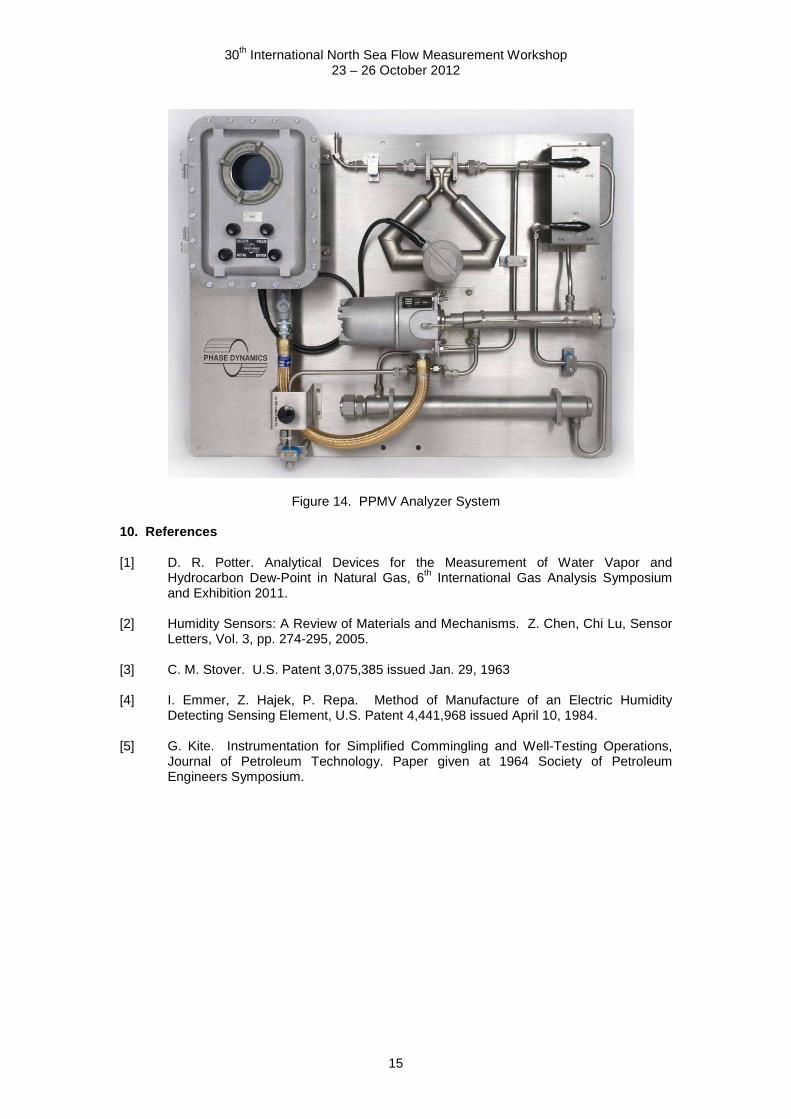
A solution was found by establishing a volume of solvent which was recycled through a vessel with a bottom sloping section where water could be introduced as a pool where the solvent must bubble though the water and therefore replenish the water lost in the aluminum oxide. This was improved after realizing that establishing a large surface area of water droplets was important for the solvent to be thoroughly wetted as it passes through the water column. Since the equation was linear two points could establish the slope and intercept. The un-wetted solvent was first used in the loop and passed through the molecular sieve bed to establish the zero. Then the sieve bed was switched out and the water added to the column and re-circulated until equilibrium was established which could be determined by observing the analyzer frequency. At this point the final requirement was to establish what the solution water was at equilibrium. As before samples were pulled of various volumes directly from the re-circulating solvent. Since the system was at atmospheric pressure pulling samples directly into the syringe was relatively easy. The laboratory had two Karl Fisher titration systems running in parallel to assure the chemicals and apparatus were providing good analysis. This second station was implemented after having used Karl Fisher titration for low fractional percentage water analysis and realizing there was no certain way to determine when the chemicals or system degraded. Analyzing the ppm sample data from the Karl Fisher demonstrated scattered results expected to be in the range from 180 to 220 ppmv. After many attempts to improve the KF results a final value of 220 ppmv was selected for the given solvent at room temperature to use as the second point to obtain the slope. 9.0 Summary and Conclusions A parts-per-million analyzer based on a bed of aluminum oxide beads with a microwave signal imposed across the bed has been developed with good field performance from the Angel Platform experience. The various parameters which could affect the measurement have been defined with no compensation required although provision for the compensation was built into the electronics. Various field trials and investigations led to improvements and understanding of methods to calibrate the analyzer at the factory which were later implemented with success. Verification of parameters that did not affect the measurement was accomplished through obtaining real data which demonstrated the expected lack of correlation. The system was improved and now is mounted on a stainless steel panel with a Coriolis flow meter providing measurement of flow and density, a drying bed with molecular sieve and associated valves to switch it in, and the ppmv analyzer with electronics. A photograph of the final system with these additions is shown in Figure 14.
30th International North Sea Flow Measurement Workshop 23 – 26 October 2012
15
Figure 14. PPMV Analyzer System
10. References [1] D. R. Potter. Analytical Devices for the Measurement of Water Vapor and
Hydrocarbon Dew-Point in Natural Gas, 6th International Gas Analysis Symposium and Exhibition 2011.
[2] Humidity Sensors: A Review of Materials and Mechanisms. Z. Chen, Chi Lu, Sensor
Letters, Vol. 3, pp. 274-295, 2005. [3] C. M. Stover. U.S. Patent 3,075,385 issued Jan. 29, 1963 [4] I. Emmer, Z. Hajek, P. Repa. Method of Manufacture of an Electric Humidity
Detecting Sensing Element, U.S. Patent 4,441,968 issued April 10, 1984. [5] G. Kite. Instrumentation for Simplified Commingling and Well-Testing Operations,
Journal of Petroleum Technology. Paper given at 1964 Society of Petroleum Engineers Symposium.