Embed Size (px)
Citation preview
A LONGITUDINAL EVALUATION OF HTTP TRAFFIC
by
TOM CALLAHAN
Submitted in Partial Fulfillment
of the Requirements
for the Degree of
Master of Science
Department of Electrical Engineering and Computer Science
CASE WESTERN RESERVE UNIVERSITY
May 2012

CASE WESTERN RESERVE UNIVERSITY
SCHOOL OF GRADUATE STUDIES
We hereby approve the thesis of
TOM CALLAHAN
candidate for the MASTER OF SCIENCE degree*
Committee Chair: Michael Rabinovich
Committee Member: Mark Allman
Committee Member: Vincenzo Liberatore
Date: 03/23/2012
*We also certify that written approval has been obtained for
any propriety material contained therein.
ii

Copyright 2012 by Tom Callahan
cb
This work is licensed under a Creative Commons
Attribution 3.0 Unported License.
Details available at:
http://creativecommons.org/licenses/by/3.0/
iii
Contents
List of Tables vi
List of Figures vii
Acknowledgments ix
Abstract x
Chapter 1 Introduction 1
1.1 Areas of Study . . . . . . . . . . . . . . . . . . . . . . . . . . . . . . . . 2
Chapter 2 Related Work 4
2.1 General Internet Traffic Classification . . . . . . . . . . . . . . . . . . . . 4
2.2 HTTP Traffic Characterization . . . . . . . . . . . . . . . . . . . . . . . . 5
2.3 HTTP Modelling . . . . . . . . . . . . . . . . . . . . . . . . . . . . . . . 6
2.4 Characterization of Specific HTTP Traffic Types . . . . . . . . . . . . . . . 7
2.4.1 AJAX Traffic . . . . . . . . . . . . . . . . . . . . . . . . . . . . . 7
2.4.2 Internet Video Traffic . . . . . . . . . . . . . . . . . . . . . . . . . 8
2.5 Caching . . . . . . . . . . . . . . . . . . . . . . . . . . . . . . . . . . . . 8
2.6 CDNs . . . . . . . . . . . . . . . . . . . . . . . . . . . . . . . . . . . . . 10
Chapter 3 Datasets 12
3.1 ICSI . . . . . . . . . . . . . . . . . . . . . . . . . . . . . . . . . . . . . . 12
iv
3.2 CCZ . . . . . . . . . . . . . . . . . . . . . . . . . . . . . . . . . . . . . . 14
Chapter 4 HTTP Transactions 15
4.1 Transaction Types & Numbers . . . . . . . . . . . . . . . . . . . . . . . . 15
4.2 Transaction Sizes . . . . . . . . . . . . . . . . . . . . . . . . . . . . . . . 17
Chapter 5 HTTP Connections 23
5.1 HTTP vs. TCP . . . . . . . . . . . . . . . . . . . . . . . . . . . . . . . . 23
5.2 Parallelism . . . . . . . . . . . . . . . . . . . . . . . . . . . . . . . . . . 25
Chapter 6 Client Behavior 28
6.1 Top TLDs . . . . . . . . . . . . . . . . . . . . . . . . . . . . . . . . . . . 28
6.2 Top File Extensions . . . . . . . . . . . . . . . . . . . . . . . . . . . . . . 30
6.3 Request Distribution by Object . . . . . . . . . . . . . . . . . . . . . . . . 31
6.4 Request Distribution by Hostname . . . . . . . . . . . . . . . . . . . . . . 32
6.5 Caching . . . . . . . . . . . . . . . . . . . . . . . . . . . . . . . . . . . . 33
Chapter 7 Server Structure 37
7.1 Object Concentration . . . . . . . . . . . . . . . . . . . . . . . . . . . . . 37
7.2 IP/Hostname Topology . . . . . . . . . . . . . . . . . . . . . . . . . . . . 38
7.3 Content Delivery Networks . . . . . . . . . . . . . . . . . . . . . . . . . . 40
Chapter 8 Summary 43
Chapter 9 Future Work 45
Bibliography 47
v
List of Tables
4.1 Median Response Sizes (bytes) . . . . . . . . . . . . . . . . . . . . . . . . 22
6.1 Requests to TLDs appearing in the Top-10 of any year at ICSI . . . . . . . 29
6.2 Top 10 TLDs at CCZ . . . . . . . . . . . . . . . . . . . . . . . . . . . . . 30
6.3 Requests to extensions appearing in the Top 10 of any year at ICSI . . . . . 31
6.4 Top 10 File Extensions at CCZ . . . . . . . . . . . . . . . . . . . . . . . . 31
vi
List of Figures
3.1 ICSI Dataset Summary . . . . . . . . . . . . . . . . . . . . . . . . . . . . 13
3.2 CCZ Dataset Summary . . . . . . . . . . . . . . . . . . . . . . . . . . . . 14
4.1 HTTP Transaction Types . . . . . . . . . . . . . . . . . . . . . . . . . . . 17
4.2 Raw Request Count Comparisons (ICSI) . . . . . . . . . . . . . . . . . . . 18
4.3 ICSI HTTP Transaction Sizes . . . . . . . . . . . . . . . . . . . . . . . . . 19
4.4 CCZ HTTP Transaction Sizes . . . . . . . . . . . . . . . . . . . . . . . . 20
4.5 ICSI . . . . . . . . . . . . . . . . . . . . . . . . . . . . . . . . . . . . . . 21
4.6 CCZ . . . . . . . . . . . . . . . . . . . . . . . . . . . . . . . . . . . . . . 22
5.1 Median Connection Duration & Time to First Request . . . . . . . . . . . . 24
5.2 Connections & Requests per Connection . . . . . . . . . . . . . . . . . . . 25
5.3 Pairwise Average Maximum Parallelism . . . . . . . . . . . . . . . . . . . 27
5.4 Average Maximum Parallelism by Client . . . . . . . . . . . . . . . . . . . 27
6.1 Requests Per Object . . . . . . . . . . . . . . . . . . . . . . . . . . . . . . 32
6.2 Requests Per Hostname . . . . . . . . . . . . . . . . . . . . . . . . . . . . 33
6.3 Caching . . . . . . . . . . . . . . . . . . . . . . . . . . . . . . . . . . . . 35
6.4 Caching Ratios . . . . . . . . . . . . . . . . . . . . . . . . . . . . . . . . 36
7.1 Objects Per Hostname . . . . . . . . . . . . . . . . . . . . . . . . . . . . . 38
7.2 Hosts per IP . . . . . . . . . . . . . . . . . . . . . . . . . . . . . . . . . . 39
vii
7.3 IPs per Host . . . . . . . . . . . . . . . . . . . . . . . . . . . . . . . . . . 40
7.4 Akamai Traffic (% GET Bytes) . . . . . . . . . . . . . . . . . . . . . . . . 42
viii

Acknowledgments
Many thanks to those who have supported me throughout this process, and without whom
this thesis would not be possible:
• The International Computer Science Institute and the Case Connection Zone for pro-
viding the datasets used within this thesis
• Mark Allman and Misha Rabinovich, for their tireless advising and patience
• My thesis committee
• My family & fiancée, for their support
TOM CALLAHAN
Case Western Reserve University
May 2012
ix
A Longitudinal Evaluation of HTTP Traffic
Abstract
by
TOM CALLAHAN
In this thesis we analyze over five years of HTTP traffic observed at a small research
institute and eight months of HTTP traffic from a small residential population to charac-
terize the evolution of various facets of web operation. We leverage the longitudinal data
to study various characteristics of the traffic, from client and server behavior to object and
connection characteristics. In addition, we assess how the delivery of content is structured,
including the use of browser caches, the efficacy of network-based proxy caches, and the
use of content delivery networks.
x
Chapter 1
Introduction
The Hypertext Transfer Protocol [BLFBl+94, FGM+99] has been an influential protocol
on the Internet over the past fifteen years. While the protocol has undergone some changes
over that time period, its widespread implementation, simplicity, and flexibility have re-
sulted in its usage not only as a platform for direct dissemination of information (for ex-
ample, formatted with HTML [BLC93]), but also as a crucial building block for other
applications such as BitTorrent [Coh03] and Youtube [you].
The flexibility exhibited by HTTP as both an information delivery system and as a
component of more complex web-based applications has resulted in an ever-changing de-
velopment and server landscape. Furthermore, the use of a myriad number of web browsers
(each with potential behavior changes from version to version) has the ability to effect
changes in HTTP traffic from the client side. Given this dynamic state, it behooves re-
searchers to frequently re-appraise the state of HTTP traffic on the Internet in order to
understand the new and different ways in which HTTP is being used.
To further this goal, we examine HTTP traffic logs collected from the border be-
tween the local enterprise and the Internet for two edge networks serving two distinct user
populations. The first set consists of over five years of data from a small research institute,
while the second set consists of eight months of data from a small residential community.
1

While our user populations are small, the longevity of our data allows us to glean insight
from studying the ways in which usage of the web changes over time. Furthermore, having
data from two distinct vantage points allows us to better evaluate those properties of web
use that are intransient, versus those that are population-specific.
Our contribution serves to both inform the community’s mental model on how
HTTP is currently used in the wild and to remind the community that web behavior can
and does sometimes change quickly. In addition, a multi-faceted view of web content
delivery is useful in setting up realistic testbeds and simulations to accurately reflect the
structure of today’s web.
1.1 Areas of Study
In the following chapters, we explore several facets of web traffic. We begin by discussing
related work in Chapter 2. In Chapter 3, we provide an overview of the general character-
istics of our traces, including counts of HTTP requests, connections, HTTPS connections,
and the number of server IPs and hostnames encountered.
In Chapter 4, we examine the basic properties of HTTP transactions. We show the
volumes of the different types of HTTP requests, and then move on to examine HTTP
object sizes. An understanding of HTTP transaction sizes is crucial for applications such
as HTTP cache design, constructing models of web traffic, and provisioning web services.
We also examine the effects of a design decision by a major webmail service.
In Chapter 5, we study properties of the TCP connections underlying HTTP traffic.
Metrics such as connection duration have a direct bearing on the design of application-layer
switches/load balancers and web server timeout configuration. Furthermore, studying the
elapsed time from a connection’s establishment until its first request is relevant to claim-
and-hold attacks (and the timeouts used to prevent them) as discussed in [AQRA10]. In
addition, we study connection parallelism. Connection parallelism is of interest to several
2
audiences – increased levels of parallism in recent years means designers of network hard-
ware and software may have to cope with more TCP connections than in the past. Also,
web server administrators may have to accept an increase in the number of connections
they might see from any given IP address. Finally, protocol designers should be interested
in the congestion control effects of increased parallelization – an increased number of flows
means a single loss will only trigger a reduction in TCP’s congestion window for a portion
of the true load imposed on the network path.
We move on to examine client behavior in Chapter 6, beginning by studying the
most popular traffic destinations by top-level domain. We continue by exploring the con-
tent types downloaded by our users, which we believe will help inform the community’s
mental model on where to focus optimization efforts. For example, many web server bench-
marks are performed against static content, however our study finds that over the past five
years, the number of PHP objects accessed has surpassed the number of HTML objects,
indicating a fundamental shift in the duty of standard web server. We move on to examine
the distribution of web requests by object, which is central to the design and operation of
web caches. We also take a more in-depth look at caching in particular, examining both
the savings we encounter from browser-based caches already implemented, as well as the
potential savings of a border proxy cache. As caching relieves both latency (enhancing
the end-user experience) and saves bandwidth (and money), caching research is relevant to
anyone responsible for the web access of a population of users.
In Chapter 7, we explore the structure of today’s web. We start by discussing the
relationship between IP addresses and hostnames, examining trends in both the usage of
CDNs and shared web hosting. We continue by analyzing the usage of a popular CDN, and
test its claim that it provides between 15-30% of bytes sent worldwide.
We summarize our findings in Chapter 8 and discuss future research directions in
Chapter 9. This thesis is based in part on work published in [CAP10].
3
Chapter 2
Related Work
As the literature is filled with thousands of papers that empirically assess the web (as a
small example, the 2011 WWW conference included 90 research papers), we will address
some of the broader categories of web measurement.
2.1 General Internet Traffic Classification
Numerous studies have been performed to characterize the Internet’s overall traffic patterns.
Here, we discuss some of these works with respect to their characterization of HTTP traffic.
Near the dawn of web popularity in 1993 and 1994, Paxson discusses in [Pax94]
that due to the exponential growth of HTTP (over a 500-fold increase from March 1992 to
October 1993), HTTP would soon outpace the telnet in impact on the Internet. Still, HTTP
was not at this point considered a “major” protocol on the Internet.
As early as April 1995 however, [Mah97] notes that HTTP had become the leading
source of traffic on the NSFNET backbone. By 1997, HTTP consumed 55-70% of web
traffic [TMW97]. However, by the year 2000, the amount of HTTP traffic as seen by one
Internet exchange was holding at approximately 55% [MC00]. At this time, a number
of new protocols had appeared, such Napster, RealAudio, and gaming traffic, eating into
HTTP’s dominance in terms of data volume.
4
In a study of P2P traffic classification, Karagianni et al. note that through 2003
and 2004, HTTP remains at slightly above 50% of traffic (by bytes), despite the growing
influence of P2P traffic. By 2009 however, Feldmann et al. note in [MFPA] that HTTP
traffic has increased back to nearly 60%. However, by this point HTTP is clearly used for
much more than simply transferring hypertext and associated objects. For example, the
authors note that 25% of all HTTP content type headers are video/flv – a popular content-
type for video “streaming” sites such as Youtube [you]. A recent report [san11] finds HTTP
website usage at approximately 18%, yet its separate characterization of Netflix traffic and
Youtube traffic (25% and 10%, respectively) implies still more than 50% of bytes using the
HTTP protocol.
Aside from the volume of HTTP traffic noted by the studies above, we observe that
HTTP is now an essential part of many people’s daily lives. Web-based email systems,
web-based calendaring systems, online office suites, and online social networks running on
HTTP have become critical components of the world’s communication infrastructure.
2.2 HTTP Traffic Characterization
One of the first major efforts to characterize the usage of the World Wide Web (and there-
fore HTTP as well) was performed by Cunha, Bestavros, and Crovella in 1995 [CBC95].
While [CBC95] was performed using a widely deployed modified web browser as opposed
to the packet logging used in our own study (and several others), the types of data collected
in [CBC95] are similar to our own. The authors discuss the distribution of document sizes,
the popular TLDs and file extensions accessed by their users, and the potentials impacts of
caching.
One closely related work to our own is [HCJS03], in which the authors analyze
TCP packet headers of port 80 traffic in order to make observations on trends in HTTP
requests over time. The authors utilize three of their own traces, providing a small amount
5
of data from 1999, 2001, and 2003. The authors also use results from Barford, Crovella,
and others in previous papers to provide a look at the changes in HTTP traffic from 1995
to 2003. Unfortunately, the authors’ lack of HTTP header data precluded any analysis of
evolving content types or other such trends requiring packet data.
2.3 HTTP Modelling
As discussed above, HTTP has been a major component of overall IP traffic for over 15
years. Therefore, network operators and designers are obligated to account for the dynam-
ics of HTTP traffic when designing networks. In order to do so however, one must have a
model of how HTTP will in fact behave on a network.
One of the seminal works in this field is [AW96], where Arlitt and Williamson use
logs obtained from six WWW servers in order to find invariants in web traffic. Across their
six datasets, they find ten specific invariants which include: the success rate of lookups,
the distribution of file types, the mean file transfer size, the proportion of distinct requests,
the proportion of documents that are accessed only once, the file size distribution, the
popularity of documents, file inter-reference times, the percentage of requests from remote
sites, and the distribution of the sources of requests. While some of these items may still
find a place in today’s web (for example, the file size distributions may be similar across
many sites today), others have been obsoleted due to changing web usage – for example,
a website such as slashdot.org will have very few local accesses, whereas an institutional
website such as case.edu will have a substantial amount of local accesses.
Another critical work in this field is [Den96], where Deng models HTTP traffic
in light of it’s ON/OFF pattern. In other words, when a user clicks on a web link, this
typically produces a series of HTTP interactions where the desired page as well as all of
its associated objects is downloaded (designated as “ON”), followed by a period during
which the user is idle (or “OFF”). Deng attempts to model the distribution of three items:
6
the durations of “OFF” periods, the durations of “ON” periods, and finally, the inter-arrival
times of requests during “ON” periods.
One year later, Mah [Mah97] further explored modelling HTTP traffic. In this work,
Mah explores relationship between HTTP documents (an entire HTTP page with its asso-
ciated objects) and HTTP files (individually requested items). Mah also explores the distri-
butions of HTTP request and reply sizes. Like previous authors, Mah concludes that users
rarely request many different documents from the same server in succession.
In an attempt to put these and the many other attempts to model aspects of HTTP
traffic to good use, Barford and Crovella in [BC98] built a simulator of web traffic with
an aim of allowing network and web server operators to load-test their websites with a
reasonable approximation of real traffic. Furthermore, this model enabled researchers to
create a realistic traffic workload for simulators and testbeds. The authors compare their
similator, named “SURGE,” to an already existing simulator known as “SPECweb96”. The
authors note that “SPECweb96” is designed to test a web server’s ability to answer HTTP
requests at a given rate, where as “SURGE” is designed to simulate the request patterns of
a group of users of a given size. The authors note that in many cases, the SURGE workload
required dramatically more CPU resources on the webserver than SPECweb96.
2.4 Characterization of Specific HTTP Traffic Types
Given the multitude of technologies that have developed “on top of” standard HTTP, it
has become necessary to study the behavior of these technologies specifically in order to
understand their effect on the Internet at large.
2.4.1 AJAX Traffic
One of the most significant technologies added to the web since its inception has been
AJAX [Gar05]. Prior to AJAX, the vast majority of web traffic was caused either directly
7
by a user’s action (e.g., clickling a link to load a new page), or indirectly by the user’s
action (e.g., loading component objects for a given page). Furthermore, in order to update
a page with new information, the entire page (or frame) had to be reloaded. AJAX and
related technologies allow code running in the user’s browser to make web requests for
various purposes – for instance, to keep a list of emails or stock quotes current – and then
update parts of a web page based upon data received.
In 2008, Schneider et al. [SAAF08] examined the impact of AJAX traffic at the
network/HTTP level based upon traces from two large user populations. Some interesting
conclusions drawn by these authors include: AJAX connections tend to last longer and span
more requests than regular HTTP connections, often perform prefetching, and sometimes
transfer far more bytes than their associated “regular” HTTP connections.
2.4.2 Internet Video Traffic
In [GALM07], the authors attempt to characterize the usage of Youtube at an educa-
tional institution. The authors conclude that while some traditional web strategies such
as institution-level caches may be effective in coping with the amount of Youtube traffic,
the sheer breadth of content available hurts the potential for caching this traffic. Also, the
authors note that the size and long-running nature of Youtube transactions require substan-
tial server capacity. A recent study [KKGZ11] of an online TV service called Hulu [hul]
explores the possible benefits of caching and prefetching videos – finding that 50% hit rates
can be achieved with caches sized in the tens of GB.
2.5 Caching
The dramatic increase of web traffic in the mid 90’s necessitated some strategies by both
end-user network and server operators in order to decrease traffic. The concept of caching
is both simple and applicable several places in the path from a web content provider to
8
an end user. One of the most simple forms of a cache is the browser cache – if a user
has already downloaded a a particular object recently, there is no reason to re-fetch it if
needed again. This scheme has been easily extended to the institutional case – if an object
has already been recently downloaded by one user of an institution, there is no need for a
subsequent request from another user at the same institution to re-fetch it from the origin
site. Not only does such a scheme alleviate load on content provider servers and in access
networks, but returning objects from a nearby cache also reduces the latency to retrieve
such an object, thereby enhancing the user experience.
One of the first in-depth examinations of this concept of an institution-level cache
was performed by Caceres et al in [CDF+98]. In this study, the authors examined not only
the “hit rate”, or percentage of requested data bytes that could be fulfilled by an institu-
tional or ISP-level cache, but also the potential increase in consumed bandwidth when a
client aborts a partial transfer of an HTTP document when the client’s cache has already
downloaded the entire document. Finally, the authors also propose using web proxy caches
as connection caches, where TCP connections are maintained from the proxy to popular
websites to avoid the latency of the TCP handshake.
Also in 1998, Barford et al. published [BBBC99] as re-examination of a prior work
[CBC95] in order to specifically examine any changes in the cacheability of Internet content
from 1995 to 1998. The authors find that the shared components of users’ working sets had
decreased over that time period, and that therefore institution-level caches had become
somewhat less effective. In addition, the authors provide an analysis of the effectiveness of
different cache-control algorithms.
In [Wan99], Wang discusses many of the early Internet caching schemes, includ-
ing hierarchal caches, distributed caching, hybrid models, and the tradeoffs between them.
Wang also discusses the performance measures of web caches, cache eviction policies, and
HTTP protocol elements that can help guide caching behavior. Four years later, Podlipnig
and Böszörmenyi more closely examined [PB03] the tradeoffs of possible cache replace-
9
ment algorithms.
2.6 CDNs
Like caching, Content Distribution Networks (CDNs) were created to help manage the
dramatic growth of web traffic. While most caching schemes were created to alleviate
latency or traffic load at the level of the end user or access network, CDNs were created
to alleviate the traffic load at the publishing (or origin) web server. Before the advent of
CDNs, website operators faced with capacity issues had few options – typically, operators
needed to pay for additional dedicated servers and/or bandwidth at either the operator’s
facility or a rented server farm. Also, wide geographic distribution of replicas of a website
was both difficult and expensive. Therefore the CDN business model was developed, in
which a CDN would buy many servers at geographically distributed locations and sell
capacity to many website operators. With this new model, website operators needed only
to operate a single server from which the CDN would fetch content, while client requests
for the website would be routed to a nearby CDN server.
One early study of the effectiveness of this scheme is [STA01], in which Shaikh et
al. examine some common practices of CDNs such as assuming a client is located near its
recursive DNS resolver and preventing caching of DNS responses. The authors find that
these assumptions are not always sound as some clients are not located near their recursive
DNS resolver, and in some webpages performing a separate DNS query for each object can
dramatically increase the latency to load a page.
In 2001, two studies [JCDK01] [KWZ01] were released which analyzed the perfor-
mance of some of the major CDNs in use at the time. [JCDK01] emphasized measuring the
effect of a CDN’s server selection on end-user performance, finding that in most cases the
CDN did not choose the optimal server (out of the entire set of CDN servers), but did con-
sistently provide better performance than an origin-site download of an object. [KWZ01]
10
discovered that once a reasonable CDN server had been obtained, it is rarely worth the
latency cost of an additional DNS lookup to attempt to obtain a slightly better CDN server.
Later in 2002, Jung, Krishnamurthy, and Rabinovich explored the effects of flash
crowds and Denial of Service (DOS) attacks on the Internet’s infrastructure in [JKR02].
While a flash crowd consists of many legitimate users attempting to access a newly-popular
resource, DOS attacks often consist of many computers requesting server resources in order
to deny service to legitimate users. While these two events have a fundamentally different
motivation, the authors analyze the high-demand pattern exhibited by both. The authors
then continue by demonstrating some changes in CDN architecture that would have the
potential to better handle (and distinguish between) both of these types of events.
11
Chapter 3
Datasets
For this work we used logs of web traffic taken at the border routers connecting two distinct
populations to the Internet. In both cases, we used the Bro intrusion detection system
[Pax99, bro] to reconstruct HTTP sessions from the observed traffic stream. These sessions
are then logged using Bro’s standard HTTP logging policy1 (found in http.bro in the Bro
package). The logs include timestamps, involved IP addresses, URLs, HTTP transaction
types and sizes, hostnames and HTTP response codes.
3.1 ICSI
The International Computer Science Institute (ICSI) is a small, non-profit research insti-
tute located in Berkeley, California. Most ICSI employees are full-time computer science
researchers, along with a supporting administrative staff. The ICSI dataset used runs from
January 2006 through September 2011. Due to the size of the dataset we analyze only the
eleventh through eighteenth days of each month for logistical reasons. We do not believe
this biases our results. The original logs include all incoming and outgoing HTTP traffic.
However, we winnowed to only the outgoing connections (i.e., ICSI clients) as we do not
wish to bias our results by the particular characteristics of the few server instances at ICSI.
1Bro’s standard HTTP logging policy has changed somewhat over the years as described in Section 3.1.
12
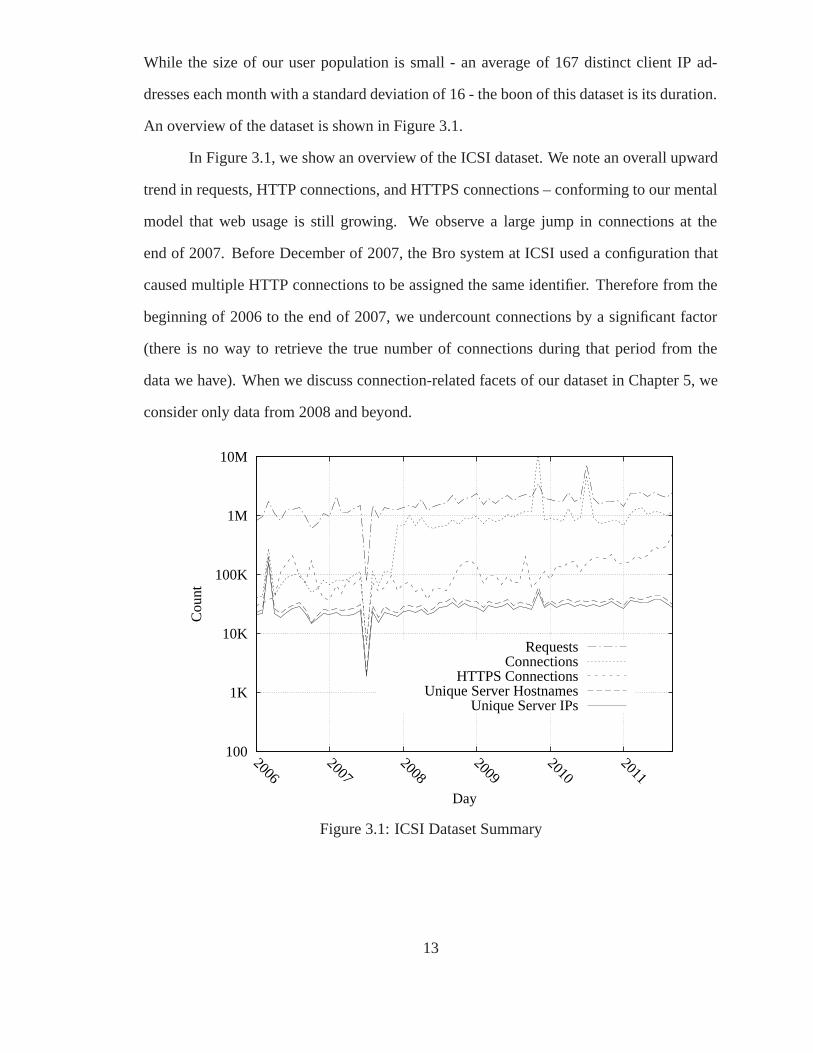
While the size of our user population is small - an average of 167 distinct client IP ad-
dresses each month with a standard deviation of 16 - the boon of this dataset is its duration.
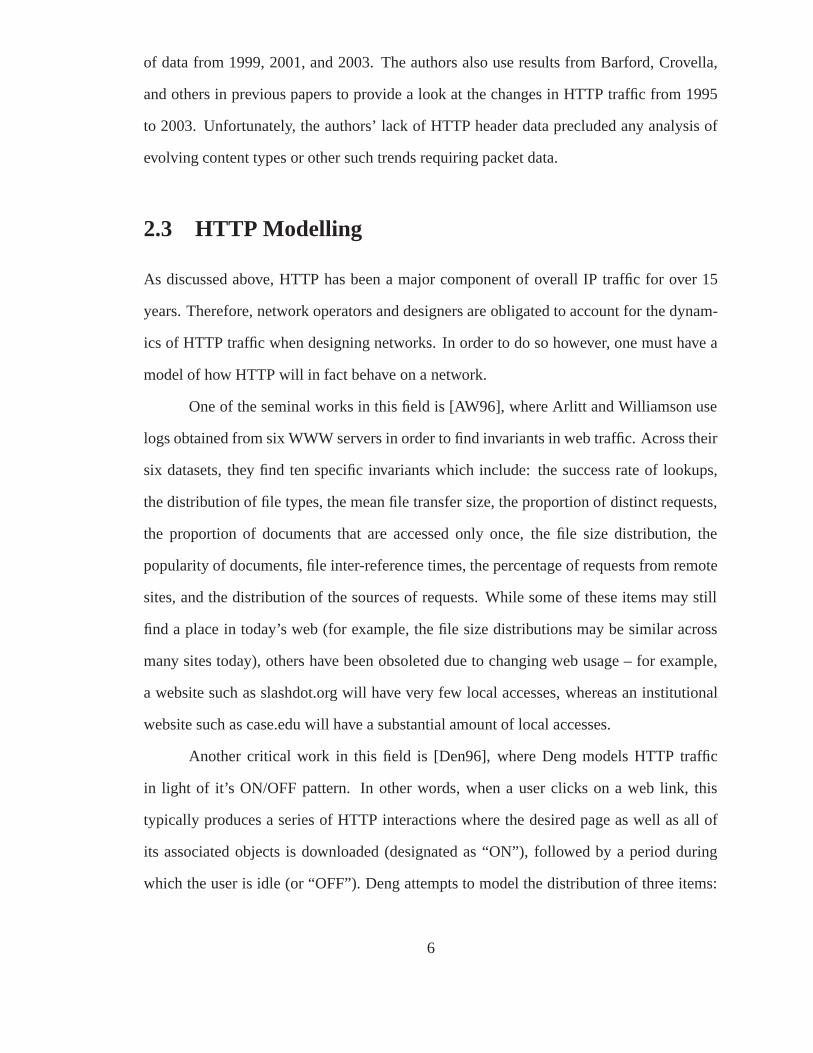
An overview of the dataset is shown in Figure 3.1.
In Figure 3.1, we show an overview of the ICSI dataset. We note an overall upward
trend in requests, HTTP connections, and HTTPS connections – conforming to our mental
model that web usage is still growing. We observe a large jump in connections at the
end of 2007. Before December of 2007, the Bro system at ICSI used a configuration that
caused multiple HTTP connections to be assigned the same identifier. Therefore from the
beginning of 2006 to the end of 2007, we undercount connections by a significant factor
(there is no way to retrieve the true number of connections during that period from the
data we have). When we discuss connection-related facets of our dataset in Chapter 5, we
consider only data from 2008 and beyond.
100
1K
10K
100K
1M
10M
20062007
20082009
20102011
Cou
nt
Day
Unique Server IPsUnique Server Hostnames
HTTPS ConnectionsConnections
Requests
Figure 3.1: ICSI Dataset Summary
13
3.2 CCZ
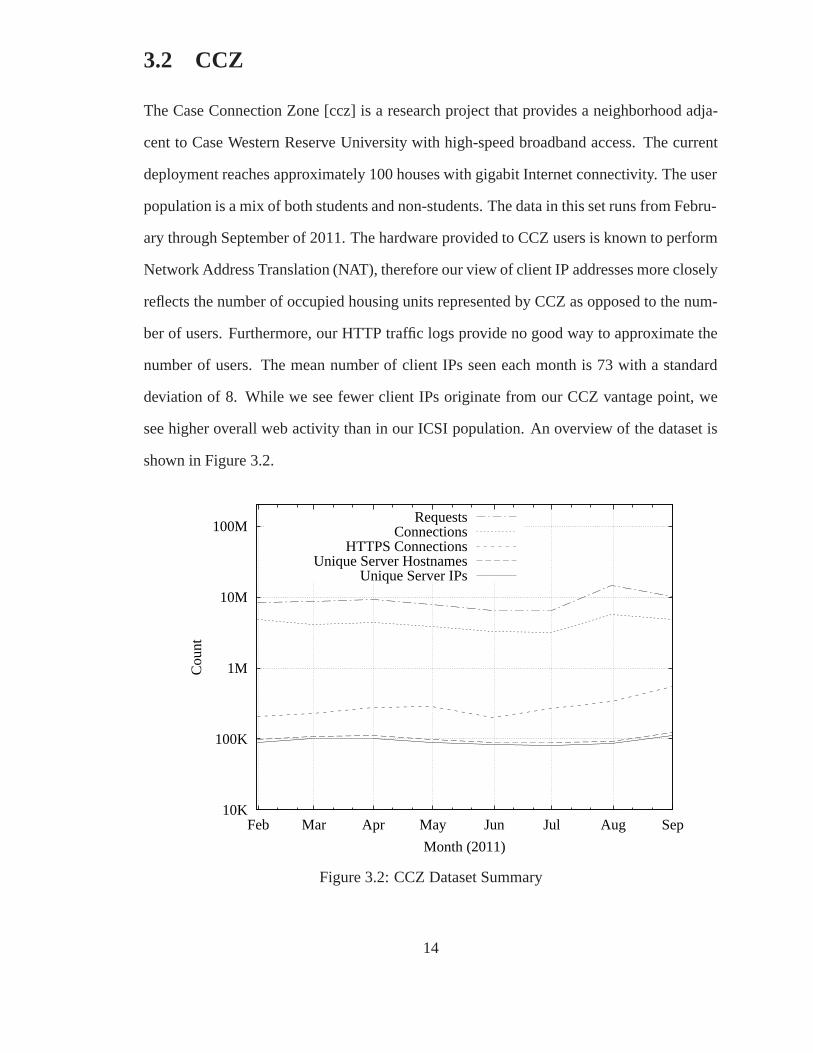
The Case Connection Zone [ccz] is a research project that provides a neighborhood adja-
cent to Case Western Reserve University with high-speed broadband access. The current
deployment reaches approximately 100 houses with gigabit Internet connectivity. The user
population is a mix of both students and non-students. The data in this set runs from Febru-
ary through September of 2011. The hardware provided to CCZ users is known to perform
Network Address Translation (NAT), therefore our view of client IP addresses more closely
reflects the number of occupied housing units represented by CCZ as opposed to the num-
ber of users. Furthermore, our HTTP traffic logs provide no good way to approximate the
number of users. The mean number of client IPs seen each month is 73 with a standard
deviation of 8. While we see fewer client IPs originate from our CCZ vantage point, we
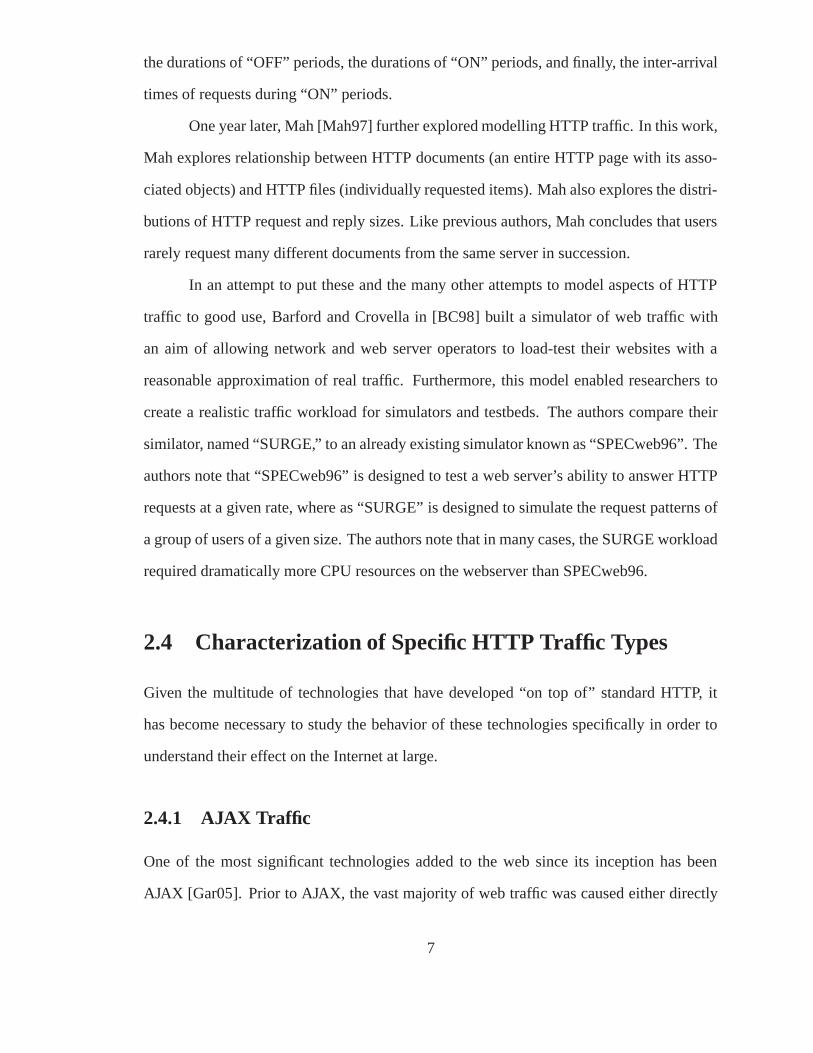
see higher overall web activity than in our ICSI population. An overview of the dataset is
shown in Figure 3.2.
10K
100K
1M
10M
100M
Feb Mar Apr May Jun Jul Aug Sep
Cou
nt
Month (2011)
Unique Server IPsUnique Server Hostnames
HTTPS ConnectionsConnections
Requests
Figure 3.2: CCZ Dataset Summary
14
Chapter 4
HTTP Transactions
This chapter provides an overview of the basic properties of the HTTP transactions in our
datasets, including the HTTP methods utilized by these transactions and several measures
of the sizes of these transactions. Using these metrics, we are able to spot the both influ-
ence of newer web technologies such as AJAX [Gar05] and the evolution of underlying
embedded web objects. Furthermore, we are able to realize the impact of design decisions
made by the operators of large websites on the basic properties of the web traffic we see in
general.
4.1 Transaction Types & Numbers
We begin by characterizing the frequency and types of HTTP transactions, grouping them
into categories for GET requests, POST requests, and all other transaction types. In Fig-
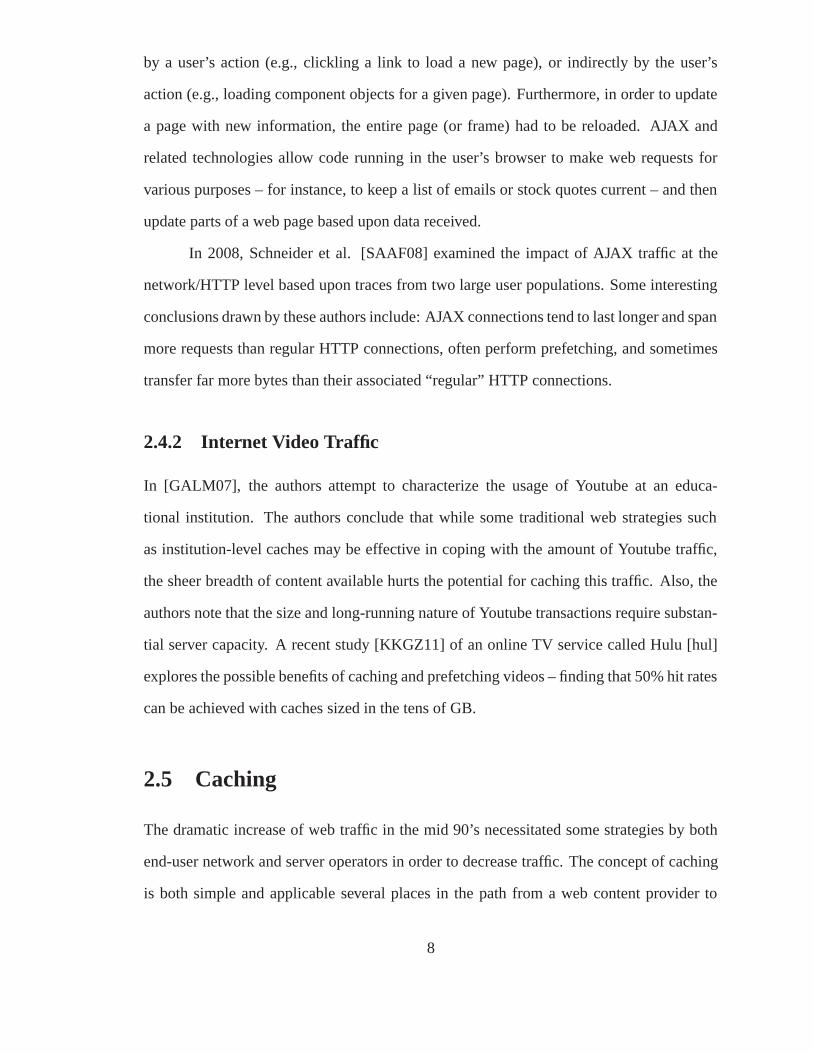
ure 4.1, we observe the request types over time for both datasets. We can see that the ICSI
data shows a clear growth in all request types over time (there appears to be a drop in POST
requests starting in February of 2010 – this will be discussed in Section 4.2). Furthermore,
we see a rise in both POST and other HTTP request types with respect to GET requests
throughout 2006. Part of this is due to the rise of AJAX [Gar05] applications, which often
utilize POST queries more heavily than traditional websites.
15
In the ICSI data we see a sustained rise in the raw number of web requests despite
a relatively stable user population. While the CCZ might initially seem not to support
this, we note that the CCZ user population was likely artificially low during the summer
months of May, June, July, and August when many students would have left for summer
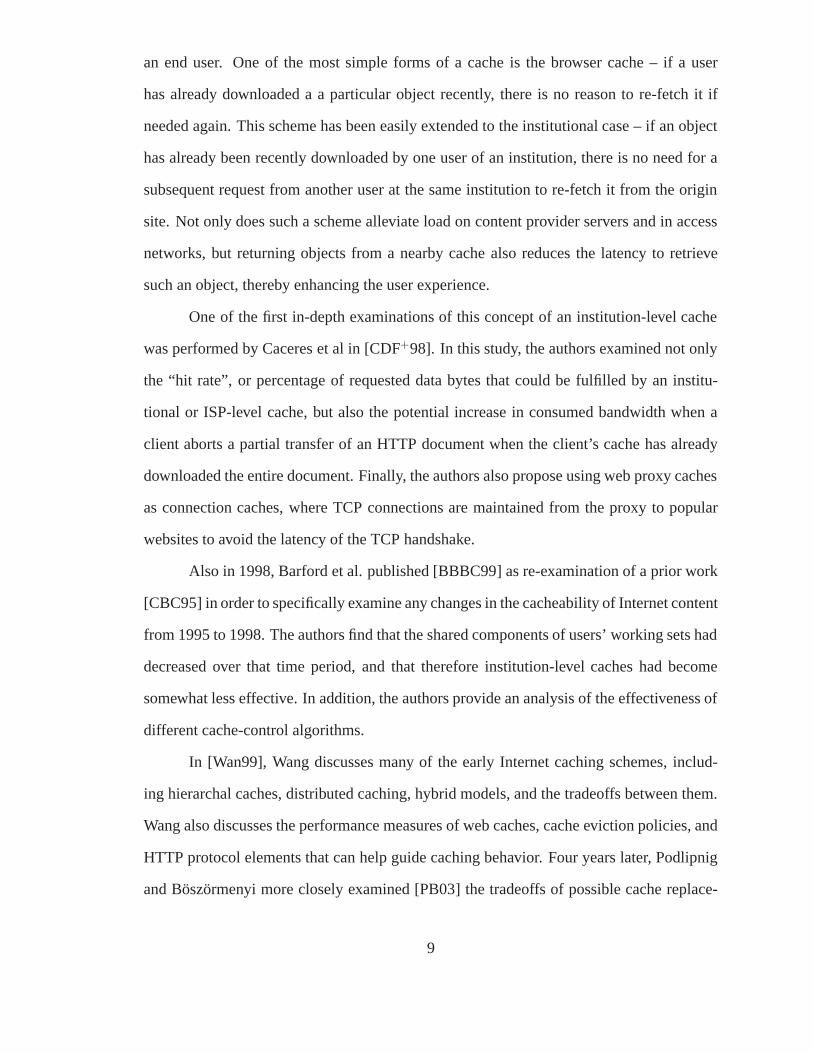
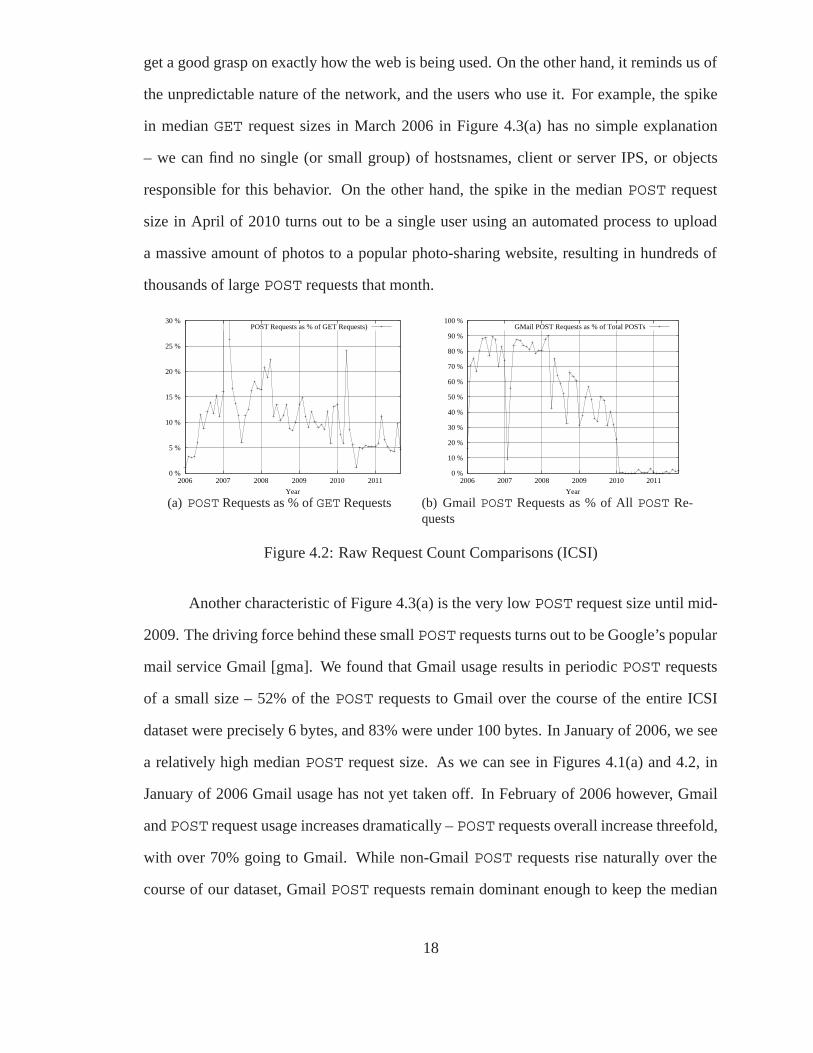
break. In Figure 4.2(a), we show the ratio of the number of POST requests to GET requests
at ICSI. The relative growth of POST requests through 2006 is evident, at which point
POST requests stay between 8% and 15% of GET requests throughout 2007-2009, with
some exceptions. Starting in 2010 however, POST requests tend to stay under 10% of the
number of GET requests. The CCZ POST/GET ratio (not pictured) stays between 4% and
8% for the duration of the study.
In Figure 4.1(a), we see a massive drop in all categories in July of 2007 – the cause
of which was a glitch in our measurement infrastructure, causing approximately 95% of
our logs for that month to disappear. While any data loss has the potential to bias results,
we feel this loss does not do so for four reasons. First, we cannot find any reason within the
traffic itself for the measurement loss (e.g., high traffic volume). Second, when examining
the metrics from that month that do not rely on the raw number of HTTP transactions,
we see no significant irregularities; Figure 4.3 shows no irregularity during that month
and Figure 4.2 shows only a slight dip in the POST/GET ratio during that month. Third,
even the total absence of data from this month would not limit our ability to study long-
term trends (such as in Figure 4.3), as we do not use that month in isolation to draw any
conclusions. Finally, if this loss were going to affect our object size distribution graphs
such as in Figure 4.5, we would expect to see some deviation in the median and average
GET sizes in Figure 4.3.
In Figure 4.1(b), we see a spike in POST requests in the CCZ data in August –
further investigation revealed a single client performing several POST requests per second
to a single server for a sustained time period. The lone point on the graph represents the
value of the POST request line when this server is removed from consideration, which
16
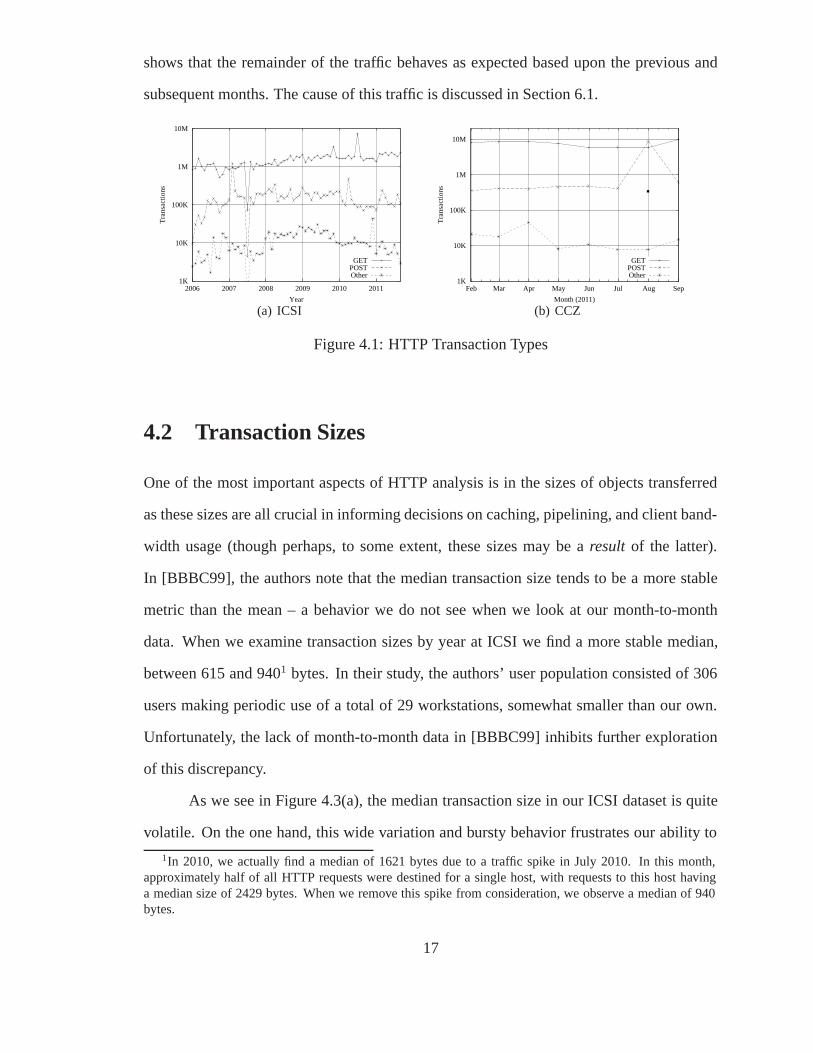
shows that the remainder of the traffic behaves as expected based upon the previous and
subsequent months. The cause of this traffic is discussed in Section 6.1.
1K
10K
100K
1M
10M
2006 2007 2008 2009 2010 2011
Tra
nsac
tions
Year
GETPOSTOther
(a) ICSI
1K
10K
100K
1M
10M
Feb Mar Apr May Jun Jul Aug Sep
Tra
nsac
tions
Month (2011)
GETPOSTOther
(b) CCZ
Figure 4.1: HTTP Transaction Types
4.2 Transaction Sizes
One of the most important aspects of HTTP analysis is in the sizes of objects transferred
as these sizes are all crucial in informing decisions on caching, pipelining, and client band-
width usage (though perhaps, to some extent, these sizes may be a result of the latter).
In [BBBC99], the authors note that the median transaction size tends to be a more stable
metric than the mean – a behavior we do not see when we look at our month-to-month
data. When we examine transaction sizes by year at ICSI we find a more stable median,
between 615 and 9401 bytes. In their study, the authors’ user population consisted of 306
users making periodic use of a total of 29 workstations, somewhat smaller than our own.
Unfortunately, the lack of month-to-month data in [BBBC99] inhibits further exploration
of this discrepancy.
As we see in Figure 4.3(a), the median transaction size in our ICSI dataset is quite
volatile. On the one hand, this wide variation and bursty behavior frustrates our ability to
1In 2010, we actually find a median of 1621 bytes due to a traffic spike in July 2010. In this month,approximately half of all HTTP requests were destined for a single host, with requests to this host havinga median size of 2429 bytes. When we remove this spike from consideration, we observe a median of 940bytes.
17
get a good grasp on exactly how the web is being used. On the other hand, it reminds us of
the unpredictable nature of the network, and the users who use it. For example, the spike
in median GET request sizes in March 2006 in Figure 4.3(a) has no simple explanation
– we can find no single (or small group) of hostsnames, client or server IPS, or objects
responsible for this behavior. On the other hand, the spike in the median POST request
size in April of 2010 turns out to be a single user using an automated process to upload
a massive amount of photos to a popular photo-sharing website, resulting in hundreds of
thousands of large POST requests that month.
0 %
5 %
10 %
15 %
20 %
25 %
30 %
2006 2007 2008 2009 2010 2011
Year
POST Requests as % of GET Requests)
(a) POST Requests as % of GET Requests
0 %
10 %
20 %
30 %
40 %
50 %
60 %
70 %
80 %
90 %
100 %
2006 2007 2008 2009 2010 2011
Year
GMail POST Requests as % of Total POSTs
(b) Gmail POST Requests as % of All POST Re-quests
Figure 4.2: Raw Request Count Comparisons (ICSI)
Another characteristic of Figure 4.3(a) is the very low POST request size until mid-
2009. The driving force behind these small POST requests turns out to be Google’s popular
mail service Gmail [gma]. We found that Gmail usage results in periodic POST requests
of a small size – 52% of the POST requests to Gmail over the course of the entire ICSI
dataset were precisely 6 bytes, and 83% were under 100 bytes. In January of 2006, we see
a relatively high median POST request size. As we can see in Figures 4.1(a) and 4.2, in
January of 2006 Gmail usage has not yet taken off. In February of 2006 however, Gmail
and POST request usage increases dramatically – POST requests overall increase threefold,
with over 70% going to Gmail. While non-Gmail POST requests rise naturally over the
course of our dataset, Gmail POST requests remain dominant enough to keep the median
18
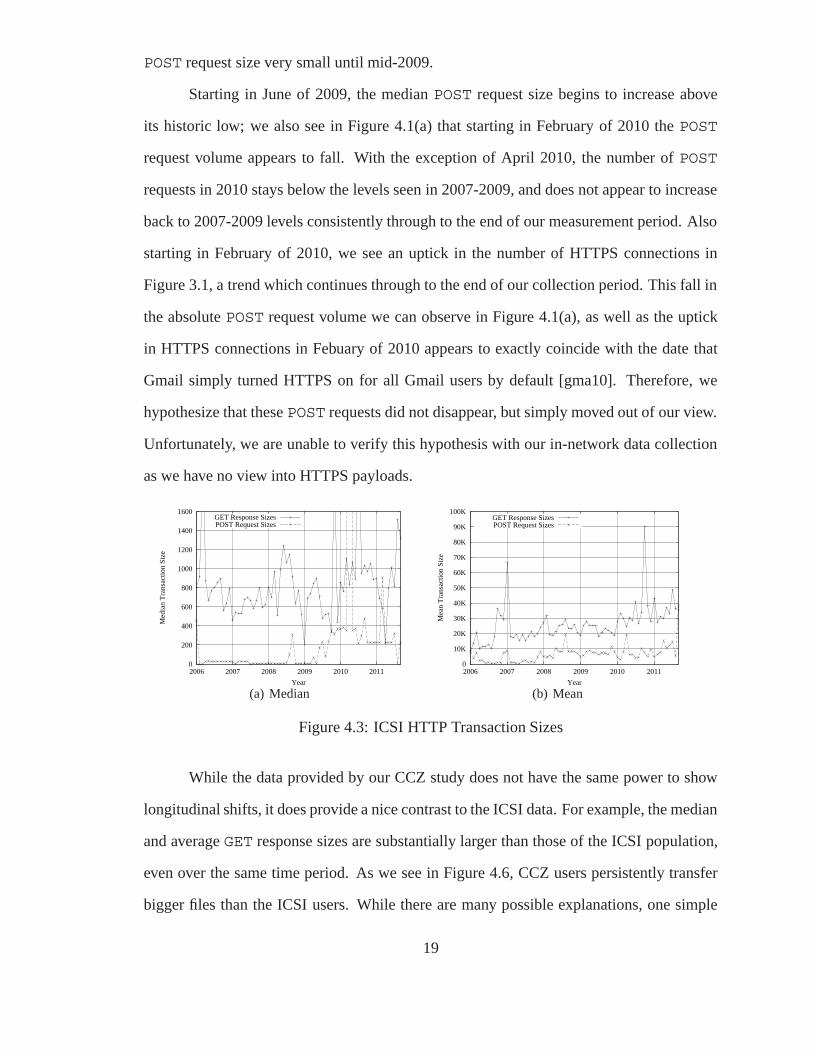
POST request size very small until mid-2009.
Starting in June of 2009, the median POST request size begins to increase above
its historic low; we also see in Figure 4.1(a) that starting in February of 2010 the POST
request volume appears to fall. With the exception of April 2010, the number of POST
requests in 2010 stays below the levels seen in 2007-2009, and does not appear to increase
back to 2007-2009 levels consistently through to the end of our measurement period. Also
starting in February of 2010, we see an uptick in the number of HTTPS connections in
Figure 3.1, a trend which continues through to the end of our collection period. This fall in
the absolute POST request volume we can observe in Figure 4.1(a), as well as the uptick
in HTTPS connections in Febuary of 2010 appears to exactly coincide with the date that
Gmail simply turned HTTPS on for all Gmail users by default [gma10]. Therefore, we
hypothesize that these POST requests did not disappear, but simply moved out of our view.
Unfortunately, we are unable to verify this hypothesis with our in-network data collection
as we have no view into HTTPS payloads.
0
200
400
600
800
1000
1200
1400
1600
2006 2007 2008 2009 2010 2011
Med
ian
Tra
nsac
tion
Size
Year
GET Response SizesPOST Request Sizes
(a) Median
0
10K
20K
30K
40K
50K
60K
70K
80K
90K
100K
2006 2007 2008 2009 2010 2011
Mea
n T
rans
actio
n Si
ze
Year
GET Response SizesPOST Request Sizes
(b) Mean
Figure 4.3: ICSI HTTP Transaction Sizes
While the data provided by our CCZ study does not have the same power to show
longitudinal shifts, it does provide a nice contrast to the ICSI data. For example, the median
and average GET response sizes are substantially larger than those of the ICSI population,
even over the same time period. As we see in Figure 4.6, CCZ users persistently transfer
bigger files than the ICSI users. While there are many possible explanations, one simple
19
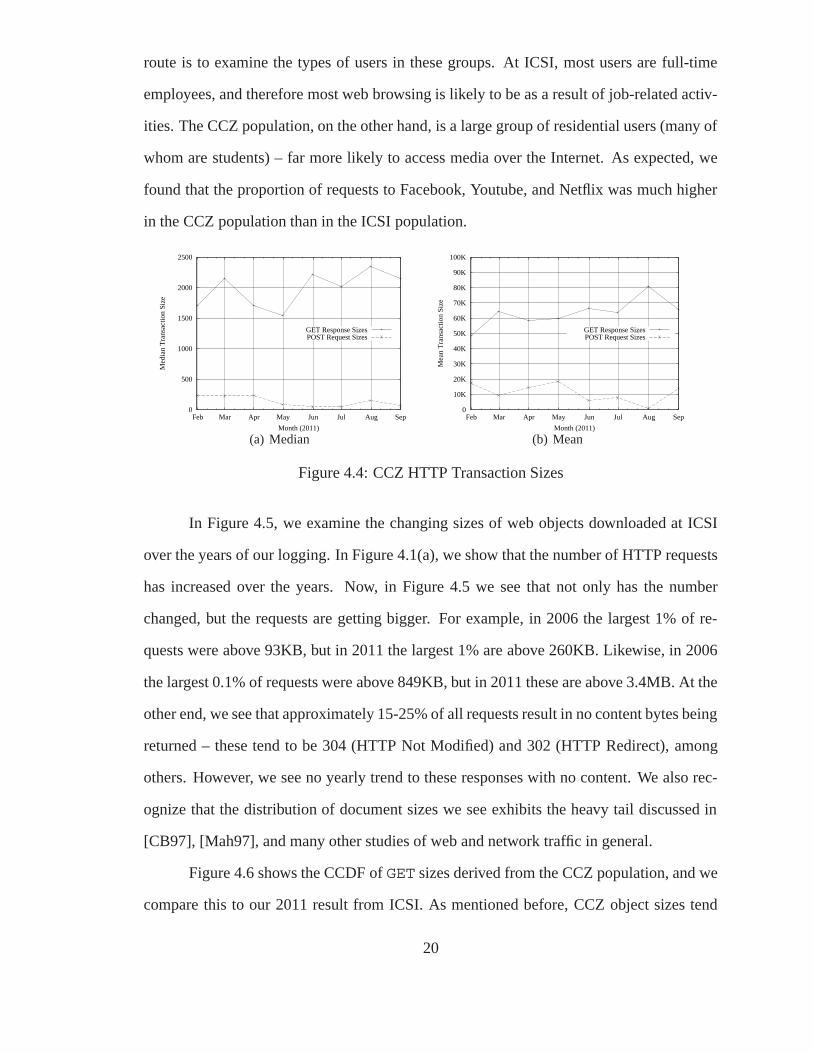
route is to examine the types of users in these groups. At ICSI, most users are full-time
employees, and therefore most web browsing is likely to be as a result of job-related activ-
ities. The CCZ population, on the other hand, is a large group of residential users (many of
whom are students) – far more likely to access media over the Internet. As expected, we
found that the proportion of requests to Facebook, Youtube, and Netflix was much higher
in the CCZ population than in the ICSI population.
0
500
1000
1500
2000
2500
Feb Mar Apr May Jun Jul Aug Sep
Med
ian
Tra
nsac
tion
Size
Month (2011)
GET Response SizesPOST Request Sizes
(a) Median
0
10K
20K
30K
40K
50K
60K
70K
80K
90K
100K
Feb Mar Apr May Jun Jul Aug Sep
Mea
n T
rans
actio
n Si
ze
Month (2011)
GET Response SizesPOST Request Sizes
(b) Mean
Figure 4.4: CCZ HTTP Transaction Sizes
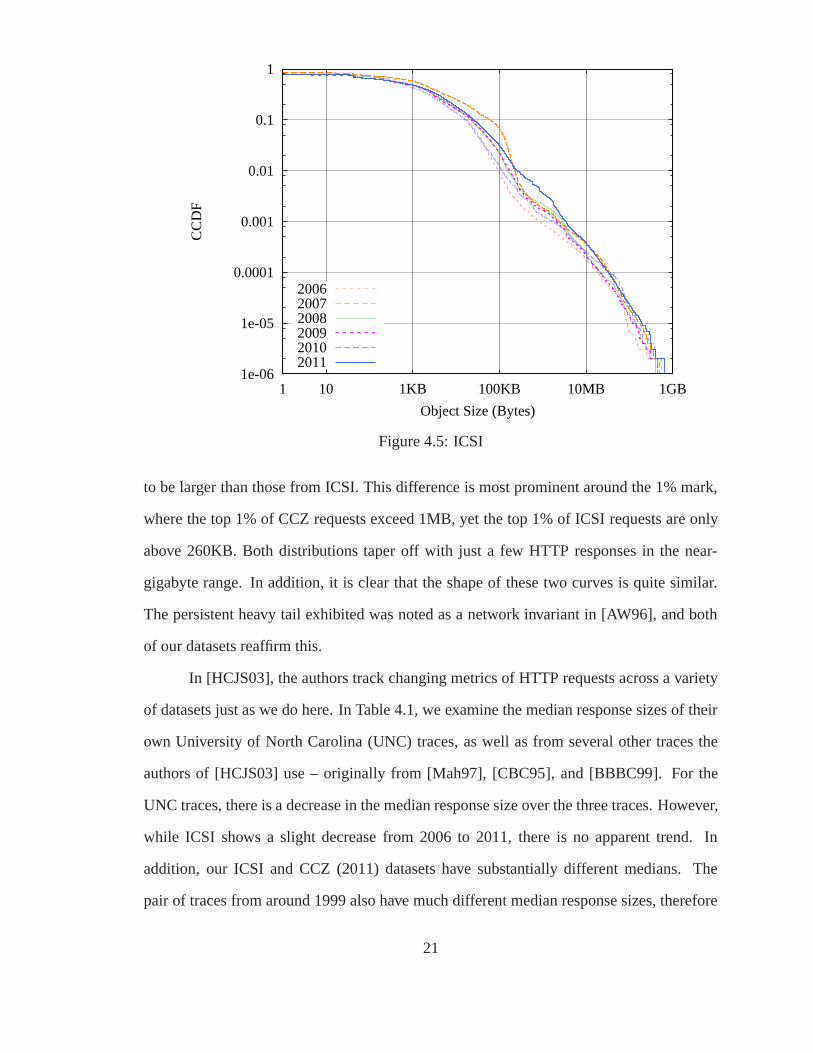
In Figure 4.5, we examine the changing sizes of web objects downloaded at ICSI
over the years of our logging. In Figure 4.1(a), we show that the number of HTTP requests
has increased over the years. Now, in Figure 4.5 we see that not only has the number
changed, but the requests are getting bigger. For example, in 2006 the largest 1% of re-
quests were above 93KB, but in 2011 the largest 1% are above 260KB. Likewise, in 2006
the largest 0.1% of requests were above 849KB, but in 2011 these are above 3.4MB. At the
other end, we see that approximately 15-25% of all requests result in no content bytes being
returned – these tend to be 304 (HTTP Not Modified) and 302 (HTTP Redirect), among
others. However, we see no yearly trend to these responses with no content. We also rec-
ognize that the distribution of document sizes we see exhibits the heavy tail discussed in
[CB97], [Mah97], and many other studies of web and network traffic in general.
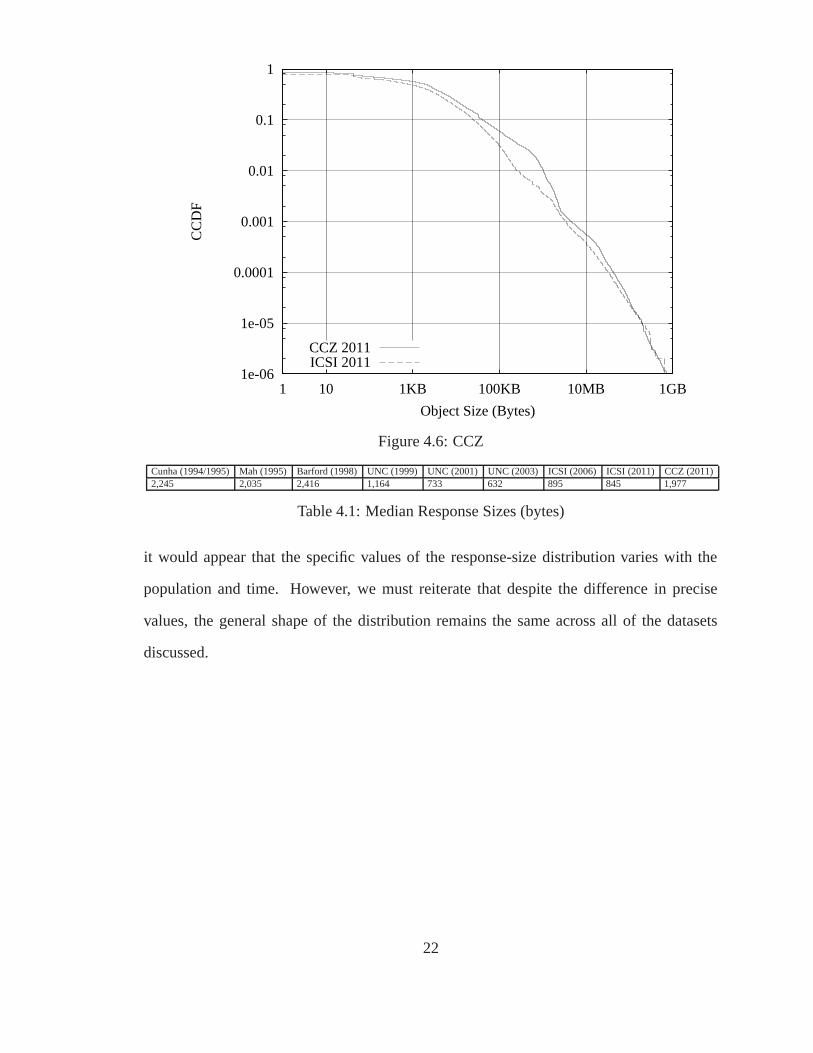
Figure 4.6 shows the CCDF of GET sizes derived from the CCZ population, and we
compare this to our 2011 result from ICSI. As mentioned before, CCZ object sizes tend
20
1e-06
1e-05
0.0001
0.001
0.01
0.1
1
1 10 1KB 100KB 10MB 1GB
CC
DF
Object Size (Bytes)
200620072008200920102011
Figure 4.5: ICSI
to be larger than those from ICSI. This difference is most prominent around the 1% mark,
where the top 1% of CCZ requests exceed 1MB, yet the top 1% of ICSI requests are only
above 260KB. Both distributions taper off with just a few HTTP responses in the near-
gigabyte range. In addition, it is clear that the shape of these two curves is quite similar.
The persistent heavy tail exhibited was noted as a network invariant in [AW96], and both
of our datasets reaffirm this.
In [HCJS03], the authors track changing metrics of HTTP requests across a variety
of datasets just as we do here. In Table 4.1, we examine the median response sizes of their
own University of North Carolina (UNC) traces, as well as from several other traces the
authors of [HCJS03] use – originally from [Mah97], [CBC95], and [BBBC99]. For the
UNC traces, there is a decrease in the median response size over the three traces. However,
while ICSI shows a slight decrease from 2006 to 2011, there is no apparent trend. In
addition, our ICSI and CCZ (2011) datasets have substantially different medians. The
pair of traces from around 1999 also have much different median response sizes, therefore
21
1e-06
1e-05
0.0001
0.001
0.01
0.1
1
1 10 1KB 100KB 10MB 1GB
CC
DF
Object Size (Bytes)
CCZ 2011ICSI 2011
Figure 4.6: CCZ
Cunha (1994/1995) Mah (1995) Barford (1998) UNC (1999) UNC (2001) UNC (2003) ICSI (2006) ICSI (2011) CCZ (2011)2,245 2,035 2,416 1,164 733 632 895 845 1,977
Table 4.1: Median Response Sizes (bytes)
it would appear that the specific values of the response-size distribution varies with the
population and time. However, we must reiterate that despite the difference in precise
values, the general shape of the distribution remains the same across all of the datasets
discussed.
22
Chapter 5
HTTP Connections
In this chapter, we discuss various properties of the TCP connections underlying our HTTP
traffic. We start by examining some basic properties of the connections such as duration,
time from connection establishment until the first and last HTTP request is sent, and num-
ber of requests per connection. We continue by discussing connection parallelism both at
the client level and at the client/server pair level. In our ICSI dataset, we begin our exami-
nation of these properties starting in January of 2008 due to the logging issue described in
Section 3.1.
5.1 HTTP vs. TCP
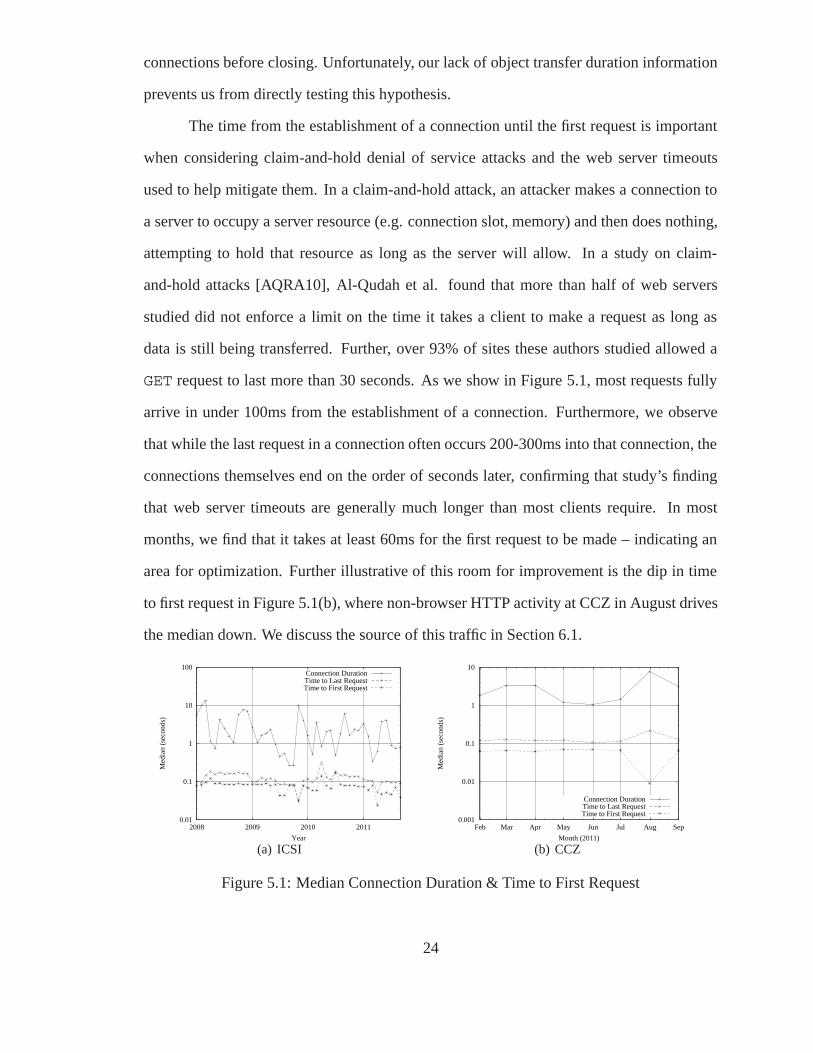
In Figure 5.1(a), we show the median connection duration and the median time from the
establishment of a connection until the first and last request is sent. The ICSI and the CCZ
data in Figure 5.1 are quite similar, with the median time to first request nearly always be-
tween 60 and 100ms. The time to last request is also consistent, typically between 100ms
and 200ms. We show a much longer median duration than time to last request however,
with median connection durations typically between 1 and 10 seconds. Given our knowl-
edge of object sizes from Section 4.2, we find it unlikely that this gap is consumed entirely
by the transfer of an object, indicating that there is substantial idle time at the end of many
23
connections before closing. Unfortunately, our lack of object transfer duration information
prevents us from directly testing this hypothesis.
The time from the establishment of a connection until the first request is important
when considering claim-and-hold denial of service attacks and the web server timeouts
used to help mitigate them. In a claim-and-hold attack, an attacker makes a connection to
a server to occupy a server resource (e.g. connection slot, memory) and then does nothing,
attempting to hold that resource as long as the server will allow. In a study on claim-
and-hold attacks [AQRA10], Al-Qudah et al. found that more than half of web servers
studied did not enforce a limit on the time it takes a client to make a request as long as
data is still being transferred. Further, over 93% of sites these authors studied allowed a
GET request to last more than 30 seconds. As we show in Figure 5.1, most requests fully
arrive in under 100ms from the establishment of a connection. Furthermore, we observe
that while the last request in a connection often occurs 200-300ms into that connection, the
connections themselves end on the order of seconds later, confirming that study’s finding
that web server timeouts are generally much longer than most clients require. In most
months, we find that it takes at least 60ms for the first request to be made – indicating an
area for optimization. Further illustrative of this room for improvement is the dip in time
to first request in Figure 5.1(b), where non-browser HTTP activity at CCZ in August drives
the median down. We discuss the source of this traffic in Section 6.1.
0.01
0.1
1
10
100
2008 2009 2010 2011
Med
ian
(sec
onds
)
Year
Connection DurationTime to Last RequestTime to First Request
(a) ICSI
0.001
0.01
0.1
1
10
Feb Mar Apr May Jun Jul Aug Sep
Med
ian
(sec
onds
)
Month (2011)
Connection DurationTime to Last RequestTime to First Request
(b) CCZ
Figure 5.1: Median Connection Duration & Time to First Request
24
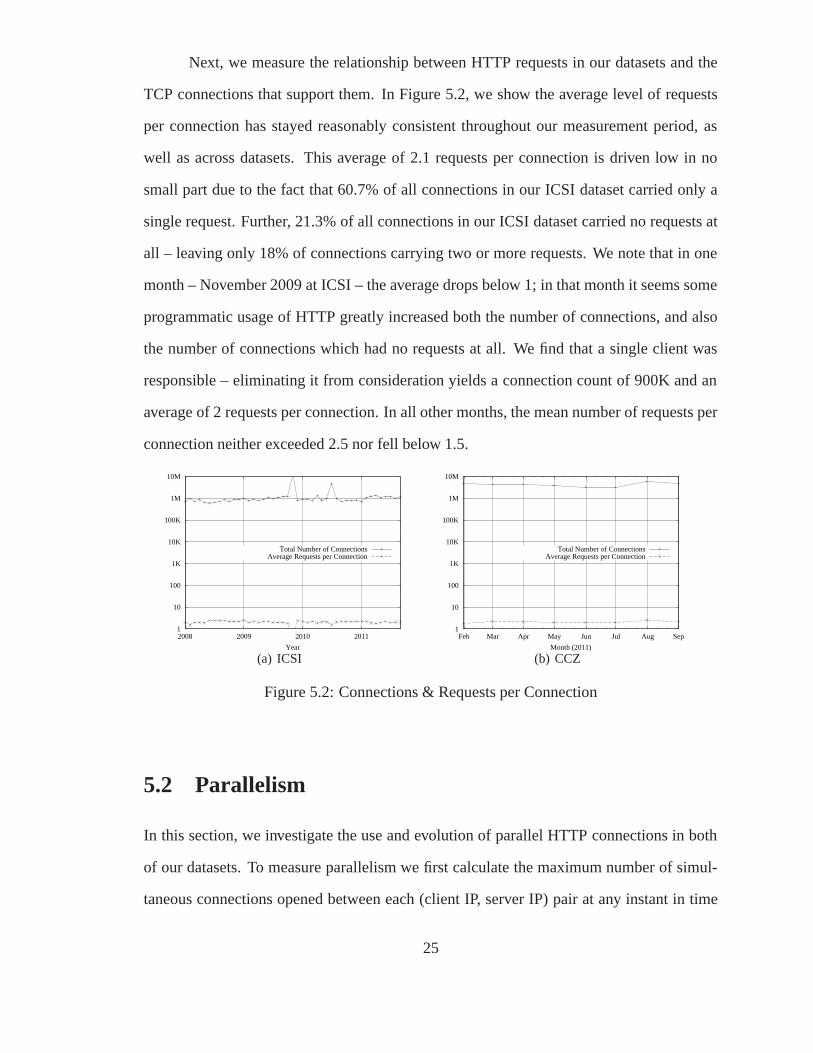
Next, we measure the relationship between HTTP requests in our datasets and the
TCP connections that support them. In Figure 5.2, we show the average level of requests
per connection has stayed reasonably consistent throughout our measurement period, as
well as across datasets. This average of 2.1 requests per connection is driven low in no
small part due to the fact that 60.7% of all connections in our ICSI dataset carried only a
single request. Further, 21.3% of all connections in our ICSI dataset carried no requests at
all – leaving only 18% of connections carrying two or more requests. We note that in one
month – November 2009 at ICSI – the average drops below 1; in that month it seems some
programmatic usage of HTTP greatly increased both the number of connections, and also
the number of connections which had no requests at all. We find that a single client was
responsible – eliminating it from consideration yields a connection count of 900K and an
average of 2 requests per connection. In all other months, the mean number of requests per
connection neither exceeded 2.5 nor fell below 1.5.
1
10
100
1K
10K
100K
1M
10M
2008 2009 2010 2011
Year
Total Number of ConnectionsAverage Requests per Connection
(a) ICSI
1
10
100
1K
10K
100K
1M
10M
Feb Mar Apr May Jun Jul Aug Sep
Month (2011)
Total Number of ConnectionsAverage Requests per Connection
(b) CCZ
Figure 5.2: Connections & Requests per Connection
5.2 Parallelism
In this section, we investigate the use and evolution of parallel HTTP connections in both
of our datasets. To measure parallelism we first calculate the maximum number of simul-
taneous connections opened between each (client IP, server IP) pair at any instant in time
25
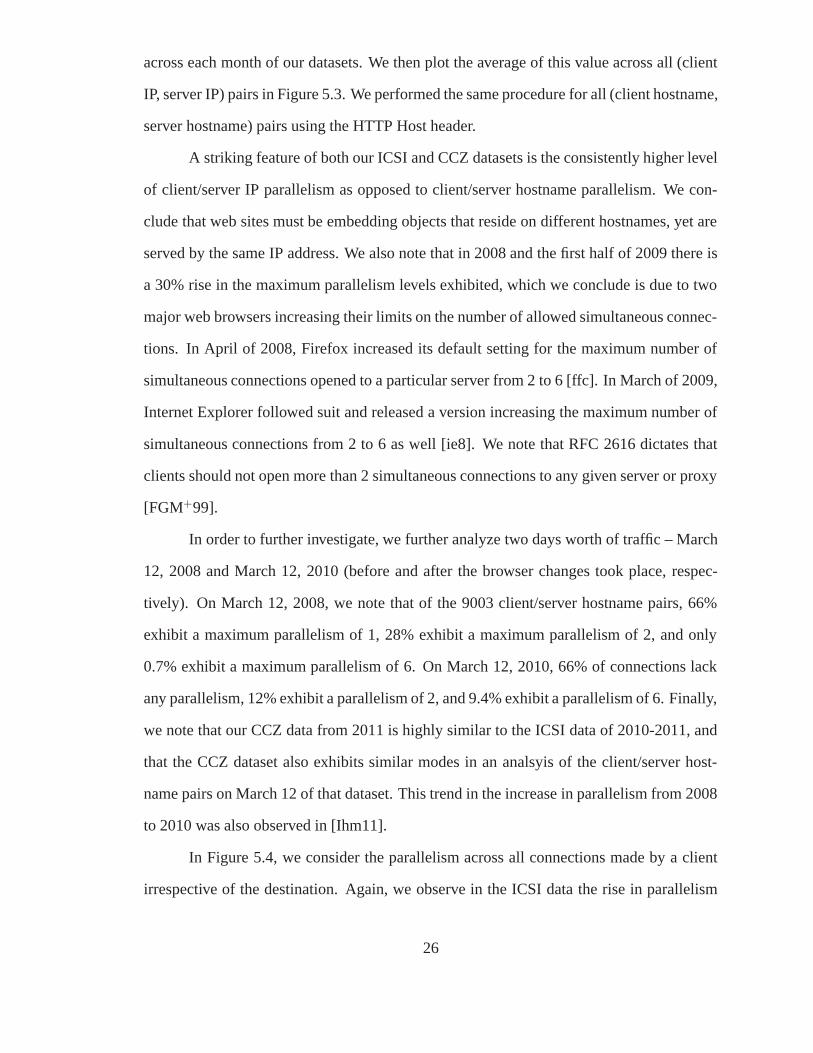
across each month of our datasets. We then plot the average of this value across all (client
IP, server IP) pairs in Figure 5.3. We performed the same procedure for all (client hostname,
server hostname) pairs using the HTTP Host header.
A striking feature of both our ICSI and CCZ datasets is the consistently higher level
of client/server IP parallelism as opposed to client/server hostname parallelism. We con-
clude that web sites must be embedding objects that reside on different hostnames, yet are
served by the same IP address. We also note that in 2008 and the first half of 2009 there is
a 30% rise in the maximum parallelism levels exhibited, which we conclude is due to two
major web browsers increasing their limits on the number of allowed simultaneous connec-
tions. In April of 2008, Firefox increased its default setting for the maximum number of
simultaneous connections opened to a particular server from 2 to 6 [ffc]. In March of 2009,
Internet Explorer followed suit and released a version increasing the maximum number of
simultaneous connections from 2 to 6 as well [ie8]. We note that RFC 2616 dictates that
clients should not open more than 2 simultaneous connections to any given server or proxy
[FGM+99].
In order to further investigate, we further analyze two days worth of traffic – March
12, 2008 and March 12, 2010 (before and after the browser changes took place, respec-
tively). On March 12, 2008, we note that of the 9003 client/server hostname pairs, 66%
exhibit a maximum parallelism of 1, 28% exhibit a maximum parallelism of 2, and only
0.7% exhibit a maximum parallelism of 6. On March 12, 2010, 66% of connections lack
any parallelism, 12% exhibit a parallelism of 2, and 9.4% exhibit a parallelism of 6. Finally,
we note that our CCZ data from 2011 is highly similar to the ICSI data of 2010-2011, and
that the CCZ dataset also exhibits similar modes in an analsyis of the client/server host-
name pairs on March 12 of that dataset. This trend in the increase in parallelism from 2008
to 2010 was also observed in [Ihm11].
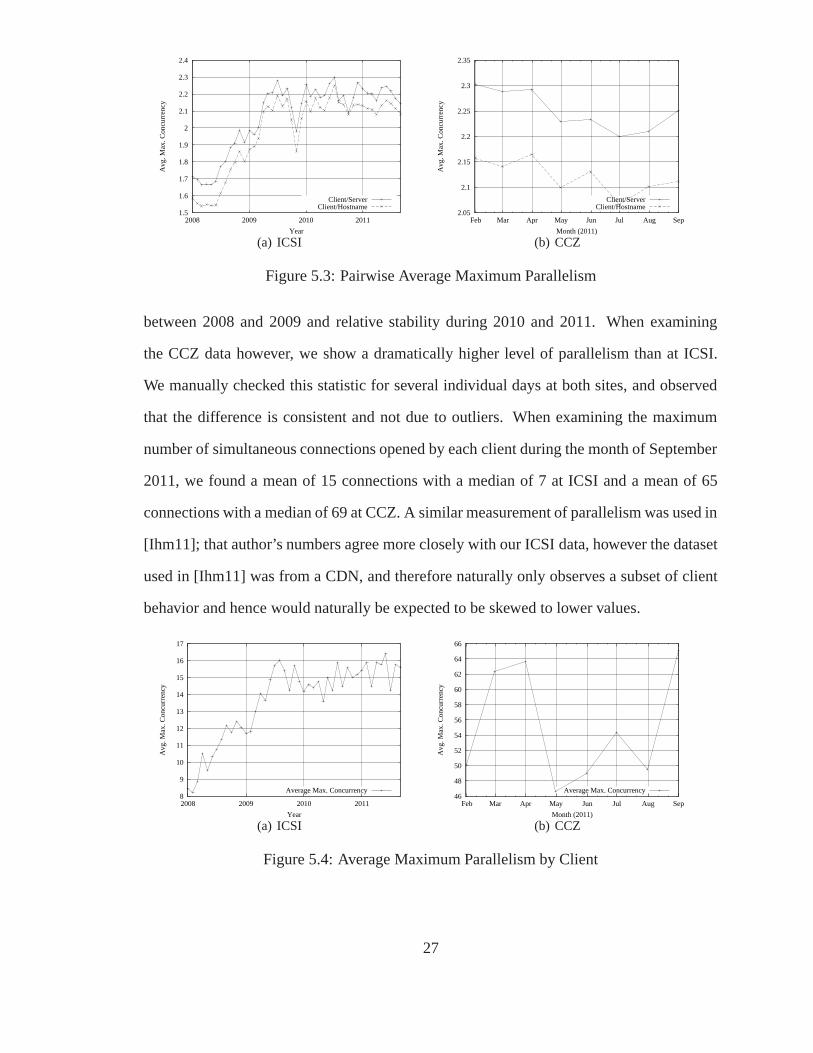
In Figure 5.4, we consider the parallelism across all connections made by a client
irrespective of the destination. Again, we observe in the ICSI data the rise in parallelism
26
1.5
1.6
1.7
1.8
1.9
2
2.1
2.2
2.3
2.4
2008 2009 2010 2011
Avg
. Max
. Con
curr
ency
Year
Client/ServerClient/Hostname
(a) ICSI
2.05
2.1
2.15
2.2
2.25
2.3
2.35
Feb Mar Apr May Jun Jul Aug Sep
Avg
. Max
. Con
curr
ency
Month (2011)
Client/ServerClient/Hostname
(b) CCZ
Figure 5.3: Pairwise Average Maximum Parallelism
between 2008 and 2009 and relative stability during 2010 and 2011. When examining
the CCZ data however, we show a dramatically higher level of parallelism than at ICSI.
We manually checked this statistic for several individual days at both sites, and observed
that the difference is consistent and not due to outliers. When examining the maximum
number of simultaneous connections opened by each client during the month of September
2011, we found a mean of 15 connections with a median of 7 at ICSI and a mean of 65
connections with a median of 69 at CCZ. A similar measurement of parallelism was used in
[Ihm11]; that author’s numbers agree more closely with our ICSI data, however the dataset
used in [Ihm11] was from a CDN, and therefore naturally only observes a subset of client
behavior and hence would naturally be expected to be skewed to lower values.
8
9
10
11
12
13
14
15
16
17
2008 2009 2010 2011
Avg
. Max
. Con
curr
ency
Year
Average Max. Concurrency
(a) ICSI
46
48
50
52
54
56
58
60
62
64
66
Feb Mar Apr May Jun Jul Aug Sep
Avg
. Max
. Con
curr
ency
Month (2011)
Average Max. Concurrency
(b) CCZ
Figure 5.4: Average Maximum Parallelism by Client
27
Chapter 6
Client Behavior
Here we discuss the characteristics of web traffic which are driven by the users (and to
an extent, the content creators) on the Internet. We will begin with an overview of some
of the most popular Top Level Domains (TLDs) and file extensions. For all tables, we
include an entry if it appeared in the Top-10 items in any year of the study such that we can
assess trends. We continue by discussing the distributions of requests to both objects and
hostnames on the Internet. Finally, we will discuss caching that is taking place on end-user
machines by measuring HTTP 304 responses, as well as the potential for in-network proxy
caches.
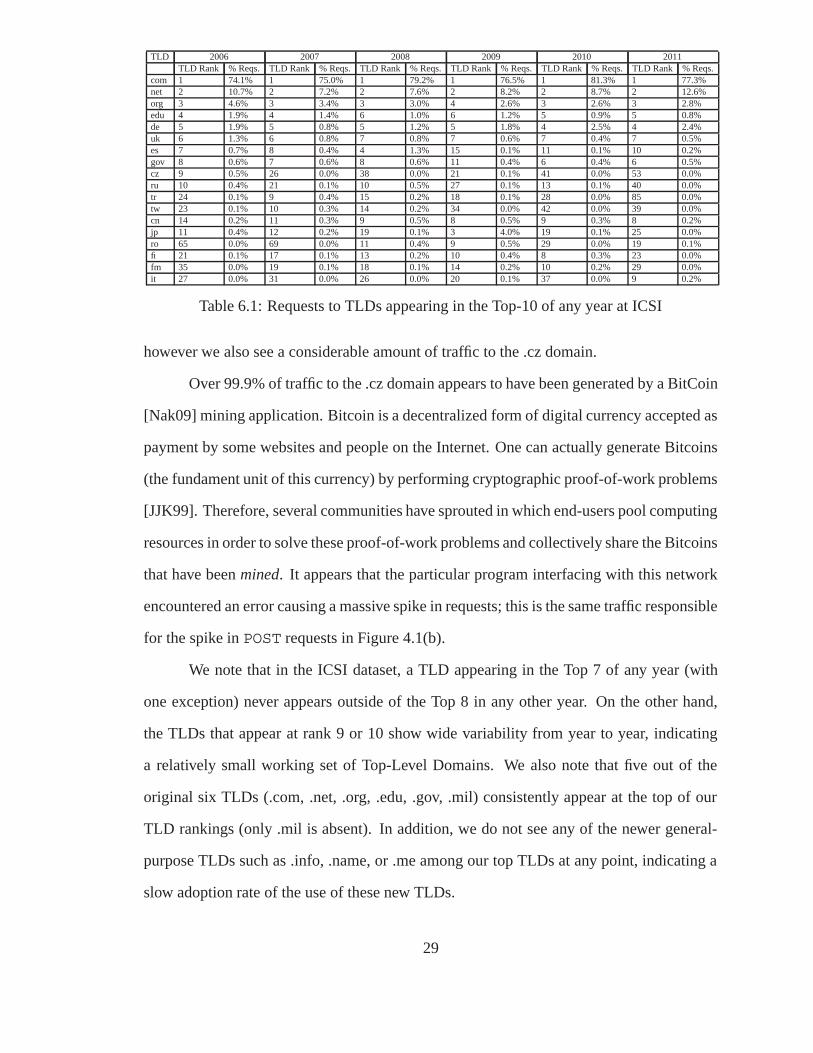
6.1 Top TLDs
In Table 6.1, we examine the most popular TLDs (e.g. .com, .net) at ICSI by the number of
requests local users sent. As we see in the top two lines, the .com and .net TLDs dominate
in every year, with .com responsible for 74%+ every year. Other TLDs that commonly
appear near the top of the list include .org, .edu, and .de (perhaps in part due to ICSI’s many
collaborations with researchers in Germany). With the exception of .gov, every other TLD
in our list corresponds to a country code TLD (ccTLD). Table 6.2 provides us with similar
information from CCZ; we again see the popular .com, .net, .org, and .edu extensions,
28
TLD 2006 2007 2008 2009 2010 2011TLD Rank % Reqs. TLD Rank % Reqs. TLD Rank % Reqs. TLD Rank % Reqs. TLD Rank % Reqs. TLD Rank % Reqs.
com 1 74.1% 1 75.0% 1 79.2% 1 76.5% 1 81.3% 1 77.3%net 2 10.7% 2 7.2% 2 7.6% 2 8.2% 2 8.7% 2 12.6%org 3 4.6% 3 3.4% 3 3.0% 4 2.6% 3 2.6% 3 2.8%edu 4 1.9% 4 1.4% 6 1.0% 6 1.2% 5 0.9% 5 0.8%de 5 1.9% 5 0.8% 5 1.2% 5 1.8% 4 2.5% 4 2.4%uk 6 1.3% 6 0.8% 7 0.8% 7 0.6% 7 0.4% 7 0.5%es 7 0.7% 8 0.4% 4 1.3% 15 0.1% 11 0.1% 10 0.2%gov 8 0.6% 7 0.6% 8 0.6% 11 0.4% 6 0.4% 6 0.5%cz 9 0.5% 26 0.0% 38 0.0% 21 0.1% 41 0.0% 53 0.0%ru 10 0.4% 21 0.1% 10 0.5% 27 0.1% 13 0.1% 40 0.0%tr 24 0.1% 9 0.4% 15 0.2% 18 0.1% 28 0.0% 85 0.0%tw 23 0.1% 10 0.3% 14 0.2% 34 0.0% 42 0.0% 39 0.0%cn 14 0.2% 11 0.3% 9 0.5% 8 0.5% 9 0.3% 8 0.2%jp 11 0.4% 12 0.2% 19 0.1% 3 4.0% 19 0.1% 25 0.0%ro 65 0.0% 69 0.0% 11 0.4% 9 0.5% 29 0.0% 19 0.1%fi 21 0.1% 17 0.1% 13 0.2% 10 0.4% 8 0.3% 23 0.0%fm 35 0.0% 19 0.1% 18 0.1% 14 0.2% 10 0.2% 29 0.0%it 27 0.0% 31 0.0% 26 0.0% 20 0.1% 37 0.0% 9 0.2%
Table 6.1: Requests to TLDs appearing in the Top-10 of any year at ICSI
however we also see a considerable amount of traffic to the .cz domain.
Over 99.9% of traffic to the .cz domain appears to have been generated by a BitCoin
[Nak09] mining application. Bitcoin is a decentralized form of digital currency accepted as
payment by some websites and people on the Internet. One can actually generate Bitcoins
(the fundament unit of this currency) by performing cryptographic proof-of-work problems
[JJK99]. Therefore, several communities have sprouted in which end-users pool computing
resources in order to solve these proof-of-work problems and collectively share the Bitcoins
that have been mined. It appears that the particular program interfacing with this network
encountered an error causing a massive spike in requests; this is the same traffic responsible
for the spike in POST requests in Figure 4.1(b).
We note that in the ICSI dataset, a TLD appearing in the Top 7 of any year (with
one exception) never appears outside of the Top 8 in any other year. On the other hand,
the TLDs that appear at rank 9 or 10 show wide variability from year to year, indicating
a relatively small working set of Top-Level Domains. We also note that five out of the
original six TLDs (.com, .net, .org, .edu, .gov, .mil) consistently appear at the top of our
TLD rankings (only .mil is absent). In addition, we do not see any of the newer general-
purpose TLDs such as .info, .name, or .me among our top TLDs at any point, indicating a
slow adoption rate of the use of these new TLDs.
29
TLD 2011TLD Rank % Total Reqs.
com 1 63.4%net 2 18.9%cz 3 11.5%org 4 1.6%cn 5 0.8%us 6 0.5%edu 7 0.4%tv 8 0.3%uk 9 0.2%kr 10 0.2%
Table 6.2: Top 10 TLDs at CCZ
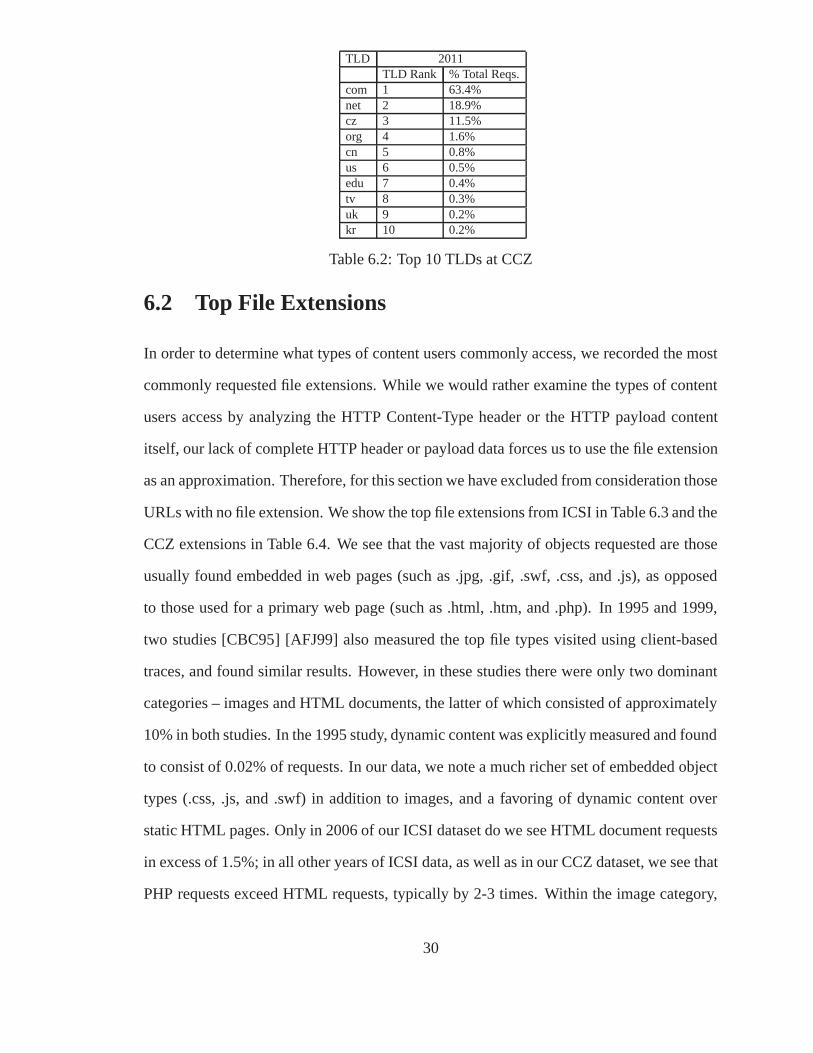
6.2 Top File Extensions
In order to determine what types of content users commonly access, we recorded the most
commonly requested file extensions. While we would rather examine the types of content
users access by analyzing the HTTP Content-Type header or the HTTP payload content
itself, our lack of complete HTTP header or payload data forces us to use the file extension
as an approximation. Therefore, for this section we have excluded from consideration those
URLs with no file extension. We show the top file extensions from ICSI in Table 6.3 and the
CCZ extensions in Table 6.4. We see that the vast majority of objects requested are those
usually found embedded in web pages (such as .jpg, .gif, .swf, .css, and .js), as opposed
to those used for a primary web page (such as .html, .htm, and .php). In 1995 and 1999,
two studies [CBC95] [AFJ99] also measured the top file types visited using client-based
traces, and found similar results. However, in these studies there were only two dominant
categories – images and HTML documents, the latter of which consisted of approximately
10% in both studies. In the 1995 study, dynamic content was explicitly measured and found
to consist of 0.02% of requests. In our data, we note a much richer set of embedded object
types (.css, .js, and .swf) in addition to images, and a favoring of dynamic content over
static HTML pages. Only in 2006 of our ICSI dataset do we see HTML document requests
in excess of 1.5%; in all other years of ICSI data, as well as in our CCZ dataset, we see that
PHP requests exceed HTML requests, typically by 2-3 times. Within the image category,
30
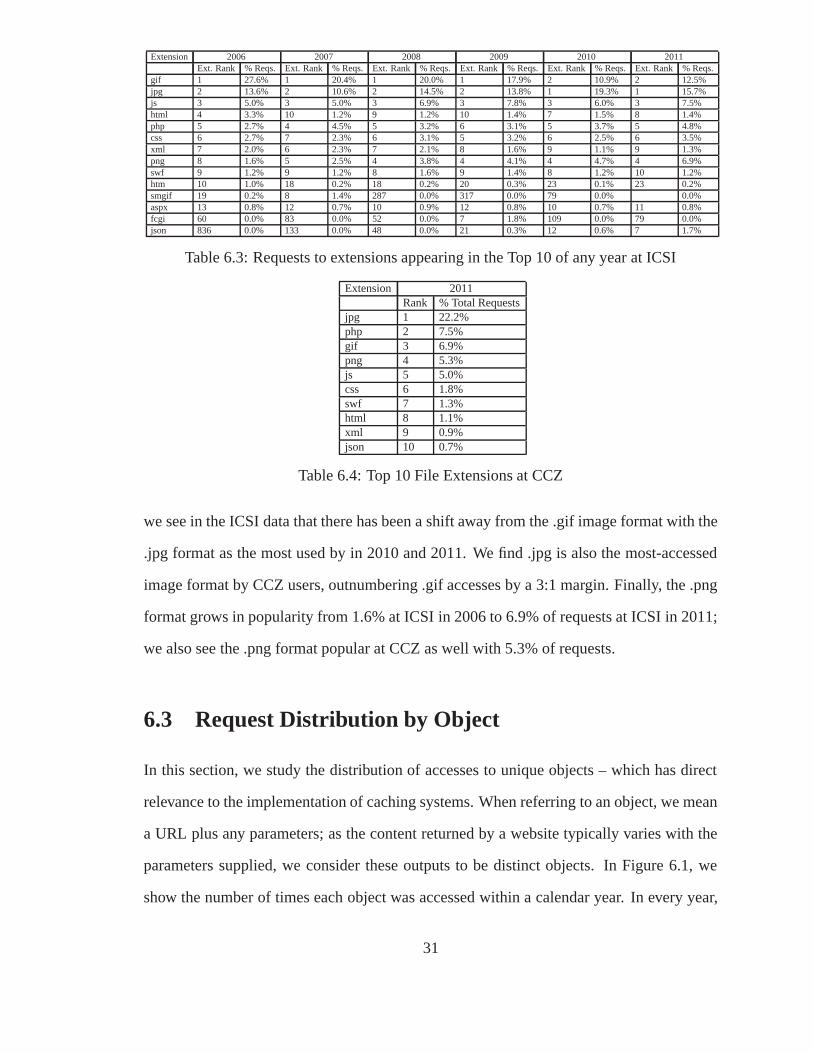
Extension 2006 2007 2008 2009 2010 2011Ext. Rank % Reqs. Ext. Rank % Reqs. Ext. Rank % Reqs. Ext. Rank % Reqs. Ext. Rank % Reqs. Ext. Rank % Reqs.
gif 1 27.6% 1 20.4% 1 20.0% 1 17.9% 2 10.9% 2 12.5%jpg 2 13.6% 2 10.6% 2 14.5% 2 13.8% 1 19.3% 1 15.7%js 3 5.0% 3 5.0% 3 6.9% 3 7.8% 3 6.0% 3 7.5%html 4 3.3% 10 1.2% 9 1.2% 10 1.4% 7 1.5% 8 1.4%php 5 2.7% 4 4.5% 5 3.2% 6 3.1% 5 3.7% 5 4.8%css 6 2.7% 7 2.3% 6 3.1% 5 3.2% 6 2.5% 6 3.5%xml 7 2.0% 6 2.3% 7 2.1% 8 1.6% 9 1.1% 9 1.3%png 8 1.6% 5 2.5% 4 3.8% 4 4.1% 4 4.7% 4 6.9%swf 9 1.2% 9 1.2% 8 1.6% 9 1.4% 8 1.2% 10 1.2%htm 10 1.0% 18 0.2% 18 0.2% 20 0.3% 23 0.1% 23 0.2%smgif 19 0.2% 8 1.4% 287 0.0% 317 0.0% 79 0.0% 0.0%aspx 13 0.8% 12 0.7% 10 0.9% 12 0.8% 10 0.7% 11 0.8%fcgi 60 0.0% 83 0.0% 52 0.0% 7 1.8% 109 0.0% 79 0.0%json 836 0.0% 133 0.0% 48 0.0% 21 0.3% 12 0.6% 7 1.7%
Table 6.3: Requests to extensions appearing in the Top 10 of any year at ICSI
Extension 2011Rank % Total Requests
jpg 1 22.2%php 2 7.5%gif 3 6.9%png 4 5.3%js 5 5.0%css 6 1.8%swf 7 1.3%html 8 1.1%xml 9 0.9%json 10 0.7%
Table 6.4: Top 10 File Extensions at CCZ
we see in the ICSI data that there has been a shift away from the .gif image format with the
.jpg format as the most used by in 2010 and 2011. We find .jpg is also the most-accessed
image format by CCZ users, outnumbering .gif accesses by a 3:1 margin. Finally, the .png
format grows in popularity from 1.6% at ICSI in 2006 to 6.9% of requests at ICSI in 2011;
we also see the .png format popular at CCZ as well with 5.3% of requests.
6.3 Request Distribution by Object
In this section, we study the distribution of accesses to unique objects – which has direct
relevance to the implementation of caching systems. When referring to an object, we mean
a URL plus any parameters; as the content returned by a website typically varies with the
parameters supplied, we consider these outputs to be distinct objects. In Figure 6.1, we
show the number of times each object was accessed within a calendar year. In every year,
31
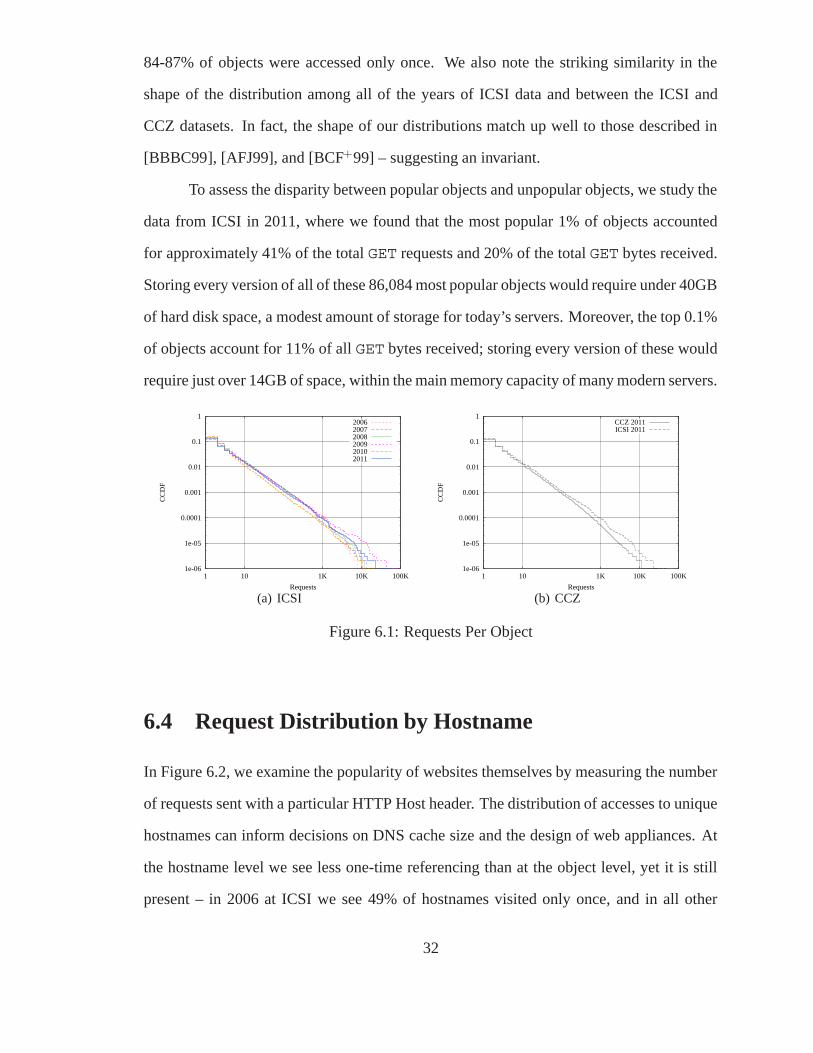
84-87% of objects were accessed only once. We also note the striking similarity in the
shape of the distribution among all of the years of ICSI data and between the ICSI and
CCZ datasets. In fact, the shape of our distributions match up well to those described in
[BBBC99], [AFJ99], and [BCF+99] – suggesting an invariant.
To assess the disparity between popular objects and unpopular objects, we study the
data from ICSI in 2011, where we found that the most popular 1% of objects accounted
for approximately 41% of the total GET requests and 20% of the total GET bytes received.
Storing every version of all of these 86,084 most popular objects would require under 40GB
of hard disk space, a modest amount of storage for today’s servers. Moreover, the top 0.1%
of objects account for 11% of all GET bytes received; storing every version of these would
require just over 14GB of space, within the main memory capacity of many modern servers.
1e-06
1e-05
0.0001
0.001
0.01
0.1
1
1 10 1K 10K 100K
CC
DF
Requests
200620072008200920102011
(a) ICSI
1e-06
1e-05
0.0001
0.001
0.01
0.1
1
1 10 1K 10K 100K
CC
DF
Requests
CCZ 2011ICSI 2011
(b) CCZ
Figure 6.1: Requests Per Object
6.4 Request Distribution by Hostname
In Figure 6.2, we examine the popularity of websites themselves by measuring the number
of requests sent with a particular HTTP Host header. The distribution of accesses to unique
hostnames can inform decisions on DNS cache size and the design of web appliances. At
the hostname level we see less one-time referencing than at the object level, yet it is still
present – in 2006 at ICSI we see 49% of hostnames visited only once, and in all other
32
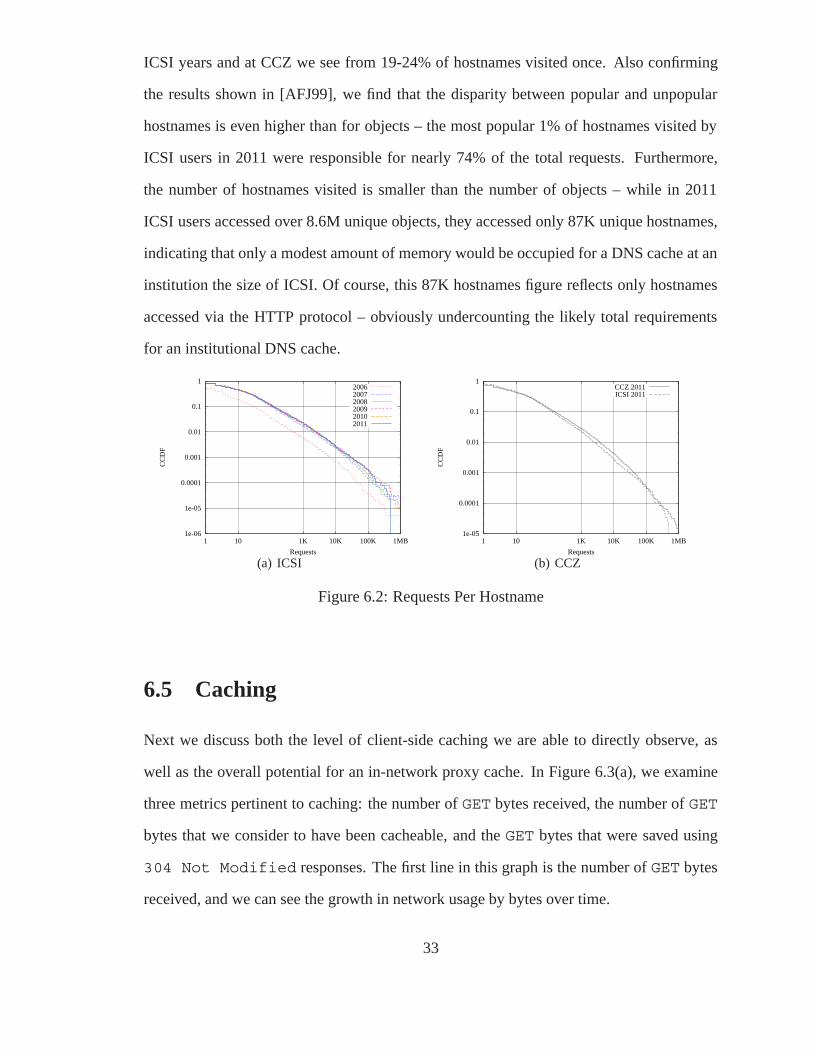
ICSI years and at CCZ we see from 19-24% of hostnames visited once. Also confirming
the results shown in [AFJ99], we find that the disparity between popular and unpopular
hostnames is even higher than for objects – the most popular 1% of hostnames visited by
ICSI users in 2011 were responsible for nearly 74% of the total requests. Furthermore,
the number of hostnames visited is smaller than the number of objects – while in 2011
ICSI users accessed over 8.6M unique objects, they accessed only 87K unique hostnames,
indicating that only a modest amount of memory would be occupied for a DNS cache at an
institution the size of ICSI. Of course, this 87K hostnames figure reflects only hostnames
accessed via the HTTP protocol – obviously undercounting the likely total requirements
for an institutional DNS cache.
1e-06
1e-05
0.0001
0.001
0.01
0.1
1
1 10 1K 10K 100K 1MB
CC
DF
Requests
200620072008200920102011
(a) ICSI
1e-05
0.0001
0.001
0.01
0.1
1
1 10 1K 10K 100K 1MB
CC
DF
Requests
CCZ 2011ICSI 2011
(b) CCZ
Figure 6.2: Requests Per Hostname
6.5 Caching
Next we discuss both the level of client-side caching we are able to directly observe, as
well as the overall potential for an in-network proxy cache. In Figure 6.3(a), we examine
three metrics pertinent to caching: the number of GET bytes received, the number of GET
bytes that we consider to have been cacheable, and the GET bytes that were saved using
304 Not Modified responses. The first line in this graph is the number of GET bytes
received, and we can see the growth in network usage by bytes over time.
33
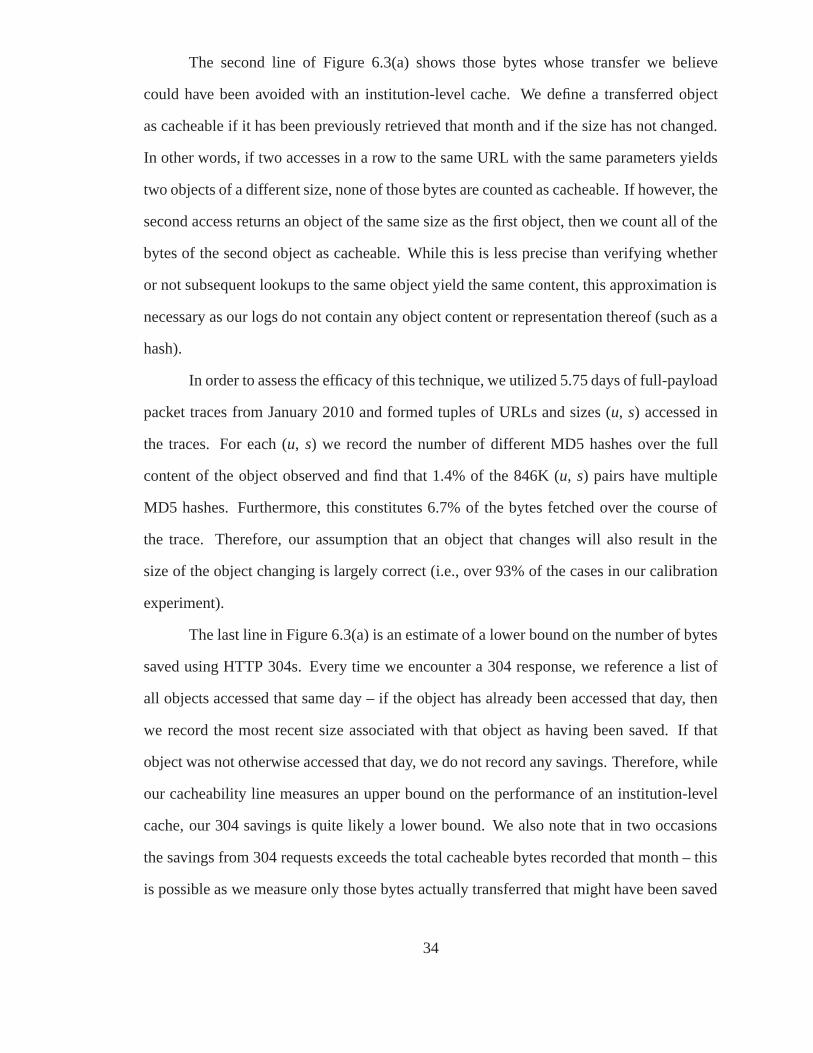
The second line of Figure 6.3(a) shows those bytes whose transfer we believe
could have been avoided with an institution-level cache. We define a transferred object
as cacheable if it has been previously retrieved that month and if the size has not changed.
In other words, if two accesses in a row to the same URL with the same parameters yields
two objects of a different size, none of those bytes are counted as cacheable. If however, the
second access returns an object of the same size as the first object, then we count all of the
bytes of the second object as cacheable. While this is less precise than verifying whether
or not subsequent lookups to the same object yield the same content, this approximation is
necessary as our logs do not contain any object content or representation thereof (such as a
hash).
In order to assess the efficacy of this technique, we utilized 5.75 days of full-payload
packet traces from January 2010 and formed tuples of URLs and sizes (u, s) accessed in
the traces. For each (u, s) we record the number of different MD5 hashes over the full
content of the object observed and find that 1.4% of the 846K (u, s) pairs have multiple
MD5 hashes. Furthermore, this constitutes 6.7% of the bytes fetched over the course of
the trace. Therefore, our assumption that an object that changes will also result in the
size of the object changing is largely correct (i.e., over 93% of the cases in our calibration
experiment).
The last line in Figure 6.3(a) is an estimate of a lower bound on the number of bytes
saved using HTTP 304s. Every time we encounter a 304 response, we reference a list of
all objects accessed that same day – if the object has already been accessed that day, then
we record the most recent size associated with that object as having been saved. If that
object was not otherwise accessed that day, we do not record any savings. Therefore, while
our cacheability line measures an upper bound on the performance of an institution-level
cache, our 304 savings is quite likely a lower bound. We also note that in two occasions
the savings from 304 requests exceeds the total cacheable bytes recorded that month – this
is possible as we measure only those bytes actually transferred that might have been saved
34
by a cache, without including those bytes already saved by 304s.
As we can see in Figure 6.3(a), the raw number of bytes transferred has increased
steadily over the course of the study. The number of potentially cacheable bytes has in-
creased at a similar rate. The savings in transferred bytes due to 304 responses appears to
have also kept pace, falling somewhat towards the end of our measurement period. Notable
also is the distance between the cacheable bytes and 304 savings lines throughout much of
the study – we see that an institution-level cache has much more potential for performance
than we see from the browser-level caching utilizing HTTP 304 requests. Figure 6.3(b)
shows us similar data for CCZ. The traffic volumes are less volatile within CCZ, but we
find a similar pattern in the differences between the lines across the ICSI and CCZ datasets.
We note that at both vantage points, a shared proxy cache would not need more than 100GB
of storage – well within the capabilities of a modern server.
100MB
1GB
10GB
100GB
2006 2007 2008 2009 2010 2011
Byt
es
Year
Total Bytes/month from GET ResponsesTotal Cacheable Bytes/month (GET)
Approx. Bytes saved from HTTP 304s
(a) ICSI
100MB
1GB
10GB
100GB
1TB
Feb Mar Apr May Jun Jul Aug Sep
Byt
es
Year
Total Bytes/month from GET ResponsesTotal Cacheable Bytes/month (GET)
Approx. Bytes saved from HTTP 304s
(b) CCZ
Figure 6.3: Caching
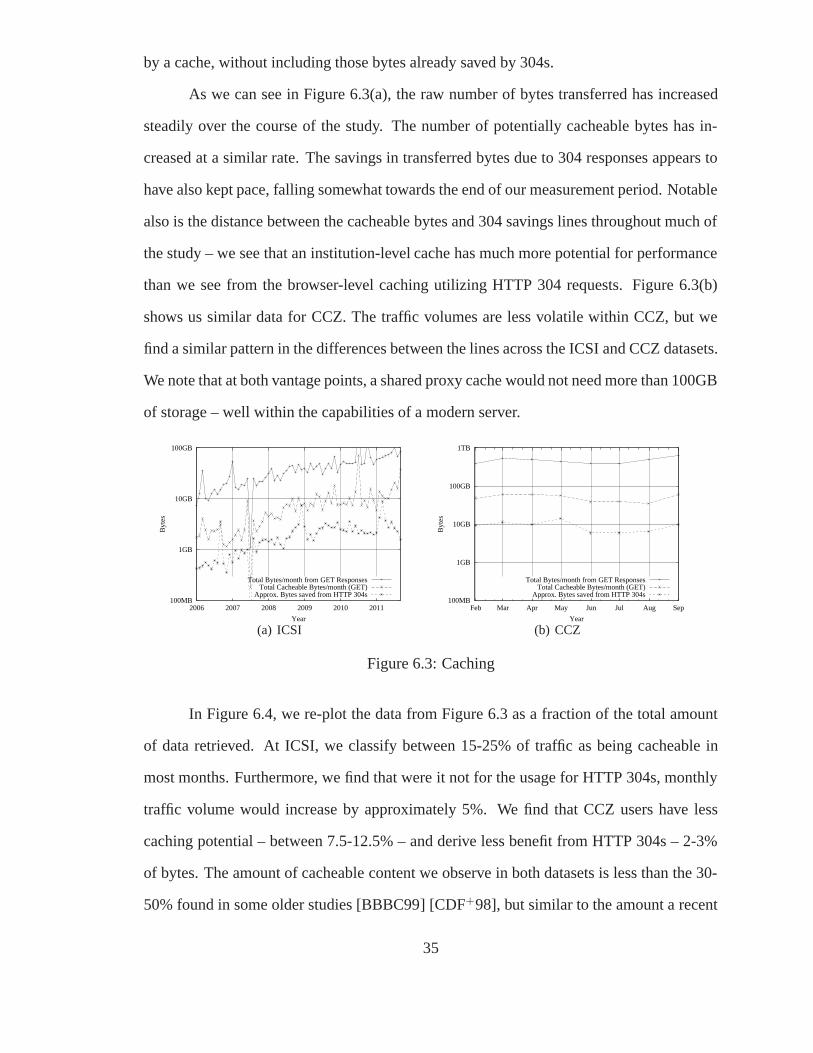
In Figure 6.4, we re-plot the data from Figure 6.3 as a fraction of the total amount
of data retrieved. At ICSI, we classify between 15-25% of traffic as being cacheable in
most months. Furthermore, we find that were it not for the usage for HTTP 304s, monthly
traffic volume would increase by approximately 5%. We find that CCZ users have less
caching potential – between 7.5-12.5% – and derive less benefit from HTTP 304s – 2-3%
of bytes. The amount of cacheable content we observe in both datasets is less than the 30-
50% found in some older studies [BBBC99] [CDF+98], but similar to the amount a recent
35
study [Ihm11] found to be possible for an HTTP object-level cache.
0 %
5 %
10 %
15 %
20 %
25 %
30 %
35 %
40 %
2006 2007 2008 2009 2010 2011
% o
f T
otal
GE
T B
ytes
Year
Total Cacheable Bytes/monthHTTP 304 Savings
(a) ICSI
0 %
5 %
10 %
15 %
20 %
Feb Mar Apr May Jun Jul Aug Sep
% o
f T
otal
GE
T B
ytes
Month (2011)
Total Cacheable Bytes/monthHTTP 304 Savings
(b) CCZ
Figure 6.4: Caching Ratios
36
Chapter 7
Server Structure
In this chapter, we study the relationships between websites (such as www.cnn.com) and
the physical servers that send content on the websites’ behalf by examining their hostnames
and IP addresses, respectively. We begin by observing the distribution of the number of
objects served by each website. We then look at the extent to which replication and CDN-
like technologies are used to distribute the load of a website to many physical servers, as
well as the extent to which the servers themselves are shared by multiple websites. Finally,
we pick a single CDN (Akamai [DMP+02]) and measure the level of traffic received from
this CDN.
7.1 Object Concentration
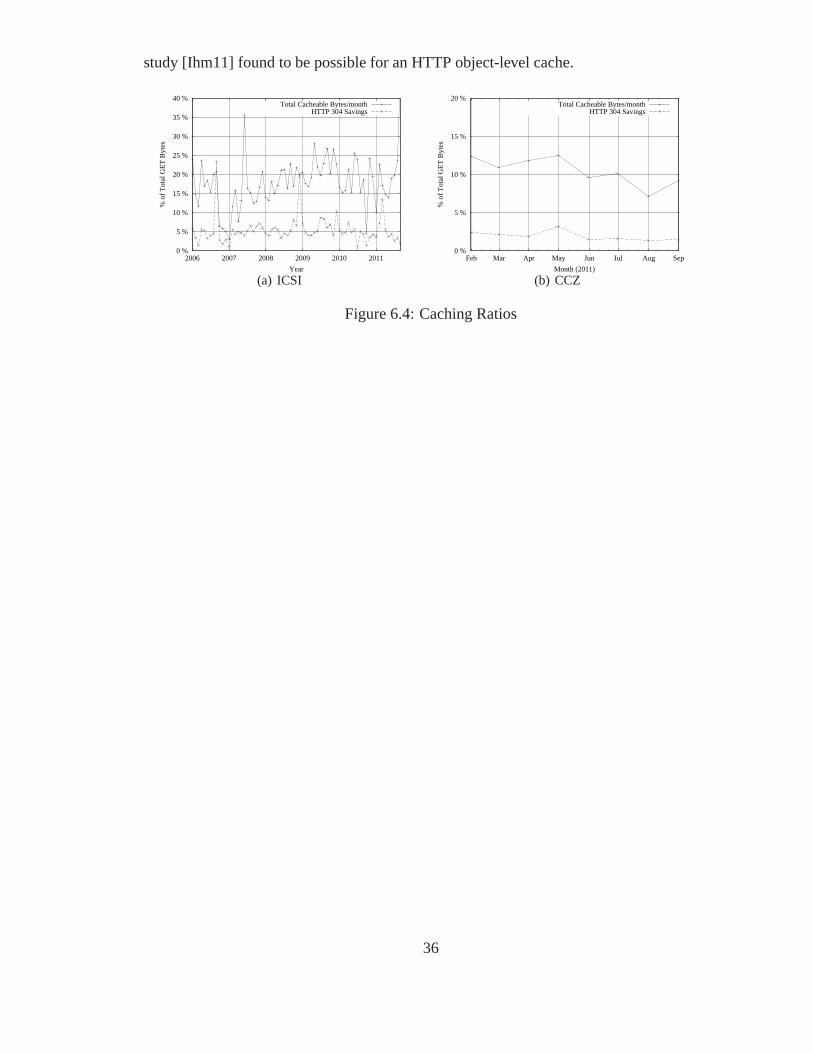
Figure 7.1 shows the distribution of the number of distinct objects1 requested from each
website hostname. At ICSI, in all years except 2006, we find that roughly 30% of websites
serve only a single object to our entire user population. Approximately 72% of websites
serve 10 or fewer objects, and roughly 1% serve 1,000 or more objects, with some websites
serving hundreds of thousands of distinct objects. We were able to find no discernable
1It is important to note that we consider any distinct set of (URL, client-supplied parameters) to be adistinct object, as one would expect the output of a page to vary with the parameters given.
37
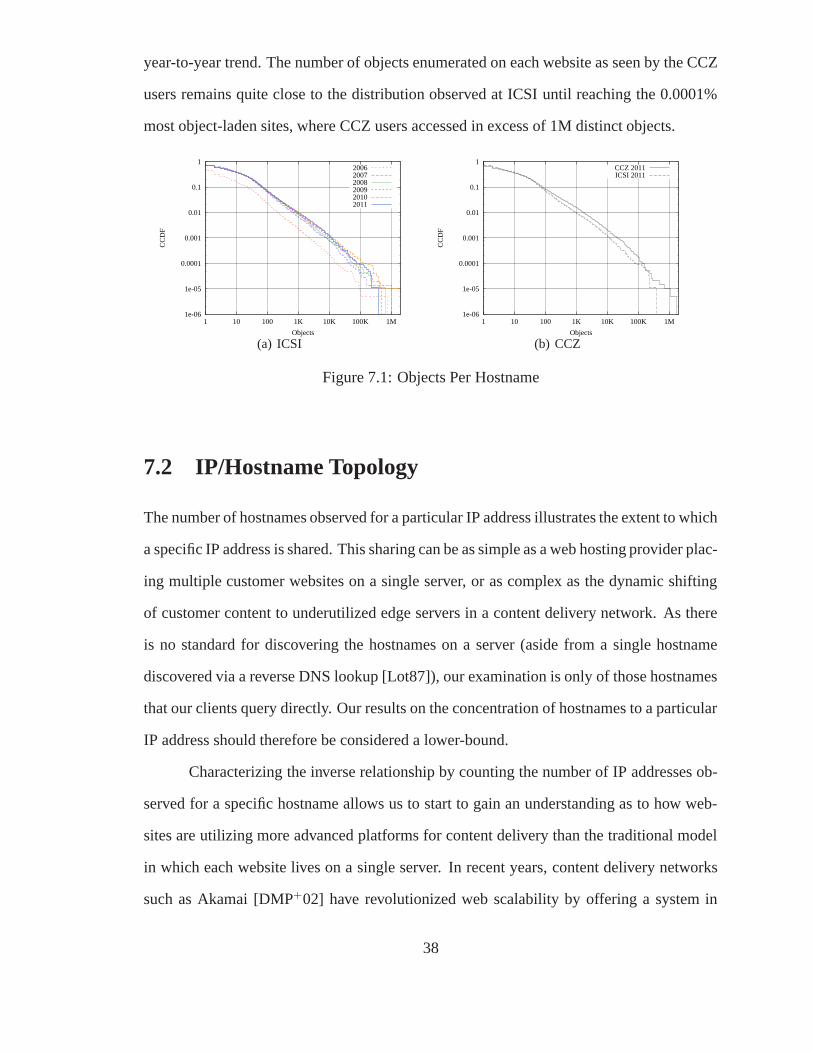
year-to-year trend. The number of objects enumerated on each website as seen by the CCZ
users remains quite close to the distribution observed at ICSI until reaching the 0.0001%
most object-laden sites, where CCZ users accessed in excess of 1M distinct objects.
1e-06
1e-05
0.0001
0.001
0.01
0.1
1
1 10 100 1K 10K 100K 1M
CC
DF
Objects
200620072008200920102011
(a) ICSI
1e-06
1e-05
0.0001
0.001
0.01
0.1
1
1 10 100 1K 10K 100K 1M
CC
DF
Objects
CCZ 2011ICSI 2011
(b) CCZ
Figure 7.1: Objects Per Hostname
7.2 IP/Hostname Topology
The number of hostnames observed for a particular IP address illustrates the extent to which
a specific IP address is shared. This sharing can be as simple as a web hosting provider plac-
ing multiple customer websites on a single server, or as complex as the dynamic shifting
of customer content to underutilized edge servers in a content delivery network. As there
is no standard for discovering the hostnames on a server (aside from a single hostname
discovered via a reverse DNS lookup [Lot87]), our examination is only of those hostnames
that our clients query directly. Our results on the concentration of hostnames to a particular
IP address should therefore be considered a lower-bound.
Characterizing the inverse relationship by counting the number of IP addresses ob-
served for a specific hostname allows us to start to gain an understanding as to how web-
sites are utilizing more advanced platforms for content delivery than the traditional model
in which each website lives on a single server. In recent years, content delivery networks
such as Akamai [DMP+02] have revolutionized web scalability by offering a system in
38
which users of a client’s website are automatically redirected to one of thousands of pos-
sible servers to retrieve that website’s content. Similarly, services such as Amazon EC2
[ec2] (better known as a cloud) provide a flexible set of distribued virtual machines for use
by clients – enabling both websites and custom applications to run in a distributed fashion.
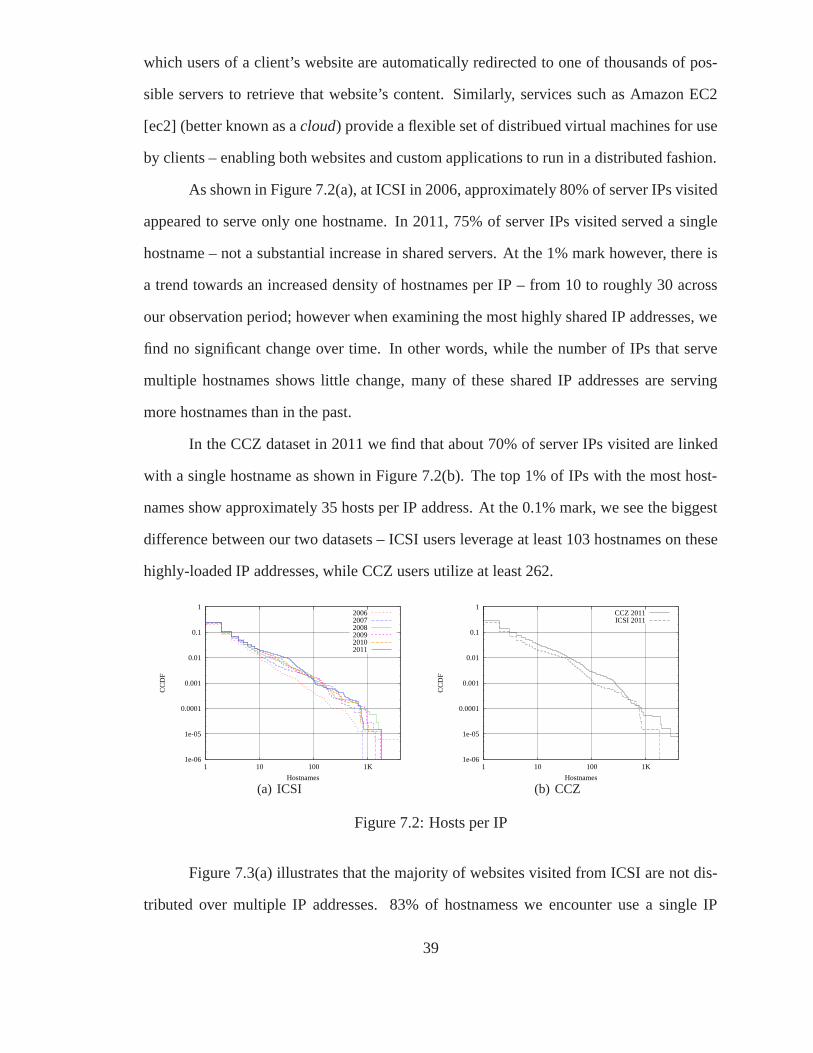
As shown in Figure 7.2(a), at ICSI in 2006, approximately 80% of server IPs visited
appeared to serve only one hostname. In 2011, 75% of server IPs visited served a single
hostname – not a substantial increase in shared servers. At the 1% mark however, there is
a trend towards an increased density of hostnames per IP – from 10 to roughly 30 across
our observation period; however when examining the most highly shared IP addresses, we
find no significant change over time. In other words, while the number of IPs that serve
multiple hostnames shows little change, many of these shared IP addresses are serving
more hostnames than in the past.
In the CCZ dataset in 2011 we find that about 70% of server IPs visited are linked
with a single hostname as shown in Figure 7.2(b). The top 1% of IPs with the most host-
names show approximately 35 hosts per IP address. At the 0.1% mark, we see the biggest
difference between our two datasets – ICSI users leverage at least 103 hostnames on these
highly-loaded IP addresses, while CCZ users utilize at least 262.
1e-06
1e-05
0.0001
0.001
0.01
0.1
1
1 10 100 1K
CC
DF
Hostnames
200620072008200920102011
(a) ICSI
1e-06
1e-05
0.0001
0.001
0.01
0.1
1
1 10 100 1K
CC
DF
Hostnames
CCZ 2011ICSI 2011
(b) CCZ
Figure 7.2: Hosts per IP
Figure 7.3(a) illustrates that the majority of websites visited from ICSI are not dis-
tributed over multiple IP addresses. 83% of hostnamess we encounter use a single IP
39
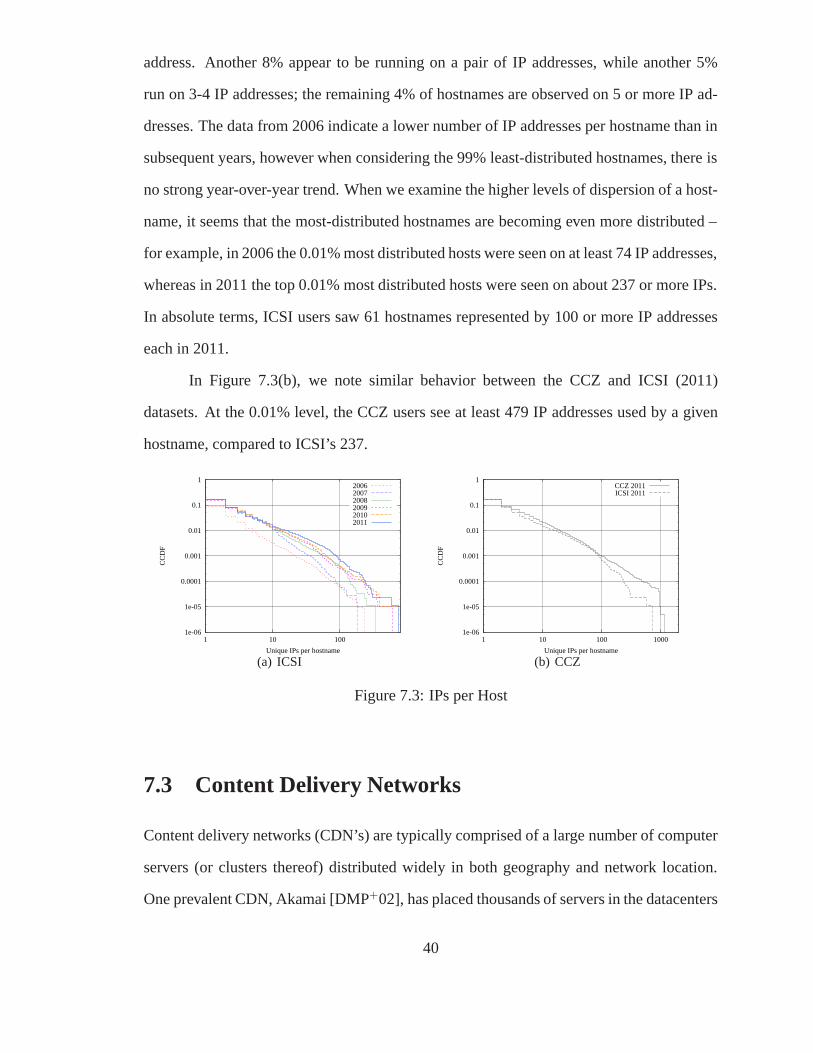
address. Another 8% appear to be running on a pair of IP addresses, while another 5%
run on 3-4 IP addresses; the remaining 4% of hostnames are observed on 5 or more IP ad-
dresses. The data from 2006 indicate a lower number of IP addresses per hostname than in
subsequent years, however when considering the 99% least-distributed hostnames, there is
no strong year-over-year trend. When we examine the higher levels of dispersion of a host-
name, it seems that the most-distributed hostnames are becoming even more distributed –
for example, in 2006 the 0.01% most distributed hosts were seen on at least 74 IP addresses,
whereas in 2011 the top 0.01% most distributed hosts were seen on about 237 or more IPs.
In absolute terms, ICSI users saw 61 hostnames represented by 100 or more IP addresses
each in 2011.
In Figure 7.3(b), we note similar behavior between the CCZ and ICSI (2011)
datasets. At the 0.01% level, the CCZ users see at least 479 IP addresses used by a given
hostname, compared to ICSI’s 237.
1e-06
1e-05
0.0001
0.001
0.01
0.1
1
1 10 100
CC
DF
Unique IPs per hostname
200620072008200920102011
(a) ICSI
1e-06
1e-05
0.0001
0.001
0.01
0.1
1
1 10 100 1000
CC
DF
Unique IPs per hostname
CCZ 2011ICSI 2011
(b) CCZ
Figure 7.3: IPs per Host
7.3 Content Delivery Networks
Content delivery networks (CDN’s) are typically comprised of a large number of computer
servers (or clusters thereof) distributed widely in both geography and network location.
One prevalent CDN, Akamai [DMP+02], has placed thousands of servers in the datacenters
40
of Internet service providers around the world in an effort to maintain a presence in the
edge of the Internet. Akamai’s customers pay for their content to be served by Akamai,
and allow Akamai to control the DNS names used for these customer websites. When
Akamai receives a DNS request for a customer’s domain name, it replies with the address
of one of these Akamai edge servers that has the desired content, the capacity to handle
the request, and has an acceptable network latency to the client. By this scheme, Akamai’s
customers have access to immense aggregate network capacity to serve clients, and the
diverse set of edge servers means that the set of clients will likely see a lower round-trip
time (and therefore better performance) than if requests were served by machine(s) at a
single location.
Akamai claims to deliver between 15-30% of the world’s Internet traffic at any given
time, according to a report published on their website [aka11]. In order to test this claim,
we utilize logs of DNS queries made at both of our measurement sites. When we encounter
a DNS lookup that returns a CNAME in a manually compiled list [Tri09] of CNAMEs used
by Akamai, we flag that IP address as an Akamai edge server. For example, when resolving
the host ak.buy.com (known at the time of writing to be an Akamai customer), we see in the
DNS response a CNAME for a1554.b.akamai.net. This akamai.net domain suffix is one of
several manually gathered by performing DNS lookups on known Akamai customers.
Figure 7.4(a) illustrates the percentage of bytes received from known Akamai edge
servers in GET requests from the total bytes received in GET requests that month at ICSI.
We stress that this is a lower bound on traffic received from Akamai – there may be traffic
from Akamai that did not exhibit a DNS redirection to a CNAME in our list, and would
therefore be misclassified as non-Akamai traffic. Even so, it appears that Akamai’s claim
that it send 15-30% of bytes sent worldwide is reasonable. In the ICSI data, we find that
after 2006, measured Akamai traffic almost never falls below 15%. While we see two
sharp dips in Akamai traffic in 2010, these dips are the result of spikes in non-Akamai
traffic driving down Akamai’s measured proportion of traffic, not from a reduction in raw
41
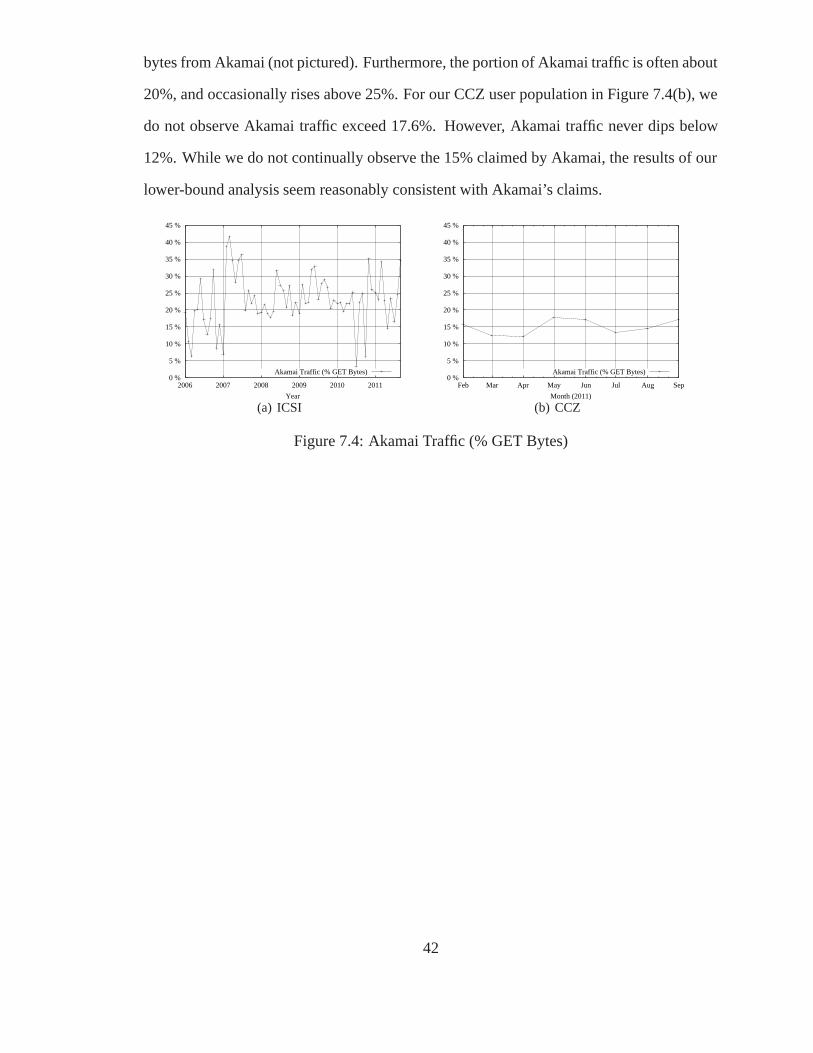
bytes from Akamai (not pictured). Furthermore, the portion of Akamai traffic is often about
20%, and occasionally rises above 25%. For our CCZ user population in Figure 7.4(b), we
do not observe Akamai traffic exceed 17.6%. However, Akamai traffic never dips below
12%. While we do not continually observe the 15% claimed by Akamai, the results of our
lower-bound analysis seem reasonably consistent with Akamai’s claims.
0 %
5 %
10 %
15 %
20 %
25 %
30 %
35 %
40 %
45 %
2006 2007 2008 2009 2010 2011
Year
Akamai Traffic (% GET Bytes)
(a) ICSI
0 %
5 %
10 %
15 %
20 %
25 %
30 %
35 %
40 %
45 %
Feb Mar Apr May Jun Jul Aug Sep
Month (2011)
Akamai Traffic (% GET Bytes)
(b) CCZ
Figure 7.4: Akamai Traffic (% GET Bytes)
42
Chapter 8
Summary
In this study we examined over five years of web activity from one vantage point and eight
months from another in order to assess web use via several metrics. We both compare our
results with existing work in the field and provide a much higher resolution view of changes
over time than previous studies. We studied evolving/dynamic properties of the web and
highlighted a number of trends.
In Chapters 3 and 4, we observed an increase in nearly all raw counts such as num-
ber of requests, number of bytes, etc. In Chapter 3, we showed that HTTPS connections
increased in number in 2010-2011. We observed that average transaction sizes have tended
to increase over the course of our study in Section 4.2, while finding no discernible pattern
in median transaction sizes. Our study of connection parallelism in Section 5.2 was able
to track the increases in parallelism made by changed in popular web browsers in 2008. In
Section 6.2, we studied popular object types and observed a trend towards dynamic content
and newer image formats.
We also found many properties that exhibited little change over the course of the
study. First, we noted that the shape of the distribution of object sizes stayed the same
over all years and at both vantage points. Second, we observed that the average number of
requests per connection stayed around 2 for most months at both vantage points. Third, the
43

original Internet TLDs remain the most popular, .com and .net in particular. Fourth, images
remain the commonly requested type of file. Finally, the shapes of the distributions of both
object and hostname popularity remain static.
We also examined the structure of the web, finding that top websites are distributing
content from a wider set of sources than in years past. We investigated the claims of a major
CDN, finding its claims of traffic volume realistic. While we have not examined every
aspect of web use, we believe that our contribution will assist in grounding the community’s
mental models and experiments in long-term empirical observation.
44
Chapter 9
Future Work
There are many avenues related to the research in this thesis that remain unexplored. More-
over, given the differences among the possible vantage points for studies such as this one,
there is always the potential for the same experiments to yield different results for differ-
ent user populations. Indeed, the vantage points used in this study did not yield the same
results. Aside from the expansion of this study to additional vantage points, we discuss
several possible directions that merit further investigation.
Primary/Secondary Object Classification: Some other works such as [HCJS03] per-
form separate analysis on primary objects (i.e., the page a user actually visits) vs secondary
or embedded objects. While our limited header data and lack of full content complicate
differentiating the two, if we were able to infer this difference from our data we would be
able to provide a more meaningful analysis of the most popular websites. In addition, this
would allow us to analyze the use of generic web objects referenced from many websites
(such as advertisements or analytic software).
Distinction between automatic and user-generated requests: Users on today’s web
are not the only drivers of traffic. The proliferation of AJAX applications, as well as the
usage of HTTP as a transport for other applications using technologies such as SOAP
[BEK+00] has caused much web traffic to be application-driven. We would like to explore
45
the differences between this application-driven and user-driven traffic.
Page Load Times: If we were able to enumerate the primary and embedded objects
of complete web pages, we could measure the loading time required for the pages of differ-
ent websites. This would allow us to evaluate the impact of certain design decisions such
as using multiple subdomains to serve embedded objects.
Analysis of multiple CDNs: Akamai is not the only major CDN in the world. Lime-
light is well known to be the primary CDN for Netflix, while Google operates its own CDN
for services such as Gmail and Youtube. Studying these CDNs as well would yield a better
view of the world’s largest traffic sources.
46
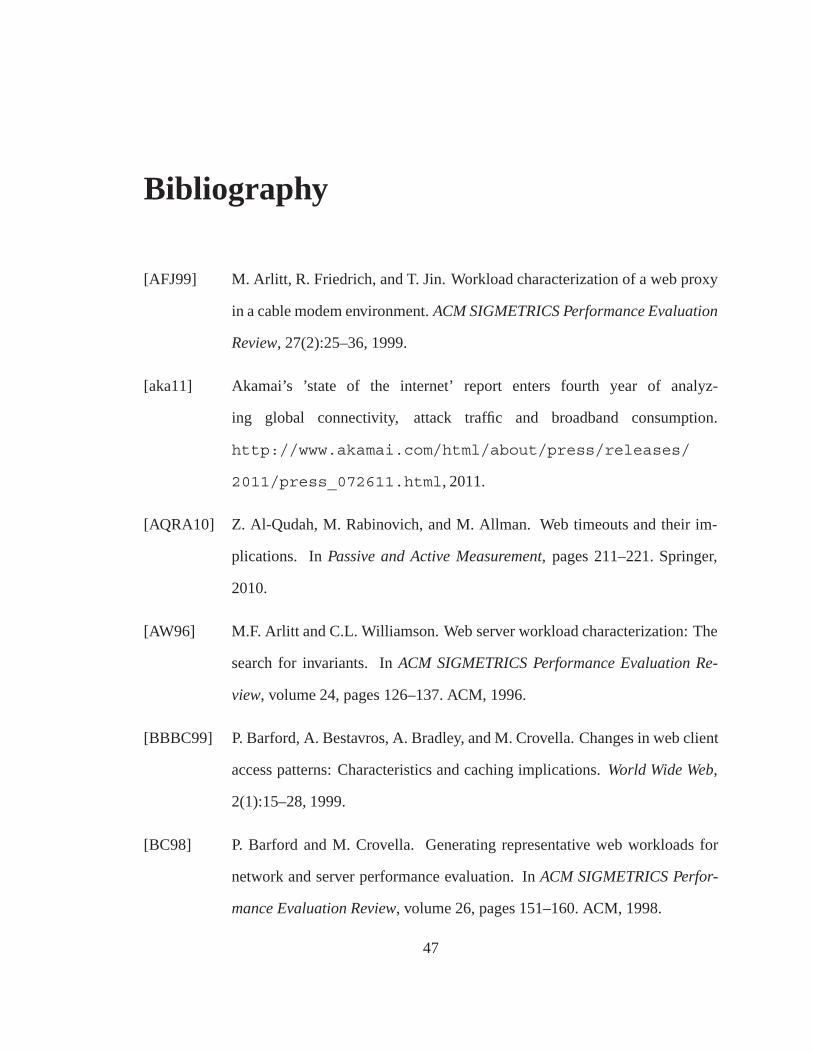
Bibliography
[AFJ99] M. Arlitt, R. Friedrich, and T. Jin. Workload characterization of a web proxy
in a cable modem environment. ACM SIGMETRICS Performance Evaluation
Review, 27(2):25–36, 1999.
[aka11] Akamai’s ’state of the internet’ report enters fourth year of analyz-
ing global connectivity, attack traffic and broadband consumption.
http://www.akamai.com/html/about/press/releases/
2011/press_072611.html, 2011.
[AQRA10] Z. Al-Qudah, M. Rabinovich, and M. Allman. Web timeouts and their im-
plications. In Passive and Active Measurement, pages 211–221. Springer,
2010.
[AW96] M.F. Arlitt and C.L. Williamson. Web server workload characterization: The
search for invariants. In ACM SIGMETRICS Performance Evaluation Re-
view, volume 24, pages 126–137. ACM, 1996.
[BBBC99] P. Barford, A. Bestavros, A. Bradley, and M. Crovella. Changes in web client
access patterns: Characteristics and caching implications. World Wide Web,
2(1):15–28, 1999.
[BC98] P. Barford and M. Crovella. Generating representative web workloads for
network and server performance evaluation. In ACM SIGMETRICS Perfor-
mance Evaluation Review, volume 26, pages 151–160. ACM, 1998.
47
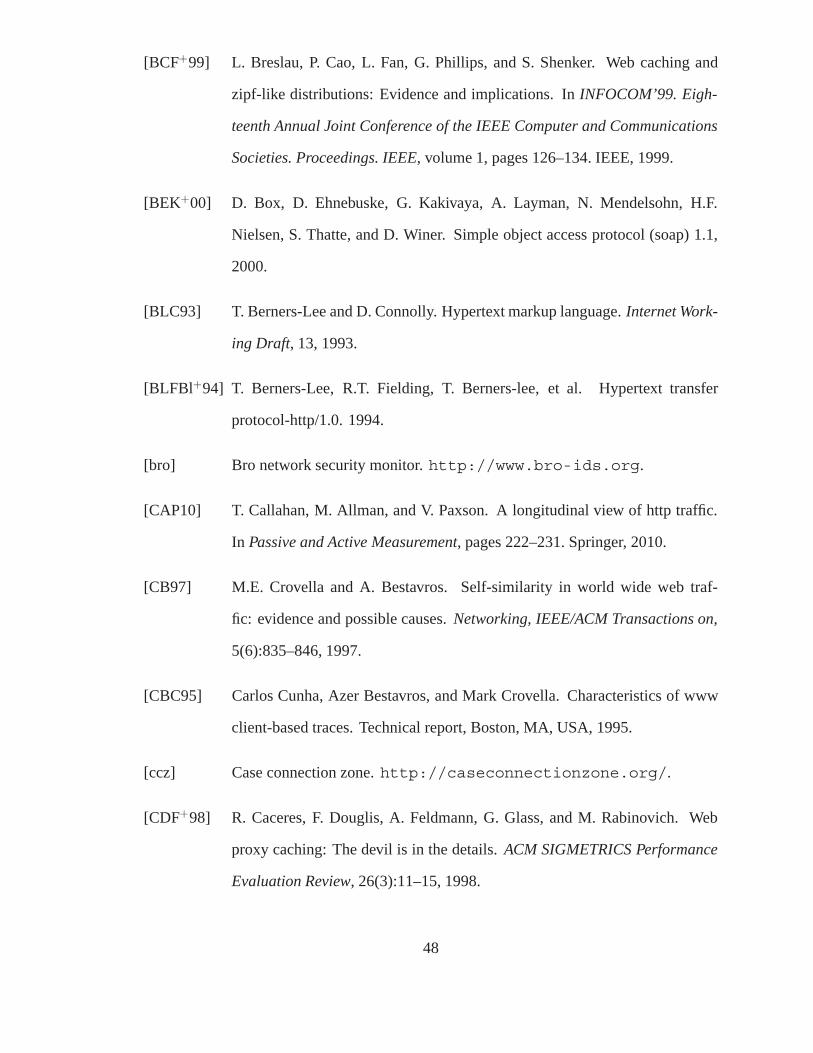
[BCF+99] L. Breslau, P. Cao, L. Fan, G. Phillips, and S. Shenker. Web caching and
zipf-like distributions: Evidence and implications. In INFOCOM’99. Eigh-
teenth Annual Joint Conference of the IEEE Computer and Communications
Societies. Proceedings. IEEE, volume 1, pages 126–134. IEEE, 1999.
[BEK+00] D. Box, D. Ehnebuske, G. Kakivaya, A. Layman, N. Mendelsohn, H.F.
Nielsen, S. Thatte, and D. Winer. Simple object access protocol (soap) 1.1,
2000.
[BLC93] T. Berners-Lee and D. Connolly. Hypertext markup language. Internet Work-
ing Draft, 13, 1993.
[BLFBl+94] T. Berners-Lee, R.T. Fielding, T. Berners-lee, et al. Hypertext transfer
protocol-http/1.0. 1994.
[bro] Bro network security monitor. http://www.bro-ids.org.
[CAP10] T. Callahan, M. Allman, and V. Paxson. A longitudinal view of http traffic.
In Passive and Active Measurement, pages 222–231. Springer, 2010.
[CB97] M.E. Crovella and A. Bestavros. Self-similarity in world wide web traf-
fic: evidence and possible causes. Networking, IEEE/ACM Transactions on,
5(6):835–846, 1997.
[CBC95] Carlos Cunha, Azer Bestavros, and Mark Crovella. Characteristics of www
client-based traces. Technical report, Boston, MA, USA, 1995.
[ccz] Case connection zone. http://caseconnectionzone.org/.
[CDF+98] R. Caceres, F. Douglis, A. Feldmann, G. Glass, and M. Rabinovich. Web
proxy caching: The devil is in the details. ACM SIGMETRICS Performance
Evaluation Review, 26(3):11–15, 1998.
48
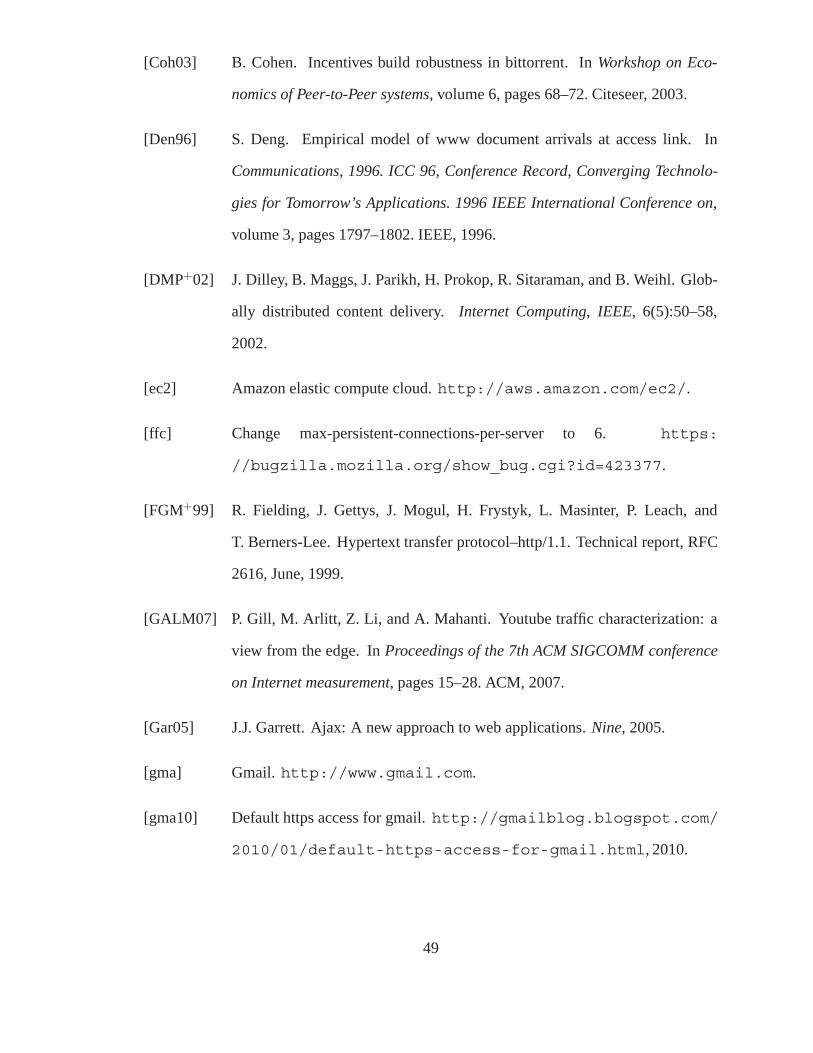
[Coh03] B. Cohen. Incentives build robustness in bittorrent. In Workshop on Eco-
nomics of Peer-to-Peer systems, volume 6, pages 68–72. Citeseer, 2003.
[Den96] S. Deng. Empirical model of www document arrivals at access link. In
Communications, 1996. ICC 96, Conference Record, Converging Technolo-
gies for Tomorrow’s Applications. 1996 IEEE International Conference on,
volume 3, pages 1797–1802. IEEE, 1996.
[DMP+02] J. Dilley, B. Maggs, J. Parikh, H. Prokop, R. Sitaraman, and B. Weihl. Glob-
ally distributed content delivery. Internet Computing, IEEE, 6(5):50–58,
2002.
[ec2] Amazon elastic compute cloud. http://aws.amazon.com/ec2/.
[ffc] Change max-persistent-connections-per-server to 6. https:
//bugzilla.mozilla.org/show_bug.cgi?id=423377.
[FGM+99] R. Fielding, J. Gettys, J. Mogul, H. Frystyk, L. Masinter, P. Leach, and
T. Berners-Lee. Hypertext transfer protocol–http/1.1. Technical report, RFC
2616, June, 1999.
[GALM07] P. Gill, M. Arlitt, Z. Li, and A. Mahanti. Youtube traffic characterization: a
view from the edge. In Proceedings of the 7th ACM SIGCOMM conference
on Internet measurement, pages 15–28. ACM, 2007.
[Gar05] J.J. Garrett. Ajax: A new approach to web applications. Nine, 2005.
[gma] Gmail. http://www.gmail.com.
[gma10] Default https access for gmail. http://gmailblog.blogspot.com/
2010/01/default-https-access-for-gmail.html, 2010.
49
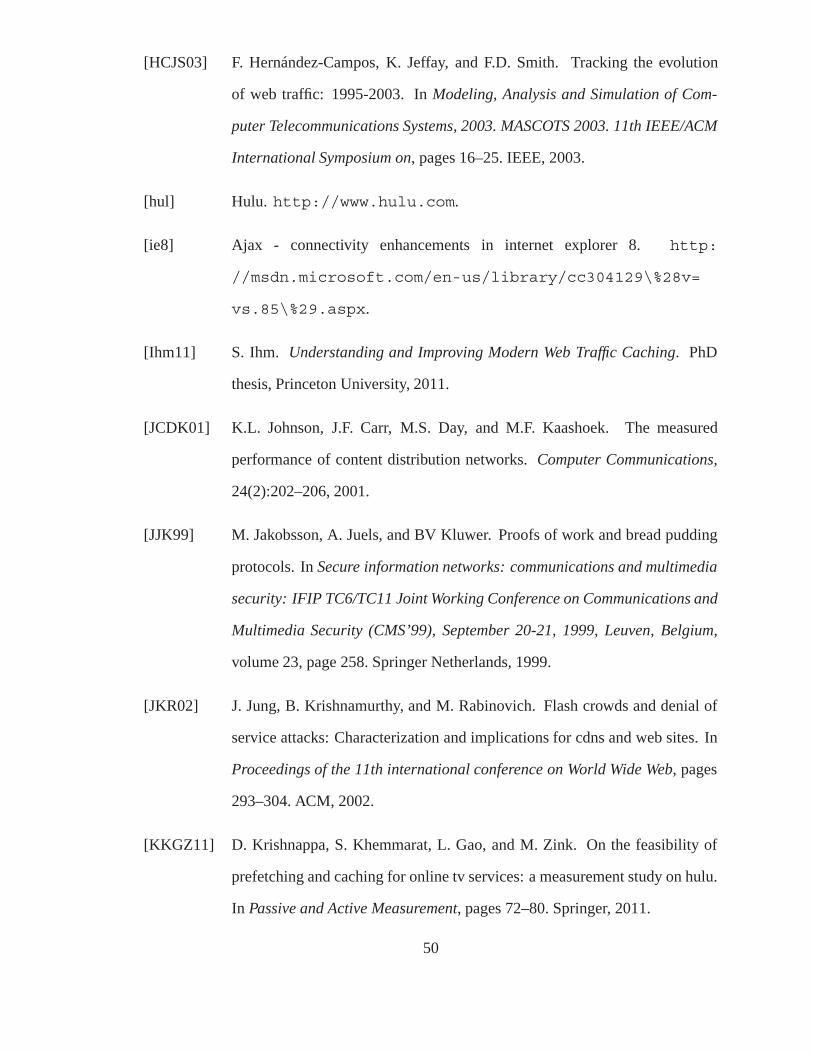
[HCJS03] F. Hernández-Campos, K. Jeffay, and F.D. Smith. Tracking the evolution
of web traffic: 1995-2003. In Modeling, Analysis and Simulation of Com-
puter Telecommunications Systems, 2003. MASCOTS 2003. 11th IEEE/ACM
International Symposium on, pages 16–25. IEEE, 2003.
[hul] Hulu. http://www.hulu.com.
[ie8] Ajax - connectivity enhancements in internet explorer 8. http:
//msdn.microsoft.com/en-us/library/cc304129\%28v=
vs.85\%29.aspx.
[Ihm11] S. Ihm. Understanding and Improving Modern Web Traffic Caching. PhD
thesis, Princeton University, 2011.
[JCDK01] K.L. Johnson, J.F. Carr, M.S. Day, and M.F. Kaashoek. The measured
performance of content distribution networks. Computer Communications,
24(2):202–206, 2001.
[JJK99] M. Jakobsson, A. Juels, and BV Kluwer. Proofs of work and bread pudding
protocols. In Secure information networks: communications and multimedia
security: IFIP TC6/TC11 Joint Working Conference on Communications and
Multimedia Security (CMS’99), September 20-21, 1999, Leuven, Belgium,
volume 23, page 258. Springer Netherlands, 1999.
[JKR02] J. Jung, B. Krishnamurthy, and M. Rabinovich. Flash crowds and denial of
service attacks: Characterization and implications for cdns and web sites. In
Proceedings of the 11th international conference on World Wide Web, pages
293–304. ACM, 2002.
[KKGZ11] D. Krishnappa, S. Khemmarat, L. Gao, and M. Zink. On the feasibility of
prefetching and caching for online tv services: a measurement study on hulu.
In Passive and Active Measurement, pages 72–80. Springer, 2011.
50
[KWZ01] B. Krishnamurthy, C. Wills, and Y. Zhang. On the use and performance of
content distribution networks. In Proceedings of the 1st ACM SIGCOMM
Workshop on Internet Measurement, pages 169–182. ACM, 2001.
[Lot87] M. Lotter. Rfc 1033 domain administrators operations guide. International
Engineering Task Force, 1987.
[Mah97] B.A. Mah. An empirical model of http network traffic. In INFOCOM’97. Six-
teenth Annual Joint Conference of the IEEE Computer and Communications
Societies. Proceedings IEEE, volume 2, pages 592–600. IEEE, 1997.
[MC00] S. McCreary and KC Claffy. Trends in wide area ip traffic patterns. Technical
report, Citeseer, 2000.
[MFPA] G. Maier, A. Feldmann, V. Paxson, and M. Allman. On dominant charac-
teristics of residential broadband internet traffic. In IMC, volume 9, pages
90–102. Citeseer.
[Nak09] S. Nakamoto. Bitcoin: A peer-to-peer electronic cash system. 2009. www.
bitcoin.org.
[Pax94] V. Paxson. Growth trends in wide-area tcp connections. Network, IEEE,
8(4):8–17, 1994.
[Pax99] V. Paxson. Bro: a system for detecting network intruders in real-time* 1.
Computer networks, 31(23-24):2435–2463, 1999.
[PB03] S. Podlipnig and L. Böszörmenyi. A survey of web cache replacement strate-
gies. ACM Computing Surveys (CSUR), 35(4):374–398, 2003.
[SAAF08] F. Schneider, S. Agarwal, T. Alpcan, and A. Feldmann. The new web: charac-
terizing ajax traffic. Passive and Active Network Measurement, pages 31–40,
2008.
51
[san11] Netflix now the largest single source of internet traffic in
north america. http://techcrunch.com/2011/05/17/
netflix-largest-internet-traffic/, 2011.
[STA01] A. Shaikh, R. Tewari, and M. Agrawal. On the effectiveness of dns-based
server selection. In INFOCOM 2001. Twentieth Annual Joint Conference
of the IEEE Computer and Communications Societies. Proceedings. IEEE,
volume 3, pages 1801–1810. IEEE, 2001.
[TMW97] K. Thompson, G.J. Miller, and R. Wilder. Wide-area internet traffic patterns
and characteristics. Network, IEEE, 11(6):10–23, 1997.
[Tri09] Sipat Triukose. Personal communication, 2009.
[Wan99] J. Wang. A survey of web caching schemes for the internet. ACM SIGCOMM
Computer Communication Review, 29(5):36–46, 1999.
[you] Youtube. http://www.youtube.com.
52