Embed Size (px)
Citation preview
A Longitudinal Study of the Illinois High School Class of 2002:
A Six-Year Analysis of Postsecondary Enrollment and
Completion
Eric J. Lichtenberger, Ph.D.
Illinois Education Research CouncilMay 25, 2011
• Who is included in the cohort- 113,135 public high school students who took the Prairie
State Achievement Exam (PSAE)/ACT in the Spring of 2001 and indicated that they would be graduating in 2002.
• Who is not included in this cohort- Private high school graduates from Illinois
- Out-of-State high school graduates who emigrated to Illinois higher education institutions
The Study
Sources of Data
• ACT-ACT scores and information from the Student Interest Profiler
• National Student Clearinghouse-enrollment and degrees• Illinois Community College Board-enrollment and degrees• Illinois Shared Enrollment and Graduation Consortium-
enrollment and degrees• Illinois School Report Card- characteristics of the high
schools• IPEDS-characteristics of the four-year institutions• Barron’s-selectivity
Context of the Study• Graduation initiatives: President Obama, Lumina Foundation,
Complete College America• Illinois Public Agenda for College and Career Success
- Increase the number of quality degrees- Reduce geographic disparities in educational attainment- Ensure college affordability for individuals, families, and
taxpayers- Improve transitions along the educational pipeline—the
postsecondary portion
• Several current studies that are focusing on postsecondary completion rather than only access (Bowen).
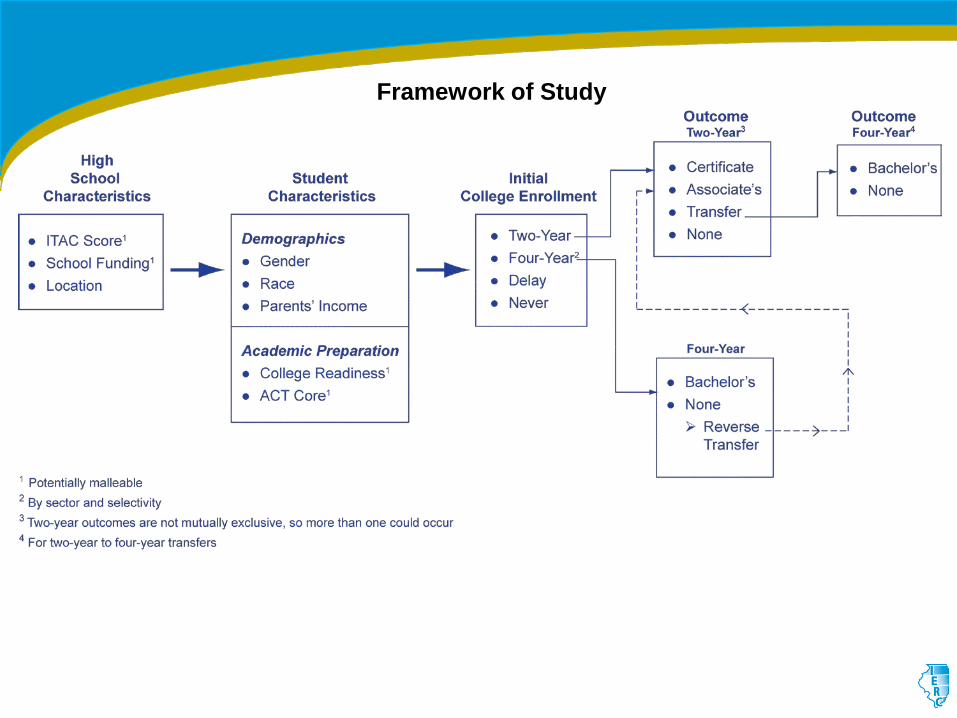
Framework of Study
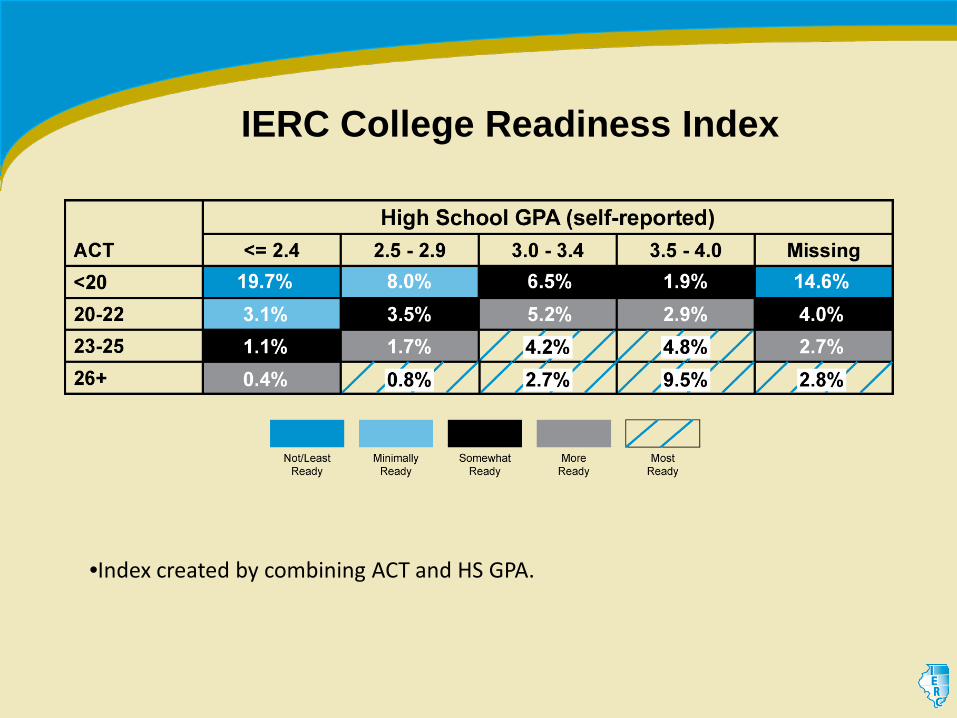
IERC College Readiness Index
•Index created by combining ACT and HS GPA.
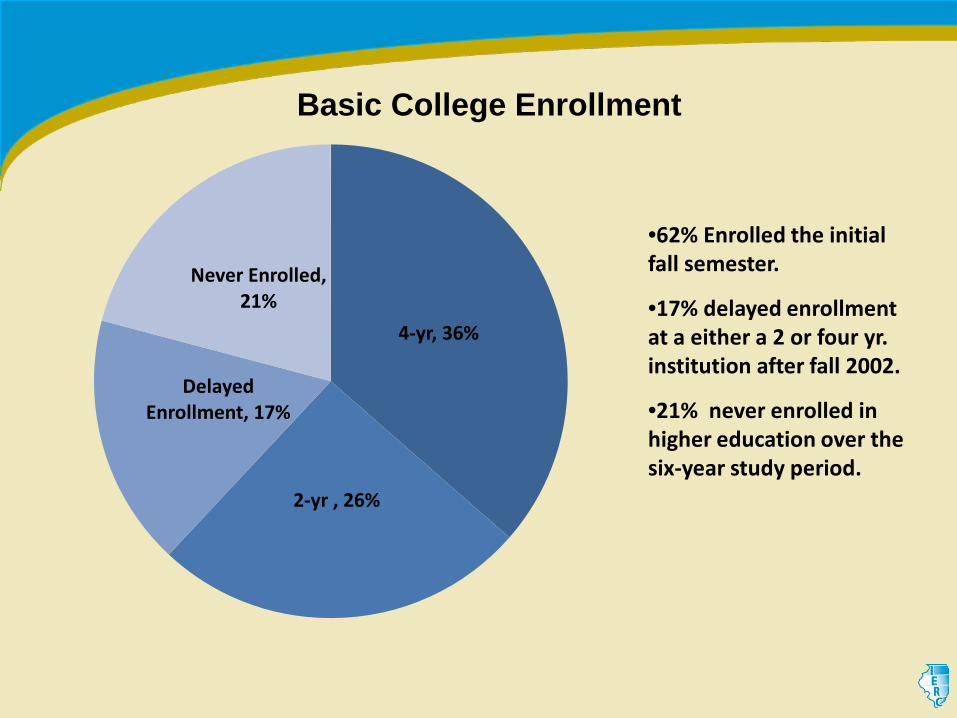
Basic College Enrollment
•62% Enrolled the initial fall semester.
•17% delayed enrollment at a either a 2 or four yr. institution after fall 2002.
•21% never enrolled in higher education over the six-year study period.
4-yr, 36%
2-yr , 26%
Delayed Enrollment, 17%
Never Enrolled, 21%
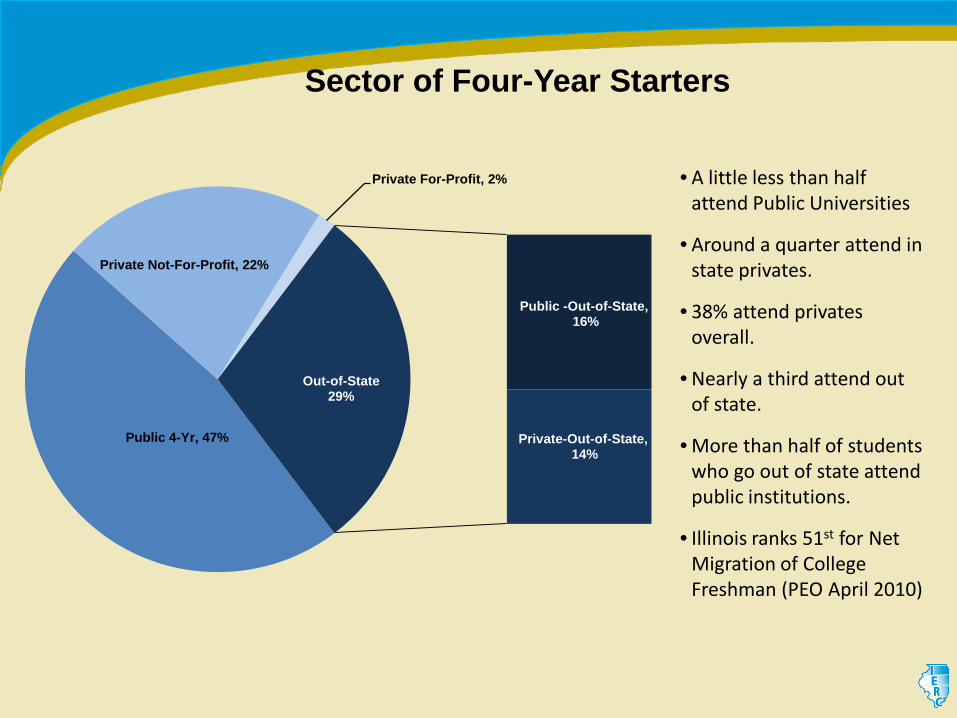
Sector of Four-Year Starters
Public 4-Yr, 47%
Private Not-For-Profit, 22%
Private For-Profit, 2%
Public -Out-of-State,16%
Private-Out-of-State,14%
Out-of-State29%
• A little less than half attend Public Universities
• Around a quarter attend in state privates.
• 38% attend privates overall.
• Nearly a third attend out of state.
• More than half of students who go out of state attend public institutions.
• Illinois ranks 51st for Net Migration of College Freshman (PEO April 2010)
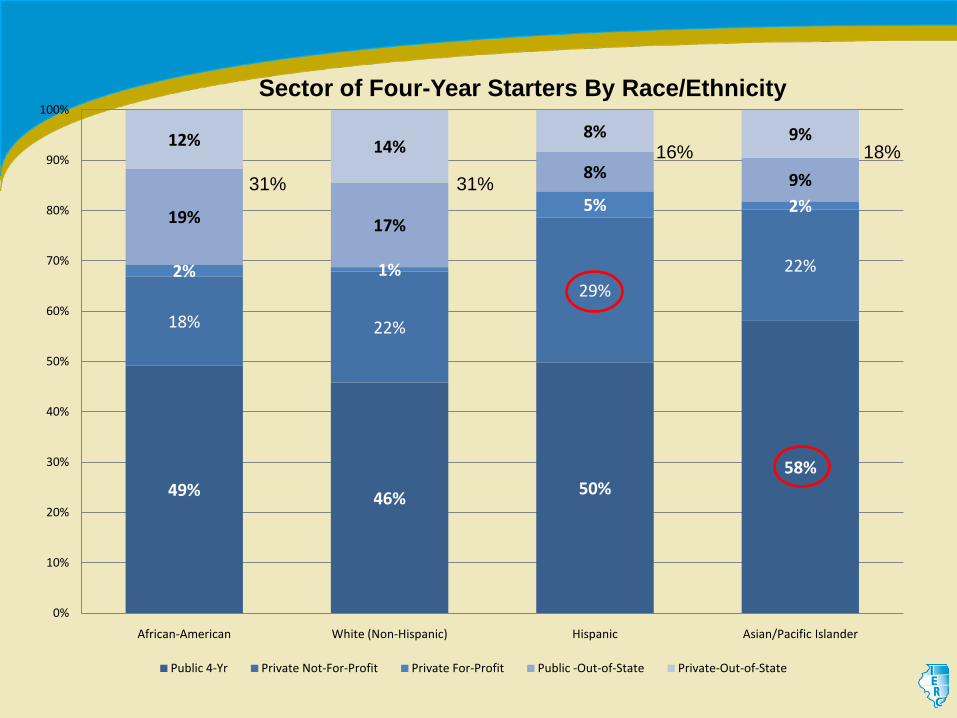
49% 46% 50%58%
18% 22%
29%22%2% 1%
5% 2%19% 17%
8% 9%
12% 14%8% 9%
0%
10%
20%
30%
40%
50%
60%
70%
80%
90%
100%
African-American White (Non-Hispanic) Hispanic Asian/Pacific Islander
Sector of Four-Year Starters By Race/Ethnicity
Public 4-Yr Private Not-For-Profit Private For-Profit Public -Out-of-State Private-Out-of-State
31% 31%
16% 18%
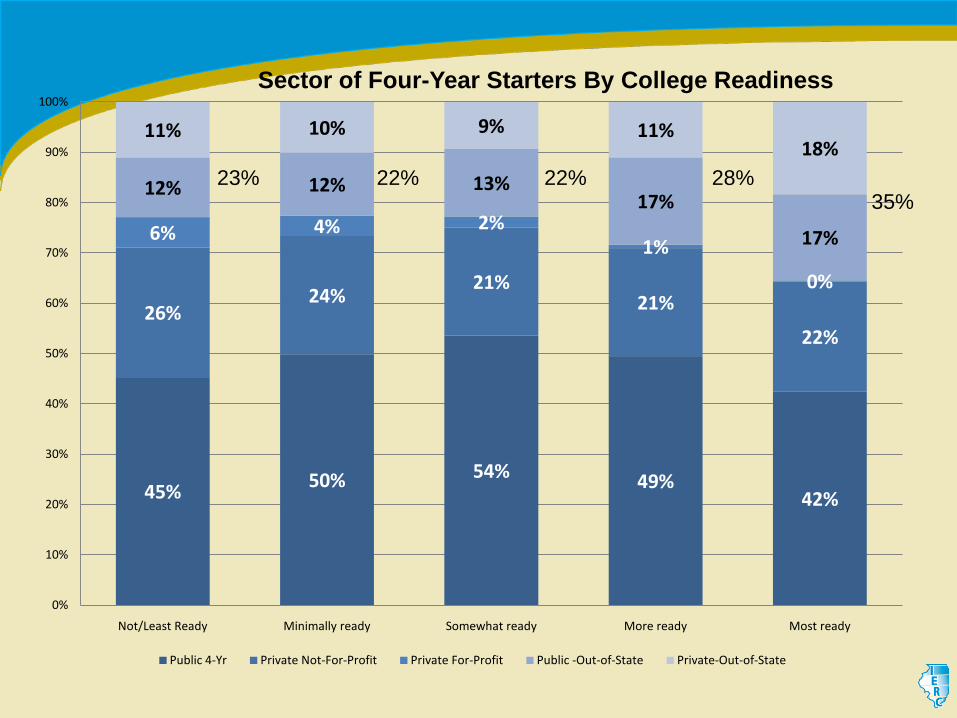
45% 50% 54% 49%42%
26%24%
21%21%
22%
6% 4% 2%1%
0%
12% 12% 13%17%
17%
11% 10% 9% 11%18%
0%
10%
20%
30%
40%
50%
60%
70%
80%
90%
100%
Not/Least Ready Minimally ready Somewhat ready More ready Most ready
Sector of Four-Year Starters By College Readiness
Public 4-Yr Private Not-For-Profit Private For-Profit Public -Out-of-State Private-Out-of-State
23% 22% 22% 28%35%
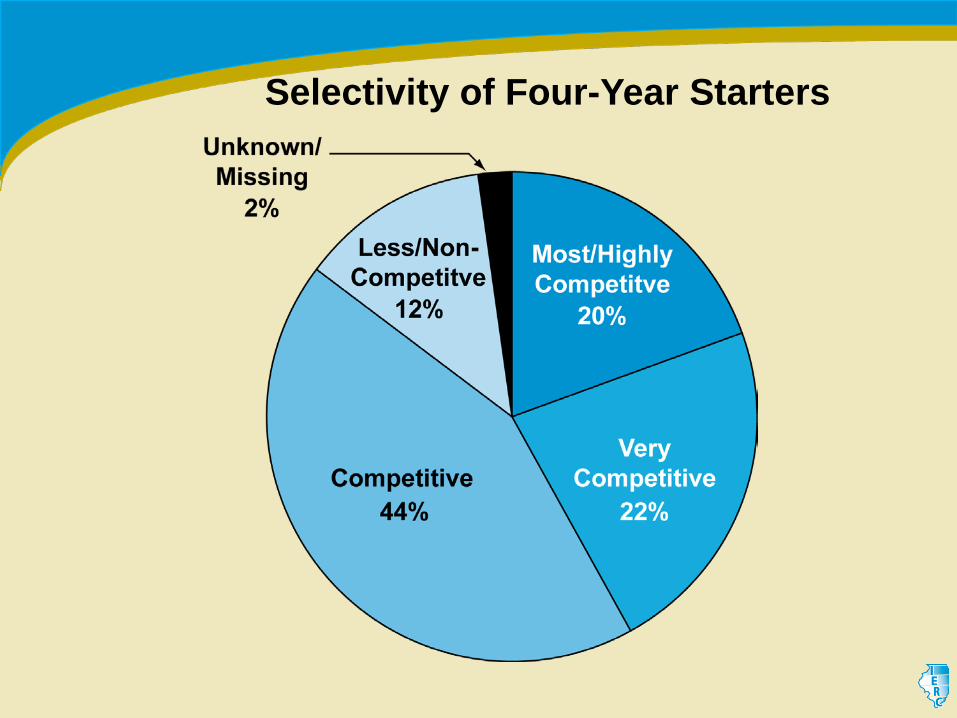
Selectivity of Four-Year Starters
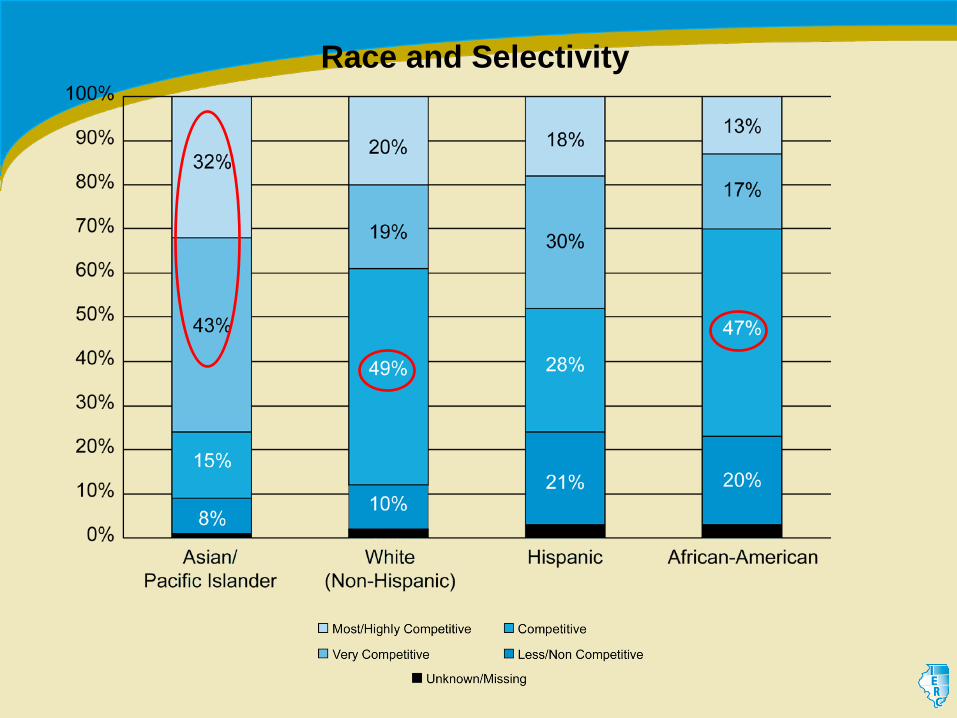
Race and Selectivity
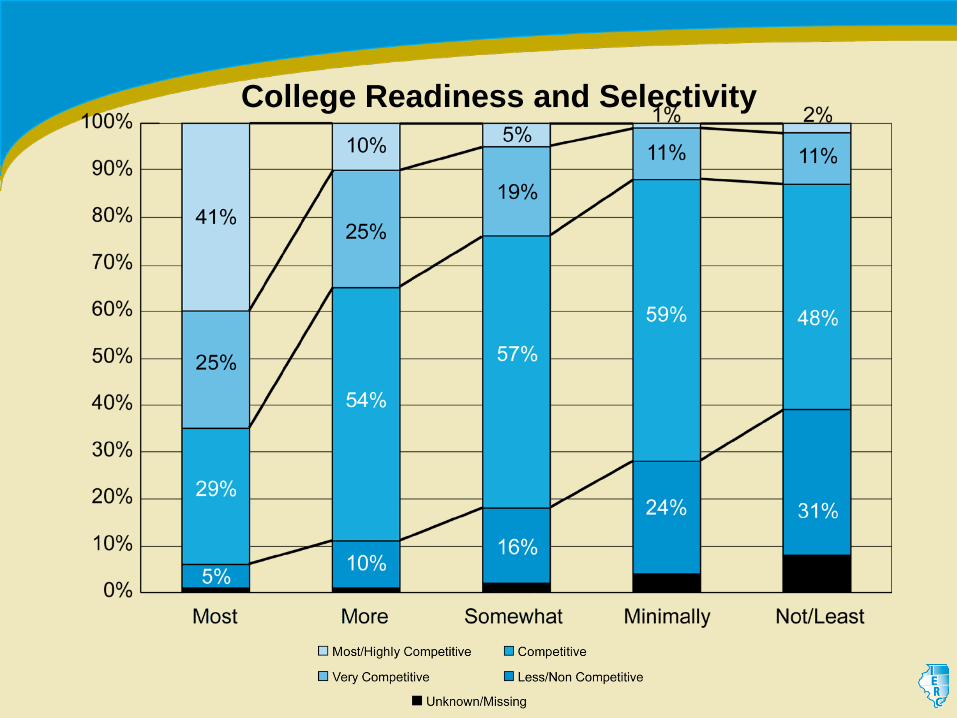
College Readiness and Selectivity
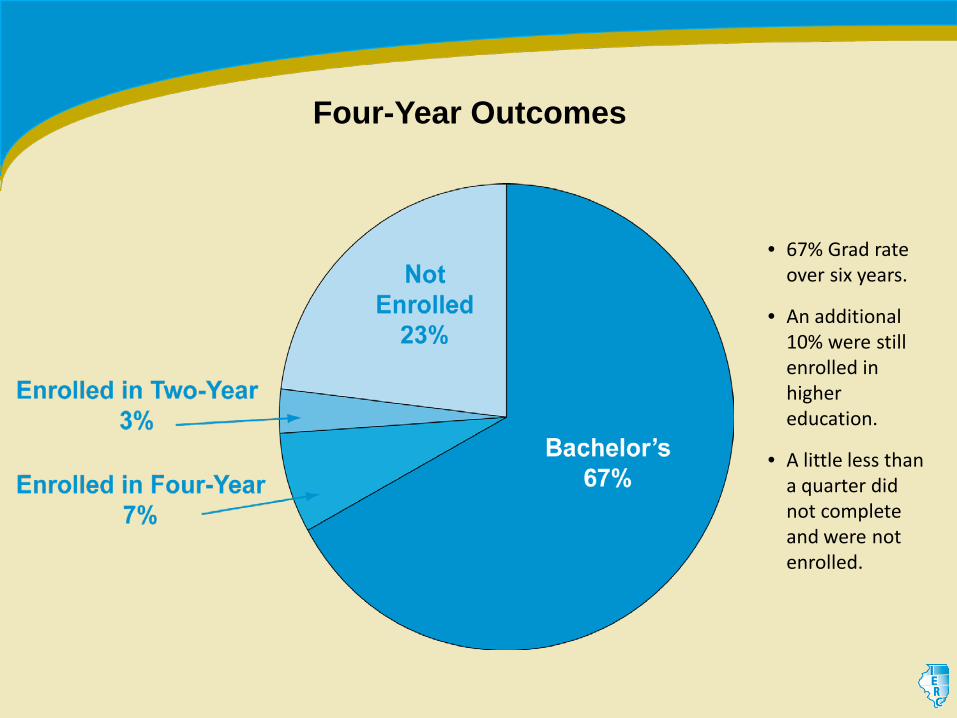
Four-Year Outcomes
• 67% Grad rate over six years.
• An additional 10% were still enrolled in higher education.
• A little less than a quarter did not complete and were not enrolled.
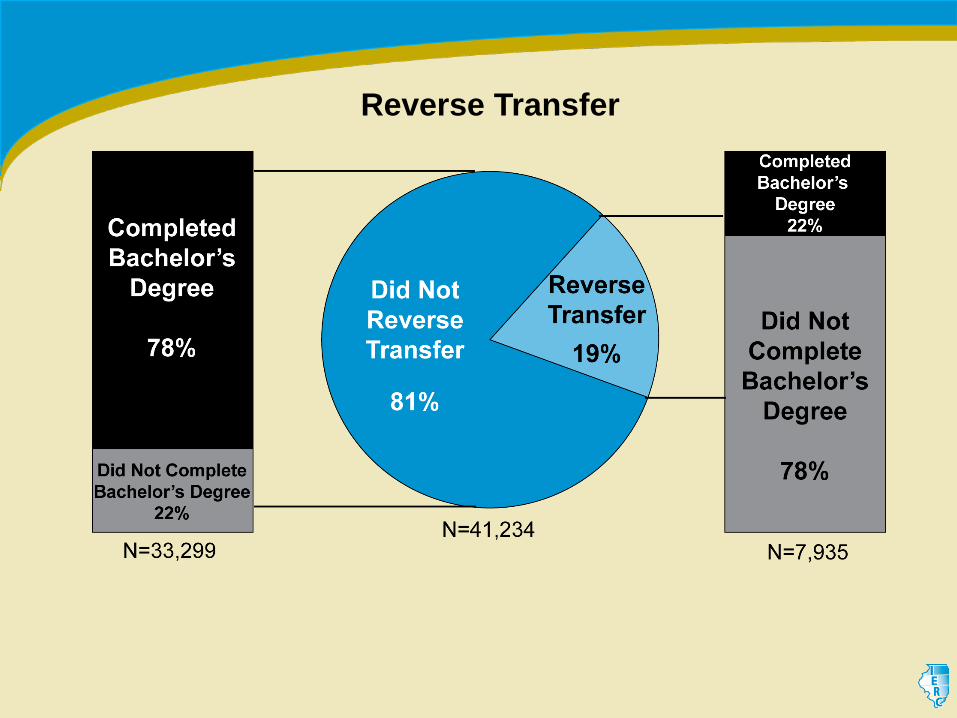
Reverse Transfer
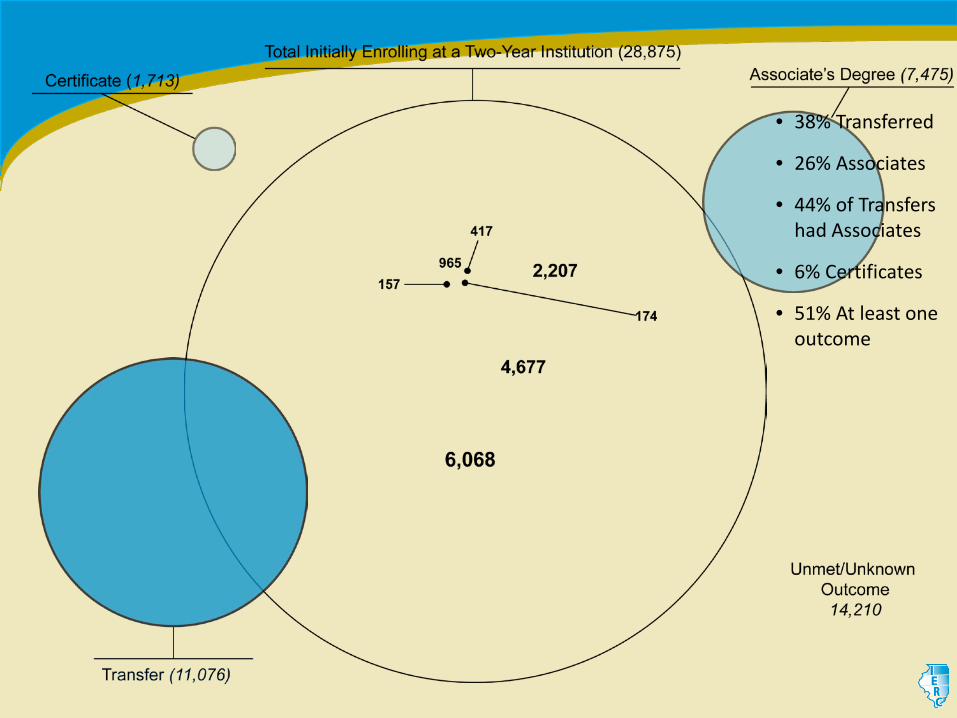
• 38% Transferred
• 26% Associates
• 44% of Transfers had Associates
• 6% Certificates
• 51% At least one outcome
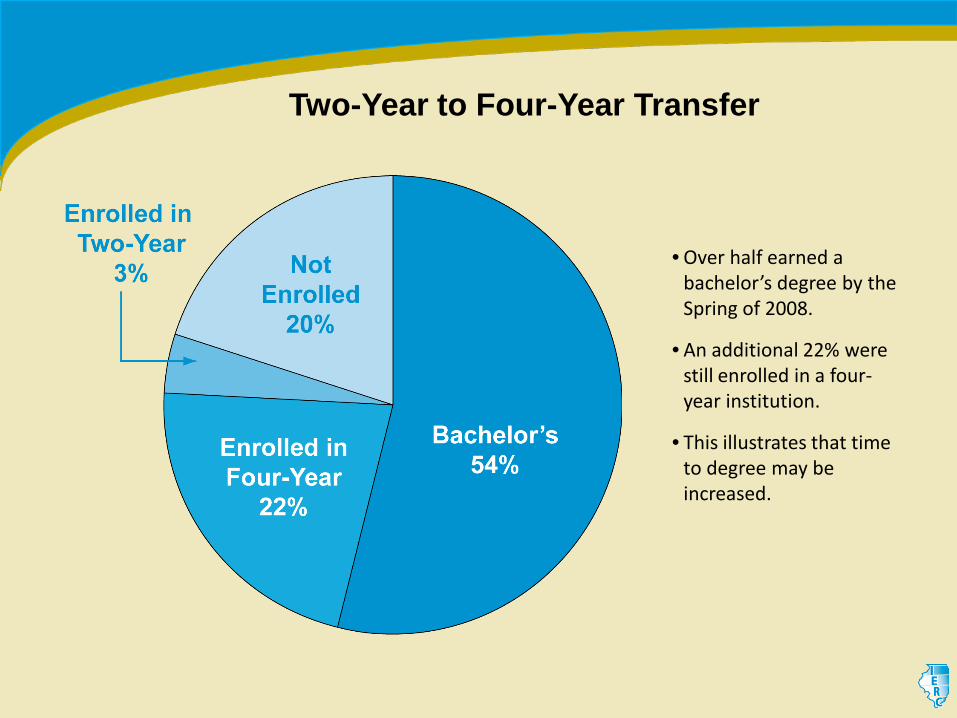
Two-Year to Four-Year Transfer
• Over half earned a bachelor’s degree by the Spring of 2008.
• An additional 22% were still enrolled in a four-year institution.
• This illustrates that time to degree may be increased.
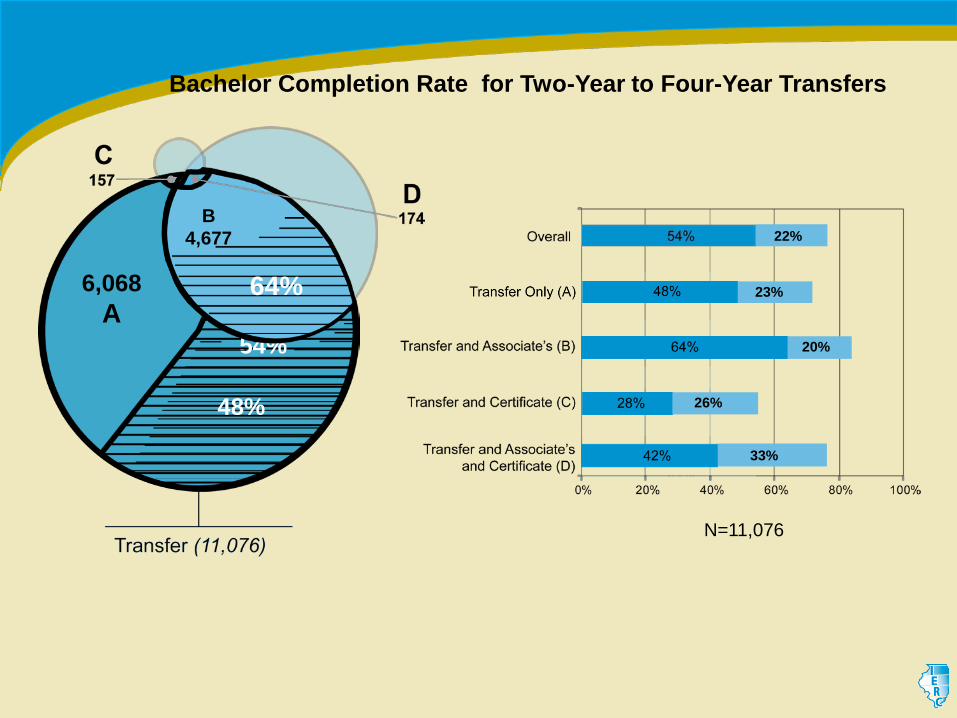
N=11,076
54%
6,068A
48%
64%
B4,677
Bachelor Completion Rate for Two-Year to Four-Year Transfers
33%
22%
23%
20%
26%
Logistic Regression
19
• Two separate models
• Initial enrollment at four-year institution
• Bachelor’s degree completion for four-year starters
• Included all student and school characteristics included in the framework
• Determined each variable’s predictive importance regarding the outcome holding everything else constant
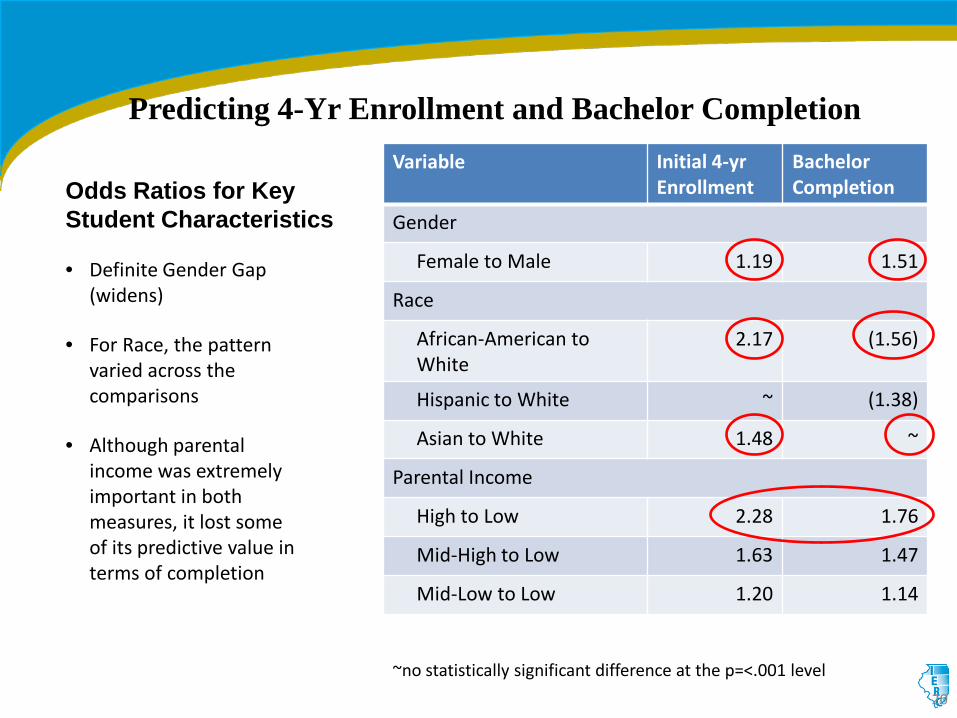
Variable Initial 4-yr Enrollment
BachelorCompletion
Gender
Female to Male 1.19 1.51
Race
African-American to White
2.17 (1.56)
Hispanic to White ~ (1.38)
Asian to White 1.48 ~
Parental Income
High to Low 2.28 1.76
Mid-High to Low 1.63 1.47
Mid-Low to Low 1.20 1.14
Predicting 4-Yr Enrollment and Bachelor Completion
20
• Definite Gender Gap (widens)
• For Race, the pattern varied across the comparisons
• Although parental income was extremely important in both measures, it lost some of its predictive value in terms of completion
Odds Ratios for Key Student Characteristics
~no statistically significant difference at the p=<.001 level
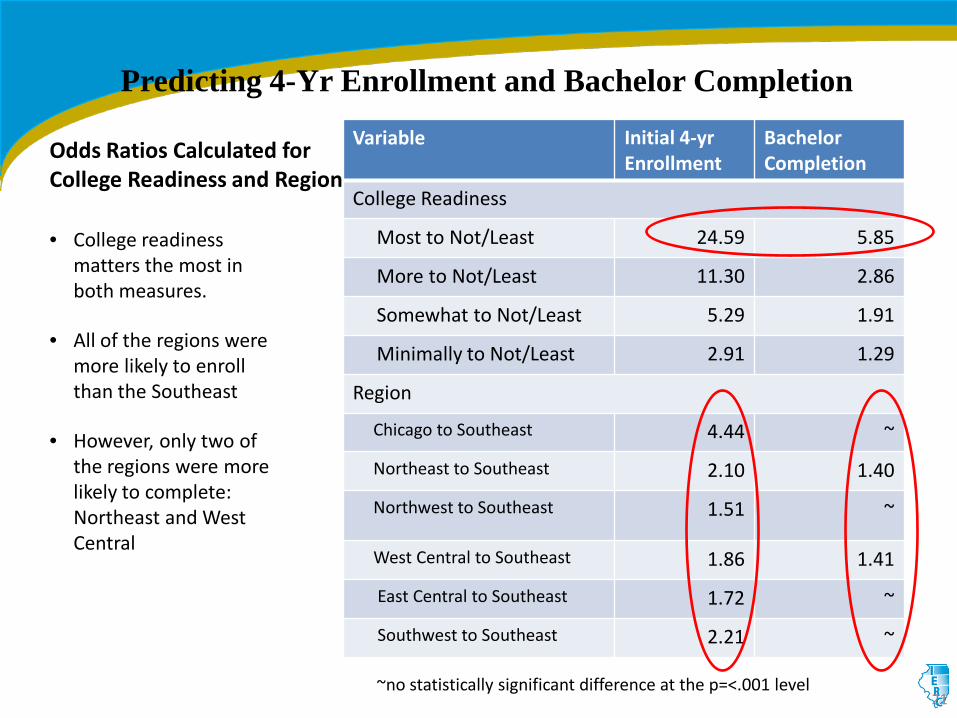
Predicting 4-Yr Enrollment and Bachelor Completion
21
• College readiness matters the most in both measures.
• All of the regions were more likely to enroll than the Southeast
• However, only two of the regions were more likely to complete: Northeast and West Central
Odds Ratios Calculated for College Readiness and Region
Variable Initial 4-yr Enrollment
Bachelor Completion
College Readiness
Most to Not/Least 24.59 5.85
More to Not/Least 11.30 2.86
Somewhat to Not/Least 5.29 1.91
Minimally to Not/Least 2.91 1.29
Region
Chicago to Southeast 4.44 ~
Northeast to Southeast 2.10 1.40
Northwest to Southeast 1.51 ~
West Central to Southeast 1.86 1.41
East Central to Southeast 1.72 ~
Southwest to Southeast 2.21 ~
~no statistically significant difference at the p=<.001 level
DISCUSSION
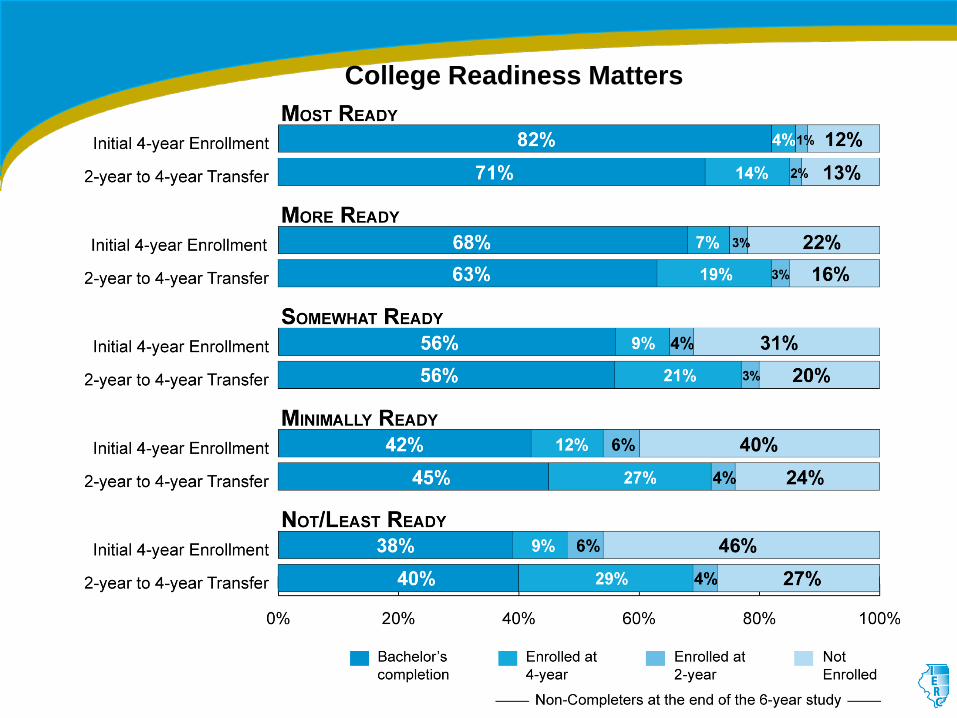
College Readiness Matters
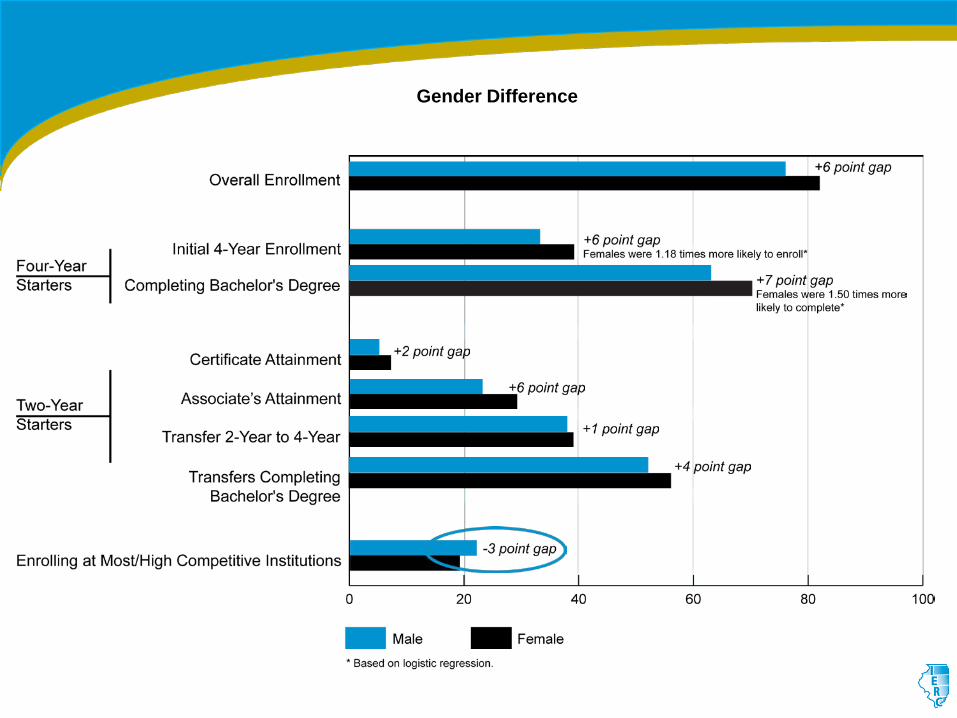
Gender Difference
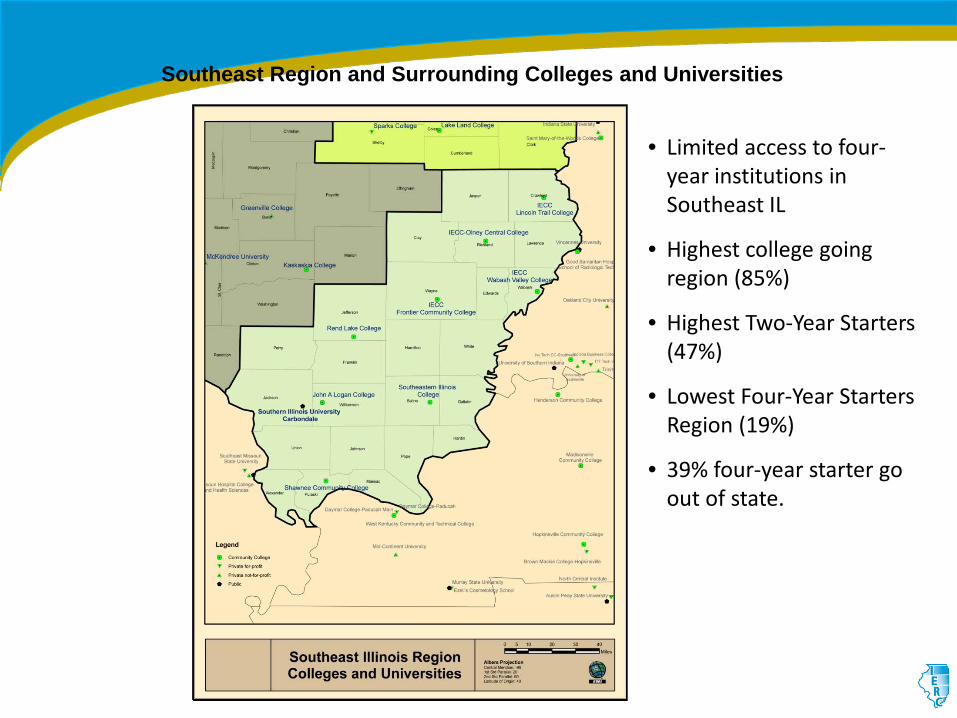
• Limited access to four-year institutions in Southeast IL
• Highest college going region (85%)
• Highest Two-Year Starters (47%)
• Lowest Four-Year Starters Region (19%)
• 39% four-year starter go out of state.
Southeast Region and Surrounding Colleges and Universities
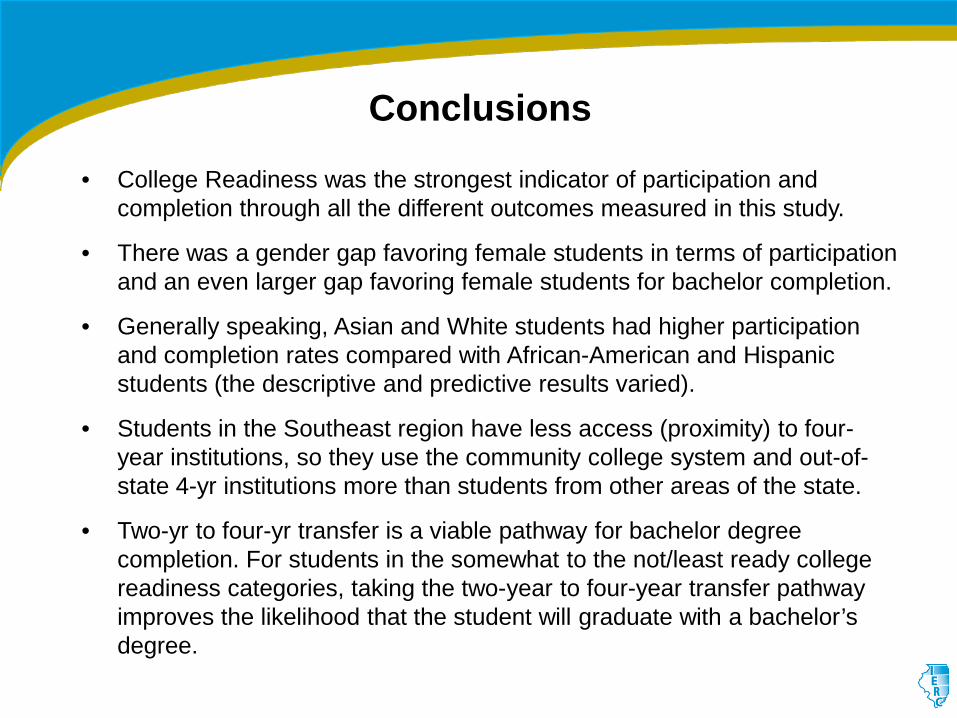
• College Readiness was the strongest indicator of participation and completion through all the different outcomes measured in this study.
• There was a gender gap favoring female students in terms of participation and an even larger gap favoring female students for bachelor completion.
• Generally speaking, Asian and White students had higher participation and completion rates compared with African-American and Hispanic students (the descriptive and predictive results varied).
• Students in the Southeast region have less access (proximity) to four-year institutions, so they use the community college system and out-of-state 4-yr institutions more than students from other areas of the state.
• Two-yr to four-yr transfer is a viable pathway for bachelor degree completion. For students in the somewhat to the not/least ready college readiness categories, taking the two-year to four-year transfer pathway improves the likelihood that the student will graduate with a bachelor’s degree.
Conclusions
Contact Information
Eric LichtenbergerAssistant Research Professor [email protected]
IERCierc.siue.edu618-650-2840