Embed Size (px)
Citation preview
A Longitudinal Study of theVocational Rehabilitation Service Program
Fourth Interim Report:
Characteristics and Outcomesof Transitional Youth in VR
July 2000
Submitted byResearch Triangle Institute
Submitted toRehabilitation Services Administration
U.S. Department of Education
in partial fulfillment of requirements underED Contract No. HR92-022-001
A Longitudinal Study of theVocational Rehabilitation Service Program
Fourth Interim Report:
Characteristics and Outcomesof Transitional Youth in VR
Becky J. Hayward, Project DirectorHolly Schmidt-Davis
July 2000
Submitted byResearch Triangle Institute
Submitted toRehabilitation Services Administration
U.S. Department of Education
in partial fulfillment of requirements underED Contract No. HR92-022-001
i
Table of Contents
Executive Summary .................................................................................................................... iv
Chapter 1: Introduction ............................................................................................................... 1The Study's Information Goals and Reporting Schedule........................................................ 3Data Collection Design ........................................................................................................... 4Current Status of Data Collection ........................................................................................... 6
Chapter 2: Characteristics of Transition-Aged VR Consumers ................................................... 7Overview of Transitional Youth as VR Consumers ............................................................... 8Demographic and Disability Characteristics .......................................................................... 9Educational Characteristics................................................................................................... 12Receipt of Financial Assistance from Public or Other Sources............................................ 13Self-Esteem and Locus of Control........................................................................................ 14Employment History............................................................................................................. 16Summary............................................................................................................................... 18
Chapter 3: Selected Aspects of the VR Experience ................................................................... 19Reasons for Seeking VR Services......................................................................................... 19Services and Supports ........................................................................................................... 22Family Involvement .............................................................................................................. 23Attrition................................................................................................................................. 23Summary............................................................................................................................... 24
Chapter 4: Consumer Outcomes ................................................................................................ 26Overview of Employment Outcomes.................................................................................... 26Factors Associated with Employment Outcomes ................................................................. 28Satisfaction with VR Services .............................................................................................. 30Changes in Selected Conditions Among Special Education Recipients............................... 36Summary............................................................................................................................... 37
Appendix A: Characteristics of Youth VR Consumers by Disability TypeAppendix B: Creation of Functional Limitation ScalesAppendix C: Education and Training Services
ii
List of Tables
Table 1. Characteristics of Transitional Youth’s Participation in VR, by Receipt of SpecialEducation in High School .............................................................................................. 9
Table 2. Source of Referral to VR Among Transitional Youth, by Receipt of SpecialEducation in High School ............................................................................................ 10
Table 3. Demographic Characteristics of Transitional Youth at Entry, by Receipt ofSpecial Education in High School ............................................................................... 10
Table 4. Disability Characteristics of VR Consumers Who are Transitional Youth, byReceipt of Special Education in High School.............................................................. 11
Table 5. Educational Characteristics of Transitional Youth at Entry to VR, by Receipt ofSpecial Education in High School ............................................................................... 13
Table 6. Transitional Youths’ Receipt of Financial Assistance at Entry to VR, by Receiptof Special Education in High School ........................................................................... 14
Table 7. Transitional Youths’ Receipt of Financial Assistance After Exit from VR, byReceipt of Special Education in High School.............................................................. 15
Table 8. Self-Esteem and Locus of Control Among Transitional Youth at Entry to theStudy, by Receipt of Special Education in High School............................................. 16
Table 9. Work History of Transitional Youth at Application to VR, by Receipt of SpecialEducation in High School ............................................................................................ 17
Table 10. Transitional Youths’ Reasons for Applying for VR Services, by Receipt ofSpecial Education in High School ............................................................................... 20
Table 11. Vocational Goals of Transitional Youth, by Receipt of Special Education inHigh School ................................................................................................................. 21
Table 12. Types of VR services that Youth VR Consumers Obtained, by Receipt ofSpecial Education in High School ............................................................................... 22
Table 13. Family Involvement in VR Services of Transitional Youth, by Receipt of Special Education in High School ............................................................................... 24
Table 14. Employment Characteristics of Transitional Youth With an EmploymentOutcome, by Receipt of Special Education in High School ........................................ 27
Table 15. Relationships Between Consumer Characteristics and VR Employment andCompetitive Employment Outcomes: Model R2 and Unstandardized Weightsfor Multiple Regression Analyses Using Consumer Characteristics and VRExperiences as Influencing Factors ............................................................................. 29
Table 16. Satisfaction with VR of Transitional Youth who Received Special EducationServices in High School, by Closure Status................................................................. 31
iii
List of Tables
Table 17. Satisfaction with VR of Transitional Youth who Did Not Receive SpecialEducation Services in High School, by Closure Status ............................................... 32
Table 18. Satisfaction with VR of Transitional Youth who Received Special EducationServices in High School, by Type of Employment ...................................................... 34
Table 19. Satisfaction with VR of Transitional Youth who Did Not Receive SpecialEducation Services in High School, by Type of Employment..................................... 35
Table 20. Changes from Acceptance to Closure on Selected Conditions for Youth VRConsumers Who Received Special Education Services in High School ..................... 36
List of Figures
Figure 1. Location of Offices Participating in the Longitudinal Study......................................... 5
Figure 2. Data Collection Instruments, with Method and Frequency of Administration.............. 6
Figure 3. Work History of Transitional Youth at Application to VR, by Receipt of SpecialEducation in High School ............................................................................................ 17
iv
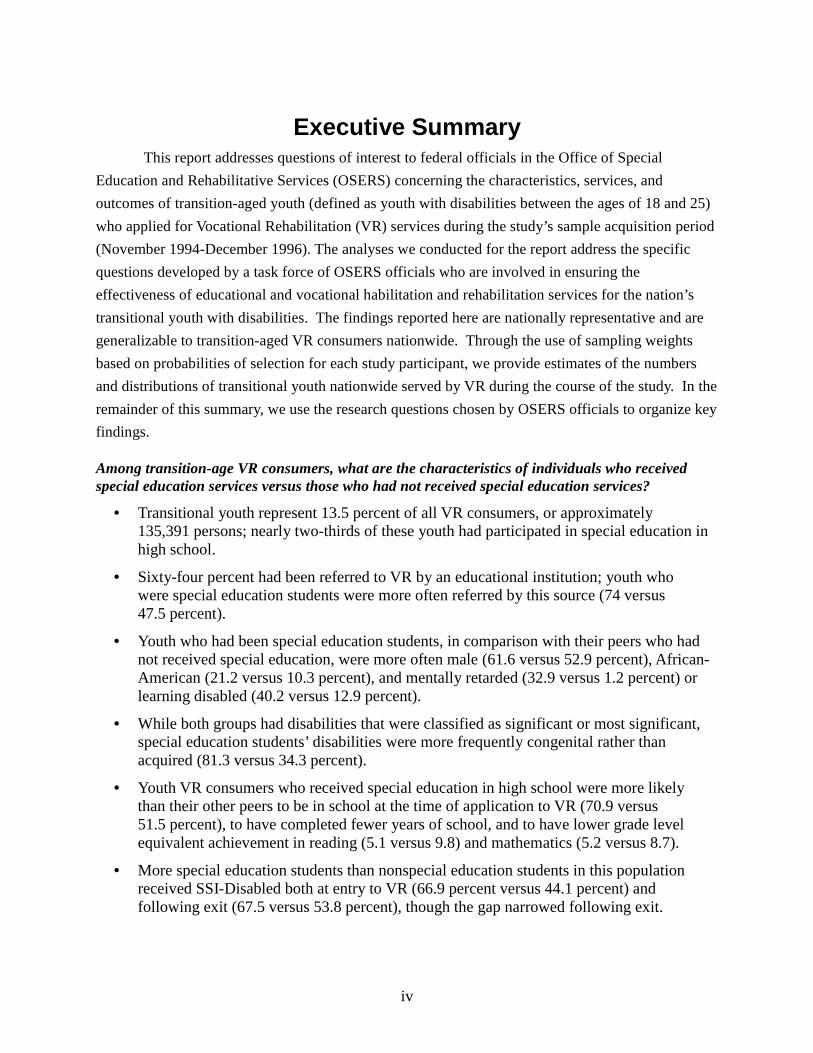
Executive SummaryThis report addresses questions of interest to federal officials in the Office of Special
Education and Rehabilitative Services (OSERS) concerning the characteristics, services, andoutcomes of transition-aged youth (defined as youth with disabilities between the ages of 18 and 25)who applied for Vocational Rehabilitation (VR) services during the study’s sample acquisition period(November 1994-December 1996). The analyses we conducted for the report address the specificquestions developed by a task force of OSERS officials who are involved in ensuring theeffectiveness of educational and vocational habilitation and rehabilitation services for the nation’stransitional youth with disabilities. The findings reported here are nationally representative and aregeneralizable to transition-aged VR consumers nationwide. Through the use of sampling weightsbased on probabilities of selection for each study participant, we provide estimates of the numbersand distributions of transitional youth nationwide served by VR during the course of the study. In theremainder of this summary, we use the research questions chosen by OSERS officials to organize keyfindings.
Among transition-age VR consumers, what are the characteristics of individuals who receivedspecial education services versus those who had not received special education services?
• Transitional youth represent 13.5 percent of all VR consumers, or approximately135,391 persons; nearly two-thirds of these youth had participated in special education inhigh school.
• Sixty-four percent had been referred to VR by an educational institution; youth whowere special education students were more often referred by this source (74 versus47.5 percent).
• Youth who had been special education students, in comparison with their peers who hadnot received special education, were more often male (61.6 versus 52.9 percent), African-American (21.2 versus 10.3 percent), and mentally retarded (32.9 versus 1.2 percent) orlearning disabled (40.2 versus 12.9 percent).
• While both groups had disabilities that were classified as significant or most significant,special education students’ disabilities were more frequently congenital rather thanacquired (81.3 versus 34.3 percent).
• Youth VR consumers who received special education in high school were more likelythan their other peers to be in school at the time of application to VR (70.9 versus51.5 percent), to have completed fewer years of school, and to have lower grade levelequivalent achievement in reading (5.1 versus 9.8) and mathematics (5.2 versus 8.7).
• More special education students than nonspecial education students in this populationreceived SSI-Disabled both at entry to VR (66.9 percent versus 44.1 percent) andfollowing exit (67.5 versus 53.8 percent), though the gap narrowed following exit.
v
• Special education students were lower in self-esteem and perceived themselves to be moreoften controlled by chance and other people than youth VR consumers who had notreceived special education services in high school.
• The groups also differed in work history: 24.6 percent of youth special education studentshad never worked, compared to 14.5 percent of other youth, and fewer were working atapplication to VR (24.9 versus 37.7 percent).
What reasons do transitional youth have for applying for VR services? What job or vocationalinterest(s) do they express? How do they differ according to special education status?
• Transitional youth typically applied to VR in order to obtain services that would assistthem in labor force entry, including job placement (two-thirds of youth VR consumers),vocational training (60 percent), and support for education (51 percent).
• Youth who did not receive special education services in high school more often soughtsupport to continue their education than did their special education peers (65 versus43 percent).
• In general, youth VR consumers established vocational goals in one of three occupationalfields: professional/ managerial/technical (40 percent overall, 25 percent of specialeducation youth and 63 percent of others); services (24 percent overall, 31 percent ofspecial education youth and 13 percent of others); or clerical/sales occupations (12 percentoverall, 13 percent of special education youth and 11 percent of others).
• Relatively few youth VR consumers (18 percent) changed their vocational goal followinginitial Individualized Plan for Employment (IPE) development.
For special education and nonspecial education students, what types of services and financialassistance did transition-age VR consumers receive?
• Both groups of youth VR consumers averaged about 8.0 services during VR.
• Nearly all of both groups obtained counseling, guidance, and placement services (95 and94 percent, respectively).
• More special education students obtained diagnostic and evaluation services (85 versus72 percent) and transportation, housing, and maintenance services (25 versus 18 percent).
• More nonspecial education youth obtained support for education (55 versus 45 percent)and averaged more of those services (2.0 versus 1.2).
• The average cost of purchased services was $1,782.
To what extent are families and/or advocates involved in the VR process for individuals who hadreceived special education services versus those who had not?
• For about one-third of special education students, family members were involved in theVR experience, compared with 14 percent of other youth.
• Among activities families assisted with were selection of vocational goal, determination ofservices to be provided, and selection of service providers.
vi
What variables are associated with attrition for individuals who had received special education?
• Special education students who left VR before receiving or completing services did notdiffer significantly from those who completed services or from nonspecial education peerson demographic or other characteristics.
What factors are associated with employment outcomes and earnings levels for young adult VR program participants?
• Overall, nearly two-thirds (63 percent) of youth VR consumers achieved an employmentoutcome as a result of VR services, with the rate for youth who had received specialeducation services in high school slightly higher than that for the other group (64 versus59 percent).
• Of those who achieved employment, nearly all of the nonspecial education youth enteredcompetitive employment (99 percent), compared with 81 percent of special educationstudents.
• Special education youth VR consumers earned less per hour ($5.57 versus $6.47) andworked fewer hours (33.6 versus 37.1) than did other youth, who more often obtained jobsin the professional/managerial/technical fields (21 versus 6 percent).
• Youth who achieved an employment outcome tended to rate their VR experience morehighly on all dimensions than did those who failed to achieve such an outcome.
• Multiple regression analyses found that:� Receipt of specific VR services, including education or training services, physical or
mental restoration services, and diagnostic or evaluation services, was stronglyassociated with achieving an employment outcome, and to entering competitiveemployment, for both special education recipients and nonrecipients.
� Receipt of public financial assistance (e.g., SSI-disabled, general assistance) wasnegatively related to achievement of an employment outcome for nonrecipients ofspecial education and to entering competitive employment for both groups.
� Self-esteem, locus of control, gender, and limitations in gross motor or cognitivefunctioning were also associated with employment outcomes.
Of individuals who received special education services and were accepted for VR services, whatwere their gains in terms of employment, functional capacities, and reduction in publicdependency?
• Youth who received special education services in high school made gains in employmentfrom acceptance to closure but not in reduction of public financial assistance.
• Youth who received VR services but did not achieve employment did experience areduction in such assistance between entry to and exit from VR.
• Functional status scores did not change significantly from acceptance to closure.
1
Chapter 1: IntroductionInitiated in fall 1992, the Longitudinal Study of the Vocational Rehabilitation (VR) Services
Program will address key questions of interest to Congress, the Rehabilitation ServicesAdministration (RSA), state VR agencies, and consumers about the performance of the state-federalVR program. The study’s design, reflecting the typical service patterns of VR program participants,calls for repeated contacts with individuals over a three-year period to obtain comprehensiveinformation to support judgments about the benefits to consumers and to society of the VR system asit currently operates.1
Because of the longitudinal nature of the study, RSA in designing it called for a number ofinterim reports that would, in an incremental fashion, begin making study findings available to policymakers and practitioners as the study proceeded over a six-year period. This report is the last of fourinterim reports that, along with the study’s final report, will answer key questions about theprogram’s impacts on participants. To orient readers to the study, this chapter of the report providesan overview of the study’s information goals and reporting schedule, data collection design andactivities, and current status.
This report addresses questions of interest to federal officials in the Office of SpecialEducation and Rehabilitative Services (OSERS) concerning the characteristics, services, andoutcomes of transition-aged youth (defined as youth with disabilities between the ages of 18 and 25)who applied for VR services during the study’s sample acquisition period (November 1994-December 1996). The analyses we conducted for the report address the specific questions developedby a task force of OSERS officials who are involved in ensuring the effectiveness of educational andvocational habilitation and rehabilitation services for the nation’s transitional youth with disabilities. The findings reported here are nationally representative and are generalizable to the transition-agedVR consumers nationwide. Through the use of sampling weights based on probabilities of selectionfor each study participant, we provide estimates of the numbers and distributions of transitional youthnationwide served by VR during the course of the study.
Specific questions we were asked to address in this report are as follows:
Question 1: Among transition-age VR consumers, what are the sociodemographic,disability, education, program participation, self-esteem and employment characteristicsof individuals who received special education services versus those who had notreceived special education services? How do these characteristics vary by specific
1Recently, RSA decided to extend the study to collect follow-up information on study participants for an additional
two years beyond the three years originally planned.
2
disability (e.g., learning disability, mental retardation, emotional disturbance/mentalillness)?
a. What are the sociodemographic characteristics (i.e., sex, race, family income)of individuals who received special education services versus those who hadnot received special education services?
b. What are the disability characteristics (i.e., Activities of Daily Living [ADLs];Instrumental Activities of Daily Living [IADLs]; functional limitations) ofindividuals who received special education services versus those who had notreceived special education services?
c. What are the education characteristics (i.e., completed years, special education,highest education level of responsible adult family member, literacy levels) ofindividuals who received special education services versus those who had notreceived special education services?
d. What are the program participation characteristics (i.e., SSI, SSDI, foodstamps, AFDC/TANF, Section 8 ) of individuals who received specialeducation services versus those who had not received special educationservices?
e. What are the self-esteem and locus of control of individuals who receivedspecial education services versus those who had not received special educationservices?
f. What are the employment characteristics (i.e., work history; currently working;months employed during 12 months; hours per week; monthly earnings) ofindividuals who received special education services versus those who had notreceived special education services?
Question 2: What reasons do transitional youth have for applying for VR services?What job or vocational interest(s) do they express? How do they differ according tospecial education status?
Question 3: For special education and nonspecial education students, what types ofservices and financial assistance did transition-age VR consumers receive? What arethe primary sources of support for these groups?
Question 4: To what extent are families and/or advocates involved in the VR processfor individuals who had received special education services versus those who had not?
Question 5: What variables are associated with attrition for individuals who hadreceived special education? What are the employment outcomes, public assistancestatuses, and satisfaction levels of individuals who have left without receiving orcompleting VR services; how does that attrition compare with the attrition oftransition-age individuals who did not receive special education?
Question 6: What sociodemographic, disability, education, program participation, andself-esteem factors are associated with employment outcomes and earnings levels foryoung adult VR program participants?
a. To what extent are sociodemographic factors (i.e., sex, race, family income)associated with employment for young adults with disabilities?
b. To what extent are disability factors (i.e., difficulties with ADLs and/orIADLs) associated with employment for young adults with disabilities?
3
c. To what extent are education factors (i.e., completed years, special education,literacy levels) associated with employment?
d. To what extent are program participation factors (i.e., SSI) associated withemployment?
e. To what extent are what are the self-esteem factors (i.e., locus of control,attitudes) associated with employment?
f. To what extent is consumer satisfaction associated with an employmentoutcome?
Question 7: Of individuals who received special education services and wereaccepted for VR services, what were their gains in terms of employment, functionalcapacities, and reduction in public dependency?
The organization of the report follows the sequence of these questions. Chapter 2 reports ouranalysis of characteristics of transitional youth with disabilities who applied for VR servicesaccording to whether or not they received special education services in high school, as indicated indocumentation in their VR case files. Chapter 3 examines transitional youths’ reasons for enteringVR, types of services they obtained, extent of family involvement in the VR process, and factorsassociated with attrition. Chapter 4 examines VR outcomes.
The findings contained in these chapters come from two primary sources. First isinformation abstracted from VR case files of study participants. Second is a series of detailedinterviews administered to all study participants at the time of entry into the study and at annualintervals for a subsequent three-year period. These interviews obtain information on work history,functional status, vocational interests, consumer attitudinal characteristics, perspectives on the VRexperience, and retention of earnings and employment, as well as such other outcomes asindependence and community integration, over time.
Remaining sections of this chapter review the longitudinal study’s reporting schedule, datacollection design, and current status, for the convenience of readers who may be somewhatunfamiliar with the study’s activities.
The Study’s Information Goals and Reporting ScheduleCommissioned by RSA and mandated by the Congress in the 1992 Rehabilitation Act
Amendments, the VR longitudinal study has been designed to answer the following questions:
• What short- and long-term economic and noneconomic (e.g., independent living,community integration) outcomes do VR applicants and consumers achieve as aresult of their participation in VR?
• What characteristics of individuals with disabilities affect their (1) access to andreceipt of VR services and (2) short- and long-term outcomes?
• To what extent does receipt of specific VR services contribute to successfulconsumer outcomes?
4
• In what ways and to what extent do local environmental factors influence VRconsumers’ services and outcomes?
• In what ways and to what extent do the operations, resources, and organizationalclimate of VR agencies influence consumers’ services and outcomes?
• What is the return on the VR program’s investment?
Definitive findings that address these study questions will follow completion of the study’slongitudinal data collection activities, scheduled for January 2000. Over the study period, the study’sdesign has permitted us to prepare interim findings on topics selected in consultation with RSAofficials. The first interim report, completed in October 1995, contained profiles of the local officesand their environments, based primarily on analyses from the 1990 decennial census and a mailsurvey of each of the 40 local VR offices participating in the study. The second interim report,completed in December 1996, described (1) characteristics of current and former VR consumers;(2) history of labor force participation among VR consumers; and (3) consumers’ perspectives ontheir VR services, service providers, and other aspects of their involvement with the VR program. The third interim report, dated August 1998, contained descriptive findings on characteristics ofpersons who achieved an employment outcome, including work history and details of their post-VRemployment and earnings status.
Data Collection DesignCollection of information required to address the evaluation’s questions, which began in
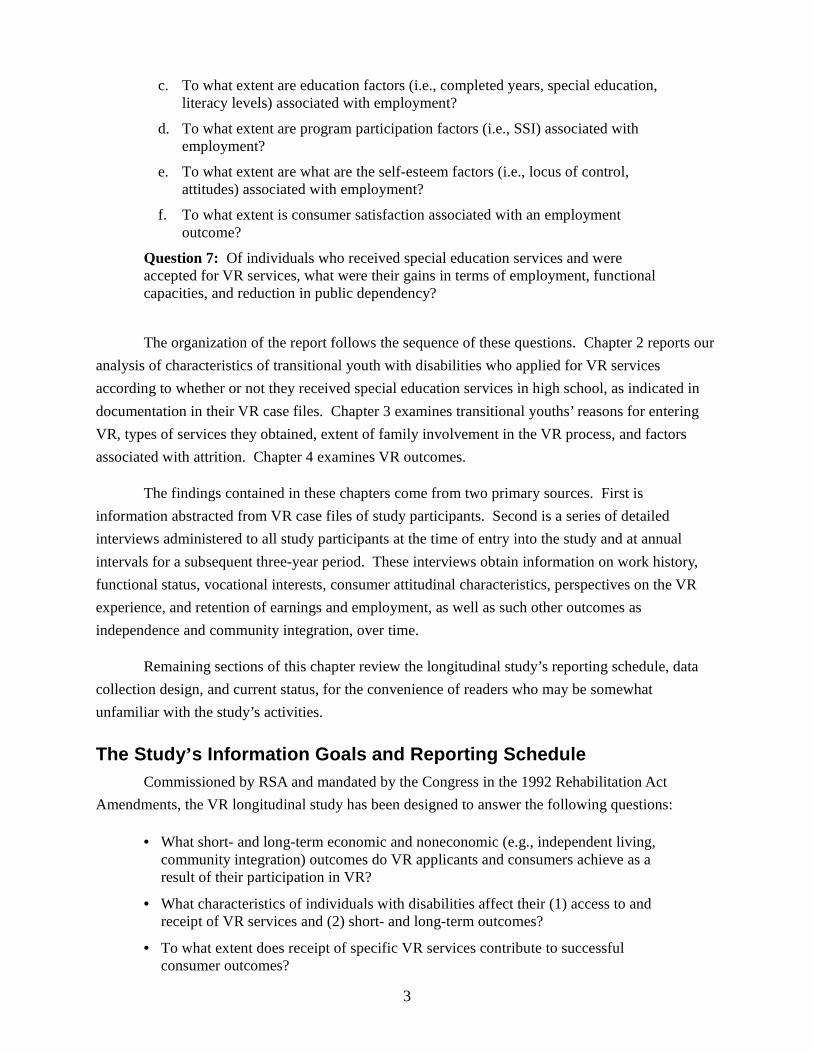
November 1994, will end in January 2000. (Data collection associated with the extended follow upof study participants began in summer 1999 and will extend through summer 2001, to be followed bya report on findings from that activity.) We are implementing a multistage, nationally representative,design that initially involved selection of a random sample of 40 local VR offices (in 32 stateagencies located in a total of 30 states) and a sample of 8,500 current and former consumers of VRservices. Owing to difficulties in employing and retaining qualified individuals to serve as field datacollectors, we have experienced some attrition, and at present, data collection continues in 37 of theoriginal 40 offices selected for study. Figure 1 indicates the states in which the participating officesoperate. Additionally, the original intent was to include a sample of 10,000 consumers, to enter thestudy over a 12 to 18-month period. The complexity of the data collection design, along withattrition and a variety of logistical changes in local office operations around the country, meant thatsample acquisition extended over 24 months, rather than the time originally intended. The period ofsample acquisition, which has paralleled a period of numerous changes in VR program operationsand activities (resulting from changes in the 1992 Amendments and a variety of other factors), led usto modify the sample design by reducing the total number of target participants to 8,500 while notsacrificing precision necessary to address the study’s broad research questions.
5
Figure 1. Location of Offices Participating in the Longitudinal Study
�
�
�
�
�
�
�
�
�
��
�
�
�
�
�
�
�
�
�
�
�
�
�
�
� ��
�
�
�
�
�
�
�
�
participating VR offices�
In order to assess the longer term outcomes of VR participation, the study implemented acohort design that entailed random selection of individuals at one of three stages of involvement withVR. We selected 25 percent of the total sample (approximately 2,125 persons) when they were in theapplication stage; the larger cohort, 50 percent of the sample (4,250 persons), entered the study whilethey were receiving VR services. The third cohort, 25 percent of the sample (2,125 persons), enteredthe study at or after VR case closure.
We follow each individual for a total of three years; some will still be receiving VR servicesat the end of the three-year period, although most will have left VR and be working, receiving otherservices, or engaging in a variety of other activities. Following baseline data collection, we conductan annual interview with each study participant, the topics of which depend on the individual’scurrent circumstances in regard to VR services. This design accommodates the average length ofstay in VR (nearly two years) while at the same time permitting us to track the post-VR earnings,employment, and community integration of individuals following exit from VR either as “successful”or “unsuccessful” closures.
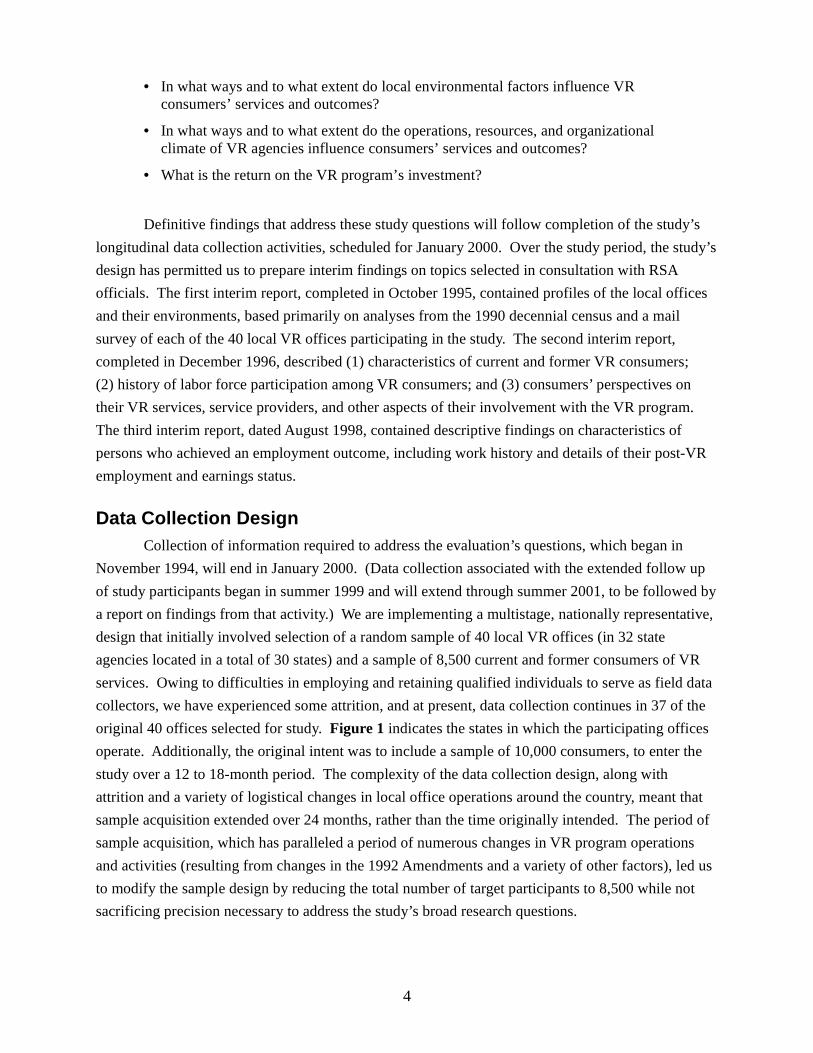
Figure 2 summarizes the data collection instruments and administration schedules for thestudy. As noted, the study’s field data collectors are gathering detailed information through baselineand annual interviews with study participants as well as through quarterly abstraction of case fileinformation. Additionally, we are obtaining information from local office managers, rehabilitationcounselors, and other office staff, along with information from state VR agencies on policies and
6
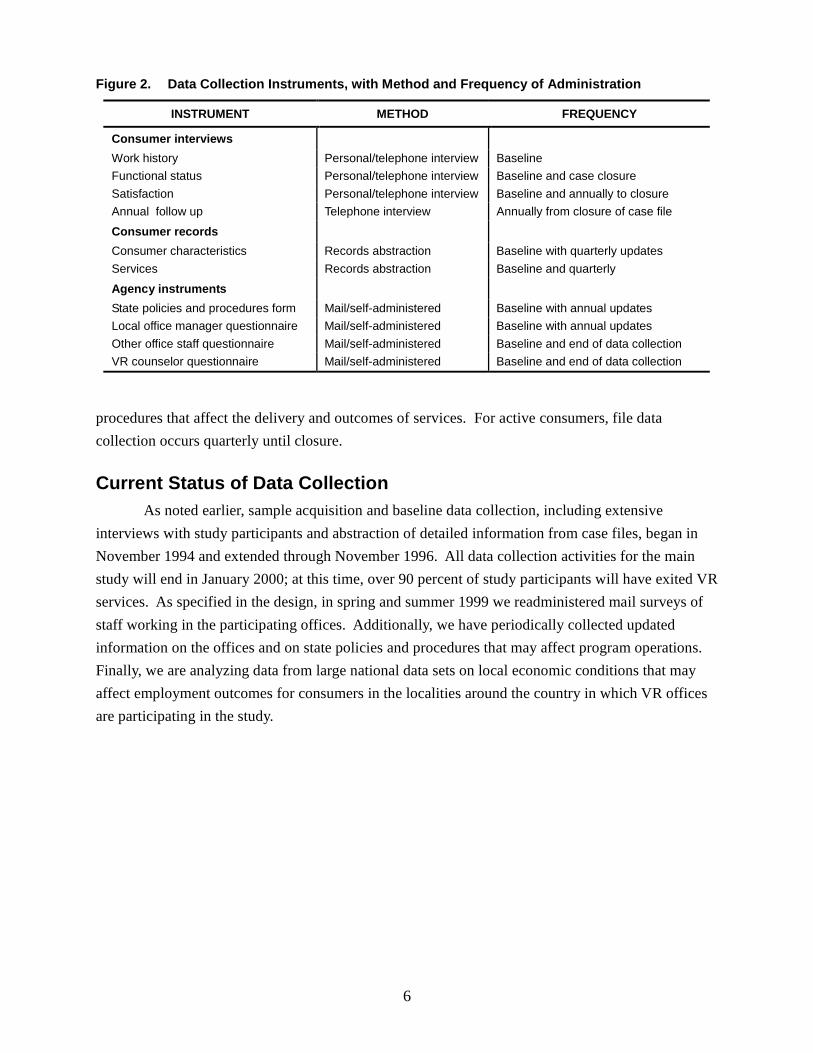
Figure 2. Data Collection Instruments, with Method and Frequency of Administration
INSTRUMENT METHOD FREQUENCY
Consumer interviewsWork history Personal/telephone interview BaselineFunctional status Personal/telephone interview Baseline and case closureSatisfaction Personal/telephone interview Baseline and annually to closureAnnual follow up Telephone interview Annually from closure of case fileConsumer recordsConsumer characteristics Records abstraction Baseline with quarterly updatesServices Records abstraction Baseline and quarterlyAgency instrumentsState policies and procedures form Mail/self-administered Baseline with annual updatesLocal office manager questionnaire Mail/self-administered Baseline with annual updatesOther office staff questionnaire Mail/self-administered Baseline and end of data collectionVR counselor questionnaire Mail/self-administered Baseline and end of data collection
procedures that affect the delivery and outcomes of services. For active consumers, file datacollection occurs quarterly until closure.
Current Status of Data CollectionAs noted earlier, sample acquisition and baseline data collection, including extensive
interviews with study participants and abstraction of detailed information from case files, began inNovember 1994 and extended through November 1996. All data collection activities for the mainstudy will end in January 2000; at this time, over 90 percent of study participants will have exited VRservices. As specified in the design, in spring and summer 1999 we readministered mail surveys ofstaff working in the participating offices. Additionally, we have periodically collected updatedinformation on the offices and on state policies and procedures that may affect program operations. Finally, we are analyzing data from large national data sets on local economic conditions that mayaffect employment outcomes for consumers in the localities around the country in which VR officesare participating in the study.
7
Chapter 2: Characteristics of Transition-Aged VR Consumers
Of particular interest to the OSERS transition task force is the extent to which the VRprogram provides services to transition-aged youth with disabilities and the outcomes of thoseservices in terms of employment and earnings. One aspect of this issue is what types of transition-aged youth are applying for and entering VR, what their entry patterns are, and whether most of themmove from high-school special education programs into VR or gain access to the VR system throughsome other route. To address these and related issues, we conducted a number of descriptiveanalyses of information from VR case files and interview data on the subset of the VR populationwho were transition aged (25 years old or younger) at the time of the analyses (i.e., in November1999). This chapter reports analyses for the first of the OSERS questions:
Question 1: Among transition-age VR consumers, what are the sociodemographic,disability, education, program participation, self-esteem and employmentcharacteristics of individuals who received special education services versus thosewho had not received special education services? How do these characteristics varyby specific disability (e.g., learning disability, mental retardation, emotionaldisturbance/mental illness)?
a. What are the sociodemographic characteristics (i.e., sex, race, family income)of individuals who received special education services versus those who hadnot received special education services?
b. What are the disability characteristics (i.e., Activities of Daily Living [ADLs];Instrumental Activities of Daily Living [IADLs]; functional limitations) ofindividuals who received special education services versus those who had notreceived special education services?
c. What are the education characteristics (i.e., completed years, special education,highest education level of responsible adult family member, literacy levels) ofindividuals who received special education services versus those who had notreceived special education services?
d. What are the public and private assistance patterns (i.e., SSI, SSDI, foodstamps, AFDC/TANF, Section 8 ) of individuals who received specialeducation services versus those who had not received special educationservices?
e. What are the self-esteem and locus of control of individuals who receivedspecial education services versus those who had not received special educationservices?
f. What are the employment characteristics (i.e., work history; currently working;months employed during 12 months; hours per week; monthly earnings) ofindividuals who received special education services versus those who had notreceived special education services?
8
To establish a context for these analyses, we first provide a brief overview of VRparticipation among transitional youth. Following the overview is a series of analyses thatcharacterize transitional youth who have received VR services based on whether or not they hadreceived special education services in high school. These analyses shed light on the VR experiencesand outcomes of students who move from special education into the VR system and compare thoseexperiences and outcomes to those of transitional youth whose background does not include receiptof special education in high school. Additionally, Appendix A contains a parallel set of analyses bydisability type.
Overview of Transitional Youth as VR Consumers2
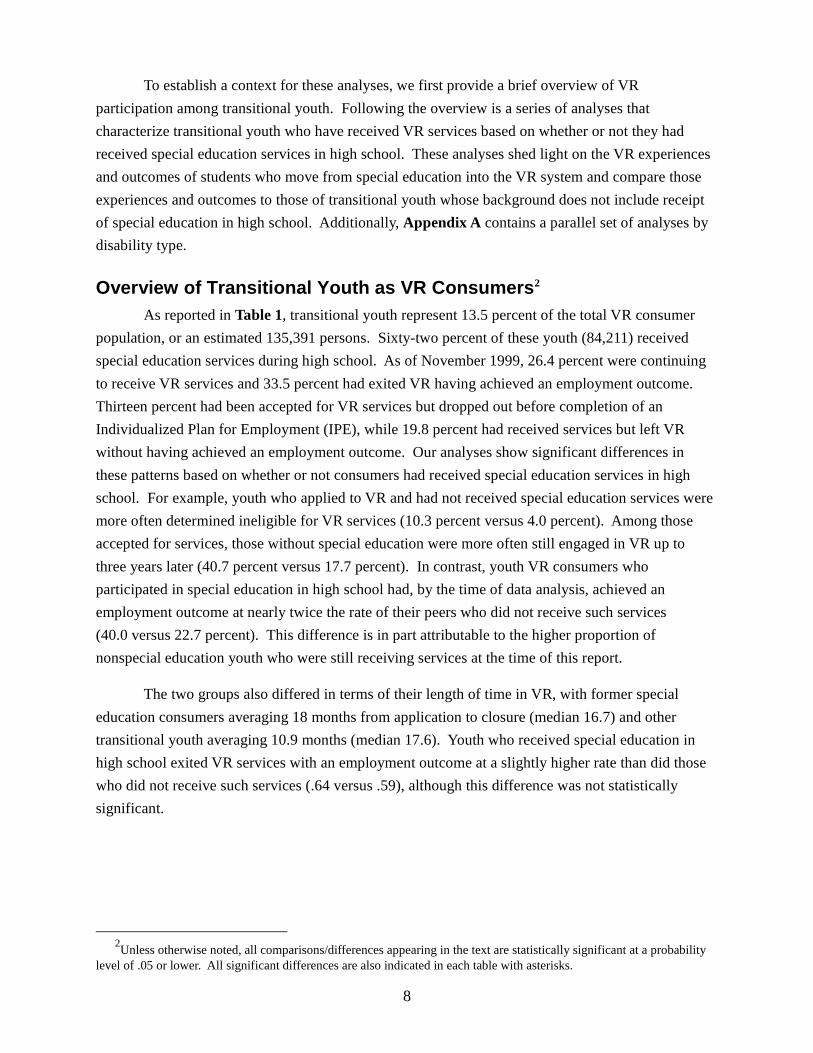
As reported in Table 1, transitional youth represent 13.5 percent of the total VR consumerpopulation, or an estimated 135,391 persons. Sixty-two percent of these youth (84,211) receivedspecial education services during high school. As of November 1999, 26.4 percent were continuingto receive VR services and 33.5 percent had exited VR having achieved an employment outcome. Thirteen percent had been accepted for VR services but dropped out before completion of anIndividualized Plan for Employment (IPE), while 19.8 percent had received services but left VRwithout having achieved an employment outcome. Our analyses show significant differences inthese patterns based on whether or not consumers had received special education services in highschool. For example, youth who applied to VR and had not received special education services weremore often determined ineligible for VR services (10.3 percent versus 4.0 percent). Among thoseaccepted for services, those without special education were more often still engaged in VR up tothree years later (40.7 percent versus 17.7 percent). In contrast, youth VR consumers whoparticipated in special education in high school had, by the time of data analysis, achieved anemployment outcome at nearly twice the rate of their peers who did not receive such services(40.0 versus 22.7 percent). This difference is in part attributable to the higher proportion ofnonspecial education youth who were still receiving services at the time of this report.
The two groups also differed in terms of their length of time in VR, with former specialeducation consumers averaging 18 months from application to closure (median 16.7) and othertransitional youth averaging 10.9 months (median 17.6). Youth who received special education inhigh school exited VR services with an employment outcome at a slightly higher rate than did thosewho did not receive such services (.64 versus .59), although this difference was not statisticallysignificant.
2Unless otherwise noted, all comparisons/differences appearing in the text are statistically significant at a probability
level of .05 or lower. All significant differences are also indicated in each table with asterisks.
9
Table 1. Characteristics of Transitional Youths’ Participation in VR, by Receipt of SpecialEducation in High School
RECEIVED SPECIAL EDUCATION SERVICES INHIGH SCHOOL
Transitional Youth Yes No Total
Number of participants 84,211 51,180 135,391Percentage of all transitional youth 62.2 37.8 100.0Percentage of total VR consumer population 8.4 5.1 13.5
Current status Percentage Percentage PercentageApplicant for services 1.3 0.5 1.0Not eligible for services* 4.0 10.3 6.3Currently receiving services* 17.7 40.7 26.4Dropped out before receiving services 14.6 10.3 13.0Dropped out after receiving services 22.4 15.7 19.8Achieved an employment outcome* 40.0 22.7 33.5
Total 100.0 100.0 100.0
Mean (median) Mean (median) Mean (median)Months in VR* 18.0 (16.7) 10.9 (17.6) 15.4 (12.7)
Rehabilitation rate(number achieving employment outcome divided
by all who received services) 0.64 0.59 0.63
Transitional youth are persons who are 25 years old or younger.* Indicates a significant difference (p<.05) in either the mean or the proportion of individuals who received special educationservices compared to individuals who did not receive special education services.
Source: VR Longitudinal Study, November 1999Preliminary findings: data collection is ongoing
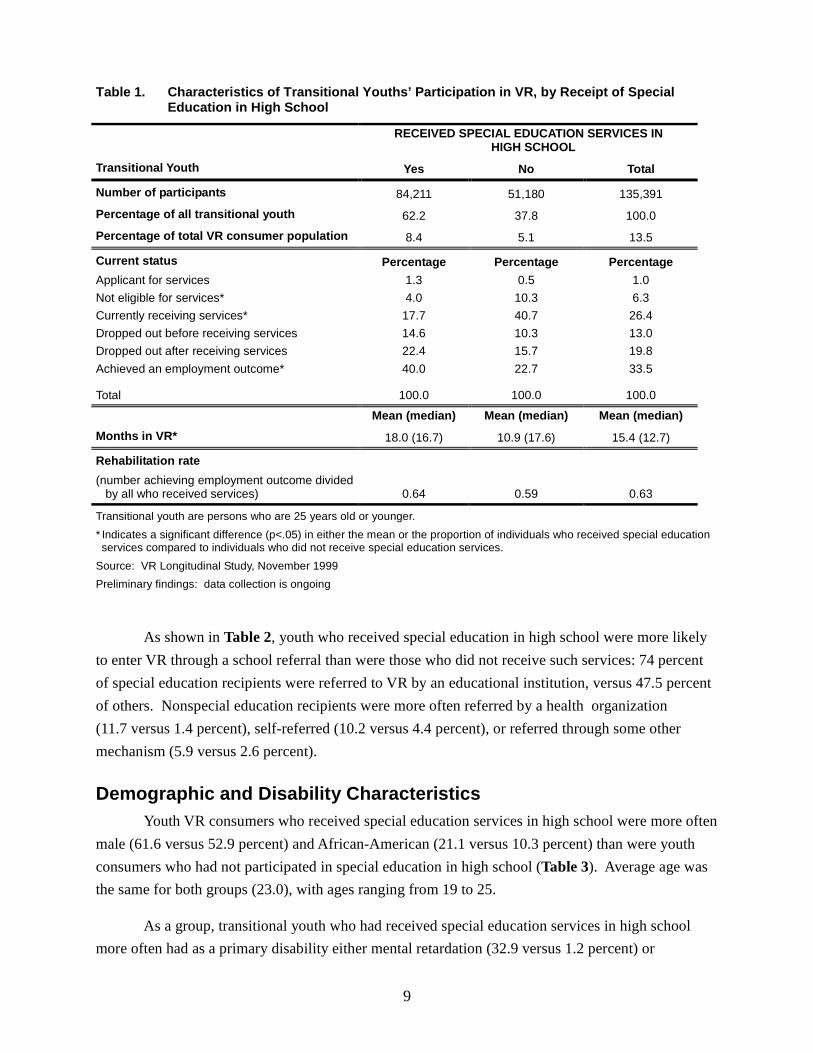
As shown in Table 2, youth who received special education in high school were more likelyto enter VR through a school referral than were those who did not receive such services: 74 percentof special education recipients were referred to VR by an educational institution, versus 47.5 percentof others. Nonspecial education recipients were more often referred by a health organization(11.7 versus 1.4 percent), self-referred (10.2 versus 4.4 percent), or referred through some othermechanism (5.9 versus 2.6 percent).
Demographic and Disability CharacteristicsYouth VR consumers who received special education services in high school were more often
male (61.6 versus 52.9 percent) and African-American (21.1 versus 10.3 percent) than were youthconsumers who had not participated in special education in high school (Table 3). Average age wasthe same for both groups (23.0), with ages ranging from 19 to 25.
As a group, transitional youth who had received special education services in high schoolmore often had as a primary disability either mental retardation (32.9 versus 1.2 percent) or
10
Table 2. Source of Referral to VR Among Transitional Youth, by Receipt of Special Education inHigh School
RECEIVED SPECIAL EDUCATION SERVICES IN HIGH SCHOOL
Referral Source Yes No Total
Percentage Percentage PercentageEducational institution* 74.0 47.5 63.9Rehabilitation facility 2.0 2.5 2.2Hospital, physician, or other health
organization*1.4 11.7 5.3
Residential institution 0.4 0.7 0.5Other agency/organization 6.5 10.7 8.1Family member or friend 8.7 10.8 9.5Self* 4.4 10.2 6.6Other* 2.6 5.9 3.9Total 100.0 100.0 100.0
Transitional youth are persons who are 25 years old or younger.* Indicates a significant difference (p<.05) in either the mean or the proportion of individuals who received special educationservices compared to individuals who did not receive special education services.
Source: VR Longitudinal Study, November 1999Preliminary findings: data collection is ongoing
Table 3. Demographic Characteristics of Transitional Youth at Entry, by Receipt of SpecialEducation in High Schoola
RECEIVED SPECIAL EDUCATION SERVICES IN HIGH SCHOOL
Characteristic Yes No Total
Gender Percentage Percentage PercentageMale* 61.6 52.9 58.3Female* 38.4 47.1 41.7Total 100.0 100.0 100.0
Mean (median) Mean (median) Mean (median)
Age 23.0 (23.0) 23.0 (23.0) 23.0 (23.0)Range 19 - 25 19 - 25 19 - 25
Race/ethnicity Percentage Percentage PercentageWhite* 77.1 89.2 81.7African-American* 21.1 10.3 17.0Alaska Native or American Indian 0.4 0.2 0.3Asian or Pacific Islander 1.4 0.3 1.0Total 100.0 100.0 100.0Of Hispanic origin 11.8 9.4 10.9
Transitional youth are persons who are 25 years old or younger.aComparable data for all special education students were not available.* Indicates a significant difference (p<.05) in either the mean or the proportion of individuals who received special educationservices compared to individuals who did not receive special education services.
Source: VR Longitudinal Study, November 1999Preliminary findings: data collection is ongoing
11
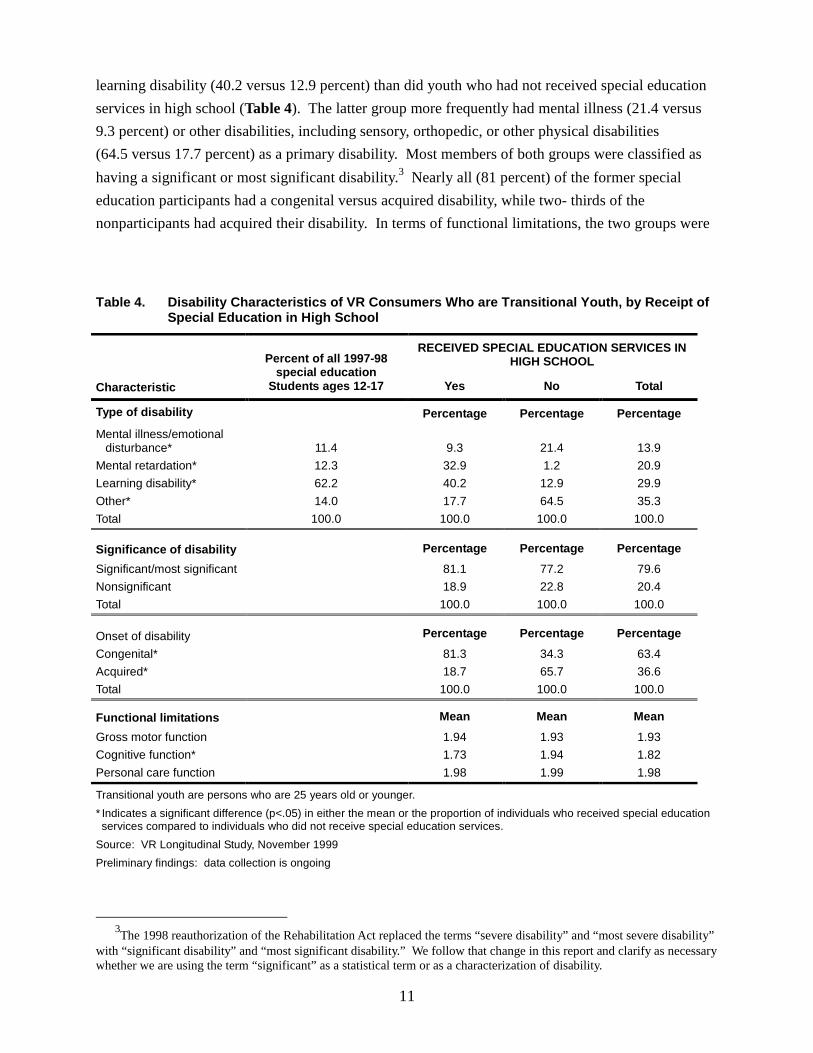
learning disability (40.2 versus 12.9 percent) than did youth who had not received special educationservices in high school (Table 4). The latter group more frequently had mental illness (21.4 versus9.3 percent) or other disabilities, including sensory, orthopedic, or other physical disabilities(64.5 versus 17.7 percent) as a primary disability. Most members of both groups were classified ashaving a significant or most significant disability.3 Nearly all (81 percent) of the former specialeducation participants had a congenital versus acquired disability, while two- thirds of thenonparticipants had acquired their disability. In terms of functional limitations, the two groups were
Table 4. Disability Characteristics of VR Consumers Who are Transitional Youth, by Receipt ofSpecial Education in High School
RECEIVED SPECIAL EDUCATION SERVICES INHIGH SCHOOL
Characteristic
Percent of all 1997-98special education
Students ages 12-17 Yes No Total
Type of disability Percentage Percentage PercentageMental illness/emotional
disturbance* 11.4 9.3 21.4 13.9Mental retardation* 12.3 32.9 1.2 20.9Learning disability* 62.2 40.2 12.9 29.9Other* 14.0 17.7 64.5 35.3Total 100.0 100.0 100.0 100.0
Significance of disability Percentage Percentage PercentageSignificant/most significant 81.1 77.2 79.6Nonsignificant 18.9 22.8 20.4Total 100.0 100.0 100.0
Onset of disability Percentage Percentage PercentageCongenital* 81.3 34.3 63.4Acquired* 18.7 65.7 36.6Total 100.0 100.0 100.0
Functional limitations Mean Mean MeanGross motor function 1.94 1.93 1.93Cognitive function* 1.73 1.94 1.82Personal care function 1.98 1.99 1.98
Transitional youth are persons who are 25 years old or younger.* Indicates a significant difference (p<.05) in either the mean or the proportion of individuals who received special educationservices compared to individuals who did not receive special education services.
Source: VR Longitudinal Study, November 1999Preliminary findings: data collection is ongoing
3The 1998 reauthorization of the Rehabilitation Act replaced the terms “severe disability” and “most severe disability”
with “significant disability” and “most significant disability.” We follow that change in this report and clarify as necessarywhether we are using the term “significant” as a statistical term or as a characterization of disability.
12
nearly the same in gross motor and personal care function. They differed, however, in terms ofcognitive function, with the nonspecial education group functioning at a higher level on thisdimension.4
Based on data from Office of Special Education Programs (OSEP) on the disabilities of youthaged 12-17 who received special education services in school year 1997-98, special educationstudents overall were more likely than those who received VR services to have learning disabilities(62.2 versus 40.2 percent) and mental illness or emotional disturbance (11.4 versus 9.3 percent). Special education recipients who received VR services were more likely than the 12-17 year-oldgroup to have mental retardation (32.9 versus 12.3 percent) or other disabilities (17.7 versus 14.0percent).
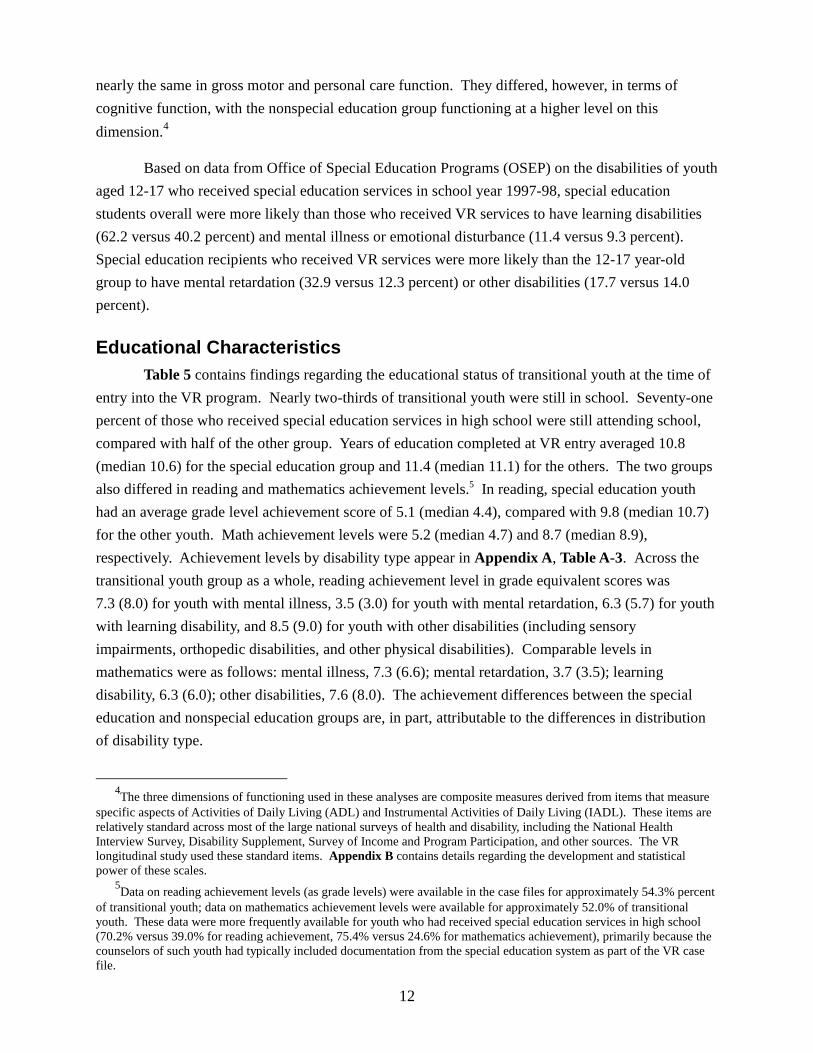
Educational CharacteristicsTable 5 contains findings regarding the educational status of transitional youth at the time of
entry into the VR program. Nearly two-thirds of transitional youth were still in school. Seventy-onepercent of those who received special education services in high school were still attending school,compared with half of the other group. Years of education completed at VR entry averaged 10.8(median 10.6) for the special education group and 11.4 (median 11.1) for the others. The two groupsalso differed in reading and mathematics achievement levels.5 In reading, special education youthhad an average grade level achievement score of 5.1 (median 4.4), compared with 9.8 (median 10.7)for the other youth. Math achievement levels were 5.2 (median 4.7) and 8.7 (median 8.9),respectively. Achievement levels by disability type appear in Appendix A, Table A-3. Across thetransitional youth group as a whole, reading achievement level in grade equivalent scores was7.3 (8.0) for youth with mental illness, 3.5 (3.0) for youth with mental retardation, 6.3 (5.7) for youthwith learning disability, and 8.5 (9.0) for youth with other disabilities (including sensoryimpairments, orthopedic disabilities, and other physical disabilities). Comparable levels inmathematics were as follows: mental illness, 7.3 (6.6); mental retardation, 3.7 (3.5); learningdisability, 6.3 (6.0); other disabilities, 7.6 (8.0). The achievement differences between the specialeducation and nonspecial education groups are, in part, attributable to the differences in distributionof disability type.
4The three dimensions of functioning used in these analyses are composite measures derived from items that measure
specific aspects of Activities of Daily Living (ADL) and Instrumental Activities of Daily Living (IADL). These items arerelatively standard across most of the large national surveys of health and disability, including the National HealthInterview Survey, Disability Supplement, Survey of Income and Program Participation, and other sources. The VRlongitudinal study used these standard items. Appendix B contains details regarding the development and statisticalpower of these scales.
5Data on reading achievement levels (as grade levels) were available in the case files for approximately 54.3% percentof transitional youth; data on mathematics achievement levels were available for approximately 52.0% of transitionalyouth. These data were more frequently available for youth who had received special education services in high school(70.2% versus 39.0% for reading achievement, 75.4% versus 24.6% for mathematics achievement), primarily because thecounselors of such youth had typically included documentation from the special education system as part of the VR casefile.
13
Table 5. Educational Characteristics of Transitional Youth at Entry to VR, by Receipt of SpecialEducation in High School
RECEIVED SPECIAL EDUCATION SERVICES IN HIGH SCHOOL
Characteristic Yes No Total
Percentage Percentage Percentage
Still in school* 70.9 51.5 63.6
Mean (median) Mean (median) Mean (median)
Years of education completed* 10.8 (10.6) 11.4 (11.1) 11.0 (10.8)
Mean (median) Mean (median) Mean (median)
Reading achievement level* 5.1 (4.4) 9.8 (10.7) 6.3 (5.4)
Mean (median) Mean (median) Mean (median)
Mathematics achievement level* 5.2 (4.7) 8.7 (8.9) 6.0 (5.3)
Transitional youth are persons who are 25 years old or younger.* Indicates a significant difference (p<.05) in either the mean or the proportion of individuals with an employment outcomecompared to individuals who receive services but did not have an employment outcome.
Source: VR Longitudinal Study, November 1999Preliminary findings: data collection is ongoing
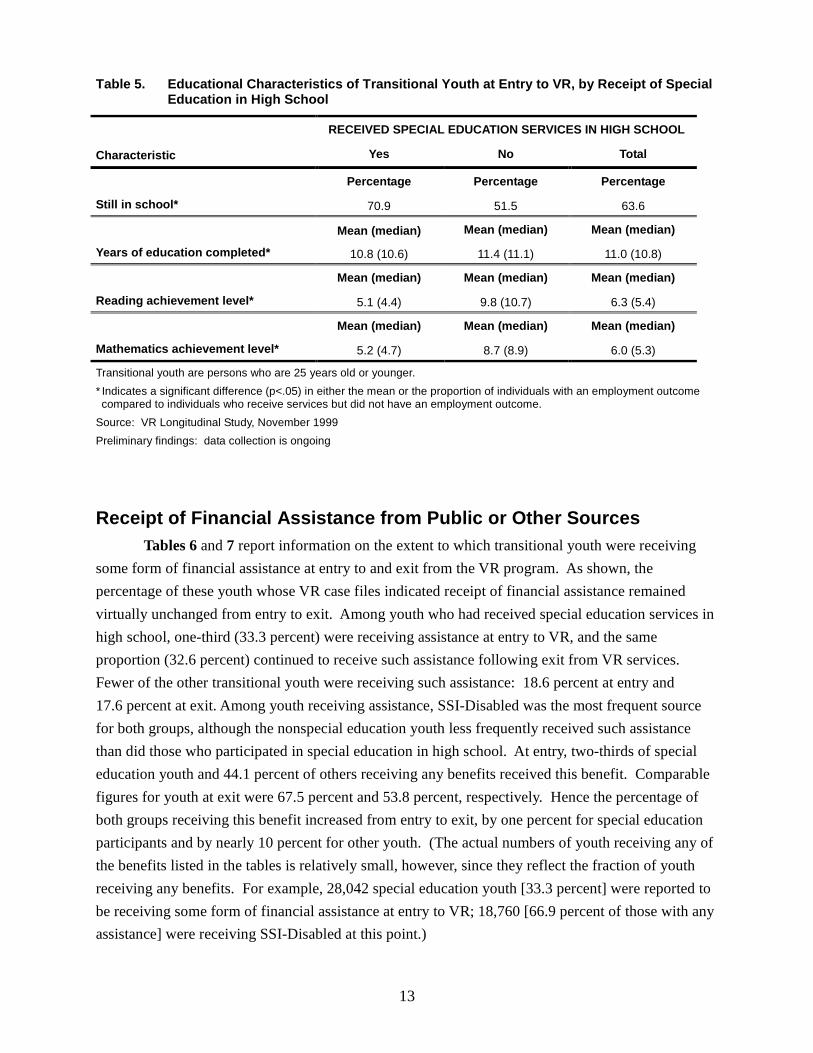
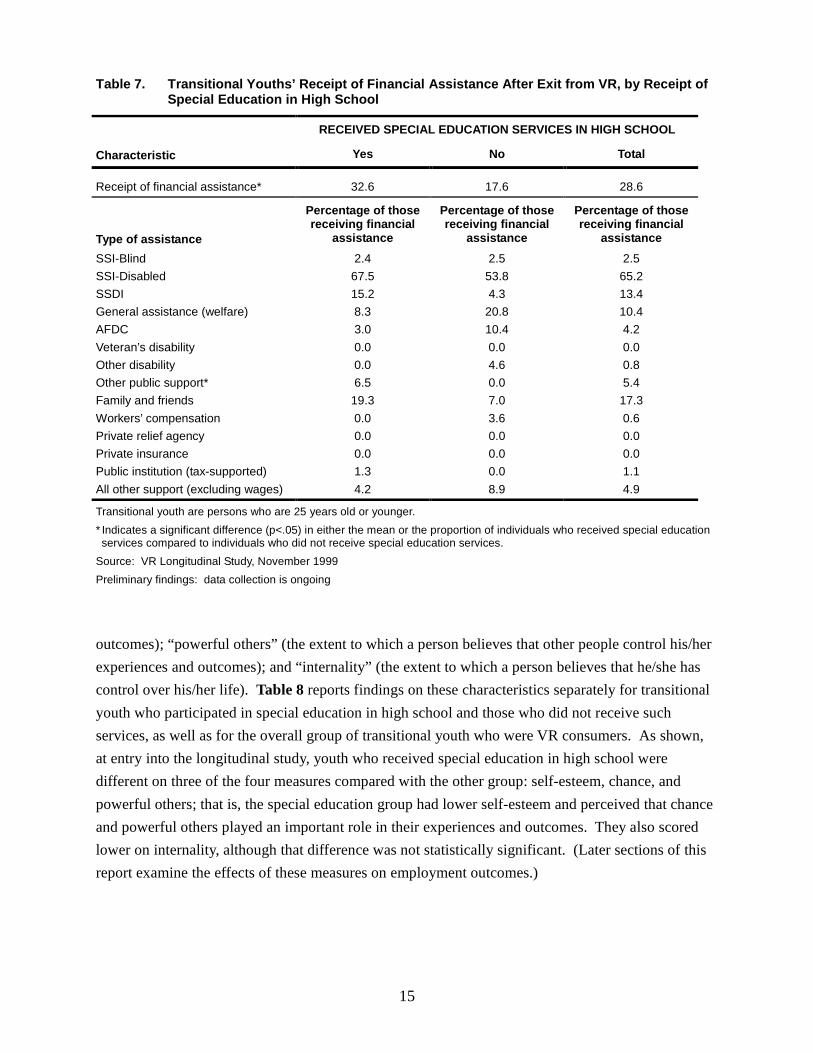
Receipt of Financial Assistance from Public or Other SourcesTables 6 and 7 report information on the extent to which transitional youth were receiving
some form of financial assistance at entry to and exit from the VR program. As shown, thepercentage of these youth whose VR case files indicated receipt of financial assistance remainedvirtually unchanged from entry to exit. Among youth who had received special education services inhigh school, one-third (33.3 percent) were receiving assistance at entry to VR, and the sameproportion (32.6 percent) continued to receive such assistance following exit from VR services. Fewer of the other transitional youth were receiving such assistance: 18.6 percent at entry and17.6 percent at exit. Among youth receiving assistance, SSI-Disabled was the most frequent sourcefor both groups, although the nonspecial education youth less frequently received such assistancethan did those who participated in special education in high school. At entry, two-thirds of specialeducation youth and 44.1 percent of others receiving any benefits received this benefit. Comparablefigures for youth at exit were 67.5 percent and 53.8 percent, respectively. Hence the percentage ofboth groups receiving this benefit increased from entry to exit, by one percent for special educationparticipants and by nearly 10 percent for other youth. (The actual numbers of youth receiving any ofthe benefits listed in the tables is relatively small, however, since they reflect the fraction of youthreceiving any benefits. For example, 28,042 special education youth [33.3 percent] were reported tobe receiving some form of financial assistance at entry to VR; 18,760 [66.9 percent of those with anyassistance] were receiving SSI-Disabled at this point.)
14
Table 6. Transitional Youths’ Receipt of Financial Assistance at Entry to VR, by Receipt ofSpecial Education in High School
RECEIVED SPECIAL EDUCATION SERVICES IN HIGH SCHOOL
Characteristic Yes No Total
Receipt of financial assistance* 33.3 18.6 27.8
Type of assistance
Percentage of thosereceiving financial
assistance
Percentage of thosereceiving financial
assistance
Percentage of thosereceiving financial
assistanceSSI-Blind 1.4 4.7 2.2SSI-Disabled* 66.9 44.1 61.0SSDI 9.8 13.1 10.6General assistance (welfare) 6.5 15.0 8.6AFDC 6.4 6.9 6.5Veteran’s disability 0.0 0.0 0.0Other disability 2.6 3.1 2.7Other public support 3.6 8.7 4.9Family and friends* 32.0 20.3 29.1Workers’ compensation 0.0 5.7 1.4Private relief agency 0.0 0.0 0.0Private insurance 1.1 4.0 1.9Public institution (tax-supported) 0.9 0.0 0.7All other support (excluding wages)* 3.7 1.2 3.0
Transitional youth are persons who are 25 years old or younger.* Indicates a significant difference (p<.05) in either the mean or the proportion of individuals who received special educationservices compared to individuals who did not receive special education services.
Source: VR Longitudinal Study, November 1999Preliminary findings: data collection is ongoing
The second most frequently recorded source of assistance was family or friends; receipt ofsupport from this source declined from VR entry to exit for both groups. Among special educationyouth VR consumers, the change was from 32.0 to 19.3 percent, while for other youth the changewas from 20.3 to 7.0 percent. Other sources of support that both groups relied on included SSDI(9.8 percent of special education youth and 13.1 percent of others), general assistance (6.5 percent ofspecial education youth and 15.0 percent of others), and AFDC/TANF (6.4 and 6.9 percent,respectively).
Self-Esteem and Locus of ControlTo examine the extent to which selected personal characteristics might be associated with
outcomes that VR consumers achieve as a result of receipt of services (see Chapter 4), weadministered interviews containing items that support analysis of such factors as self-esteem andpsychosocial function. The latter falls into three “locus-of-control” scales, or composites, thatmeasure “chance” (the extent to which one believes that chance controls his/her experiences and
15
Table 7. Transitional Youths’ Receipt of Financial Assistance After Exit from VR, by Receipt ofSpecial Education in High School
RECEIVED SPECIAL EDUCATION SERVICES IN HIGH SCHOOL
Characteristic Yes No Total
Receipt of financial assistance* 32.6 17.6 28.6
Type of assistance
Percentage of thosereceiving financial
assistance
Percentage of thosereceiving financial
assistance
Percentage of thosereceiving financial
assistanceSSI-Blind 2.4 2.5 2.5SSI-Disabled 67.5 53.8 65.2SSDI 15.2 4.3 13.4General assistance (welfare) 8.3 20.8 10.4AFDC 3.0 10.4 4.2Veteran’s disability 0.0 0.0 0.0Other disability 0.0 4.6 0.8Other public support* 6.5 0.0 5.4Family and friends 19.3 7.0 17.3Workers’ compensation 0.0 3.6 0.6Private relief agency 0.0 0.0 0.0Private insurance 0.0 0.0 0.0Public institution (tax-supported) 1.3 0.0 1.1All other support (excluding wages) 4.2 8.9 4.9
Transitional youth are persons who are 25 years old or younger.* Indicates a significant difference (p<.05) in either the mean or the proportion of individuals who received special educationservices compared to individuals who did not receive special education services.
Source: VR Longitudinal Study, November 1999Preliminary findings: data collection is ongoing
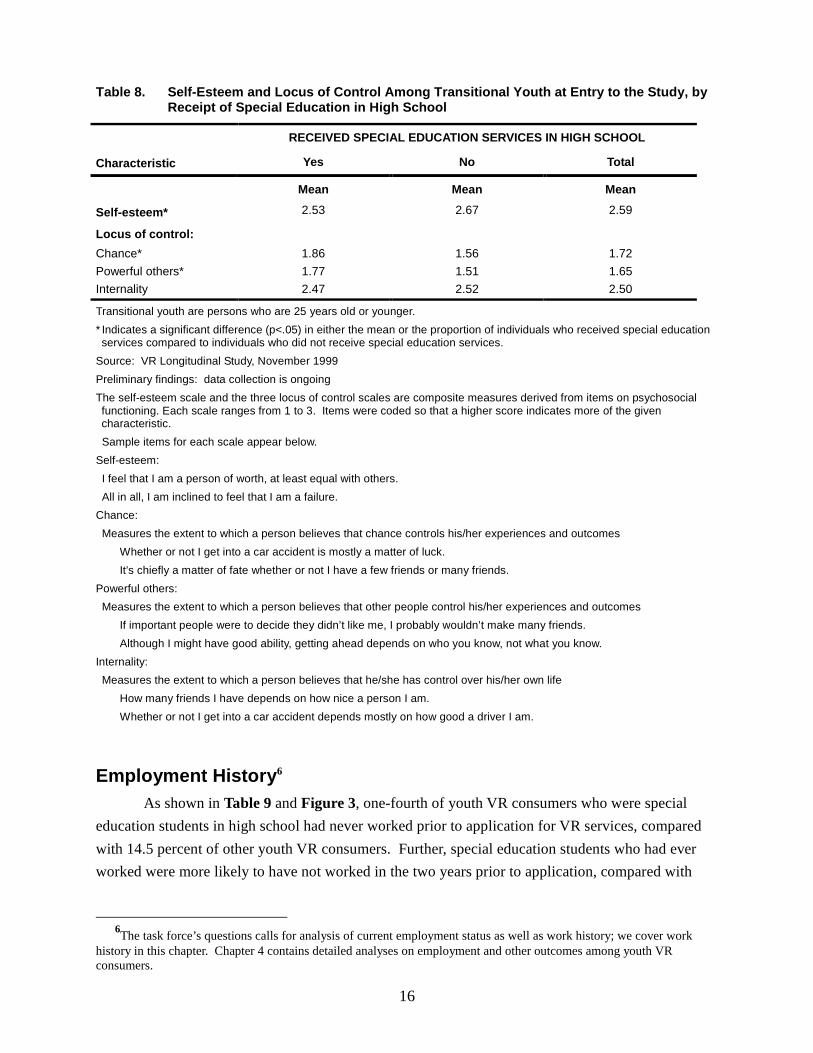
outcomes); “powerful others” (the extent to which a person believes that other people control his/herexperiences and outcomes); and “internality” (the extent to which a person believes that he/she hascontrol over his/her life). Table 8 reports findings on these characteristics separately for transitionalyouth who participated in special education in high school and those who did not receive suchservices, as well as for the overall group of transitional youth who were VR consumers. As shown,at entry into the longitudinal study, youth who received special education in high school weredifferent on three of the four measures compared with the other group: self-esteem, chance, andpowerful others; that is, the special education group had lower self-esteem and perceived that chanceand powerful others played an important role in their experiences and outcomes. They also scoredlower on internality, although that difference was not statistically significant. (Later sections of thisreport examine the effects of these measures on employment outcomes.)
16
Table 8. Self-Esteem and Locus of Control Among Transitional Youth at Entry to the Study, byReceipt of Special Education in High School
RECEIVED SPECIAL EDUCATION SERVICES IN HIGH SCHOOL
Characteristic Yes No Total
Mean Mean Mean
Self-esteem* 2.53 2.67 2.59
Locus of control:Chance* 1.86 1.56 1.72Powerful others* 1.77 1.51 1.65Internality 2.47 2.52 2.50
Transitional youth are persons who are 25 years old or younger.* Indicates a significant difference (p<.05) in either the mean or the proportion of individuals who received special educationservices compared to individuals who did not receive special education services.
Source: VR Longitudinal Study, November 1999Preliminary findings: data collection is ongoingThe self-esteem scale and the three locus of control scales are composite measures derived from items on psychosocialfunctioning. Each scale ranges from 1 to 3. Items were coded so that a higher score indicates more of the givencharacteristic.Sample items for each scale appear below.
Self-esteem:I feel that I am a person of worth, at least equal with others.All in all, I am inclined to feel that I am a failure.
Chance:Measures the extent to which a person believes that chance controls his/her experiences and outcomes
Whether or not I get into a car accident is mostly a matter of luck.It’s chiefly a matter of fate whether or not I have a few friends or many friends.
Powerful others:Measures the extent to which a person believes that other people control his/her experiences and outcomes
If important people were to decide they didn’t like me, I probably wouldn’t make many friends.Although I might have good ability, getting ahead depends on who you know, not what you know.
Internality:Measures the extent to which a person believes that he/she has control over his/her own life
How many friends I have depends on how nice a person I am.Whether or not I get into a car accident depends mostly on how good a driver I am.
Employment History6
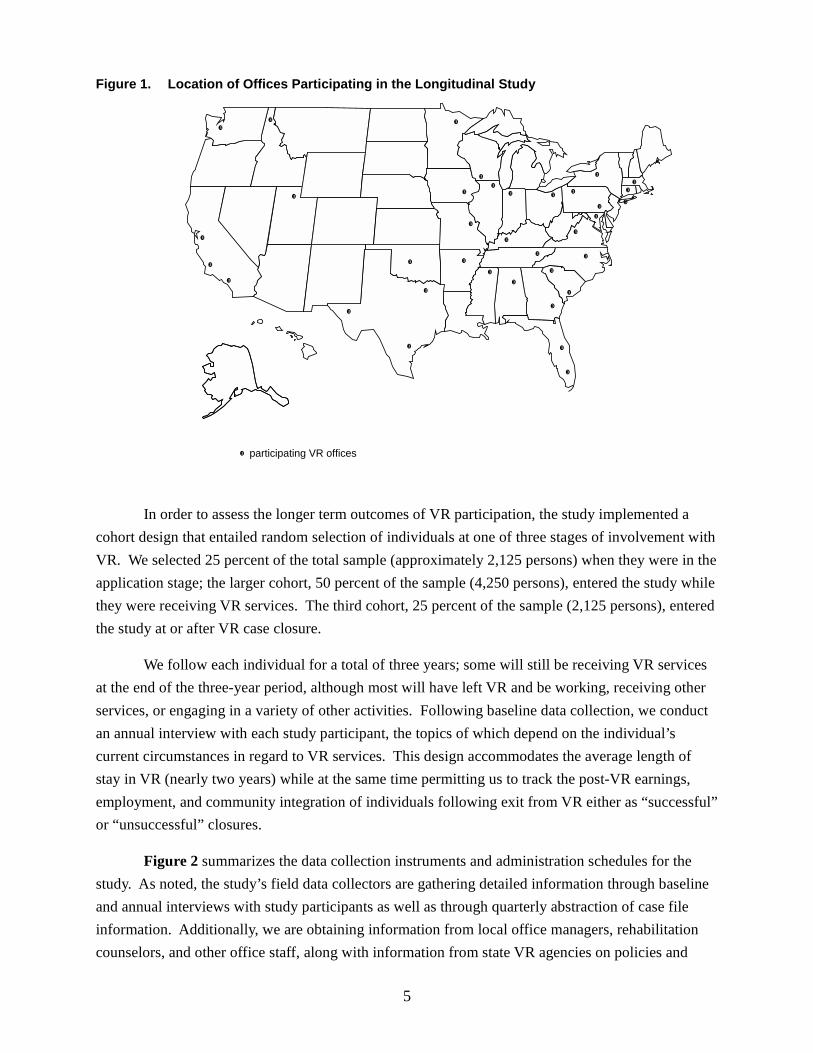
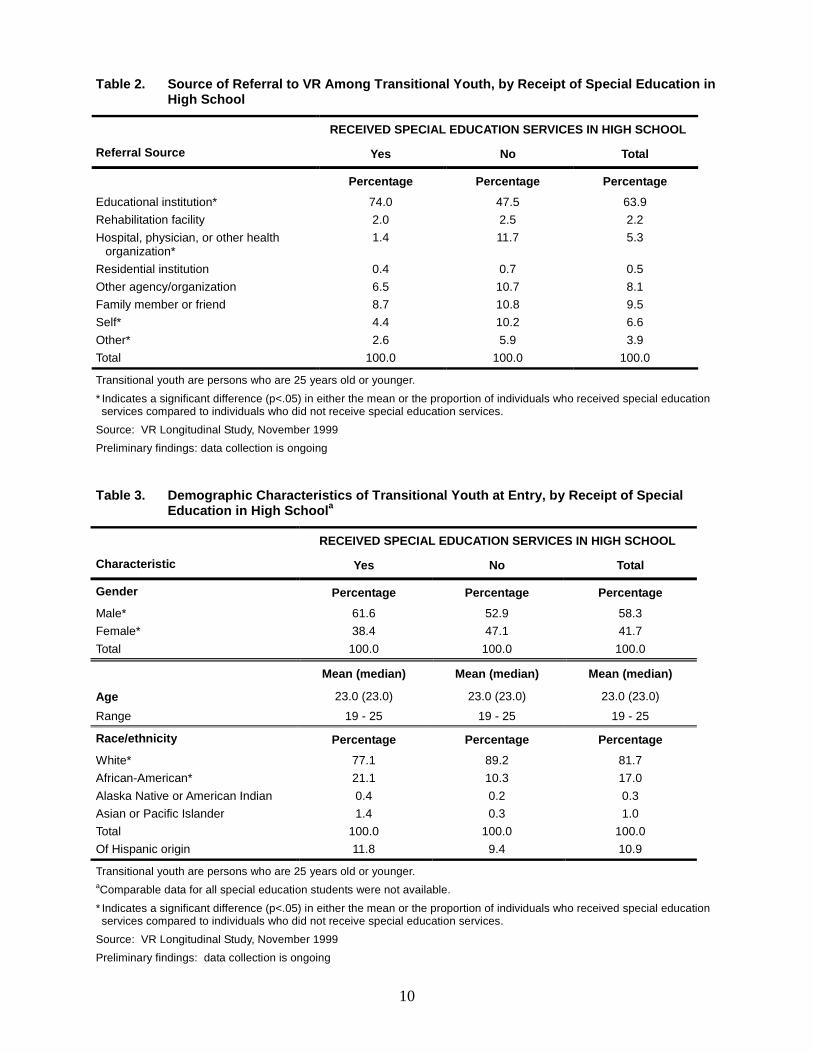
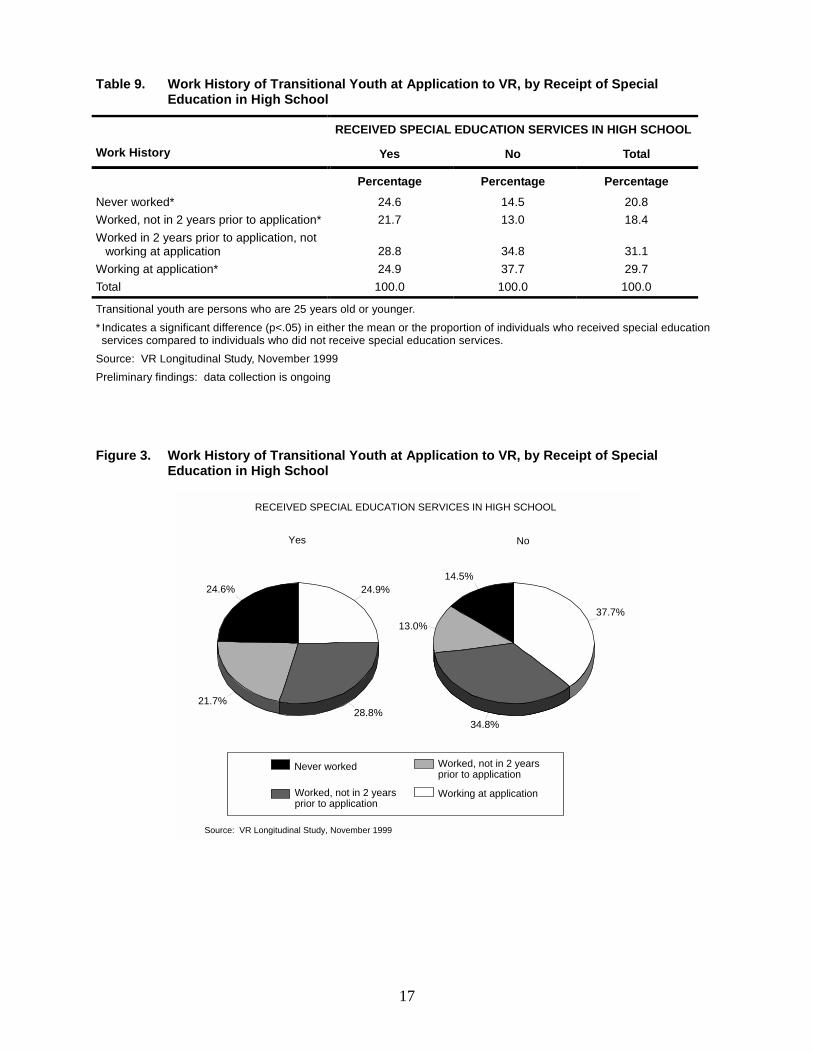
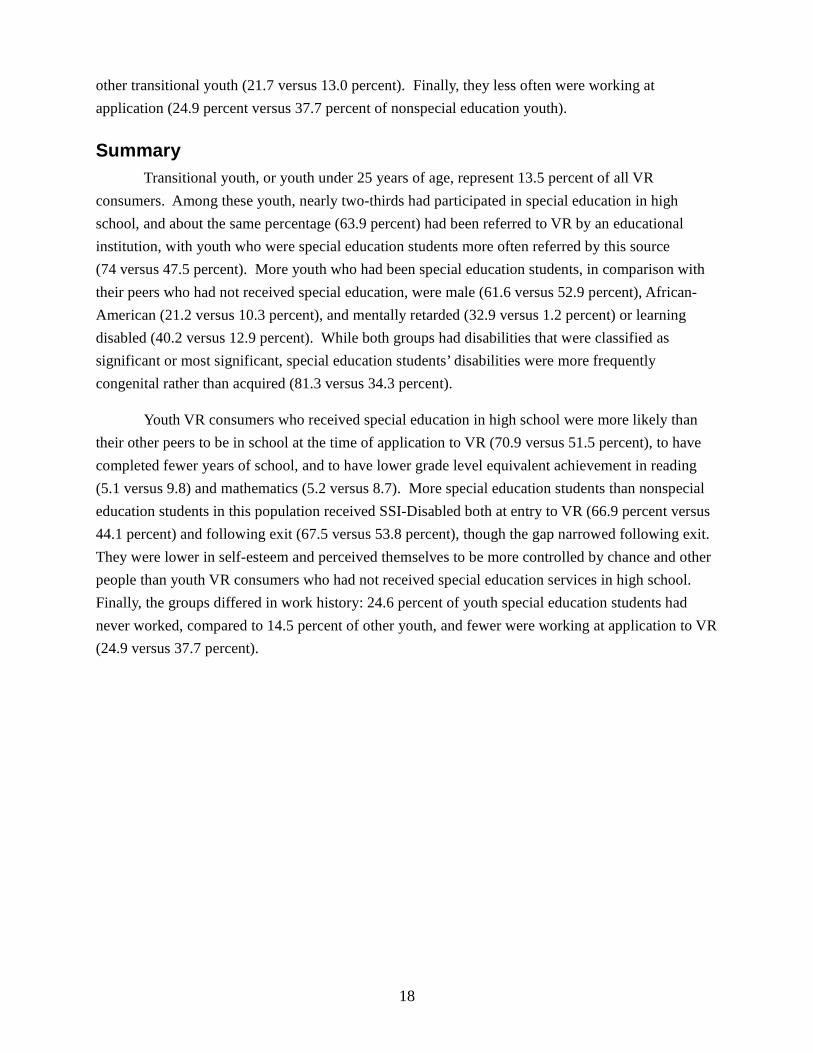
As shown in Table 9 and Figure 3, one-fourth of youth VR consumers who were specialeducation students in high school had never worked prior to application for VR services, comparedwith 14.5 percent of other youth VR consumers. Further, special education students who had everworked were more likely to have not worked in the two years prior to application, compared with
6The task force’s questions calls for analysis of current employment status as well as work history; we cover work
history in this chapter. Chapter 4 contains detailed analyses on employment and other outcomes among youth VRconsumers.
17
Table 9. Work History of Transitional Youth at Application to VR, by Receipt of SpecialEducation in High School
RECEIVED SPECIAL EDUCATION SERVICES IN HIGH SCHOOL
Work History Yes No Total
Percentage Percentage PercentageNever worked* 24.6 14.5 20.8Worked, not in 2 years prior to application* 21.7 13.0 18.4Worked in 2 years prior to application, not
working at application 28.8 34.8 31.1Working at application* 24.9 37.7 29.7Total 100.0 100.0 100.0
Transitional youth are persons who are 25 years old or younger.* Indicates a significant difference (p<.05) in either the mean or the proportion of individuals who received special educationservices compared to individuals who did not receive special education services.
Source: VR Longitudinal Study, November 1999Preliminary findings: data collection is ongoing
Figure 3. Work History of Transitional Youth at Application to VR, by Receipt of SpecialEducation in High School
RECEIVED SPECIAL EDUCATION SERVICES IN HIGH SCHOOL
Source: VR Longitudinal Study, November 1999
24.6%
21.7%28.8%
24.9%14.5%
13.0%
34.8%
37.7%
Yes No
Never worked
Worked, not in 2 yearsprior to application
Worked, not in 2 yearsprior to application
Working at application
18
other transitional youth (21.7 versus 13.0 percent). Finally, they less often were working atapplication (24.9 percent versus 37.7 percent of nonspecial education youth).
SummaryTransitional youth, or youth under 25 years of age, represent 13.5 percent of all VR
consumers. Among these youth, nearly two-thirds had participated in special education in highschool, and about the same percentage (63.9 percent) had been referred to VR by an educationalinstitution, with youth who were special education students more often referred by this source(74 versus 47.5 percent). More youth who had been special education students, in comparison withtheir peers who had not received special education, were male (61.6 versus 52.9 percent), African-American (21.2 versus 10.3 percent), and mentally retarded (32.9 versus 1.2 percent) or learningdisabled (40.2 versus 12.9 percent). While both groups had disabilities that were classified assignificant or most significant, special education students’ disabilities were more frequentlycongenital rather than acquired (81.3 versus 34.3 percent).
Youth VR consumers who received special education in high school were more likely thantheir other peers to be in school at the time of application to VR (70.9 versus 51.5 percent), to havecompleted fewer years of school, and to have lower grade level equivalent achievement in reading(5.1 versus 9.8) and mathematics (5.2 versus 8.7). More special education students than nonspecialeducation students in this population received SSI-Disabled both at entry to VR (66.9 percent versus44.1 percent) and following exit (67.5 versus 53.8 percent), though the gap narrowed following exit. They were lower in self-esteem and perceived themselves to be more controlled by chance and otherpeople than youth VR consumers who had not received special education services in high school. Finally, the groups differed in work history: 24.6 percent of youth special education students hadnever worked, compared to 14.5 percent of other youth, and fewer were working at application to VR(24.9 versus 37.7 percent).
19
Chapter 3: Selected Aspects of the VR ExperienceAs noted in the previous chapter, a substantial proportion (64 percent overall, and 74 percent
of youth special education students) of transition-aged youth were referred to the VR program by aneducational institution. Further, 64 percent (and 71 percent of special education students) were stillin school at time of their application to VR. Of interest to policymakers involved in efforts toimprove the educational and employment outcomes of youth with disabilities is the extent to whichyouths’ participation in VR facilitates their transition from high school and the special educationsystem to postschool education, training, and other services that will subsequently improve theirlikelihood of achieving meaningful labor force participation and personal independence andintegration as adults. In this chapter, we report analyses that examine some of these issues, inresponse to the following questions raised by the task force:
Question 2: What reasons do transitional youth have for applying for VR services?What job or vocational interest(s) do they express? How do they differ according tospecial education status?
Question 3: For special education and nonspecial education students, what types ofservices and financial assistance did transition-age VR consumers receive? What arethe primary sources of support for these groups?
Question 4: To what extent are families and/or advocates involved in the VR processfor individuals who had received special education services versus those who had not?
Question 5: What variables are associated with attrition for individuals who had receivedspecial education? What are the employment outcomes, public assistance statuses, andsatisfaction levels of individuals who have left without receiving or completing VRservices; how does that attrition compare with the attrition of transition-age individualswho did not receive special education?
Reasons for Seeking VR Services7
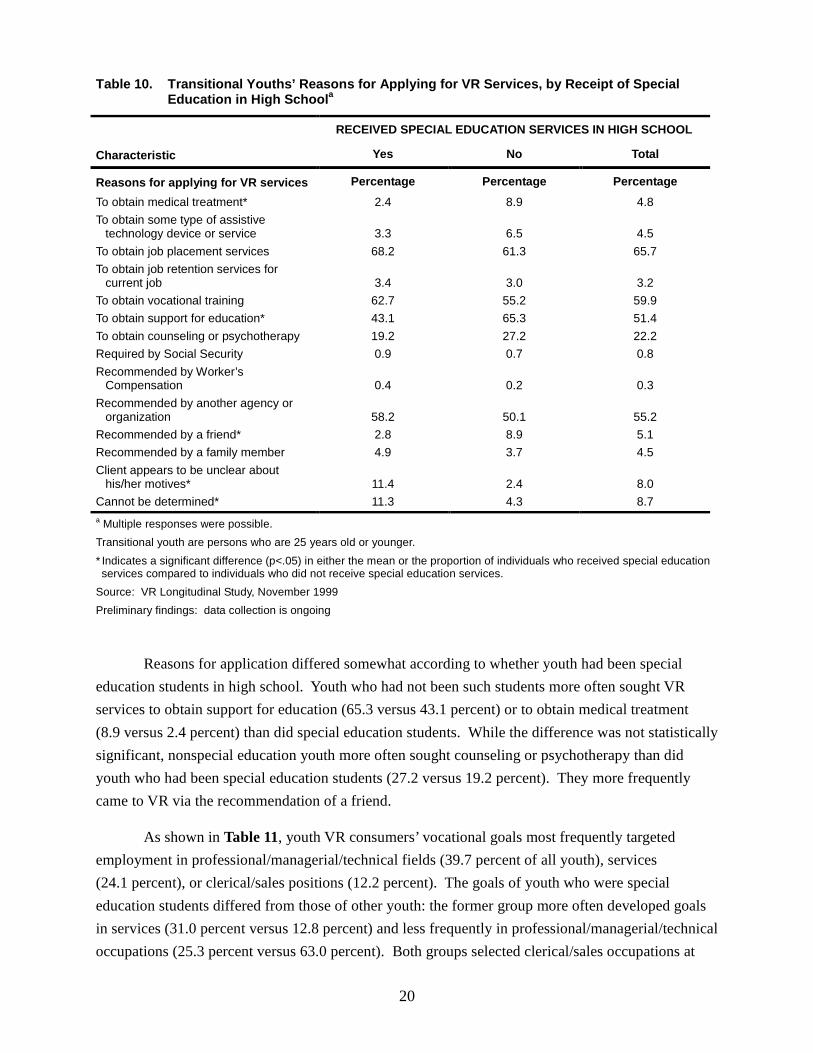
As documented in their case files, nearly two-thirds of transitional youth overall reported thatthey applied to VR in order to obtain job placement services (Table 10). Over half reported that theywanted to obtain vocational training (59.9 percent) or support for education (51.4 percent). Over halfalso reported that they applied to VR on the basis of a recommendation from another agency ororganization (55.2 percent).
7Unless otherwise noted, all comparisons/differences appearing in the text are statistically significant at a probability
level of .05 or lower. All significant differences are also indicated in each table with asterisks.
20
Table 10. Transitional Youths’ Reasons for Applying for VR Services, by Receipt of SpecialEducation in High Schoola
RECEIVED SPECIAL EDUCATION SERVICES IN HIGH SCHOOL
Characteristic Yes No Total
Reasons for applying for VR services Percentage Percentage PercentageTo obtain medical treatment* 2.4 8.9 4.8To obtain some type of assistive
technology device or service 3.3 6.5 4.5To obtain job placement services 68.2 61.3 65.7To obtain job retention services for
current job 3.4 3.0 3.2To obtain vocational training 62.7 55.2 59.9To obtain support for education* 43.1 65.3 51.4To obtain counseling or psychotherapy 19.2 27.2 22.2Required by Social Security 0.9 0.7 0.8Recommended by Worker’s
Compensation 0.4 0.2 0.3Recommended by another agency or
organization 58.2 50.1 55.2Recommended by a friend* 2.8 8.9 5.1Recommended by a family member 4.9 3.7 4.5Client appears to be unclear about
his/her motives* 11.4 2.4 8.0Cannot be determined* 11.3 4.3 8.7a Multiple responses were possible.Transitional youth are persons who are 25 years old or younger.* Indicates a significant difference (p<.05) in either the mean or the proportion of individuals who received special educationservices compared to individuals who did not receive special education services.
Source: VR Longitudinal Study, November 1999Preliminary findings: data collection is ongoing
Reasons for application differed somewhat according to whether youth had been specialeducation students in high school. Youth who had not been such students more often sought VRservices to obtain support for education (65.3 versus 43.1 percent) or to obtain medical treatment(8.9 versus 2.4 percent) than did special education students. While the difference was not statisticallysignificant, nonspecial education youth more often sought counseling or psychotherapy than didyouth who had been special education students (27.2 versus 19.2 percent). They more frequentlycame to VR via the recommendation of a friend.
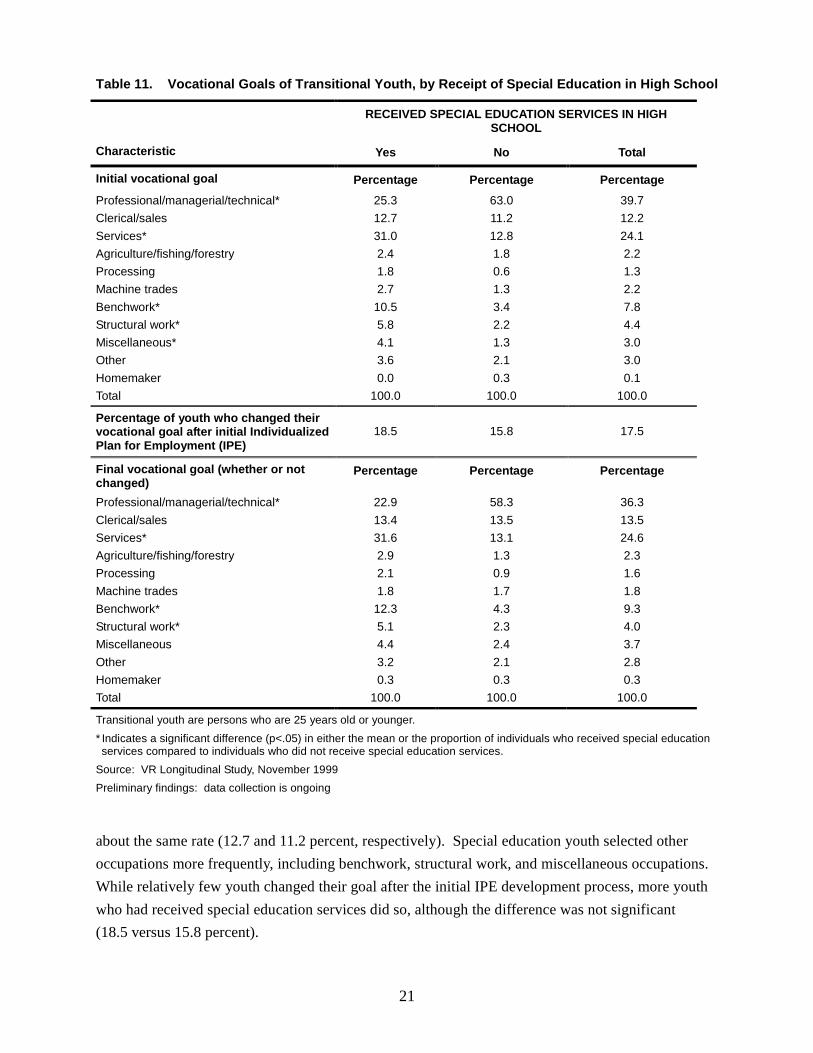
As shown in Table 11, youth VR consumers’ vocational goals most frequently targetedemployment in professional/managerial/technical fields (39.7 percent of all youth), services(24.1 percent), or clerical/sales positions (12.2 percent). The goals of youth who were specialeducation students differed from those of other youth: the former group more often developed goalsin services (31.0 percent versus 12.8 percent) and less frequently in professional/managerial/technicaloccupations (25.3 percent versus 63.0 percent). Both groups selected clerical/sales occupations at
21
Table 11. Vocational Goals of Transitional Youth, by Receipt of Special Education in High School
RECEIVED SPECIAL EDUCATION SERVICES IN HIGHSCHOOL
Characteristic Yes No Total
Initial vocational goal Percentage Percentage PercentageProfessional/managerial/technical* 25.3 63.0 39.7Clerical/sales 12.7 11.2 12.2Services* 31.0 12.8 24.1Agriculture/fishing/forestry 2.4 1.8 2.2Processing 1.8 0.6 1.3Machine trades 2.7 1.3 2.2Benchwork* 10.5 3.4 7.8Structural work* 5.8 2.2 4.4Miscellaneous* 4.1 1.3 3.0Other 3.6 2.1 3.0Homemaker 0.0 0.3 0.1Total 100.0 100.0 100.0
Percentage of youth who changed theirvocational goal after initial IndividualizedPlan for Employment (IPE)
18.5 15.8 17.5
Final vocational goal (whether or notchanged)
Percentage Percentage Percentage
Professional/managerial/technical* 22.9 58.3 36.3Clerical/sales 13.4 13.5 13.5Services* 31.6 13.1 24.6Agriculture/fishing/forestry 2.9 1.3 2.3Processing 2.1 0.9 1.6Machine trades 1.8 1.7 1.8Benchwork* 12.3 4.3 9.3Structural work* 5.1 2.3 4.0Miscellaneous 4.4 2.4 3.7Other 3.2 2.1 2.8Homemaker 0.3 0.3 0.3Total 100.0 100.0 100.0
Transitional youth are persons who are 25 years old or younger.* Indicates a significant difference (p<.05) in either the mean or the proportion of individuals who received special educationservices compared to individuals who did not receive special education services.
Source: VR Longitudinal Study, November 1999Preliminary findings: data collection is ongoing
about the same rate (12.7 and 11.2 percent, respectively). Special education youth selected otheroccupations more frequently, including benchwork, structural work, and miscellaneous occupations. While relatively few youth changed their goal after the initial IPE development process, more youthwho had received special education services did so, although the difference was not significant(18.5 versus 15.8 percent).
22
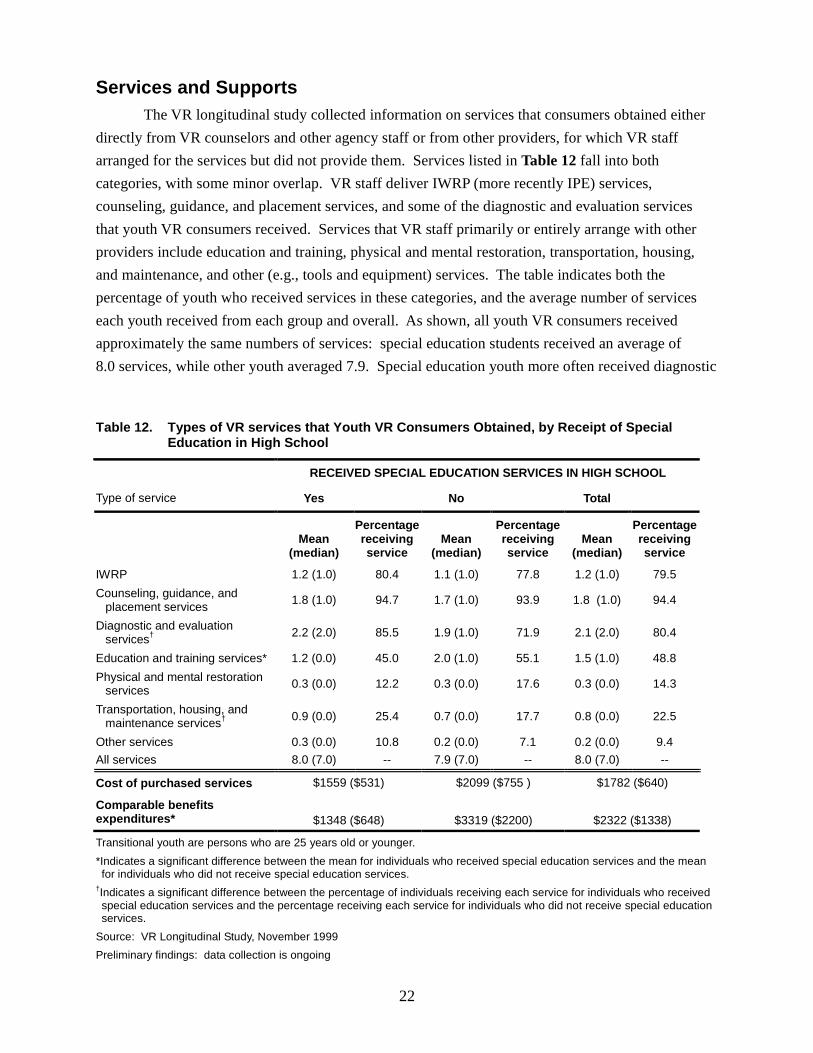
Services and SupportsThe VR longitudinal study collected information on services that consumers obtained either
directly from VR counselors and other agency staff or from other providers, for which VR staffarranged for the services but did not provide them. Services listed in Table 12 fall into bothcategories, with some minor overlap. VR staff deliver IWRP (more recently IPE) services,counseling, guidance, and placement services, and some of the diagnostic and evaluation servicesthat youth VR consumers received. Services that VR staff primarily or entirely arrange with otherproviders include education and training, physical and mental restoration, transportation, housing,and maintenance, and other (e.g., tools and equipment) services. The table indicates both thepercentage of youth who received services in these categories, and the average number of serviceseach youth received from each group and overall. As shown, all youth VR consumers receivedapproximately the same numbers of services: special education students received an average of8.0 services, while other youth averaged 7.9. Special education youth more often received diagnostic
Table 12. Types of VR services that Youth VR Consumers Obtained, by Receipt of SpecialEducation in High School
RECEIVED SPECIAL EDUCATION SERVICES IN HIGH SCHOOL
Type of service Yes No Total
Mean(median)
Percentagereceivingservice
Mean(median)
Percentagereceivingservice
Mean(median)
Percentagereceivingservice
IWRP 1.2 (1.0) 80.4 1.1 (1.0) 77.8 1.2 (1.0) 79.5Counseling, guidance, and
placement services 1.8 (1.0) 94.7 1.7 (1.0) 93.9 1.8 (1.0) 94.4
Diagnostic and evaluationservices† 2.2 (2.0) 85.5 1.9 (1.0) 71.9 2.1 (2.0) 80.4
Education and training services* 1.2 (0.0) 45.0 2.0 (1.0) 55.1 1.5 (1.0) 48.8Physical and mental restoration
services 0.3 (0.0) 12.2 0.3 (0.0) 17.6 0.3 (0.0) 14.3
Transportation, housing, andmaintenance services† 0.9 (0.0) 25.4 0.7 (0.0) 17.7 0.8 (0.0) 22.5
Other services 0.3 (0.0) 10.8 0.2 (0.0) 7.1 0.2 (0.0) 9.4All services 8.0 (7.0) -- 7.9 (7.0) -- 8.0 (7.0) --
Cost of purchased services $1559 ($531) $2099 ($755 ) $1782 ($640)
Comparable benefitsexpenditures* $1348 ($648) $3319 ($2200) $2322 ($1338)
Transitional youth are persons who are 25 years old or younger.*Indicates a significant difference between the mean for individuals who received special education services and the meanfor individuals who did not receive special education services.
†Indicates a significant difference between the percentage of individuals receiving each service for individuals who receivedspecial education services and the percentage receiving each service for individuals who did not receive special educationservices.
Source: VR Longitudinal Study, November 1999Preliminary findings: data collection is ongoing
23
and evaluation services (85.5 percent received these services, compared with 71.9 percent of otheryouth) and transportation, housing, and maintenance (25.4 versus 17.7 percent). Nonspecialeducation youth more often received education and training services (55.1 compared with45.0 percent), and averaged more of these services (2.0 versus 1.2) than transitional youth who werespecial education students.
Table 12 also reports information on average cost of purchased services, as well as value ofcomparable benefits, for transitional youth VR consumers. For youth VR consumers overall, cost ofpurchased services was $1,782 (median of $640). Average cost for special education students waslower than that for others ($1,559 [median of $531] versus $2,099 [median of $755]), although thedifference was not statistically significant. Value of comparable benefits expenditures averaged$2,322 (median $1,338). Average comparable benefits for special education students were lower thanthose for others ($1,348 compared to $3,319), a statistically significant difference explained in partby the higher proportion of other youth consumers who enrolled in postsecondary education.
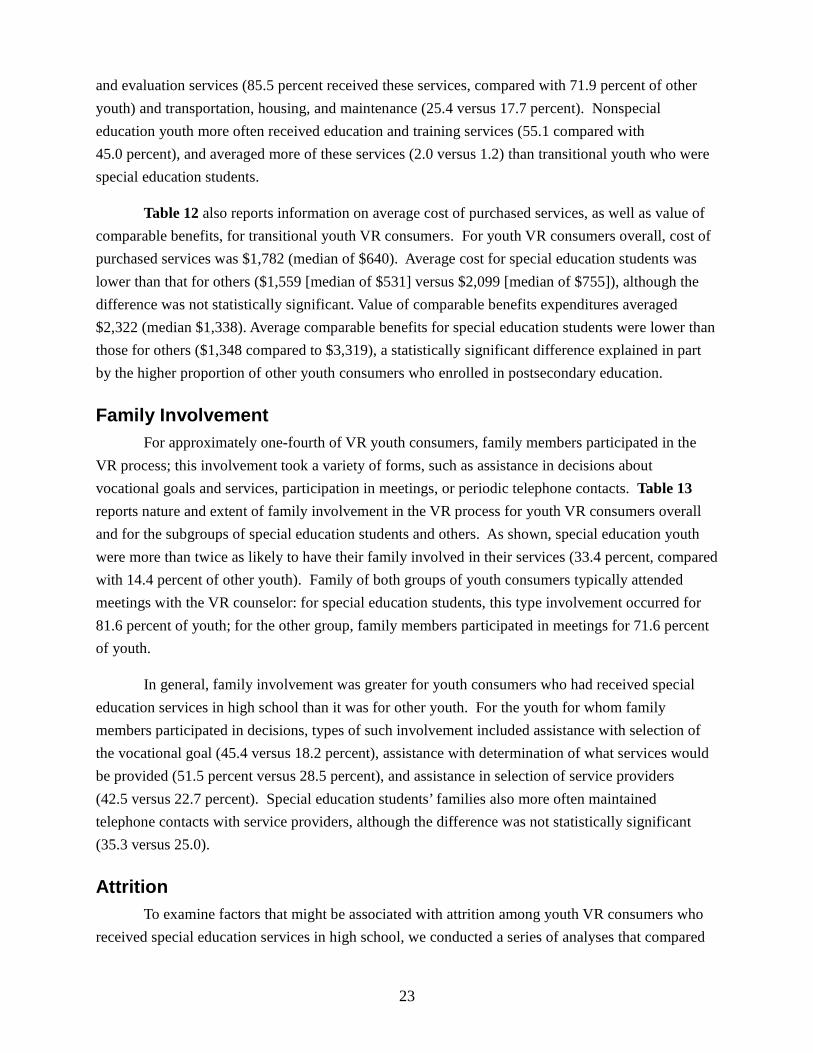
Family InvolvementFor approximately one-fourth of VR youth consumers, family members participated in the
VR process; this involvement took a variety of forms, such as assistance in decisions aboutvocational goals and services, participation in meetings, or periodic telephone contacts. Table 13reports nature and extent of family involvement in the VR process for youth VR consumers overalland for the subgroups of special education students and others. As shown, special education youthwere more than twice as likely to have their family involved in their services (33.4 percent, comparedwith 14.4 percent of other youth). Family of both groups of youth consumers typically attendedmeetings with the VR counselor: for special education students, this type involvement occurred for81.6 percent of youth; for the other group, family members participated in meetings for 71.6 percentof youth.
In general, family involvement was greater for youth consumers who had received specialeducation services in high school than it was for other youth. For the youth for whom familymembers participated in decisions, types of such involvement included assistance with selection ofthe vocational goal (45.4 versus 18.2 percent), assistance with determination of what services wouldbe provided (51.5 percent versus 28.5 percent), and assistance in selection of service providers(42.5 versus 22.7 percent). Special education students’ families also more often maintainedtelephone contacts with service providers, although the difference was not statistically significant(35.3 versus 25.0).
AttritionTo examine factors that might be associated with attrition among youth VR consumers who
received special education services in high school, we conducted a series of analyses that compared
24
Table 13. Family Involvement in VR Services of Transitional Youth, by Receipt of SpecialEducation in High Schoola
RECEIVED SPECIAL EDUCATION SERVICES IN HIGH SCHOOL
Characteristic Yes No Total
Percentage of students with familyinvolvement in VR consumers’services 33.4 14.4 26.2
Type of involvement
Percentage of thosereporting
involvement
Percentage of thosereporting
involvement
Percentage of thosereporting
involvementAssisted with selection of vocational
goal* 45.4 18.2 39.8Assisted with determination of
services to be provided* 51.5 28.5 46.8Assisted with selection of service
providers* 42.5 22.7 38.4Attended meetings between the VR
counselor and client 81.6 71.6 79.5Maintained telephone contacts with
the VR counselor 72.1 83.7 74.4Maintained telephone contacts with
service providers 35.3 25.0 33.1
Other 11.7 8.7 11.1a Multiple responses were possible.Transitional youth are persons who are 25 years old or younger.* Indicates a significant difference (p<.05) in either the mean or the proportion of individuals who received special educationservices compared to individuals who did not receive special education services.
Source: VR Longitudinal Study, November 1999Preliminary findings: data collection is ongoing
these youth who left VR without receiving or completing VR services with comparable youth whoachieved an employment outcome as a result of VR services. Among the factors we examined weredemographic and disability characteristics, functional status, education attainment and achievementlevels, financial assistance, and psychosocial factors. Because we found very few significantdifferences between the two groups, we do not include the results of those analyses in this report.8
SummaryTransitional youth typically applied to VR in order to obtain services that would assist them
in labor force entry. Such services included job placement (two-thirds of youth VR consumers),vocational training (60 percent), and support for education (51 percent). Youth who did not receivespecial education services in high school more often sought support to continue their education thandid their special education peers (65 versus 43 percent). In general, youth VR consumers established
8Some of the information listed in the question is not available in the study. For example, for persons who dropped out
prior to services, the study did not collect satisfaction with VR.
25
vocational goals in one of three occupational fields: professional/ managerial/technical (40 percentoverall, 25 percent of special education youth and 63 percent of others); services (24 percent overall,31 percent of special education youth and 13 percent of others); or clerical/sales occupations(12 percent overall, 13 percent of special education youth and 11 percent of others). Relatively fewyouth VR consumers (18 percent) changed their vocational goal following initial IPE development.
Both groups of youth VR consumers averaged about 8.0 services during VR. The two groupsdid differ somewhat in types of services they obtained as VR consumers. While nearly all of bothgroups obtained counseling, guidance, and placement services (95 and 94 percent, respectively),more special education students obtained diagnostic and evaluation services (85 versus 72 percent)and transportation, housing, and maintenance services (25 versus 18 percent). More nonspecialeducation youth obtained support for education (55 versus 45 percent) and averaged more of thoseservices (2.0 versus 1.2). Average cost of purchased services was $1,782.
About one-third of special education students involved family members in their VRexperience, compared with 14 percent of other youth. Among activities families assisted with wereselection of vocational goal, determination of services to be provided, and selection of serviceproviders.
Finally, special education students who left VR before receiving or completing services didnot differ significantly from those who completed services or from nonspecial education peers ondemographic or other characteristics.
26
Chapter 4: Consumer OutcomesAchievement of an employment outcome is the key measure of effectiveness for the VR
services program. Of particular interest is quality of employment, typically assessed by earningslevels, whether the employment is competitive, and retention of employment over time. Othermeasures of effectiveness include consumer satisfaction with VR services and outcomes, extent towhich former consumers improved in functional status and other measures, reduction in dependencyon public assistance, and the like. In this chapter we report on outcomes that transitional youthachieved as a result of VR services. Questions we address include:
Question 6: What sociodemographic, disability, education, program participation, andself-esteem factors are associated with employment outcomes and earnings levels foryoung adult VR program participants?
a. To what extent are sociodemographic factors (i.e., sex, race, family income)associated with employment for young adults with disabilities?
b. To what extent are disability factors (i.e., difficulties with ADLs and/orIADLs) associated with employment for young adults with disabilities?
c. To what extent are education factors (i.e., completed years, special education,literacy levels) associated with employment?
d. To what extent are program participation factors (i.e., SSI) associated withemployment?
e. To what extent are what are the self-esteem factors (i.e., locus of control,attitudes) associated with employment?
f. To what extent is consumer satisfaction associated with an employmentoutcome?
Question 7: Of individuals who received special education services and wereaccepted for VR services, what were their gains in terms of employment, functionalcapacities, and reduction in public dependency?
Overview of Employment Outcomes9
As reported in Table 14, 62.8 percent of youth VR consumers achieved an employmentoutcome as a result of VR services.10 While youth who received special education in high schoolachieved an employment outcome at a slightly higher rate (64.2 percent compared with 59.1 percent),
9Unless otherwise noted, all comparisons/differences appearing in the text are statistically significant at a probability
level of .05 or lower. All significant differences are also indicated in each table with asterisks.10As noted in Chapter 2, about one-fourth of youth VR consumers were still receiving services at the time of these
analyses; consequently, findings on outcomes may change somewhat following completion of data collection.
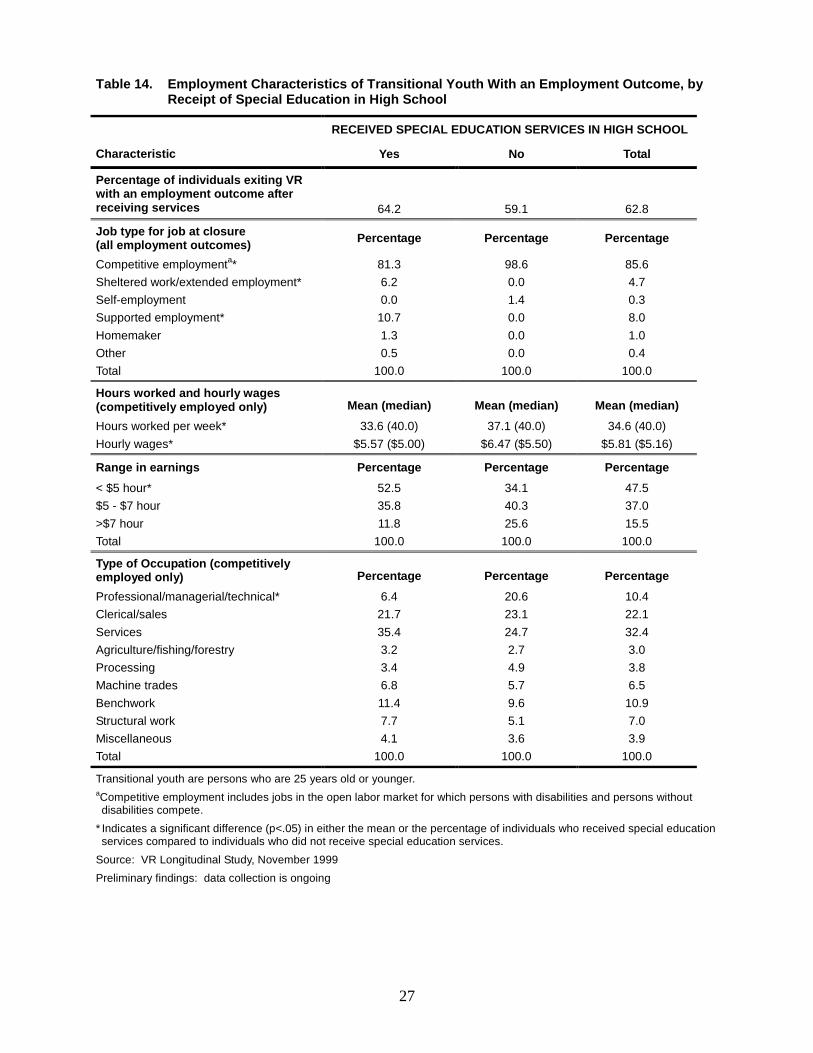
27
Table 14. Employment Characteristics of Transitional Youth With an Employment Outcome, byReceipt of Special Education in High School
RECEIVED SPECIAL EDUCATION SERVICES IN HIGH SCHOOL
Characteristic Yes No Total
Percentage of individuals exiting VRwith an employment outcome afterreceiving services 64.2 59.1 62.8
Job type for job at closure(all employment outcomes) Percentage Percentage Percentage
Competitive employmenta* 81.3 98.6 85.6Sheltered work/extended employment* 6.2 0.0 4.7Self-employment 0.0 1.4 0.3Supported employment* 10.7 0.0 8.0Homemaker 1.3 0.0 1.0Other 0.5 0.0 0.4Total 100.0 100.0 100.0
Hours worked and hourly wages(competitively employed only) Mean (median) Mean (median) Mean (median)Hours worked per week* 33.6 (40.0) 37.1 (40.0) 34.6 (40.0)Hourly wages* $5.57 ($5.00) $6.47 ($5.50) $5.81 ($5.16)
Range in earnings Percentage Percentage Percentage< $5 hour* 52.5 34.1 47.5$5 - $7 hour 35.8 40.3 37.0>$7 hour 11.8 25.6 15.5Total 100.0 100.0 100.0
Type of Occupation (competitivelyemployed only) Percentage Percentage PercentageProfessional/managerial/technical* 6.4 20.6 10.4Clerical/sales 21.7 23.1 22.1Services 35.4 24.7 32.4Agriculture/fishing/forestry 3.2 2.7 3.0Processing 3.4 4.9 3.8Machine trades 6.8 5.7 6.5Benchwork 11.4 9.6 10.9Structural work 7.7 5.1 7.0Miscellaneous 4.1 3.6 3.9Total 100.0 100.0 100.0
Transitional youth are persons who are 25 years old or younger.aCompetitive employment includes jobs in the open labor market for which persons with disabilities and persons withoutdisabilities compete.
* Indicates a significant difference (p<.05) in either the mean or the percentage of individuals who received special educationservices compared to individuals who did not receive special education services.
Source: VR Longitudinal Study, November 1999Preliminary findings: data collection is ongoing
28
this difference was not statistically significant. Overall, 85.6 percent of youth consumers with anemployment outcome entered competitive employment; special education consumers less frequentlyentered the competitive labor market than other youth consumers (81.3 compared with 98.6 percent).Youth who had received special education in high school more often entered sheltered work(6.2 percent versus less than 1 percent) or supported employment (10.7 percent versus less than1 percent).
Youth who entered competitive jobs earned an average of $5.81 per hour (median of $5.16)and worked nearly 35 hours per week (median of 40.0 hours). Youth in competitive jobs whoreceived special education in high school worked fewer hours (33.6 versus 37.1) and earned less perhour ($5.57 [$5.00] compared to $6.47 [$5.50]) than did other youth VR consumers. We also presentranges in hourly earnings. As shown, over half of competitively employed youth VR consumers whoreceived special education services in high school averaged less than $5.00 per hour, compared withone-third of other youth (52.5 versus 34.1 percent). More than twice as many nonspecial educationyouth who achieved competitive employment were earning more than $7.00 per hour than wereyouth who were special education students (25.6 versus 11.8 percent), although this difference wasnot statistically significant.
For the most part, the occupations that youth in the two groups entered did not differ greatly,with the exception of professional/managerial/technical occupations. Only 6 percent of specialeducation students entered these fields, compared with 21 percent of other youth. Both groupsfrequently entered service occupations (35.4 percent of special education youth and 24.7 percent ofothers). Both groups also frequently obtained clerical/sales positions (21.7 and 23.1 percent,respectively).
Factors Associated with Employment OutcomesWe conducted multiple regression analyses to predict employment outcomes from (1) the set
of demographic and participation variables described in Chapter 2 (i.e., demographic and disabilitycharacteristics, education and work history, financial assistance, self-esteem and locus of control);(2) types of services youth VR consumers received in VR; and (3) whether or not youth VRconsumers were receiving public financial assistance (e.g., SSI/DI, general assistance) at entry to VR.We conducted separate analyses for special education and nonspecial education recipients and usedtwo outcome variables: employment outcome and competitive employment outcome. The purpose ofthese regression analyses was to investigate the factors that may influence the employment outcomes(i.e., whether the consumer achieved an employment outcome and whether the employment wascompetitive) for transitional youth who are VR consumers. Because we hypothesized that theinfluences would be somewhat different for those who received special education services in highschool versus those who did not, we ran these analyses separately for the two groups. The results ofthese analyses appear in Table 15.
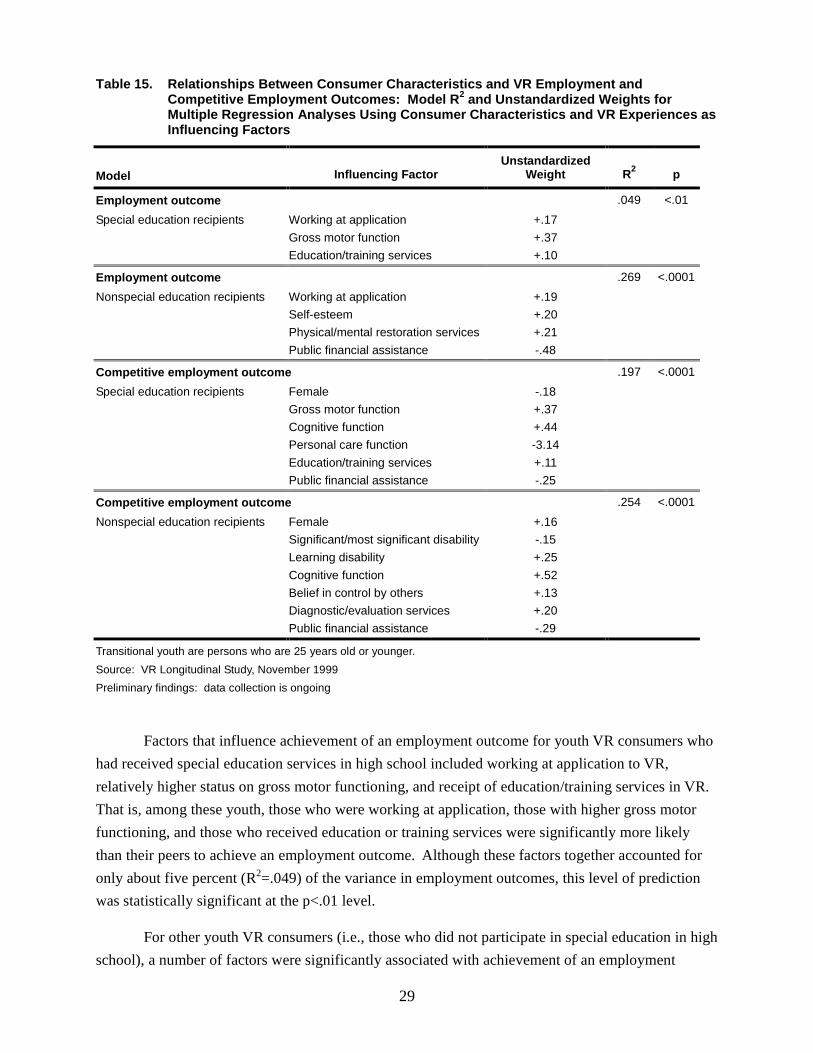
29
Table 15. Relationships Between Consumer Characteristics and VR Employment andCompetitive Employment Outcomes: Model R2 and Unstandardized Weights forMultiple Regression Analyses Using Consumer Characteristics and VR Experiences asInfluencing Factors
Model Influencing FactorUnstandardized
Weight R2 p
Employment outcome .049 <.01Special education recipients Working at application +.17
Gross motor function +.37Education/training services +.10
Employment outcome .269 <.0001Nonspecial education recipients Working at application +.19
Self-esteem +.20Physical/mental restoration services +.21Public financial assistance -.48
Competitive employment outcome .197 <.0001Special education recipients Female -.18
Gross motor function +.37Cognitive function +.44Personal care function -3.14Education/training services +.11Public financial assistance -.25
Competitive employment outcome .254 <.0001Nonspecial education recipients Female +.16
Significant/most significant disability -.15Learning disability +.25Cognitive function +.52Belief in control by others +.13Diagnostic/evaluation services +.20Public financial assistance -.29
Transitional youth are persons who are 25 years old or younger.Source: VR Longitudinal Study, November 1999Preliminary findings: data collection is ongoing
Factors that influence achievement of an employment outcome for youth VR consumers whohad received special education services in high school included working at application to VR,relatively higher status on gross motor functioning, and receipt of education/training services in VR. That is, among these youth, those who were working at application, those with higher gross motorfunctioning, and those who received education or training services were significantly more likelythan their peers to achieve an employment outcome. Although these factors together accounted foronly about five percent (R2=.049) of the variance in employment outcomes, this level of predictionwas statistically significant at the p<.01 level.
For other youth VR consumers (i.e., those who did not participate in special education in highschool), a number of factors were significantly associated with achievement of an employment
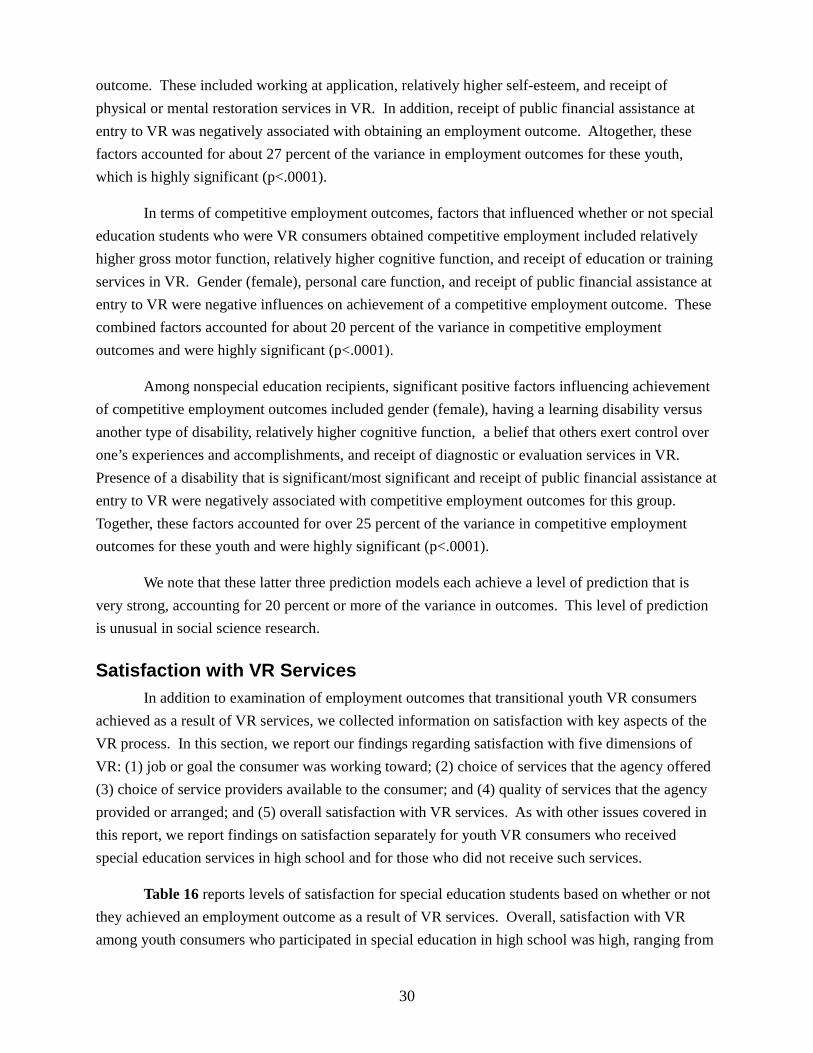
30
outcome. These included working at application, relatively higher self-esteem, and receipt ofphysical or mental restoration services in VR. In addition, receipt of public financial assistance atentry to VR was negatively associated with obtaining an employment outcome. Altogether, thesefactors accounted for about 27 percent of the variance in employment outcomes for these youth,which is highly significant (p<.0001).
In terms of competitive employment outcomes, factors that influenced whether or not specialeducation students who were VR consumers obtained competitive employment included relativelyhigher gross motor function, relatively higher cognitive function, and receipt of education or trainingservices in VR. Gender (female), personal care function, and receipt of public financial assistance atentry to VR were negative influences on achievement of a competitive employment outcome. Thesecombined factors accounted for about 20 percent of the variance in competitive employmentoutcomes and were highly significant (p<.0001).
Among nonspecial education recipients, significant positive factors influencing achievementof competitive employment outcomes included gender (female), having a learning disability versusanother type of disability, relatively higher cognitive function, a belief that others exert control overone’s experiences and accomplishments, and receipt of diagnostic or evaluation services in VR. Presence of a disability that is significant/most significant and receipt of public financial assistance atentry to VR were negatively associated with competitive employment outcomes for this group. Together, these factors accounted for over 25 percent of the variance in competitive employmentoutcomes for these youth and were highly significant (p<.0001).
We note that these latter three prediction models each achieve a level of prediction that isvery strong, accounting for 20 percent or more of the variance in outcomes. This level of predictionis unusual in social science research.
Satisfaction with VR ServicesIn addition to examination of employment outcomes that transitional youth VR consumers
achieved as a result of VR services, we collected information on satisfaction with key aspects of theVR process. In this section, we report our findings regarding satisfaction with five dimensions ofVR: (1) job or goal the consumer was working toward; (2) choice of services that the agency offered(3) choice of service providers available to the consumer; and (4) quality of services that the agencyprovided or arranged; and (5) overall satisfaction with VR services. As with other issues covered inthis report, we report findings on satisfaction separately for youth VR consumers who receivedspecial education services in high school and for those who did not receive such services.
Table 16 reports levels of satisfaction for special education students based on whether or notthey achieved an employment outcome as a result of VR services. Overall, satisfaction with VRamong youth consumers who participated in special education in high school was high, ranging from
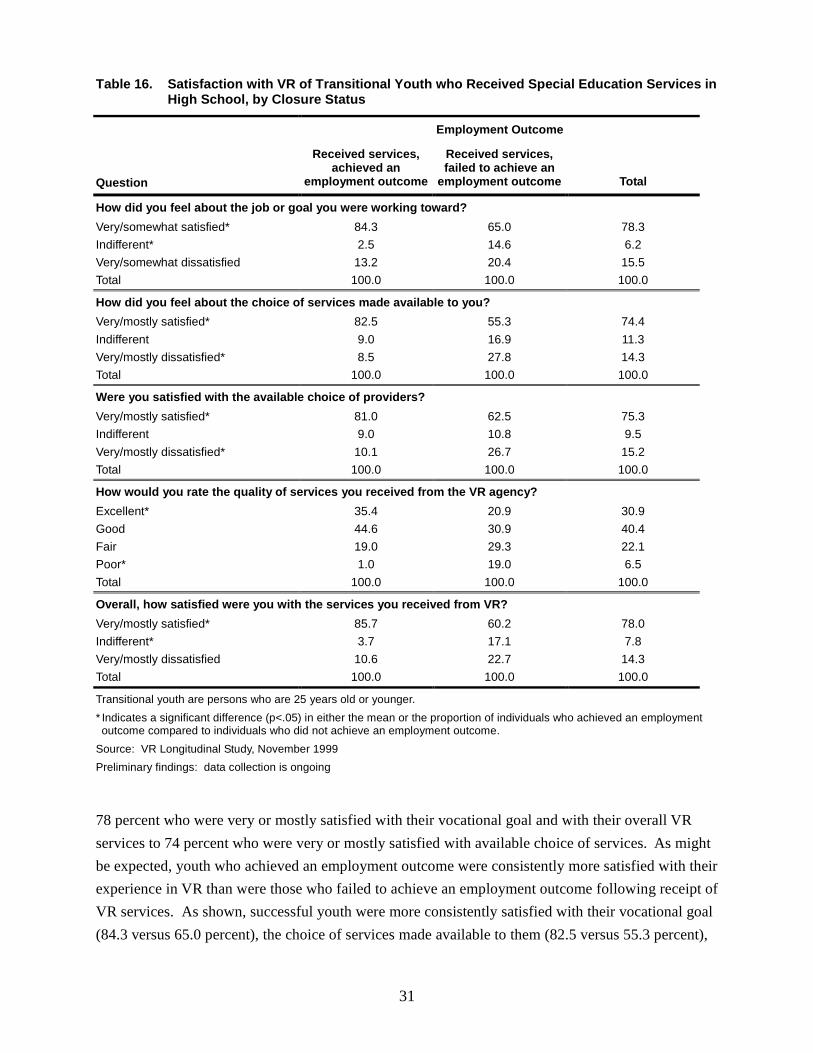
31
Table 16. Satisfaction with VR of Transitional Youth who Received Special Education Services inHigh School, by Closure Status
Employment Outcome
Question
Received services,achieved an
employment outcome
Received services,failed to achieve an
employment outcome Total
How did you feel about the job or goal you were working toward?Very/somewhat satisfied* 84.3 65.0 78.3Indifferent* 2.5 14.6 6.2Very/somewhat dissatisfied 13.2 20.4 15.5Total 100.0 100.0 100.0
How did you feel about the choice of services made available to you?Very/mostly satisfied* 82.5 55.3 74.4Indifferent 9.0 16.9 11.3Very/mostly dissatisfied* 8.5 27.8 14.3Total 100.0 100.0 100.0
Were you satisfied with the available choice of providers?Very/mostly satisfied* 81.0 62.5 75.3Indifferent 9.0 10.8 9.5Very/mostly dissatisfied* 10.1 26.7 15.2Total 100.0 100.0 100.0
How would you rate the quality of services you received from the VR agency?Excellent* 35.4 20.9 30.9Good 44.6 30.9 40.4Fair 19.0 29.3 22.1Poor* 1.0 19.0 6.5Total 100.0 100.0 100.0
Overall, how satisfied were you with the services you received from VR?Very/mostly satisfied* 85.7 60.2 78.0Indifferent* 3.7 17.1 7.8Very/mostly dissatisfied 10.6 22.7 14.3Total 100.0 100.0 100.0
Transitional youth are persons who are 25 years old or younger.* Indicates a significant difference (p<.05) in either the mean or the proportion of individuals who achieved an employmentoutcome compared to individuals who did not achieve an employment outcome.
Source: VR Longitudinal Study, November 1999Preliminary findings: data collection is ongoing
78 percent who were very or mostly satisfied with their vocational goal and with their overall VRservices to 74 percent who were very or mostly satisfied with available choice of services. As mightbe expected, youth who achieved an employment outcome were consistently more satisfied with theirexperience in VR than were those who failed to achieve an employment outcome following receipt ofVR services. As shown, successful youth were more consistently satisfied with their vocational goal(84.3 versus 65.0 percent), the choice of services made available to them (82.5 versus 55.3 percent),
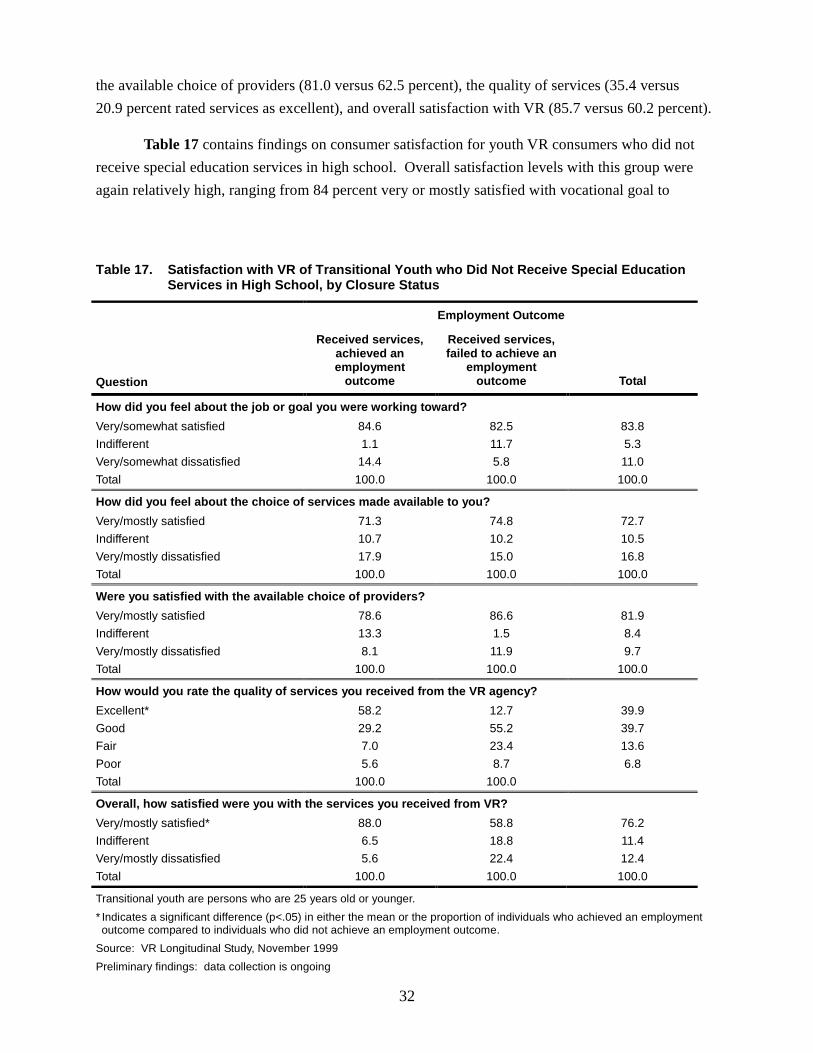
32
the available choice of providers (81.0 versus 62.5 percent), the quality of services (35.4 versus20.9 percent rated services as excellent), and overall satisfaction with VR (85.7 versus 60.2 percent).
Table 17 contains findings on consumer satisfaction for youth VR consumers who did notreceive special education services in high school. Overall satisfaction levels with this group wereagain relatively high, ranging from 84 percent very or mostly satisfied with vocational goal to
Table 17. Satisfaction with VR of Transitional Youth who Did Not Receive Special EducationServices in High School, by Closure Status
Employment Outcome
Question
Received services,achieved anemployment
outcome
Received services,failed to achieve an
employmentoutcome Total
How did you feel about the job or goal you were working toward?Very/somewhat satisfied 84.6 82.5 83.8Indifferent 1.1 11.7 5.3Very/somewhat dissatisfied 14.4 5.8 11.0Total 100.0 100.0 100.0
How did you feel about the choice of services made available to you?Very/mostly satisfied 71.3 74.8 72.7Indifferent 10.7 10.2 10.5Very/mostly dissatisfied 17.9 15.0 16.8Total 100.0 100.0 100.0
Were you satisfied with the available choice of providers?Very/mostly satisfied 78.6 86.6 81.9Indifferent 13.3 1.5 8.4Very/mostly dissatisfied 8.1 11.9 9.7Total 100.0 100.0 100.0
How would you rate the quality of services you received from the VR agency?Excellent* 58.2 12.7 39.9Good 29.2 55.2 39.7Fair 7.0 23.4 13.6Poor 5.6 8.7 6.8Total 100.0 100.0
Overall, how satisfied were you with the services you received from VR?Very/mostly satisfied* 88.0 58.8 76.2Indifferent 6.5 18.8 11.4Very/mostly dissatisfied 5.6 22.4 12.4Total 100.0 100.0 100.0
Transitional youth are persons who are 25 years old or younger.* Indicates a significant difference (p<.05) in either the mean or the proportion of individuals who achieved an employmentoutcome compared to individuals who did not achieve an employment outcome.
Source: VR Longitudinal Study, November 1999Preliminary findings: data collection is ongoing
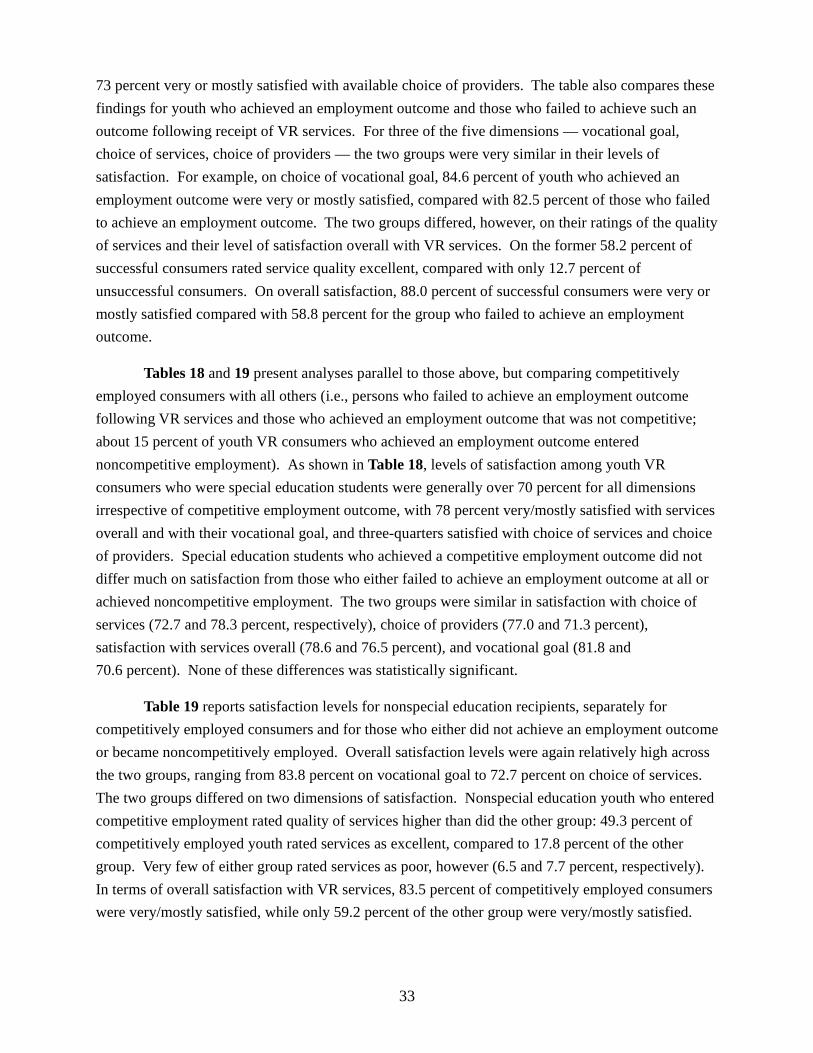
33
73 percent very or mostly satisfied with available choice of providers. The table also compares thesefindings for youth who achieved an employment outcome and those who failed to achieve such anoutcome following receipt of VR services. For three of the five dimensions — vocational goal,choice of services, choice of providers — the two groups were very similar in their levels ofsatisfaction. For example, on choice of vocational goal, 84.6 percent of youth who achieved anemployment outcome were very or mostly satisfied, compared with 82.5 percent of those who failedto achieve an employment outcome. The two groups differed, however, on their ratings of the qualityof services and their level of satisfaction overall with VR services. On the former 58.2 percent ofsuccessful consumers rated service quality excellent, compared with only 12.7 percent ofunsuccessful consumers. On overall satisfaction, 88.0 percent of successful consumers were very ormostly satisfied compared with 58.8 percent for the group who failed to achieve an employmentoutcome.
Tables 18 and 19 present analyses parallel to those above, but comparing competitivelyemployed consumers with all others (i.e., persons who failed to achieve an employment outcomefollowing VR services and those who achieved an employment outcome that was not competitive;about 15 percent of youth VR consumers who achieved an employment outcome enterednoncompetitive employment). As shown in Table 18, levels of satisfaction among youth VRconsumers who were special education students were generally over 70 percent for all dimensionsirrespective of competitive employment outcome, with 78 percent very/mostly satisfied with servicesoverall and with their vocational goal, and three-quarters satisfied with choice of services and choiceof providers. Special education students who achieved a competitive employment outcome did notdiffer much on satisfaction from those who either failed to achieve an employment outcome at all orachieved noncompetitive employment. The two groups were similar in satisfaction with choice ofservices (72.7 and 78.3 percent, respectively), choice of providers (77.0 and 71.3 percent),satisfaction with services overall (78.6 and 76.5 percent), and vocational goal (81.8 and70.6 percent). None of these differences was statistically significant.
Table 19 reports satisfaction levels for nonspecial education recipients, separately forcompetitively employed consumers and for those who either did not achieve an employment outcomeor became noncompetitively employed. Overall satisfaction levels were again relatively high acrossthe two groups, ranging from 83.8 percent on vocational goal to 72.7 percent on choice of services. The two groups differed on two dimensions of satisfaction. Nonspecial education youth who enteredcompetitive employment rated quality of services higher than did the other group: 49.3 percent ofcompetitively employed youth rated services as excellent, compared to 17.8 percent of the othergroup. Very few of either group rated services as poor, however (6.5 and 7.7 percent, respectively). In terms of overall satisfaction with VR services, 83.5 percent of competitively employed consumerswere very/mostly satisfied, while only 59.2 percent of the other group were very/mostly satisfied.
34
Table 18. Satisfaction with VR of Transitional Youth who Received Special Education Services inHigh School, by Type of Employment
Type of Employment
QuestionClosed into competitive
employment
Closed without an employmentoutcome or into non-
competitive employment Total
How did you feel about the job or goal you were working toward?Very/somewhat satisfied 81.8 70.6 78.3Indifferent 3.8 11.6 6.2Very/somewhat dissatisfied 14.4 17.9 15.5Total 100.0 100.0 100.0
How did you feel about the choice of services made available to you?Very/mostly satisfied 72.7 78.3 74.4Indifferent 13.0 7.6 11.3Very/mostly dissatisfied 14.3 14.1 14.3Total 100.0 100.0 100.0
Were you satisfied with the available choice of providers?Very/mostly satisfied 77.0 71.3 75.3Indifferent 9.9 8.5 9.5Very/mostly dissatisfied 13.1 20.2 15.2Total 100.0 100.0 100.0
How would you rate the quality of services you received from the VR agency?Excellent 32.9 26.5 30.9Good 42.6 35.6 40.4Fair 20.4 25.8 22.1Poor* 4.0 12.1 6.5Total 100.0 100.0 100.0
Overall, how satisfied were you with the services you received from VR?Very/mostly satisfied 78.6 76.5 78.0Indifferent 6.0 11.8 7.8Very/mostly dissatisfied 15.4 11.7 14.3Total 100.0 100.0 100.0
Transitional youth are persons who are 25 years old or younger.* Indicates a significant difference (p<.05) in either the mean or the proportion of individuals who achieved a competitiveemployment outcome compared to individuals who did not achieve a competitive employment outcome.
Source: VR Longitudinal Study, November 1999Preliminary findings: data collection is ongoing
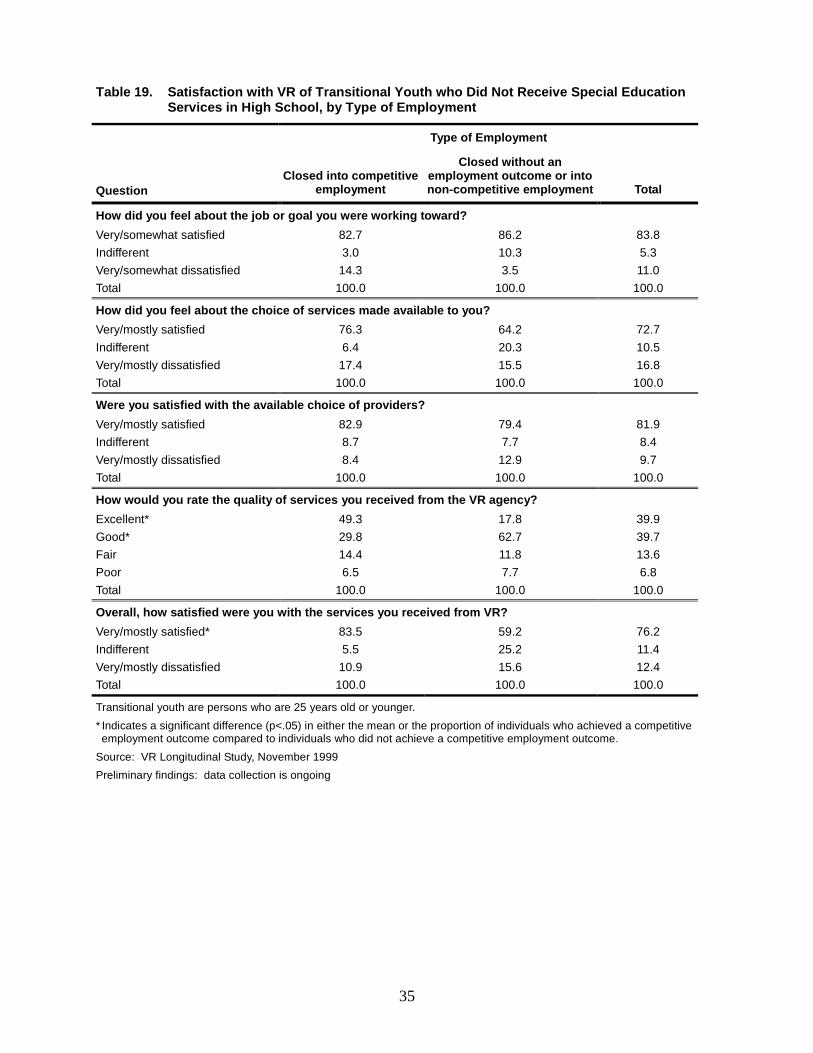
35
Table 19. Satisfaction with VR of Transitional Youth who Did Not Receive Special EducationServices in High School, by Type of Employment
Type of Employment
QuestionClosed into competitive
employment
Closed without anemployment outcome or intonon-competitive employment Total
How did you feel about the job or goal you were working toward?Very/somewhat satisfied 82.7 86.2 83.8Indifferent 3.0 10.3 5.3Very/somewhat dissatisfied 14.3 3.5 11.0Total 100.0 100.0 100.0
How did you feel about the choice of services made available to you?Very/mostly satisfied 76.3 64.2 72.7Indifferent 6.4 20.3 10.5Very/mostly dissatisfied 17.4 15.5 16.8Total 100.0 100.0 100.0
Were you satisfied with the available choice of providers?Very/mostly satisfied 82.9 79.4 81.9Indifferent 8.7 7.7 8.4Very/mostly dissatisfied 8.4 12.9 9.7Total 100.0 100.0 100.0
How would you rate the quality of services you received from the VR agency?Excellent* 49.3 17.8 39.9Good* 29.8 62.7 39.7Fair 14.4 11.8 13.6Poor 6.5 7.7 6.8Total 100.0 100.0 100.0
Overall, how satisfied were you with the services you received from VR?Very/mostly satisfied* 83.5 59.2 76.2Indifferent 5.5 25.2 11.4Very/mostly dissatisfied 10.9 15.6 12.4Total 100.0 100.0 100.0
Transitional youth are persons who are 25 years old or younger.* Indicates a significant difference (p<.05) in either the mean or the proportion of individuals who achieved a competitiveemployment outcome compared to individuals who did not achieve a competitive employment outcome.
Source: VR Longitudinal Study, November 1999Preliminary findings: data collection is ongoing
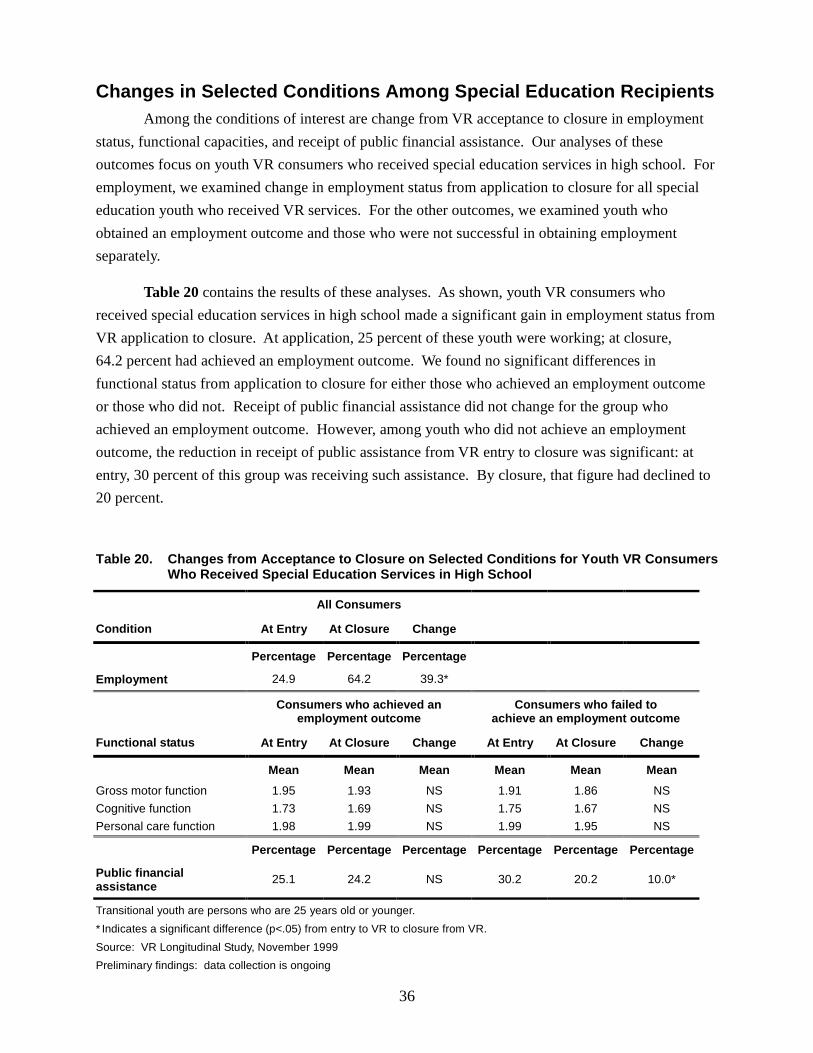
36
Changes in Selected Conditions Among Special Education RecipientsAmong the conditions of interest are change from VR acceptance to closure in employment
status, functional capacities, and receipt of public financial assistance. Our analyses of theseoutcomes focus on youth VR consumers who received special education services in high school. Foremployment, we examined change in employment status from application to closure for all specialeducation youth who received VR services. For the other outcomes, we examined youth whoobtained an employment outcome and those who were not successful in obtaining employmentseparately.
Table 20 contains the results of these analyses. As shown, youth VR consumers whoreceived special education services in high school made a significant gain in employment status fromVR application to closure. At application, 25 percent of these youth were working; at closure,64.2 percent had achieved an employment outcome. We found no significant differences infunctional status from application to closure for either those who achieved an employment outcomeor those who did not. Receipt of public financial assistance did not change for the group whoachieved an employment outcome. However, among youth who did not achieve an employmentoutcome, the reduction in receipt of public assistance from VR entry to closure was significant: atentry, 30 percent of this group was receiving such assistance. By closure, that figure had declined to20 percent.
Table 20. Changes from Acceptance to Closure on Selected Conditions for Youth VR ConsumersWho Received Special Education Services in High School
All Consumers
Condition At Entry At Closure Change
Percentage Percentage Percentage
Employment 24.9 64.2 39.3*
Consumers who achieved anemployment outcome
Consumers who failed toachieve an employment outcome
Functional status At Entry At Closure Change At Entry At Closure Change
Mean Mean Mean Mean Mean MeanGross motor function 1.95 1.93 NS 1.91 1.86 NSCognitive function 1.73 1.69 NS 1.75 1.67 NSPersonal care function 1.98 1.99 NS 1.99 1.95 NS
Percentage Percentage Percentage Percentage Percentage Percentage
Public financialassistance 25.1 24.2 NS 30.2 20.2 10.0*
Transitional youth are persons who are 25 years old or younger.* Indicates a significant difference (p<.05) from entry to VR to closure from VR.Source: VR Longitudinal Study, November 1999Preliminary findings: data collection is ongoing
37
SummaryOverall, nearly two-thirds (63 percent) of youth VR consumers achieved an employment
outcome as a result of VR services, with the rate for youth who had received special educationservices in high school slightly higher than that for the other group (64 versus 59 percent). Of thosewho achieved employment, nearly all of the nonspecial education youth entered competitiveemployment (99 percent), compared with 81 percent of special education students. Special educationyouth VR consumers earned less per hour ($5.57 versus $6.47) and worked fewer hours (33.6 versus37.1) than did other youth, who more often obtained jobs in the professional/managerial/technicalfields (21 versus 6 percent).
Multiple regression analyses found that receipt of specific VR services was stronglyassociated with achieving an employment outcome, and to entering competitive employment, forboth special education recipients and nonrecipients. Receipt of public financial assistance wasnegatively related to achievement of an employment outcome for nonrecipients of special educationand to entering competitive employment for both groups. Various demographic, functional, andpsychosocial factors were also associated with employment outcomes. The regression models forboth employment and competitive employment outcomes among nonspecial education youth VRconsumers and for competitive employment for special education students achieved a level ofprediction that is very strong, accounting for between 20 and 27 percent of the variance in outcomes.This level of prediction is unusual in social science research.
Across all four groups (special education/nonspecial education, employment outcome/competitive employment outcome), satisfaction with VR choices in terms of services and providers,rating of the quality of services, and satisfaction with the vocational goal and VR services overallwere generally consistently high, ranging from 73 to 84 percent of all youth VR consumers. Predictably, youth who achieved an employment outcome tended to rate their VR experience morehighly on all dimensions than did those who failed to achieve such an outcome.
Finally, youth who received special education services in high school made gains inemployment from acceptance to closure but not in reduction of public financial assistance. Youthwho received VR services but did not achieve employment did experience a reduction in suchassistance between entry to and exit from VR.
Appendix A: Characteristics of Youth VRConsumers by Disability Type
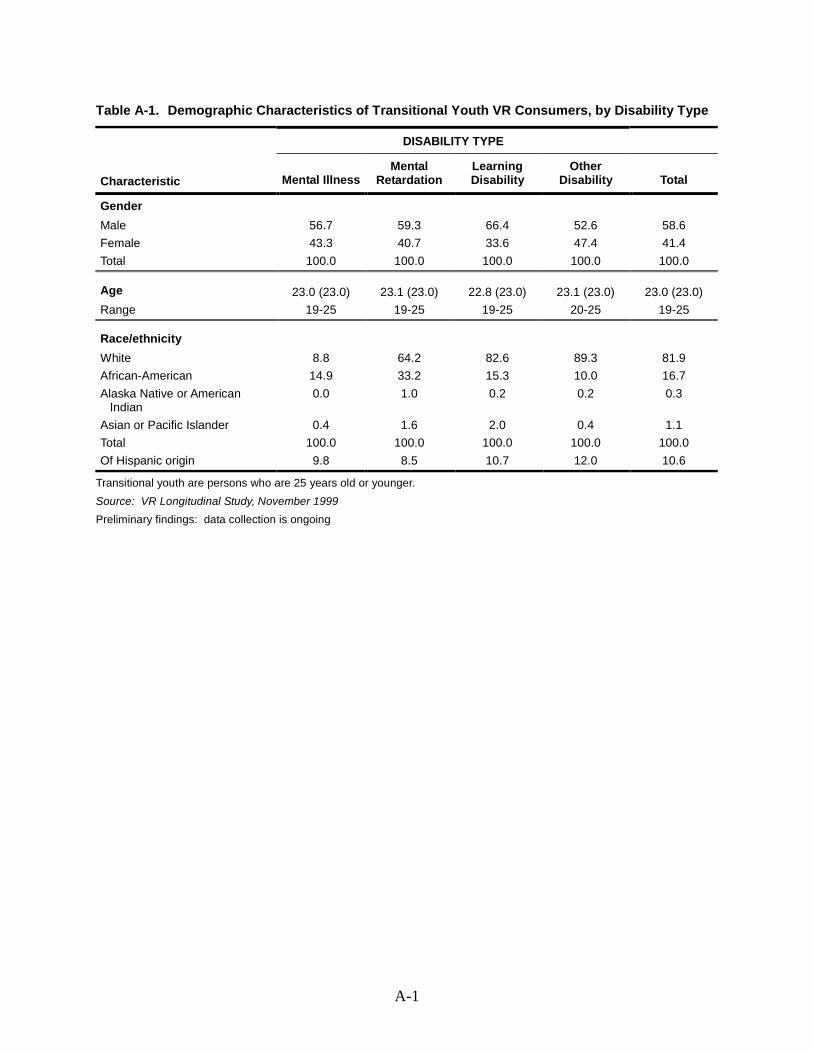
A-1
Table A-1. Demographic Characteristics of Transitional Youth VR Consumers, by Disability Type
DISABILITY TYPE
Characteristic Mental IllnessMental
RetardationLearningDisability
OtherDisability Total
GenderMale 56.7 59.3 66.4 52.6 58.6Female 43.3 40.7 33.6 47.4 41.4Total 100.0 100.0 100.0 100.0 100.0
Age 23.0 (23.0) 23.1 (23.0) 22.8 (23.0) 23.1 (23.0) 23.0 (23.0)Range 19-25 19-25 19-25 20-25 19-25
Race/ethnicityWhite 8.8 64.2 82.6 89.3 81.9African-American 14.9 33.2 15.3 10.0 16.7Alaska Native or American
Indian0.0 1.0 0.2 0.2 0.3
Asian or Pacific Islander 0.4 1.6 2.0 0.4 1.1Total 100.0 100.0 100.0 100.0 100.0Of Hispanic origin 9.8 8.5 10.7 12.0 10.6
Transitional youth are persons who are 25 years old or younger.Source: VR Longitudinal Study, November 1999Preliminary findings: data collection is ongoing
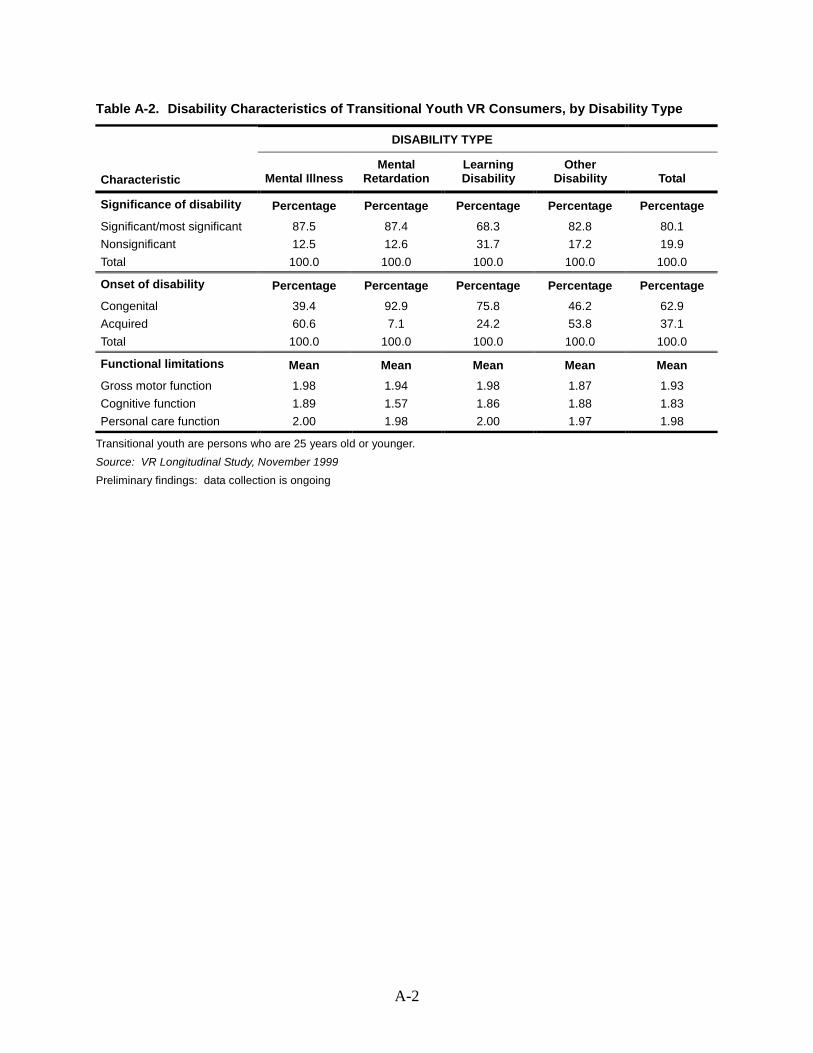
A-2
Table A-2. Disability Characteristics of Transitional Youth VR Consumers, by Disability Type
DISABILITY TYPE
Characteristic Mental IllnessMental
RetardationLearningDisability
OtherDisability Total
Significance of disability Percentage Percentage Percentage Percentage PercentageSignificant/most significant 87.5 87.4 68.3 82.8 80.1Nonsignificant 12.5 12.6 31.7 17.2 19.9Total 100.0 100.0 100.0 100.0 100.0
Onset of disability Percentage Percentage Percentage Percentage PercentageCongenital 39.4 92.9 75.8 46.2 62.9Acquired 60.6 7.1 24.2 53.8 37.1Total 100.0 100.0 100.0 100.0 100.0
Functional limitations Mean Mean Mean Mean MeanGross motor function 1.98 1.94 1.98 1.87 1.93Cognitive function 1.89 1.57 1.86 1.88 1.83Personal care function 2.00 1.98 2.00 1.97 1.98
Transitional youth are persons who are 25 years old or younger.Source: VR Longitudinal Study, November 1999Preliminary findings: data collection is ongoing
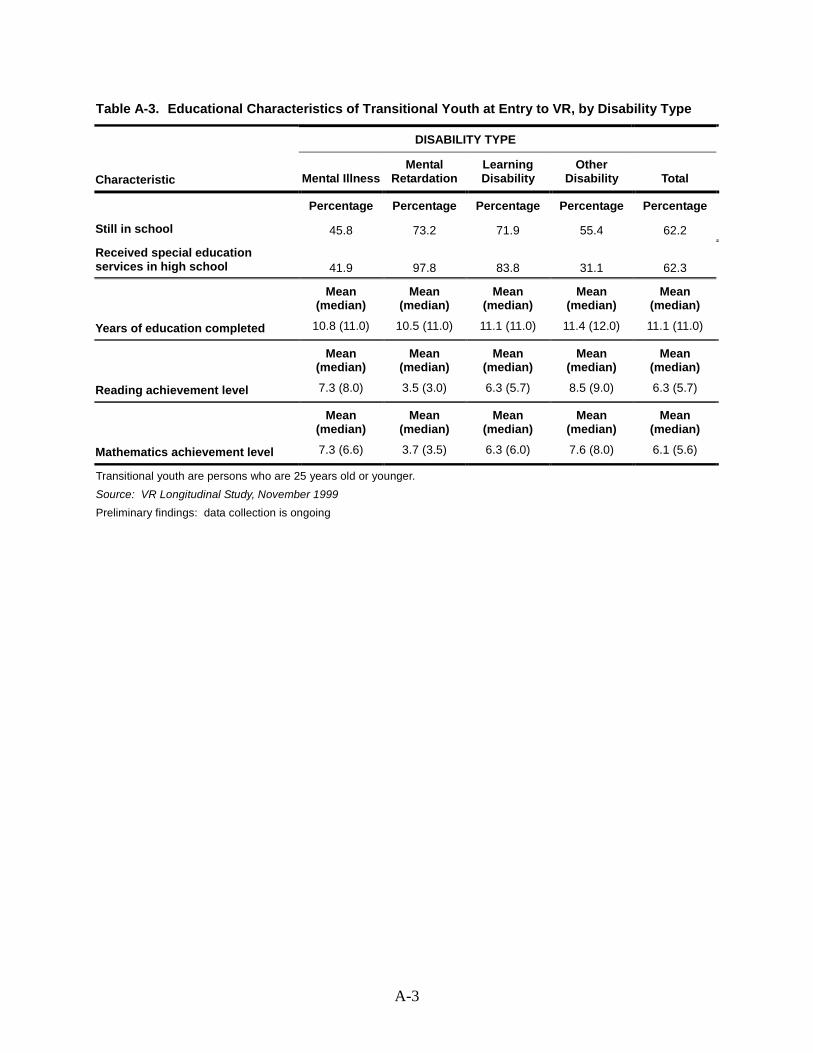
A-3
Table A-3. Educational Characteristics of Transitional Youth at Entry to VR, by Disability Type
DISABILITY TYPE
Characteristic Mental IllnessMental
RetardationLearningDisability
OtherDisability Total
Percentage Percentage Percentage Percentage Percentage
Still in school 45.8 73.2 71.9 55.4 62.2
Received special educationservices in high school 41.9 97.8 83.8 31.1 62.3
Mean(median)
Mean(median)
Mean(median)
Mean(median)
Mean(median)
Years of education completed 10.8 (11.0) 10.5 (11.0) 11.1 (11.0) 11.4 (12.0) 11.1 (11.0)
Mean(median)
Mean(median)
Mean(median)
Mean(median)
Mean(median)
Reading achievement level 7.3 (8.0) 3.5 (3.0) 6.3 (5.7) 8.5 (9.0) 6.3 (5.7)
Mean(median)
Mean(median)
Mean(median)
Mean(median)
Mean(median)
Mathematics achievement level 7.3 (6.6) 3.7 (3.5) 6.3 (6.0) 7.6 (8.0) 6.1 (5.6)
Transitional youth are persons who are 25 years old or younger.Source: VR Longitudinal Study, November 1999Preliminary findings: data collection is ongoing
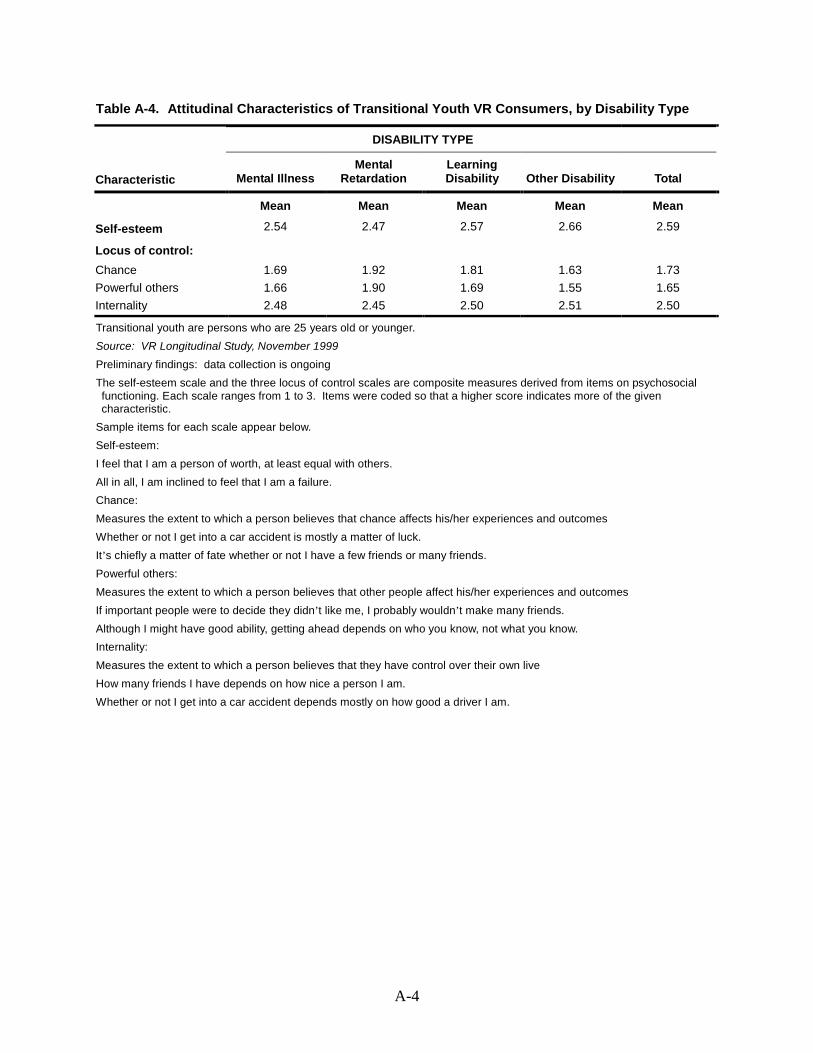
A-4
Table A-4. Attitudinal Characteristics of Transitional Youth VR Consumers, by Disability Type
DISABILITY TYPE
Characteristic Mental IllnessMental
RetardationLearningDisability Other Disability Total
Mean Mean Mean Mean Mean
Self-esteem 2.54 2.47 2.57 2.66 2.59
Locus of control:Chance 1.69 1.92 1.81 1.63 1.73Powerful others 1.66 1.90 1.69 1.55 1.65Internality 2.48 2.45 2.50 2.51 2.50
Transitional youth are persons who are 25 years old or younger.Source: VR Longitudinal Study, November 1999Preliminary findings: data collection is ongoingThe self-esteem scale and the three locus of control scales are composite measures derived from items on psychosocialfunctioning. Each scale ranges from 1 to 3. Items were coded so that a higher score indicates more of the givencharacteristic.
Sample items for each scale appear below.Self-esteem:I feel that I am a person of worth, at least equal with others.All in all, I am inclined to feel that I am a failure.Chance:Measures the extent to which a person believes that chance affects his/her experiences and outcomesWhether or not I get into a car accident is mostly a matter of luck.It’s chiefly a matter of fate whether or not I have a few friends or many friends.Powerful others:Measures the extent to which a person believes that other people affect his/her experiences and outcomesIf important people were to decide they didn’t like me, I probably wouldn’t make many friends.Although I might have good ability, getting ahead depends on who you know, not what you know.Internality:Measures the extent to which a person believes that they have control over their own liveHow many friends I have depends on how nice a person I am.Whether or not I get into a car accident depends mostly on how good a driver I am.
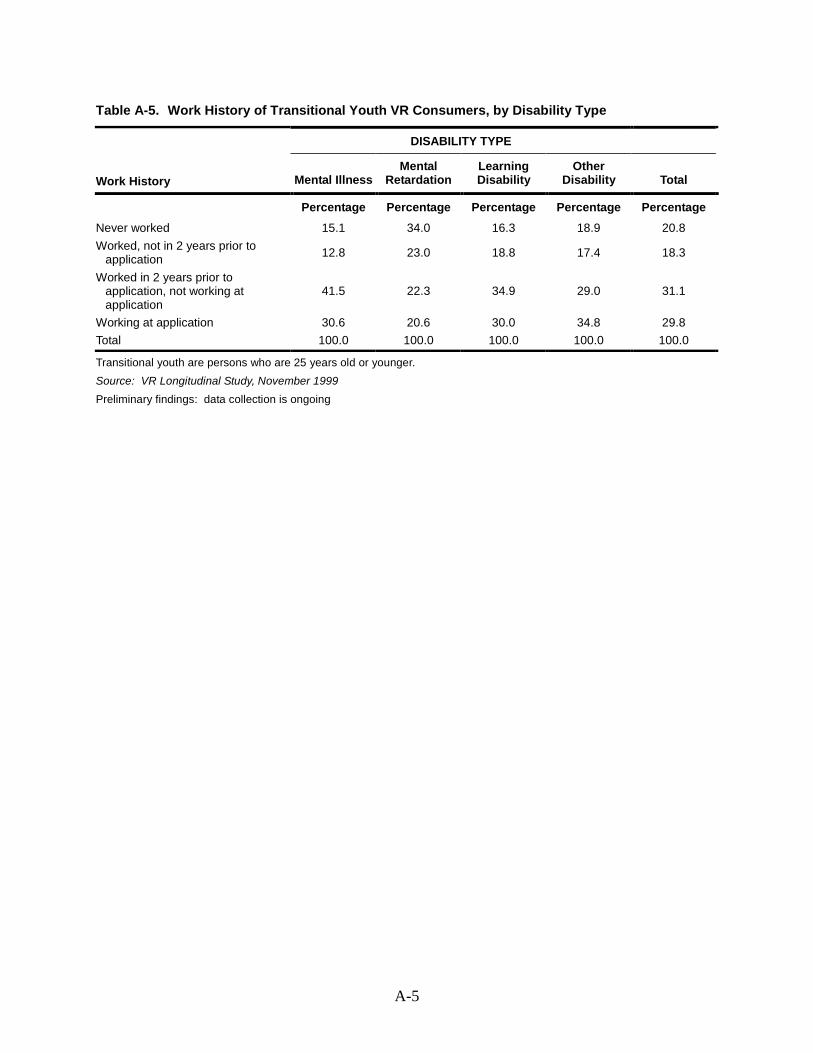
A-5
Table A-5. Work History of Transitional Youth VR Consumers, by Disability Type
DISABILITY TYPE
Work History Mental IllnessMental
RetardationLearningDisability
OtherDisability Total
Percentage Percentage Percentage Percentage PercentageNever worked 15.1 34.0 16.3 18.9 20.8Worked, not in 2 years prior to
application 12.8 23.0 18.8 17.4 18.3
Worked in 2 years prior toapplication, not working atapplication
41.5 22.3 34.9 29.0 31.1
Working at application 30.6 20.6 30.0 34.8 29.8Total 100.0 100.0 100.0 100.0 100.0
Transitional youth are persons who are 25 years old or younger.Source: VR Longitudinal Study, November 1999Preliminary findings: data collection is ongoing
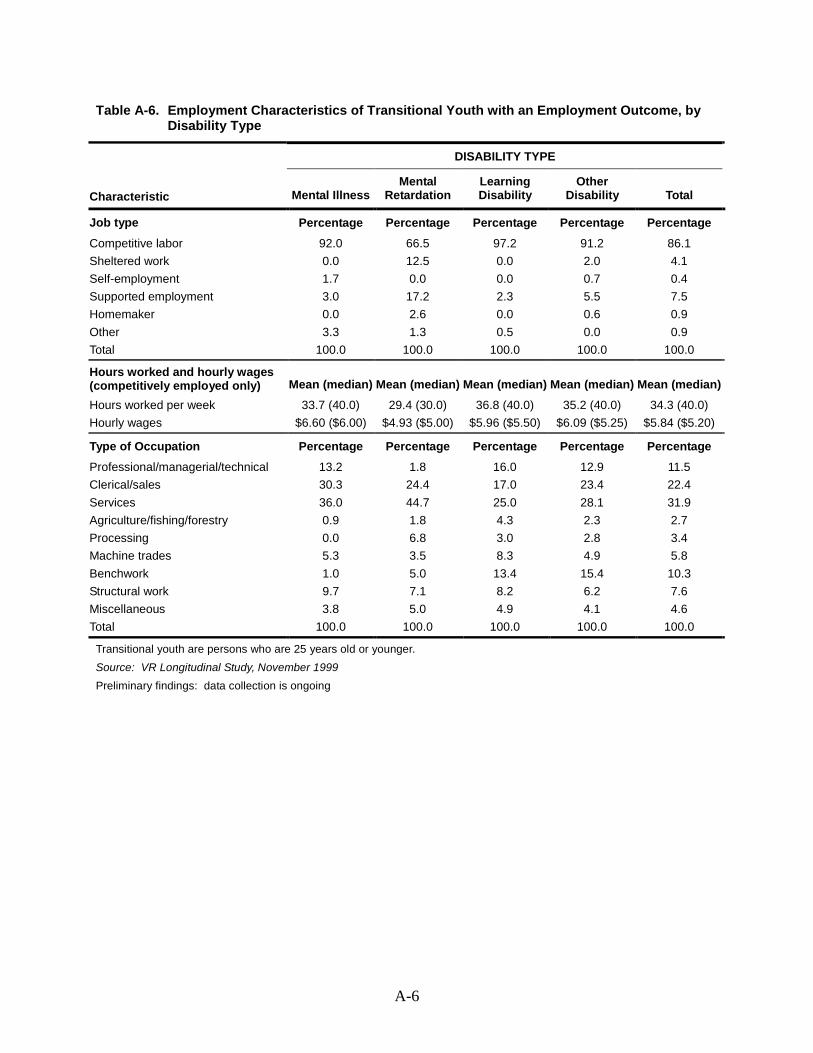
A-6
Table A-6. Employment Characteristics of Transitional Youth with an Employment Outcome, byDisability Type
DISABILITY TYPE
Characteristic Mental IllnessMental
RetardationLearningDisability
OtherDisability Total
Job type Percentage Percentage Percentage Percentage PercentageCompetitive labor 92.0 66.5 97.2 91.2 86.1Sheltered work 0.0 12.5 0.0 2.0 4.1Self-employment 1.7 0.0 0.0 0.7 0.4Supported employment 3.0 17.2 2.3 5.5 7.5Homemaker 0.0 2.6 0.0 0.6 0.9Other 3.3 1.3 0.5 0.0 0.9Total 100.0 100.0 100.0 100.0 100.0
Hours worked and hourly wages(competitively employed only) Mean (median) Mean (median) Mean (median) Mean (median) Mean (median)Hours worked per week 33.7 (40.0) 29.4 (30.0) 36.8 (40.0) 35.2 (40.0) 34.3 (40.0)Hourly wages $6.60 ($6.00) $4.93 ($5.00) $5.96 ($5.50) $6.09 ($5.25) $5.84 ($5.20)
Type of Occupation Percentage Percentage Percentage Percentage PercentageProfessional/managerial/technical 13.2 1.8 16.0 12.9 11.5Clerical/sales 30.3 24.4 17.0 23.4 22.4Services 36.0 44.7 25.0 28.1 31.9Agriculture/fishing/forestry 0.9 1.8 4.3 2.3 2.7Processing 0.0 6.8 3.0 2.8 3.4Machine trades 5.3 3.5 8.3 4.9 5.8Benchwork 1.0 5.0 13.4 15.4 10.3Structural work 9.7 7.1 8.2 6.2 7.6Miscellaneous 3.8 5.0 4.9 4.1 4.6Total 100.0 100.0 100.0 100.0 100.0
Transitional youth are persons who are 25 years old or younger.Source: VR Longitudinal Study, November 1999Preliminary findings: data collection is ongoing
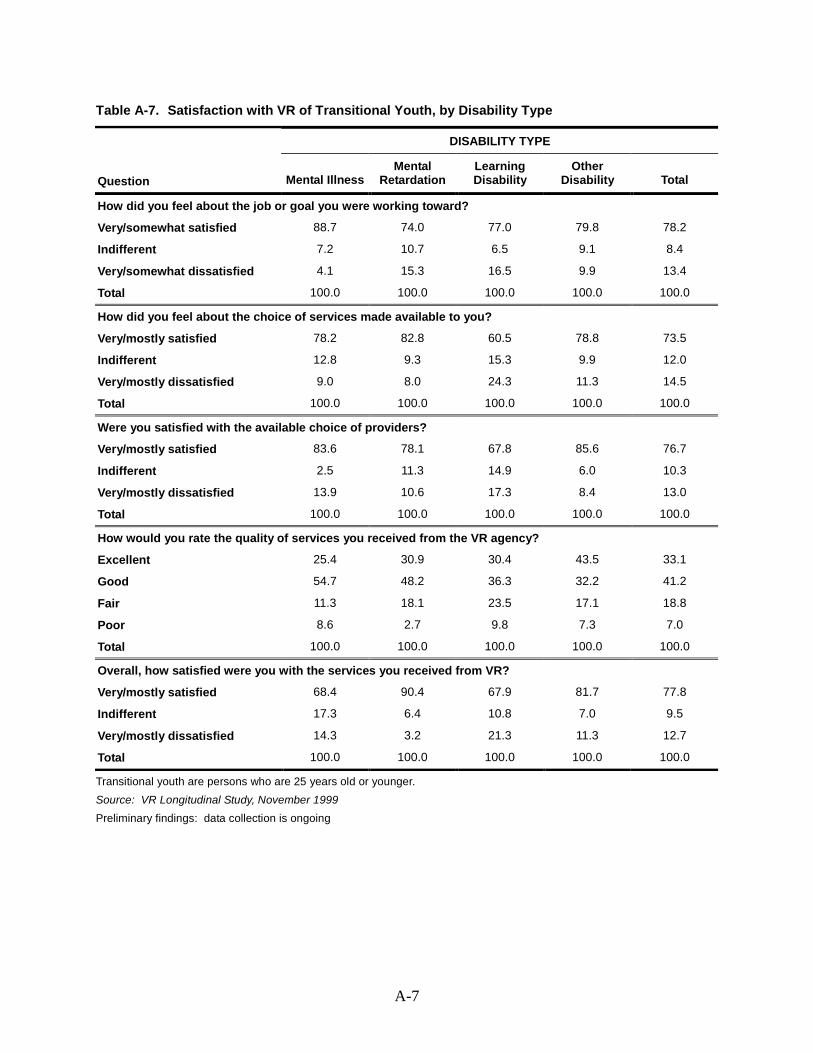
A-7
Table A-7. Satisfaction with VR of Transitional Youth, by Disability Type
DISABILITY TYPE
Question Mental IllnessMental
RetardationLearningDisability
OtherDisability Total
How did you feel about the job or goal you were working toward?
Very/somewhat satisfied 88.7 74.0 77.0 79.8 78.2
Indifferent 7.2 10.7 6.5 9.1 8.4
Very/somewhat dissatisfied 4.1 15.3 16.5 9.9 13.4
Total 100.0 100.0 100.0 100.0 100.0
How did you feel about the choice of services made available to you?
Very/mostly satisfied 78.2 82.8 60.5 78.8 73.5
Indifferent 12.8 9.3 15.3 9.9 12.0
Very/mostly dissatisfied 9.0 8.0 24.3 11.3 14.5
Total 100.0 100.0 100.0 100.0 100.0
Were you satisfied with the available choice of providers?
Very/mostly satisfied 83.6 78.1 67.8 85.6 76.7
Indifferent 2.5 11.3 14.9 6.0 10.3
Very/mostly dissatisfied 13.9 10.6 17.3 8.4 13.0
Total 100.0 100.0 100.0 100.0 100.0
How would you rate the quality of services you received from the VR agency?
Excellent 25.4 30.9 30.4 43.5 33.1
Good 54.7 48.2 36.3 32.2 41.2
Fair 11.3 18.1 23.5 17.1 18.8
Poor 8.6 2.7 9.8 7.3 7.0
Total 100.0 100.0 100.0 100.0 100.0
Overall, how satisfied were you with the services you received from VR?
Very/mostly satisfied 68.4 90.4 67.9 81.7 77.8
Indifferent 17.3 6.4 10.8 7.0 9.5
Very/mostly dissatisfied 14.3 3.2 21.3 11.3 12.7
Total 100.0 100.0 100.0 100.0 100.0
Transitional youth are persons who are 25 years old or younger.Source: VR Longitudinal Study, November 1999Preliminary findings: data collection is ongoing
Appendix B: Creation of Functional Limitation Scales
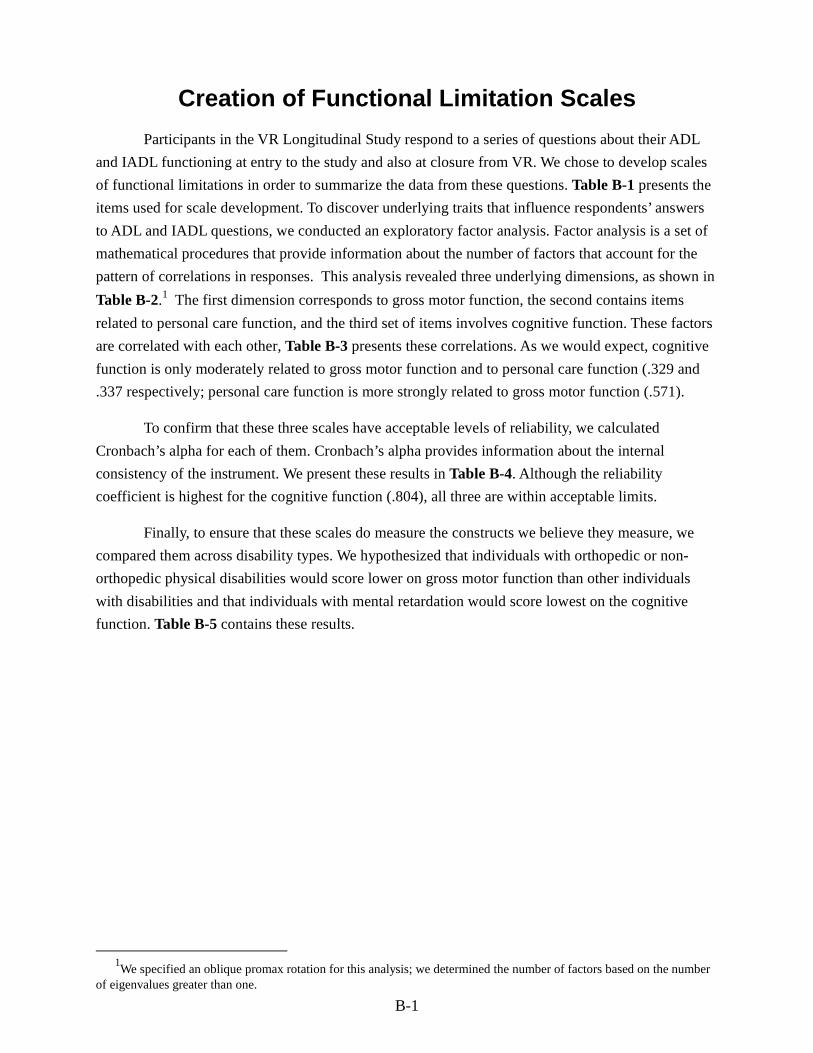
B-1
Creation of Functional Limitation ScalesParticipants in the VR Longitudinal Study respond to a series of questions about their ADL
and IADL functioning at entry to the study and also at closure from VR. We chose to develop scalesof functional limitations in order to summarize the data from these questions. Table B-1 presents theitems used for scale development. To discover underlying traits that influence respondents’ answersto ADL and IADL questions, we conducted an exploratory factor analysis. Factor analysis is a set ofmathematical procedures that provide information about the number of factors that account for thepattern of correlations in responses. This analysis revealed three underlying dimensions, as shown inTable B-2.1 The first dimension corresponds to gross motor function, the second contains itemsrelated to personal care function, and the third set of items involves cognitive function. These factorsare correlated with each other, Table B-3 presents these correlations. As we would expect, cognitivefunction is only moderately related to gross motor function and to personal care function (.329 and.337 respectively; personal care function is more strongly related to gross motor function (.571).
To confirm that these three scales have acceptable levels of reliability, we calculatedCronbach’s alpha for each of them. Cronbach’s alpha provides information about the internalconsistency of the instrument. We present these results in Table B-4. Although the reliabilitycoefficient is highest for the cognitive function (.804), all three are within acceptable limits.
Finally, to ensure that these scales do measure the constructs we believe they measure, wecompared them across disability types. We hypothesized that individuals with orthopedic or non-orthopedic physical disabilities would score lower on gross motor function than other individualswith disabilities and that individuals with mental retardation would score lowest on the cognitivefunction. Table B-5 contains these results.
1We specified an oblique promax rotation for this analysis; we determined the number of factors based on the number
of eigenvalues greater than one.
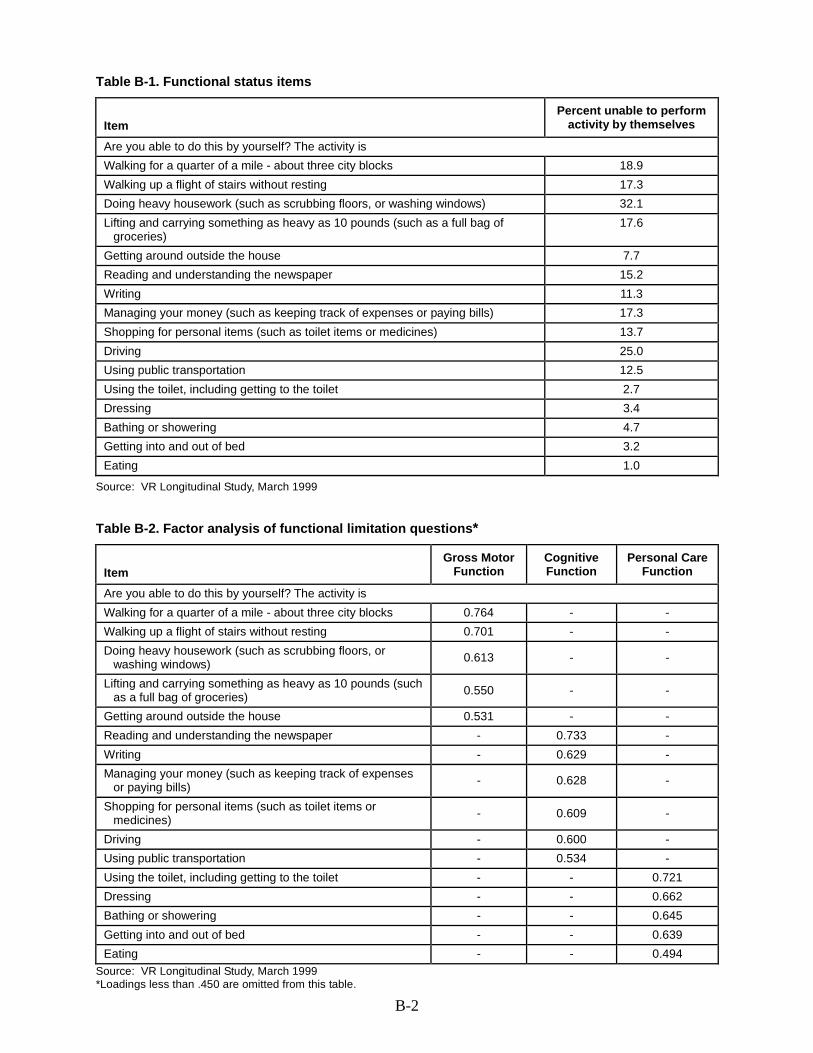
B-2
Table B-1. Functional status items
ItemPercent unable to perform
activity by themselves
Are you able to do this by yourself? The activity isWalking for a quarter of a mile - about three city blocks 18.9Walking up a flight of stairs without resting 17.3Doing heavy housework (such as scrubbing floors, or washing windows) 32.1Lifting and carrying something as heavy as 10 pounds (such as a full bag of
groceries)17.6
Getting around outside the house 7.7Reading and understanding the newspaper 15.2Writing 11.3Managing your money (such as keeping track of expenses or paying bills) 17.3Shopping for personal items (such as toilet items or medicines) 13.7Driving 25.0Using public transportation 12.5Using the toilet, including getting to the toilet 2.7Dressing 3.4Bathing or showering 4.7Getting into and out of bed 3.2Eating 1.0
Source: VR Longitudinal Study, March 1999
Table B-2. Factor analysis of functional limitation questions*
ItemGross Motor
FunctionCognitiveFunction
Personal CareFunction
Are you able to do this by yourself? The activity isWalking for a quarter of a mile - about three city blocks 0.764 - -Walking up a flight of stairs without resting 0.701 - -Doing heavy housework (such as scrubbing floors, or
washing windows) 0.613 - -
Lifting and carrying something as heavy as 10 pounds (suchas a full bag of groceries) 0.550 - -
Getting around outside the house 0.531 - -Reading and understanding the newspaper - 0.733 -Writing - 0.629 -Managing your money (such as keeping track of expenses
or paying bills) - 0.628 -
Shopping for personal items (such as toilet items ormedicines) - 0.609 -
Driving - 0.600 -Using public transportation - 0.534 -Using the toilet, including getting to the toilet - - 0.721Dressing - - 0.662Bathing or showering - - 0.645Getting into and out of bed - - 0.639Eating - - 0.494
Source: VR Longitudinal Study, March 1999*Loadings less than .450 are omitted from this table.
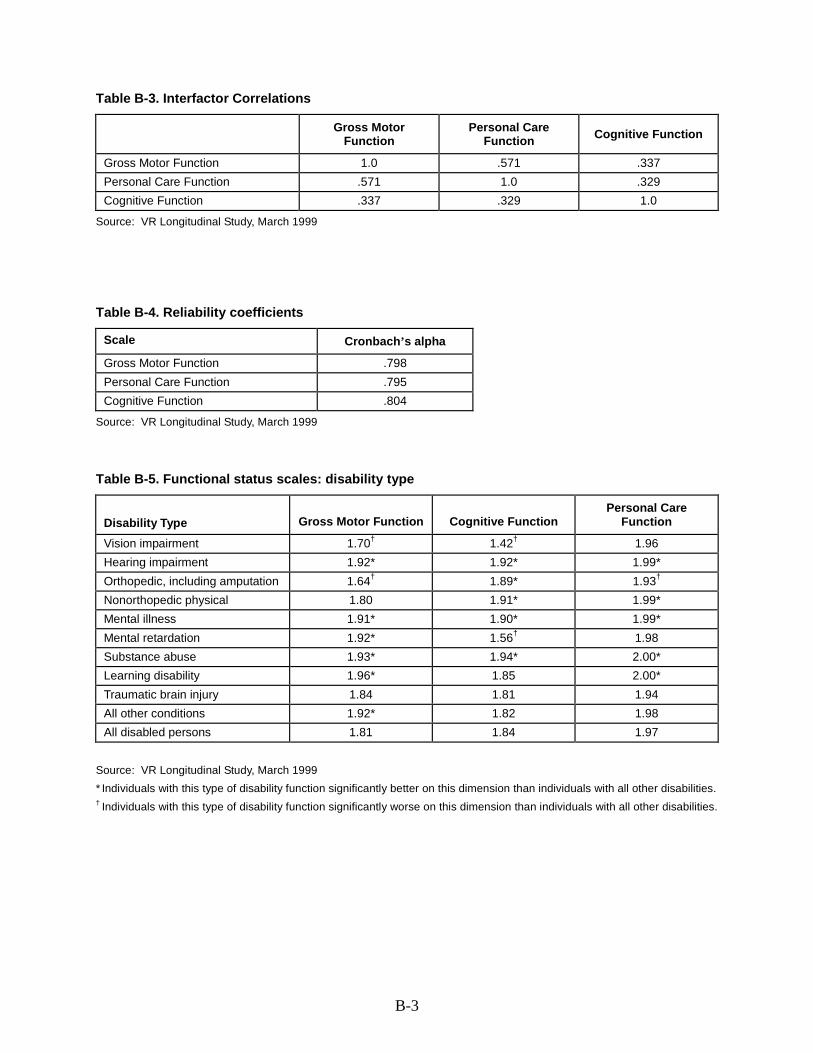
B-3
Table B-3. Interfactor Correlations
Gross MotorFunction
Personal CareFunction Cognitive Function
Gross Motor Function 1.0 .571 .337Personal Care Function .571 1.0 .329Cognitive Function .337 .329 1.0
Source: VR Longitudinal Study, March 1999
Table B-4. Reliability coefficients
Scale Cronbach’s alpha
Gross Motor Function .798Personal Care Function .795Cognitive Function .804
Source: VR Longitudinal Study, March 1999
Table B-5. Functional status scales: disability type
Disability Type Gross Motor Function Cognitive FunctionPersonal Care
Function
Vision impairment 1.70† 1.42† 1.96Hearing impairment 1.92* 1.92* 1.99*Orthopedic, including amputation 1.64† 1.89* 1.93†
Nonorthopedic physical 1.80 1.91* 1.99*Mental illness 1.91* 1.90* 1.99*Mental retardation 1.92* 1.56† 1.98Substance abuse 1.93* 1.94* 2.00*Learning disability 1.96* 1.85 2.00*Traumatic brain injury 1.84 1.81 1.94All other conditions 1.92* 1.82 1.98All disabled persons 1.81 1.84 1.97
Source: VR Longitudinal Study, March 1999* Individuals with this type of disability function significantly better on this dimension than individuals with all other disabilities.† Individuals with this type of disability function significantly worse on this dimension than individuals with all other disabilities.
Appendix C: Education and Training Services
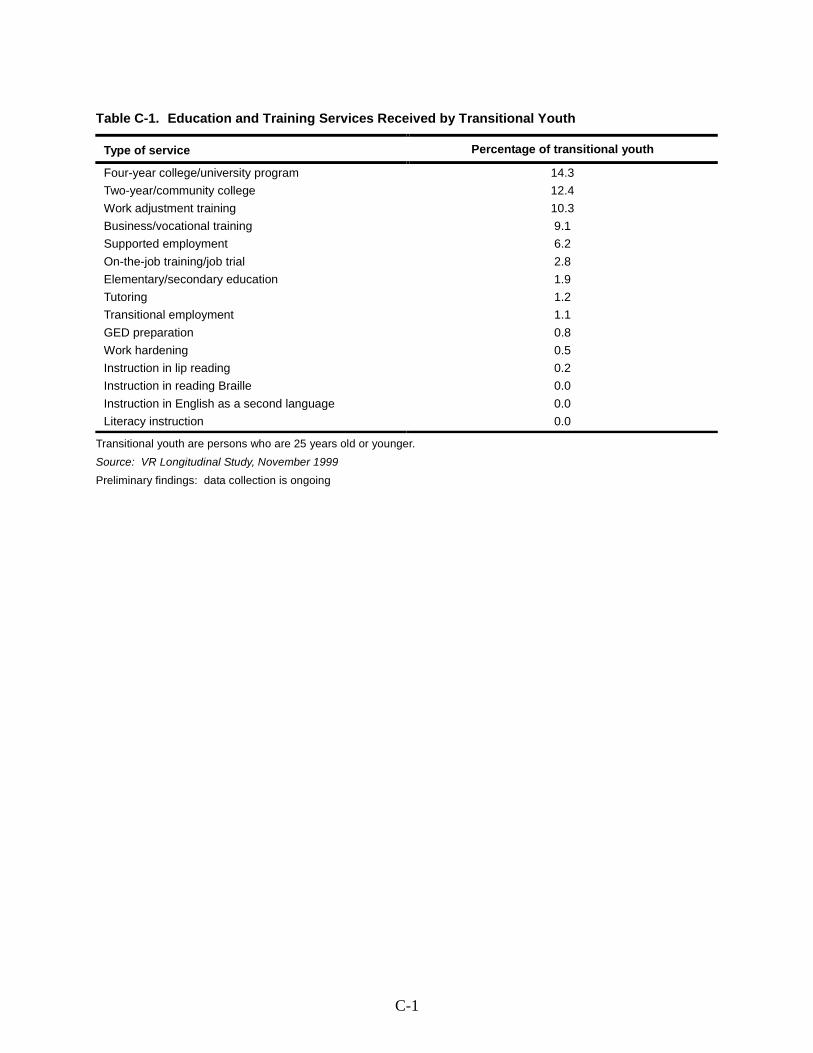
C-1
Table C-1. Education and Training Services Received by Transitional Youth
Type of service Percentage of transitional youth
Four-year college/university program 14.3Two-year/community college 12.4Work adjustment training 10.3Business/vocational training 9.1Supported employment 6.2On-the-job training/job trial 2.8Elementary/secondary education 1.9Tutoring 1.2Transitional employment 1.1GED preparation 0.8Work hardening 0.5Instruction in lip reading 0.2Instruction in reading Braille 0.0Instruction in English as a second language 0.0Literacy instruction 0.0
Transitional youth are persons who are 25 years old or younger.Source: VR Longitudinal Study, November 1999Preliminary findings: data collection is ongoing