Embed Size (px)
Citation preview

American Indian FamiliesFamilies Project
A look at
AAmmeerriiccaann IInnddiiaann FFaammiilliieessAAmmeerriiccaann IInnddiiaann FFaammiilliieessin Hennepin County
Part Two: An In-ddepth Look at the Community

Hennepin County Office of Planning & DevelopmentGovernment Center A-2308300 Sixth Street SouthMinneapolis, MN 55487-0238
Project contact: Justin Kii HuenemannPhone: 612-596-7601Fax: 612-348-7423E-mail: [email protected]://www.hennepin.us/opd/opd.htm
Photos by: Healthy Nations, American Indian Center1530 E. FranklinMinneapolis, MN 55404
February 2004
Reports within this series include:A look at American Indian Families in Hennepin CountyPart One: Hennepin County American Indian DemographicsPart Two: An In-Depth Look at the CommunityPart Three: Investing in American Indian Families*Part Four: Voices of American Indian Families*Part Five: Reclaiming the Spirit*
A Look at American Indian Families in Hennepin County: Part Oneused data from the U.S. Census to present demographicinformation about American Indian families. This report builds onthe information presented in Part One and takes a deeper look athealth, economics, child welfare, incarceration and job training,among other topics, in the American Indian community. The dataused in this report is primarily Hennepin County administrative dataand public data from the State of Minnesota and other agencies.
This collection of reports is a base resource to further theunderstanding and appreciation of American Indian families inHennepin County. Each report, in isolation, is not a completepicture of the community and will not lead to sustainable solutions.The larger community will find these reports most useful when usedin combination with the other four reports in this series and incoordination with individuals who are knowledgeable about andinvolved with the American Indian community in Hennepin County.
The premise of the American Indian Families Project is thatstrategies and solutions to many of the challenges facing AmericanIndian families can be found within the community's own strengthsand assets. Traditionally, systems have been dismissive of suchstrengths and assets, resulting in policies and practices that are indisaccord with American Indian beliefs, values, and behaviors. It isimportant that future indicators, data gathering methods anddecisions reflect this kind of "strength-based" thinking.
As with Part One of this series, this report contains ""QQuuee ss tt ii oonn ss tt oo""QQuuee ss tt ii oonn ss tt ooCCoonn ss ii ddee rr .. ""CCoonn ss ii ddee rr .. "" The purpose of these questions is to stimulatecommunity and stakeholder reflection and generate discussionabout ways to improve the well-being of American Indian familiesin Hennepin County.
Unless otherwise noted, the term American Indian includes thosewho have identified themselves or been identified as AmericanIndian Only or American Indian Plus Another Race(s).
*Scheduled for Publication in Spring, 2004

A Look at American Indian Families in Hennepin County Part Two: An In-depth Look at the Community
Con t en t sCon t en t sEExxeeccuuttiivvee SSuummmmaarryy 11
IInnttrroodduuccttiioonn 22
BBeeggiinnnniinngg LLiiffee:: AA HHeeaalltthhyy SSttaarrtt 33Life Expectancy at Birth 3Prenatal Care 4Low Birth Weight Babies 4
EEaarrllyy CChhiillddhhoooodd:: AA TTiimmee ooff DDiissccoovveerryy 66Immunizations 6
YYoouutthh:: BBuuiillddiinngg aa SSttrroonngg FFoouunnddaattiioonn 77Child Maltreatment 7Out-of-Home Placement 8Adoptions 9Permanency 11Child Support 12Public Healthcare Coverage for Youth 12Truancy 13
AAddoolleesscceennccee:: PPrreeppaarriinngg ffoorr SSuucccceessss 1144High School Education 14Teen Pregnancy 15Teen Parents Receiving Minnesota Family Investment Program (MFIP) Assistance 16Tobacco, Alcohol and Drug Use: Adolescent Chemical Health 16Adolescent Mental Health 17Juvenile Crime 18Juvenile Probation 18
AAdduullttss:: EEnnhhaanncciinngg WWhhaatt WWee HHaavvee BBeeccoommee 1199American Indian Business Owners 19Unemployment 19Minnesota Family Investment Program (MFIP) 19Job Training 21Emergency Assistance 24Food Support Cases 24Families Living in Emergency Shelters 25Homelessness 25Chemical Health 26Mental Health 26Diabetes and Obesity 27Access to Healthcare 27Hennepin County Medical Center (HCMC) Medical System 28Public Healthcare Coverage for Adults 29Adult Crime 30Adults Booked in Jail 30Adult Probation 31Number of Deaths 31Leading Cause of Death 32Discrimination 32Passing on Traditions and Cultural Values 33
EEllddeerrss:: AA TTiimmee ooff RReefflleeccttiioonn,, LLeeaaddeerrsshhiipp aanndd CCoonnttiinnuueedd LLeeaarrnniinngg 3344CCoonncclluussiioonn 3355QQuueessttiioonnss ttoo CCoonnssiiddeerr 3366EEnnddnnootteess 3388SSoouurrcceess 4400


A Look at American Indian Families in Hennepin County Part Two: An In-depth Look at the Community
1Executive Summary
E x e cu t i v e S ummaryExe cu t i v e S ummaryThis report, the second in a series from the American Indian Families Project(AIFP), contains information about American Indians in Hennepin Countyspanning the life cycle from birth to old age.
American Indian families in Hennepin County experience across-the-boarddisparities in conditions of well-being when compared with the generalpopulation. As these interrelated disparities are experienced fromconception to old age, isolated efforts to change or improve suchconditions will have little lasting effect. The quality of life American Indiansexperience is a shared responsibility between individuals, families,communities and stakeholders.
Disparate health trends contribute to poor youth development, whichaffects educational attainment, and lends to economic instability.Understanding the relationship between such disparities requires individuals,families, communities and stakeholders to carefully examine disparateconditions collectively. As these disparities are woven together, so are thesolutions needed to address them. In each case, they affect the well-being of all families in Hennepin County.
Ultimately, sustainable, shared, and knowledegable investment and actionby individuals, families, communities, and stakeholders are needed toimprove the quality of life American Indian families experience.
KKeeyy ff ii nndd ii nngg ss ff rr oomm tt hh ii ss rr eeppoo rr tt ii nn cc ll uuddee ::KKeeyy ff ii nndd ii nngg ss ff rr oomm tt hh ii ss rr eeppoo rr tt ii nn cc ll uuddee ::American Indian infant boys and girls in Hennepin County areexpected to live approximately 10 years fewer than infant boys andgirls in the total population. (Page 3)More pregnant American Indian women are receiving prenatal carenow than a decade ago, yet 2-in-5 still do not seek, or have access toprenatal care. (Page 4)Up-to-date immunization rates increased among American Indianschool children during the 1990s. (Page 6)In 2000, American Indian children made-up 14.4 percent of all childrenin out-of-home placement, six time greater than the percent ofAmerican Indian children in the total child population. (Page 8)American Indian students in suburban Hennepin County schools aremuch more likely to graduate than their Minneapolis counterparts.(Page 14)American Indians made up 7.6 percent of all people in the 7-countymetro area living in shelters or on the street in 2000. Among those livingon the street, 26.8 percent were American Indian. (Page 25)In 2003, 6,601 American Indian outpatients visited HCMC serviceproviders 23,411 times. More than one-half used public healthinsurance, such as General Assistance Medical Care(GAMC), to payfor their care. (Page 29)Twelve percent of Hennepin County’s American Indian adults werebooked in the Adult Detention Center in 2000. (Page 30)American Indian adults find it more important to pass along theircultural heritage or the traditions of their ancestors to the nextgeneration than the total population. (Page 33)

I n t roduc t i onIn t roduc t i on
Strong families form the foundation of strong communities. Families providethe contextual lens through which we view ourselves and the world aroundus. They shape our opinions and influence our goals. The ability of ourfamilies to provide for our basic needs contributes to whether we will growup healthy and well-adjusted, or not.
Many ingredients make up the recipe for individual success and healthyearly childhood development. Mothers need to receive pre-natal care.Young people need direction and quality learning opportunities. Adultsneed work with a living wage and healthy emotional respite. Elders needsocial interaction, access to health care and enough money or healthinsurance coverage to pay for it. When basic needs such as those listedabove go unfulfilled or are neglected, it compromises the ability of thefamily or individual to maintain an acceptable quality of life.
Raising a healthy and productive family is a great blessing, and a greatchallenge. For many families, the typical day starts before dawn and endsafter sundown. Between going to work, picking-up Jack from childcare,taking Jill to practice, doing laundry, shopping for groceries and trying tosqueeze in a minute of quality time, it’s hard to imagine that today’s familycould take on, or could sustain, any further challenges.
Unfortunately, additional barriers and challenges are exactly whatAmerican Indian families in Hennepin County face. The disproportionatenumber of American Indians living in poverty, not receiving pre-natal care,lacking health care coverage, in out-of-home placement, not completinghigh school, and not finding adequate employment are examples of theday-to-day challenges many families and individuals experience. Thedisparities American Indian families must contend with greatly affect theirability to be happy, healthy, and successful. Faced with unequal chancesand overwhelming odds, these families begin to focus on survival. Familylife revolves around meeting day-to-day needs rather than planning for abetter future.
The information within this document provides an account of the manyconditions of well-being that are disconnected from, inaccessible to, or outof place for many American Indian families in Hennepin County. Again,this report is one of five reports designed to provide a base ofunderstanding and appreciation of American Indian families in HennepinCounty. Understanding the disparities American Indian families face andthe way these disparities serve to undermine their well-being is vital toimproving the quality of life of all families in Hennepin County.
Justin Kii HuenemannAmerican Indian Families ProjectAmerican Indian Community Catalyst and Project ManagerJanuary 2004
2
A Look at American Indian Families in Hennepin County Part Two: An In-depth Look at the Community
Introduction

76.3
66.6
0 50 100
All Races
American Indian
Years of Expected Life
72.1
81.6
0 50 100
Male Female
A Look at American Indian Families in Hennepin County Part Two: An In-depth Look at the Community
Beginning Life: A Healthy Start
B e g i nn i ng L i f e : A Hea l t hy S t a r tBeg i nn i ng L i f e : A Hea l t hy S t a r t(Prenatal and Birth)
Even before babies are born, their environments influence them. In anideal world, parents would have stable housing and a sufficient income,and be nurturing loving, healthy and emotionally stable. However, ifparents are lacking in any of these areas, it has the potential to put babiesand children at-risk.American Indian parents tend to be at a greater socioeconomicdisadvantage than the total population, which affects their income,health and stability, as well as their ability to obtain and maintainaffordable housing.
LL ii ff ee EExxppee cc tt aann ccyy aa tt BB ii rr tt hhLL ii ff ee EExxppee cc tt aann ccyy aa tt BB ii rr tt hh
American Indian infants in Hennepin County have a lower life expectancyrate at birth than infants in the total population and infants of any otherrace or ethnicity.1 Currently, American Indians live approximately 10 feweryears than individuals in the total population. Some of the difference in lifeexpectancy for American Indians is due to greater infant mortality ratesand higher rates of premature death from heart disease, cancer andunintentional injuries. The difference in national life expectancy ratesbetween American Indians and the total population is 2.6 years. InHennepin County, the difference in life expectancy rates is much greater.
Life Expectancy at Birth by Gender and Race, Hennepin County, 1997-2001
From 1994 to 1996 the life expectancy at birth for American Indians livingwithin the Indian Health Service Area population was 73.2 years,2compared with 75.8 years for all races and 76.5 years for white residents (U.S.Department of Health and Human Services, 1999).3
Life expectancy rates for American Indians increased by 9.7 yearsbetween 1972-1974 and 1994-1996, compared with a 4.4-year increase forthe total population. According to Goodluck and Willeto (2001), theincrease in life expectancy for American Indians nationally is due, in part,to significant decreases in infant mortality rates.
Source: Minnesota Department of Health; Census 2000
Prepared by: Hennepin County Community Health Department, October 2003.
72.1
81.6
3
“… after a Native infant is born, allencounters along the developmentallife span (birth to early adulthood)present extreme barriers anddifficulties.” Goodluck and Willeto (2001)

4
A Look at American Indian Families in Hennepin County Part Two: An In-depth Look at the Community
PP rr eennaa tt aa ll CCaa rr eePP rr eennaa tt aa ll CCaa rr eePregnant women who receive prenatal care are more likely to give birthto healthy babies. Among babies born to American Indian women inHennepin County, 2-in-5 infants are at a greater risk of developinghealth problems because their mother did not seek, or did not haveaccess to, prenatal care.
Nevertheless, American Indian women are making strides in ensuringthat they receive prenatal care. Pregnant American Indian women inHennepin County are receiving prenatal care in the first trimester at a48.2 percent greater rate than in 1990, compared with a 3.3 percentincrease in the total population.
Source: Minnesota Department of Health
Prepared by: Hennepin County Community Health Department
Percent of Births Where Prenatal Care Began in the First Trimester, Hennepin County, 1990-2001
LLooww BB ii rr tt hh WWee ii gghh tt BBaabb ii ee ssLLooww BB ii rr tt hh WWee ii gghh tt BBaabb ii ee ss“Babies weighing less than 2,500 grams (about 5.5 pounds) at birth havea high probability of experiencing developmental problems. Therefore,the percent of low birth weight babies reflects a group of children whoare likely to have problems as they move through the growth stages”(The Annie E. Casey Foundation [Casey Foundation], 2002).
Between 1990 and 2001 in Hennepin County, an average of 8.5 percentof births to American Indian mothers were low birth weight births, two percentage points higher than the average for the total population.
Nationally in 1999, 7.1 percent of births to American Indian mothers werelow birth weight babies compared to 7.6 percent of all births (CaseyFoundation, 2002).
0
5
10
15
20
25
1990
1991
1992
1993
1994
1995
1996
1997
1998
1999
2000
2001
Year
Perc
ent
American Indian Total
Low Birth Weight Births (<2500 grams) as a Percent of Total Births, Hennepin County, 1990-2001
Source: Minnesota Department of HealthPrepared by: Hennepin County Community Health Department
0
20
40
60
80
100
1990
1991
1992
1993
1994
1995
1996
1997
1998
1999
2000
2001
Year
Perc
ent
American Indian Total
Beginning Life: A Healthy Start
"Mitakuyepi, (Relatives)
Dakota wichohan wastewadakapi ye!(We love our Dakota life-ways). We callour babies wakanyeja (sacred) beingscoming to us. From the time ofconception we're required to nurture thespirit of our children. Today, we aretaking back the role of the kunsi(grandmother). We are calling forth thegrandmothers from all different tribalbackgrounds to bring forth our teachingsaround birthing. We remember the oldways, and we know the value of keepingour ways alive.
As grandmothers today, we are re-weaving the fabric of community life.This means teaching our young girls howto respect and nurture their own bodies.As they become life-givers, they becomeresponsible for nurturing the life theybring into the world. For us, we cannotseparate the physical from the spiritualprocess of nurturing, the wakanyeza.Western medicine calls this "Pre-natalEducation." As a people we realize theattention required of all of communitylife to nurture the balance andresponsibility of caring for our children.
Henana. Pidamayaye ye. (Thank you!)."Phoebe Iron Necklace, Powderhorn/Phillips Cultural WellnessCenter

A Look at American Indian Families in Hennepin County Part Two: An In-depth Look at the Community
5
Preterm delivery and smoking during pregnancy are two factors mostoften associated with low birth weight births. In Hennepin County,American Indians have higher smoking rates than the total population, yetlow birth weight births among American Indian women remain somewhatcomparable to the number of low birth weight births in the totalpopulation (Hennepin County Community Health Department andBloomington Division of Public Health, 2003; Minnesota Department ofHealth, 2001).
Nationally, American Indian women have higher smoking rates than otherwomen, but the numbers of low birth weight births are similar to total lowbirth weight trends. Researchers have attributed this finding to the valueof children in American Indian communities. “Strong Native Americancultural values regarding infants have the positive result of minimizingproblems with low birth weight among American Indian babies”(Goodluck & Willeto, 2001).
Beginning Life: A Healthy Start
6
A Look at American Indian Families in Hennepin County Part Two: An In-depth Look at the Community
Early Childhood: A Time of Discovery
E a r l y Ch i l dhood : A T ime o fE a r l y Ch i l dhood : A T ime o fD i s cove ry D i s cove ry (Ages 0 to Kindergarten)
Studies have shown the importance of investing in early childhood development and school readiness (Rolnick & Grunewald, 2003; Currie &Neidell, 2003). Not only do quality early childhood developmentexperiences prepare children with the skills they need to start school, butalso for greater opportunities later in life.
Unfortunately, data currently does not exist about quality early childhoodcare or school readiness. The Minnesota Department of Education iscollecting data about school readiness by race, which will be availablelater this year.
Immunization rates are one positive indicator of healthy development forchildren entering kindergarten.
IImmmmuunn ii zz aa tt ii oonn ssIImmmmuunn ii zz aa tt ii oonn ssUp-to-date immunization rates for American Indian children enteringkindergarten are similar to the immunization rates for all children inHennepin County.
Between the 1992-1993 and 2001-2002 school years, the immunization ratefor all students increased 42.2 percent. During the 1992-1993 school year,around half of all American Indian children entering kindergarten had up-to-date immunizations - similar to the percent of all kindergarten studentswith up-to-date immunizations. By 2001-2002, almost three-quarters, 72.2percent, of all American Indian school children had up-to-dateimmunizations.
Despite recent increases in immunization rates, slightly more than 25 percent of American Indian kindergarten students do not have up-to-dateimmunizations, compared with slightly more than 20 percent of allkindergartners.
Up-to-Date Immunizations at 24 Months, Hennepin County, 1992-2002
Source: Minnesota Department of Health
Prepared by: Hennepin County Community Health Department
48.2
72.2
51.7
78.2
63.055.0
0
20
40
60
80
100
1992-1993 1996-1997 2001-2002
Year
Perc
ent
American Indian Total

A Look at American Indian Families in Hennepin County Part Two: An In-depth Look at the Community
7
You th : Bu i l d i n g a S t r ongYou th : Bu i l d i n g a S t r ongFounda t i onFounda t i on(Ages 0 to 17)
To build a strong foundation for future success, youth need to be healthy,have stable homes and be engaged in a positive learning process.Nationally, Goodluck and Willeto (2001) found that frequently “… youngAmerican Indians do not have the necessary social, educational, healthand environmental supports and resources.” The researchers concludethat this is one of the reasons why American Indian children and youth fairpoorly in child welfare indicators.
CChh ii ll dd MMaa ll tt rr ee aa ttmmeenn ttCChh ii ll dd MMaa ll tt rr ee aa ttmmeenn ttAmerican Indian children are overrepresented in the child protection system.In Hennepin County, they make up about 10 percent of all childrenassessed for maltreatment and about 13.5 percent of all children determined maltreated by child protection services. At the same time,they make up just 2.5 percent of Hennepin County’s total child population(U.S. Census Bureau [Census], 2000).
Number of Children Assessed for Maltreatment by Year, Hennepin County, 2000-2002
6,810 6,392 6,286
416418542
318248286
0
1,000
2,000
3,000
4,000
5,000
6,000
7,000
8,000
2000 2001 2002
Year
Tota
l N
um
ber
Other Race American Indian Only American Indian Plus Another Race(s)
In 2000, 12.3 percent of all American Indian children in Hennepin County, or 828 of 6,743 children, were assessed for maltreatment. Among childrenidentified as American Indian only, a large percent (14.2), orapproximately 1-in-7, were assessed for maltreatment. Among childrenidentified as American Indian plus another race(s), 9.8 percent, or 1-in-10were assessed. In 2000, 8.7 percent of all youth identified as AmericanIndian only and 6.3 percent of all youth identified as American Indian plusanother race(s) were determined maltreated.
Source: Hennepin County Children, Family and Adult Services Department
Youth: Building a Strong Foundation

8
A Look at American Indian Families in Hennepin County Part Two: An In-depth Look at the Community
Youth: Building a Strong Foundation
Source: Hennepin County Children, Family and Adult Services Department
Number of Children Determined to Be Maltreated by Year, Hennepin County, 2000-2002
OOuu tt - oo ff -HHoommee PP ll aa cc eemmeenn ttOOuu tt - oo ff -HHoommee PP ll aa cc eemmeenn ttAmerican Indian children are disproportionately represented in out-of-home placement. In Hennepin County in 2000, American Indian childrenmade up 14.4 percent of all children in out-of-home placement. This isapproximately six times greater than the percent of American Indian children in the total child population.
On average, American Indian children make up approximately 15percent of the total out-of-home placement population. AmericanIndian children with ICWA status average about 6 percent of the totalout-of-home placement population. (ICWA definition, see side bar)
Source: Hennepin County Children, Family and Adult Services Department
2,425 2,236 2,288
291300 286
13893117
0
500
1,000
1,500
2,000
2,500
3,000
3,500
2000 2001 2002
Year
Tota
l N
um
ber
Other Race American Indian Only American Indian Plus Another Race(s)
Number of Children in Out-of-Home Placement by Year, Hennepin County, 2000-2002
“On November 8, 1978, Congressenacted the Indian Child Welfare Act(ICWA) in response to the ‘risingconcern…over the consequences toIndian children, Indian families, andIndian tribes of abusive child welfarepractices that resulted in the separationof large numbers of Indian childrenfrom their families and tribes throughadoption or foster care placement’(Mississippi Band of Choctaw Indians v.Holyfield, 1989). ICWA was designed toreduce the flow of Indian childrenaway from their natural families bycreating legal protections thatrecognize tribal interests in the welfareof their children. By allowing tribesgreater involvement in child custodyproceedings involving American Indianchildren, ICWA gives tribes a means toprotect the most basic necessity theyneed to ensure their survival – a nextgeneration” (Brown, Limb, Munoz &Clifford 2001).
Although ICWA was passed with thebest of intentions, barriers to addressingthe needs of all American Indian youthinvolved with child protection systemscontinue to exist for American Indiantribes, extended families and county orstate child welfare agencies. InHennepin County, less than one-half ofall American Indian children in out-of-home placement are actually eligiblefor ICWA services.
3,711 3,527 3,302
429 312 265
226195223
0
1,000
2,000
3,000
4,000
5,000
6,000
7,000
8,000
2000 2001 2002Year
Tota
l N
um
ber
Other Race American Indian Only American Indian Plus Another Race(s)

A Look at American Indian Families in Hennepin County Part Two: An In-depth Look at the Community
9Youth: Building a Strong Foundation
Slightly less than one-half of American Indian children in out-of-homeplacement have ICWA status.4
193 188 192
215 205 232
050
100150200250
300350400
450500
2000 2001 2002
Year
Tota
l N
um
ber
With ICWA Status No ICWA Status
Number of American Indian Children in Out-of-HomePlacement by ICWA Status and Year,
Hennepin County, 2000-2002
Source: Hennepin County Children, Family and Adult Services Department
American Indian children are more likely than children in the total out-of-home placement population to spend a longer total amount of time inplacement or to still be in placement today.5 They are less likely to havea quick reunification with their parent(s) or, if parental rights areterminated, to be quickly adopted.
56.2%
20.9%12.0%
11.0%
7 days or less 8 to 90 days91 days or more Still in Placement
46.7%
12.3%
22.0%
19.0%
7 days or less 8 to 90 days91 days or more Still in Placement
Percent of All Children in Out-of-Home Placement by
Total Number of Days in Placements, 3-Year Average, Hennepin County, 2000-2002
Percent of American IndianChildren in Out-of-Home Placement
by Total Number of Days inPlacements, 3-Year Average,Hennepin County, 2000-2002
Source: Hennepin County Children, Family and Adult Services Department
AAddoopp tt ii oonn ssAAddoopp tt ii oonn ssAmerican Indian children are overrepresented in the area of adoption,much as they are overrepresented in child protection and out-of-homeplacement programs.
Over the past three years in Hennepin County, on average 61.7 percent ofadopted American Indian children and 85.3 percent of American Indianchildren on the waiting list had ICWA status.
"The Indian Child Welfare Act(ICWA)…is more than a federal law. It'smore than mere words on paper. Thepurpose of ICWA is to preserve andstrengthen Indian families. It wasdesigned to keep the children dancingwith their grandfathers, theirgrandmothers, their aunts, their uncles,extended families, and so forth. Bycomplying with the Indian Child WelfareAct, Indian children can grow upknowing their culture and experiencingit firsthand. It is through the childrenthat the elders' teachings, values,languages, unique practices andtraditions are passed on and preserved." Valerie Lane,Attorney, National IndianChild Welfare Association.
10
A Look at American Indian Families in Hennepin County Part Two: An In-depth Look at the Community
Youth: Building a Strong Foundation
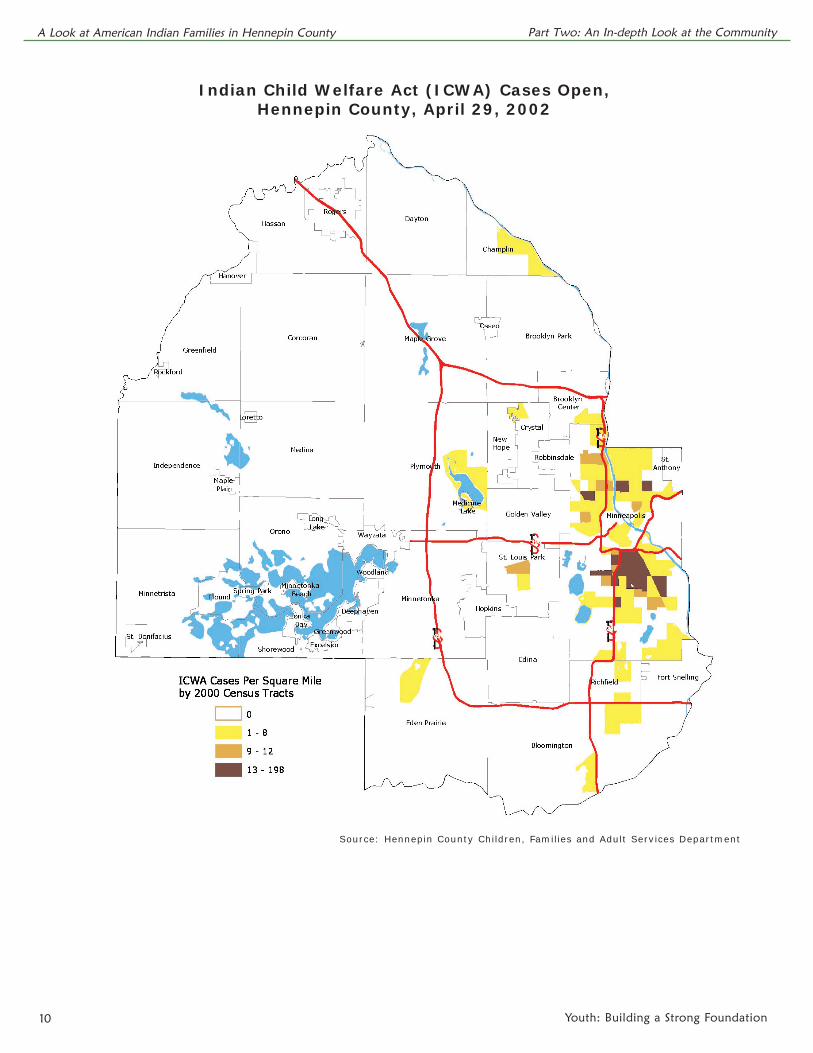
Indian Child Welfare Act (ICWA) Cases Open, Hennepin County, April 29, 2002
Source: Hennepin County Children, Families and Adult Services Department

A Look at American Indian Families in Hennepin County Part Two: An In-depth Look at the Community
11Youth: Building a Strong Foundation
PPee rrmmaanneennccyyPPee rrmmaanneennccyy
The Adoption and Safe Families Act of 1997 (ASFA), P.L. 105-89, mandatesthat state and county welfare systems decrease the length of time a childis in transitional care by:
Considering the health and safety of the child paramount
Concurrently planning for a permanent out-of-home placement atthe same time that efforts are being made to reunify the family
Mandating termination of parental rights (TPR) petitions for childrenwho have been in foster care for a period of 15 of the past 22 months
Requiring a permanency hearing within 12 months of the child’s initialfoster care placement and so forth.6
ASFA does not in any way modify ICWA (Simmons & Trope, 1999).
For children in continuous placement in Hennepin County, the averagetotal length of time in placement before being adopted is decreasing.
As the total number of adoptions has decreased over the past three years,the number of children on the adoption waiting list has increased. Duringthat same time period, even though the total number of adoptionsdecreased, the number of final adoptions of American Indian childrenstayed about the same.
Number of Final Adoptions by Year, Hennepin County, 2000-2003
211159 138
40
3738
0
100
200
300
2000 2001 2002
Year
Tota
l N
um
ber
Other Race American Indian Alone or Plus Another Race(s)
121 141197
3838
46
0
100
200
300
2000 2001 2002
Year
Tota
l N
um
ber
Other Race American Indian Alone or Plus Another Race(s)
Number of Children Waiting to Be Adopted by Year, Hennepin County, 2000-2003
Source: Hennepin County Children, Family and Adult Services Department (for both charts)

12
A Look at American Indian Families in Hennepin County Part Two: An In-depth Look at the Community
Youth: Building a Strong Foundation
CChh ii ll dd SSuuppppoo rr ttCChh ii ll dd SSuuppppoo rr ttAs of December 9, 2003, the Hennepin County Economic AssistanceDepartment had 4,699 American Indian children with 3,158 custodial parents in its child support case files. American Indian children represent6.0 percent of all children involved in these cases.
Almost half of all American Indian children live in single parent households.American Indian single parents with children under the age of 18 are morelikely to live in poverty than single parents from other race or ethnicgroups.7
0
10
20
30
40
50
60
2000 2001 2002
Year
Ave
rage N
um
ber
of
Month
s
American Indian Only American Indian Plus Another Race(s) Other Races
Average Number of Months from Continuous Placement to FinalAdoptions by Year, Hennepin County, 2000-2003
Source: Hennepin County Children, Family and Adult Services Department
PPuubb ll ii cc HHeeaa ll tt hh CCaa rr ee CCoovvee rr aaggee ff oo rr YYoouu tt hhPPuubb ll ii cc HHeeaa ll tt hh CCaa rr ee CCoovvee rr aaggee ff oo rr YYoouu tt hh
Medical Assistance (MA), General Assistance Medical Care (GAMC) and Refugee Medical Assistance (RMA) are public medical assistanceprograms provided by county agencies using state or federal funds.
Children generally receive this kind of medical coverage when their parents are not employed, employed without family health care benefits, or when the child is not in the custody of their parents or familymembers, but instead in the custody of child welfare services.
In December 2002, American Indian youth age 17 and under made up 5percent of the MA, GAMC and RMA youth population.
MA, GAMC and RMA Participant Count Age 0 to 17, Hennepin County, December 2002
Source: Hennepin County Economic Assistance Department
0.7%4.3%
95.0%
American Indian OnlyAmerican Indian Plus Another Race(s)Other

A Look at American Indian Families in Hennepin County Part Two: An In-depth Look at the Community
13Youth: Building a Strong Foundation
It is likely that the numbers of American Indian children in out-of-homeplacement, plus the numbers of American Indian families living in povertyand the numbers of American Indian single parent families has contributedto the overrepresentation of American Indian children in public healthinsurance programs.
TTrruuaannccyyTT rruuaannccyyRegular school attendance is one of the most important factors in assuringthat kids do well in school. But keeping kids in school is also a strategy forpreventing crime. Truancy is widely regarded as a gateway to futuredelinquency and criminal behavior.
The total number of youth participating in the School Support Program hasdecreased from 431 in 2000 to 174 in 2002.8 In addition, the percent ofAmerican Indian youth participating in the program has decreased bymore than half, from 26.2 percent in 2000 to 11.5 percent in 2002.
26.2 18.6 11.5
73.8 81.4 88.5
0
20
40
60
80
100
2000 2001 2002
Year
Perc
ent
American Indian Youth All Other Youth
Youth in the School Support Program,Hennepin County, 2000-2002
Source: Hennepin County Children, Family and Adult Services Department
Tracking school attendance dataand truancy rates for any group ofstudents has proven to be a challenge.There are wide variations in attendancedata collection practices,technological supports and schooldistrict staff responsible for recordingand reporting student attendance. Theissue becomes even more complexwhen students or families do not havean avenue for communicating withschool staff. For instance, students whomiss 15 consecutive school days withoutnotifying the school of the reason fortheir absence are dropped fromattendance rolls. These students are nolonger tracked as absent and, inaddition, they must re-enroll in order tocontinue attending school.Nancy Schaefer, School Success ProjectCoordinator, Hennepin CountyAdministration

14
A Look at American Indian Families in Hennepin County Part Two: An In-depth Look at the Community
Adolescence: Preparing for Success
Ado l e s c en c e : P r epa r i n g f o rAdo l e s c en c e : P r epa r i n g f o rSu c c e s sSu c c e s s(Ages 10 to 17)
HHii gghh SS cchhoooo ll EEdduucc aa tt ii oonnHHii gghh SS cchhoooo ll EEdduucc aa tt ii oonnToday, a high school education is an essential step towards attaining self-sufficiency. An individual with a high school diploma or GED is lesslikely to live in poverty, less likely to be unemployed, more likely to receiveessential benefits, such as health insurance, and more likely to have stableemployment or to receive regular full-time wages. When compared withstudents from other races or ethnic groups, American Indian students have the lowest levels of educational attainment in Hennepin County. This is similar to national trends documented by Goodluck and Willeto(2001). However, the dropout rate for American Indian students inHennepin County is decreasing and more students are either graduatingin four years or continuing their education.
Educational Attainment for American Indian Students by Class,Hennepin County, 1997-2001
Educational Attainment for American Indian Students by Class,Minneapolis, 1997-2001
Source: Minnesota Department of Education (for both charts)
0
20
40
60
80
100
Class of1997
Class of1998
Class of1999
Class of2000
Class of2001
Year
Perc
ent
Graduated in 4 Years Continuing Education Dropped Out
0
20
40
60
80
100
Class of1997
Class of1998
Class of1999
Class of2000
Class of2001
Year
Perc
ent
Graduated in 4 Years Continuing Education Dropped Out
“Global shifts in technology andreduced dependence on manuallabor have left the continuing highnumber of Native American dropoutsin a bind that is increasingly difficult tosurmount. Native teen dropouts are atrisk of not entering the labor force,and if they do obtain jobs, they mostoften enter low-paying service sectoroccupations. They then stand agreater chance of living in poverty and the underclass asthey move from one menial job to thenext without employment stability orregular full-time wages” (Goodluck & Willeto, 2001).

A Look at American Indian Families in Hennepin County Part Two: An In-depth Look at the Community
15
Source: Minnesota Department of Education
Note: The Minnesota Department of Education tracks school completion rates for students who
start 9th grade and continue in the same school through 12th grade by school district.
Educational Attainment for American Indian Students by Class,Suburban Hennepin County, 1997-2000
American Indian high school students in Minneapolis are less likely to graduate than their counterparts in suburban schools. While the graduation rate doubled for Minneapolis American Indian studentsbetween 1997 and 2001, by 2001 it had increased to only 26.8 percent.Suburban Hennepin County American Indian students were much morelikely to graduate in four years. In 2001, 87.8 of American Indian students insuburban schools graduated. Nearly 40 percent of Hennepin CountyAmerican Indian students attended suburban schools in 2001.
TTeeeenn PP rr eeggnnaannccyyTTeeeenn PP rr eeggnnaannccyy
When compared with the overall population of teen girls nationally and inHennepin County, American Indian girls are more likely to become pregnant during their teenage years. Nationally however, AmericanIndian teens that are pregnant are more likely to be married (Goodluckand Willeto, 2001).
Although living in poverty does not directly correlate with teen pregnancy,Goodluck and Willeto (2001) found that living in poverty as a teen was themost powerful factor influencing the likelihood of teen pregnancy forAmerican Indians compared with whites, blacks and Hispanics.
0
100
200
300
400
500
1990
1991
1992
1993
1994
1995
1996
1997
1998
1999
2000
2001
Year
Per
1,0
00
American Indian Total
Teen Pregnancy Rate (Per 1,000 Age 15 to 19),Hennepin County, 1990-2001
Source: Minnesota Department of HealthPrepared by: Hennepin County Community Health Department
Adolescence: Preparing for Success
0
20
40
60
80
100
Class of1997
Class of1998
Class of1999
Class of2000
Class of2001
Year
Perc
ent
Graduated in 4 Years Continuing Education Dropped Out
"Treating the educational needs ofAmerican Indian students as an add-onconcern, to be addressed throughIndian Education and other dedicatedfunds, does not get to the root of theproblem." Dr. Will Antell, Administrator of IndianEducation, Minneapolis Public Schools

16
A Look at American Indian Families in Hennepin County Part Two: An In-depth Look at the Community
Adolescence: Preparing for Success
TTeeeenn PPaa rr eenn tt ss RRee cc ee ii vv ii nngg MMii nnnnee ssoo tt aa FFaammii ll yyTTeeeenn PPaa rr eenn tt ss RRee cc ee ii vv ii nngg MMii nnnnee ssoo tt aa FFaammii ll yyII nnvvee ss ttmmeenn tt PP rroogg rr aamm ((MMFF II PP )) AA ss ss ii ss tt aann cc eeII nnvvee ss ttmmeenn tt PP rroogg rr aamm ((MMFF II PP )) AA ss ss ii ss tt aann cc eeAmerican Indian teens are overrepresented in the teen parent populationreceiving MFIP. Of the 216 minor parents (17 and under) receiving MFIP inDecember 2002, 9.3 percent identified themselves as American Indianonly or American Indian plus another race(s).
Teen Parents Recieving MFIP, Hennepin County, 1990-2001
Source: Hennepin County Economic Assistance Department
TToobbaa cc ccoo ,, AA ll ccoohhoo ll aanndd DDrruugg UUss ee :: TToobbaa cc ccoo ,, AA ll ccoohhoo ll aanndd DDrruugg UUss ee :: AAddoo ll ee ss cc eenn tt CChheemmii cc aa ll HHeeaa ll tt hhAAddoo ll ee ss cc eenn tt CChheemmii cc aa ll HHeeaa ll tt hh
“American Indian youths appear to begin drug use relatively early, havea high prevalence of lifetime use and use certain substances, such asmarijuana, more regularly than other youths” (Kulis, Napoli & Marsiglia,2002).
A recent study found that American Indian “students who had a moreintense sense of ethnic pride adhered more strongly to certain antidrugnorms than those who did not. Whereas American Indian students withbetter grades in school held consistently stronger antidrug norms, therewere few differences by gender, socioeconomic status, or age… Todevelop and strengthen antidrug norms, a good school experience isneeded, a sense of American Indian pride should be nurtured, andbiculturalism needs to be recognized and addressed” (Kulis et al., 2002).
In Hennepin County, American Indian 6th and 9th graders are more likelyto smoke than 6th and 9th graders in the total population. Among theirpeers, they had the highest smoking rates compared with 6th and 9thgraders from other races and ethnicities.
90.7%
9.3%
American Indian Other Race

A Look at American Indian Families in Hennepin County Part Two: An In-depth Look at the Community
17Adolescence: Preparing for Success
Source:Minnesota Student Survey, 2001
Prepared by: Hennepin County Community Health Department
* Data is statistically unreliable. N/A means data is not available.
Adolecent Chemical Health, Hennepin County, 2001
0
20
40
60
80
100
AmericanIndian
TotalPopulation
AmericanIndian
TotalPopulation
AmericanIndian
TotalPopulation
AmericanIndian
TotalPopulation
Currently smoking Currently drinking Binge drinking in 2weeks
Currently usingmarijuana
Perc
ent
6th grade 9th grade 12th grade
* * * *N/A N/A
Adolecent Mental Health, Hennepin County, 2001
0
20
40
60
80
100
AmericanIndian
TotalPopulation
AmericanIndian
TotalPopulation
AmericanIndian
TotalPopulation
AmericanIndian
TotalPopulation
Poor self-esteem Feeling hopeless Ever had thoughts ofsuicide
Ever attempted suicide
Perc
ent
6th grade 9th grade 12th grade
* * * *
Source:Minnesota Student Survey, 2001Prepared by:Hennepin County Community Health Department * Data is statistically unreliable.
AAddoo ll ee ss cc eenn tt MMeenn tt aa ll HHeeaa ll tt hhAAddoo ll ee ss cc eenn tt MMeenn tt aa ll HHeeaa ll tt hh
American Indian youth attending 6th grade in a Hennepin County Publicschool were more likely than 6th graders in the overall population toattempt suicide, or to have suicidal thoughts or feelings of hopelessness.Higher rates of mental health issues among American Indian youth couldhave an influence on their greater school drop out rates and lower four-year high school graduation rates.
"Having been involved with Indianeducation for many years, having beenaway from it for many years, and nowagain being involved, it is clear to methat our children are sociologically andpsychologically different. As a groupthey work together, almost tribally, butyet seem to be prone to depression andother mental health challenges morethan students of other culturalbackgrounds. Such mental healthchallenges affect issues of schoolretention and truancy. It seems to be inthe sixth grade we see these traitsbecoming more apparent, perhapsbecause they are gearing towards self-actualization." Mike Huerth, Principal of AnnishinabeAcademy

18
A Look at American Indian Families in Hennepin County Part Two: An In-depth Look at the Community
Adolescence: Preparing for Success
JJ uuvveenn ii ll ee CC rr iimmeeJJuuvveenn ii ll ee CC rr iimmee
In the early 1990s, American Indians made up 8.5 percent of the totaljuvenile arrests for Part I offenses. By 2002, however, that number haddecreased to 4.1 percent.9
American Indian juveniles account for approximately 5 percent of alljuvenile arrests for Part II offenses. American Indian juveniles areoverrepresented among juvenile arrests in relation to the proportion theymake up in the total juvenile population.
0
5
10
15
20
25
30
1993
1994
1995
1996
1997
1998
1999
2000
2001
2002
Year
Perc
ent
Part I Offenses Part II Offenses
JJ uuvveenn ii ll ee PP rroobbaa tt ii oonnJJuuvveenn ii ll ee PP rroobbaa tt ii oonn
Annual surveys indicate that American Indian juveniles make up between7 percent and 9 percent of the total juvenile probation population inHennepin County. Between 300 and 400 American Indian juveniles areon probation for delinquent behavior in any given year.
Percent of Juvenile Arrests Where the Individual wasAmerican Indian by Offense, Hennepin County,
1993-2002
0
1,000
2,000
3,000
4,000
5,000
1997
1998
1999
2000
2001
2002
Year
Tota
l N
um
ber
Other Race American Indian
Percent of Juvenile Arrests Where the Individual wasAmerican Indian by Offense, Hennepin County,
1993-2002
Source: Annual Probation Survey, Hennepin County Community Corrections Department
Source: Minnesota Bureau of Criminal Apprehension

19
A Look at American Indian Families in Hennepin County Part Two: An In-depth Look at the Community
Adults: Enhancing What We Have Become
Adults : Enhancing What We HaveAdults: Enhancing What We HaveBecomeBecome(Ages 18 and Over)
AAmmee rr ii cc aann II nndd ii aann BBuu ss ii nnee ss ss OOwwnnee rr ssAAmmee rr ii cc aann II nndd ii aann BBuu ss ii nnee ss ss OOwwnnee rr ssThe Minnesota American Indian Chamber of Commerce (MAICC) hasidentified approximately 500 American Indian business owners inMinnesota. Among those business identified by MAICC, thirty-five percentown a business in the metro area and 18.2 percent, or 1-in-5, are locatedin Hennepin County.10
UUnneemmpp ll ooyymmeenn ttUUnneemmpp ll ooyymmeenn ttMany American Indians have struggled to find employment during thepast decade. During the early 1990s, the unemployment rate forAmerican Indians in Hennepin County was close to 20 percent. Thismeans that approximately 1-in-5 American Indians in the labor force werelooking for work, but were unable to find employment.
With the economic expansion of the mid-to-late 1990s, the unemploymentrate for American Indians decreased, reaching 9.1 percent in 2000.However, this figure was still 3.5 times greater than the totalunemployment rate in Hennepin County. Since then, the unemploymentrate among American Indians has once again begun to increase,reaching 14.5 percent in 2002.
The unemployment rate for American Indians follows a similar trend to unemployment overall. However, when unemployment rates increase or decrease within the total population, they increase or decrease at afaster pace in the American Indian community.
Source: Minnesota Department of Employment and Economic Development
0
5
10
15
20
25
30
1990
1991
1992
1993
1994
1995
1996
1997
1998
1999
2000
2001
2002
Year
Perc
ent
Unem
plo
yed
American Indian Total
Unemployment Rate by Year (Annual Average),Hennepin County, 1990-2002
MMiinnnneessoottaa FFaammii ll yy IInnvveess ttmmeenntt PPrrooggrraamm ((MMFFIIPP))MMiinnnneessoottaa FFaammii ll yy IInnvveess ttmmeenntt PPrrooggrraamm ((MMFFIIPP))Between 1993 and 2002 in Hennepin County, the total number of adultsreceiving MFIP to support their families decreased by 26.1 percent. MFIPis a temporary cash and food assistance program for poor families with children that emphasizes work and achieving independence fromgovernment assistance. The number of American Indian adults receivingMFIP decreased by 44.8 percent during this same time period.
"To be successful today, we(American Indians) need the work ethicand discipline of our forefathers ofyesterday. We need to continue toprovide for our own affairs, be it homeownership, business ownership oreconomic development. We must startby re-instilling hope and discipline in ourIndian children.""Famous" Dave Anderson, Founder ofFamous Dave's Restaurant Chain
American Indian Total

A Look at American Indian Families in Hennepin County Part Two: An In-depth Look at the Community
20 Adults: Enhancing What We Have Become
American Indian Owned Businesses Identified by the Minnesota American Indian Chamber of Commerce,
Twin Cities Metro Area, December 2003
Source: Minnesota American Indian Chamber of Commerce; Census 2000
American IndianBusiness Locations

1,502 1,4981,407
1,2591,136 1,075
945813 17 29
0 00
00
00
0
0
200
400
600
800
1,000
1,200
1,400
1,600
1993
1994
1995
1996
1997
1998
1999
2000
2001
2002
YearN
um
ber
of
Indiv
iduals
American Indian plus another race(s)American Indian
A Look at American Indian Families in Hennepin County Part Two: An In-depth Look at the Community
21Adults: Enhancing What We Have Become
Source: Hennepin County Economic Assistance Department
American Indian Adults Age 18 and Older Receiving MFIP or AFDCin the Month of December, Hennepin County, 1993-2002*
*Minnesota Family Investment Program (MFIP) started in 1994. Aid to Families with DependentChildren (AFDC) ended in 1997. The total number of families from 1994 to 1997 is acombination of individuals receiving MFIP and AFDC. For the first time in 2001, MFIP clientswere able to identify themselves as more than one race.
81817
800
JJoobb TT rr aa ii nn ii nnggJJoobb TT rr aa ii nn ii nnggAmerican Indians participate in training and employment programs run byHennepin County and the City of Minneapolis through MFIP, the federalWorkforce Investment Act (WIA) or additional state funded programs. American Indians are overrepresented among training and employmentprogram participants, making up 7.2 percent of the participant populationin 2000 and 6.0 percent in 2002. This decline does not reflect a decrease inthe number of American Indian participants, but rather that the number ofparticipants from other races is increasing at a faster rate. The number ofAmerican Indian participants has increased slightly each year.
Percent of Employment Training Participants Who Are American Indian by Year and Gender,
Hennepin County, 2000-2002
Source: Hennepin County Training and Employment Assistance Department
1.2 1.2 1.4
6.0 5.2 4.6
0
4
8
12
16
20
2000 2001 2002
Year
Perc
ent
American Indian Male American Indian Female
"MFIP does not exist in a vacuum anduntil American Indians are brought to anequal playing field across the boardwith regards to health, education andemployment opportunities, we willcontinue to see disparities in the MFIPprogram." Travis Zimmermann, MFIP Director,American Indian OIC, Minneapolis 29

22
A Look at American Indian Families in Hennepin County Part Two: An In-depth Look at the Community
Adults: Enhancing What We Have Become
Percent of Participant Population by Age, 3-Year Average,Hennepin County, 2000-2002
On average between 2000 and 2002, American Indian women made up80.3 percent of all American Indian training and employment participants.Overall, women on average made up 73.3 percent of the total participantpopulation. Participation rates for American Indians by age follow a similartrend to the total participant population.
American Indian MFIP Tier I training and employment program participantsreceive similar placement wages to participants in the total population.MFIP Tier I participants make up more than half of all Training andEmployment Assistance program participants. In general, however,American Indians tend to be in training and employment programs for alonger period than individuals in the total population.
Source: Hennepin County Training and Employment Assistance Department
Average Placement Wage for MFIP Tier I Employment Training Participants by Year,
Hennepin County, 2000-2002
$9.32 $9.86 $10.19 $10.42$10.09 $10.40
$0.00
$2.00
$4.00
$6.00
$8.00
$10.00
$12.00
$14.00
2000 2001 2002Year
Dolla
r
American Indian Total Population
A recent Minnesota Department of Human Services (DHS) (2003) studyfound that American Indian MFIP participants are below their expectedranges on the DHS Three-Year Self-Support Index and are experiencinglower exit rates from MFIP than other populations. The DHS Self-SupportIndex tracks whether or not adults who have left the program are eitherworking an average of 30 or more hours per week or are no longerreceiving MFIP cash payments. If the participant meets either of thesecriteria, DHS considers them to be a success. The Index excludes thosewho are no longer receiving payments because they have met the 60-month MFIP time limit.
Source: Hennepin County Training and Employment Assistance Department
0
20
40
60
80
100
14-15 16-17 18-21 22-39 40-54 55-64 65+
Age Ranges
Perc
ent
American Indian Total Population

23
A Look at American Indian Families in Hennepin County Part Two: An In-depth Look at the Community
Adults: Enhancing What We Have Become
Training and Employment Assistance (TEA) Vendor Locations by Number of American Indian TEA Clients,
Hennepin County and Minneapolis, 2002
Source: Hennepin County Training and Employment Assistance Department; Census 2000

12,414
Other Races American Indian
A Look at American Indian Families in Hennepin County Part Two: An In-depth Look at the Community
24
Source: Hennepin County Economic Assistance Department
Emergency Assistance (EA) and EmergencyGeneral Assistance (AGE) Unduplicated Cases,
Hennepin County, 2002
EEmmee rr ggeennccyy AA ss ss ii ss tt aann cc eeEEmmee rr ggeennccyy AA ss ss ii ss tt aann cc ee
Emergency Assistance (EA) is a federally funded-economic assistanceprogram administered by the county. Individuals who qualify for this programare in an emergency situation, have no other funds or resources to handlethe emergency and have a child in the home under the age of 18.
Emergency General Assistance (EGA) is a state-funded economic assistanceprogram administered by the county. EGA can be used by anyone foremergency services who is not receiving MFIP, provided they meet thequalifications of the program.
American Indians made up 5.2 percent of all EA and EGA cases in 2002.
Adults: Enhancing What We Have Become
FFoooodd SS uuppppoo rr tt (( FFoo rrmmee rr ll yy FFoooodd SS tt aammppss ))FFoooodd SS uuppppoo rr tt (( FFoo rrmmee rr ll yy FFoooodd SS tt aammppss ))Individuals can receive Food Support independent of their participation ineconomic assistance or other programs such as MFIP. Food Support isawarded based on overall household income and earnings.
In December 2002, American Indians made up 4.6 percent of all Food Support cases in Hennepin County. Almost 1,000 American Indian adultswere receiving Food Support to feed themselves or their families. The average number of people in an American Indian household who werereceiving Food Support was 1.3 individuals.
Food Support Cases, Hennepin County, December 2002
Source: Hennepin County Economic Assistance Department
681
95.4%
4.4% 0.2%
American Indian AloneAmerican Indian Plus Another Race(s)Other

A Look at American Indian Families in Hennepin County Part Two: An In-depth Look at the Community
25Adults: Enhancing What We Have Become
FFaammii ll ii ee ss LL ii vv ii nngg ii nn EEmmee rr ggeennccyy SS hhee ll tt ee rr ssFFaammii ll ii ee ss LL ii vv ii nngg ii nn EEmmee rr ggeennccyy SS hhee ll tt ee rr ssOut of 1,099 families, including single pregnant women with no otherchildren, who received emergency shelter from People Serving People in2002, 78 — or 7.1 percent — identified themselves as American Indian onlyor American Indian plus another race(s).
Percent of Families in Emergency Shelter that are American Indian, Hennepin County,
2002*
92.9%
7.1%
American Indian FamiliesOther Race/Ethnicity Families
Source: Hennepin County Economic Assistance Department
* Families are only identified as American Indian if the householder isAmerican Indian. The number of families in emergency shelter inHennepin County does not include those in battered women’s shelters.
HHoommee ll ee ss ss nnee ss ssHHoommee ll ee ss ss nnee ss ssHomelessness is a vicious cycle. It generally results when an individual isunable to meet their basic needs such as finding a stable job with sufficientincome, being free from chemical dependency, and having affordablehousing. However, once a person is homeless, being homeless limits theirability to find a stable job, to secure housing, to maintain their health andso forth.
American Indians are overrepresented in the homeless population inHennepin County. According to a study completed by the WilderResearch Center (2000), American Indians made up 7.6 percent of allpeople in the seven county metro area living in emergency shelters,battered women’s shelters, transitional housing or on the street. Amongthose living on the street, 26.8 percent were American Indian.
7.1%
"Homelessness is a condition that grewfrom the failed social experiment offederal assimilation. The NativeAmerican Housing Assistance and SelfDetermination Act (NAHASDA) -- theprimary United States Housing and UrbanDevelopment (HUD) resource for tribes --fails to include provisions to addresshomelessness. Lacking tribal innovation inaddressing the issue, urban areascontinue to be ill prepared in the arenasof advocacy, policy and programdevelopment relating to our homeless." Tony LookingElk, President, The UrbanCoalition

26
A Look at American Indian Families in Hennepin County Part Two: An In-depth Look at the Community
Adults: Enhancing What We Have Become
Adult Chemical Health (18 and Over), SHAPE Survey, Hennepin County, 2002
Source: Hennepin County Community Health Department
* Difference between the two groups is statistically significant.
38.6
25.018.5 16.3
0
20
40
60
80
100
Currently Smoke* Binge Drink
Perc
ent
American Indian Total Population
Adult Mental Health (18 and Over),SHAPE Survey, Hennepin County, 2002
23.6 20.513.812.2 7.5 5.5
0
20
40
60
80
100
Having had depression Having had ananxiety/panic attack*
Having frequentmental distress
Perc
ent
American Indian Total Population
Source: Hennepin County Community Health Department* Difference between the two groups is statistically significant.
MMeenn tt aa ll HHeeaa ll tt hhMMeenn tt aa ll HHeeaa ll tt hhCertain mental health issues seem to be more prevalent in the AmericanIndian community (Hennepin County Community Health Department andBloomington Division of Public Health, 2003). For example, AmericanIndian adults are more likely to have had an anxiety or panic attack thanindividuals in the total adult population.
CChheemmii cc aa ll HHeeaa ll tt hhCChheemmii cc aa ll HHeeaa ll tt hh
American Indian adults are more likely to smoke cigarettes than adults inthe population overall in Hennepin County (Hennepin County CommunityHealth Department and Bloomington Division of Public Health, 2003).
Have Have Have had

A Look at American Indian Families in Hennepin County Part Two: An In-depth Look at the Community
27Adults: Enhancing What We Have Become
DD ii aabbee tt ee ss aanndd OObbee ss ii tt yyDD ii aabbee tt ee ss aanndd OObbee ss ii tt yyDiabetes and its complications are major contributors to morbidity andmortality rates in the American Indian community (Gohdes, 1995).American Indian adults were more than three times more likely to say thata doctor or other health professional had told them that they had diabetesthan individuals in the total adult population (Hennepin County CommunityHealth Department and Bloomington Division of Public Health, 2003).
Percent of the Adult Population with Diabetes,* Hennepin County, SHAPE 2002
17.6
4.9
0
20
40
60
80
100
American Indian Total Population
Perc
ent
Source: Hennepin County Community Health Department* Difference between the two groups is statistically significant.
Adult Weight,* Hennepin County, SHAPE 2002
32.4
2.6
45.834.837.2
29.0
1.4
16.8
0
20
40
60
80
100
Underweight Normal Overweight Obese**
Perc
ent
American Indian Total Population
Source: Hennepin County Community Health Department
* Adult weight status is calculated using the Body Mass Index (BMI) calculation. For moreinformation about how to calculate the BMI, see the SHAPE 2002 Race and Ethnic Data Book.
** Difference between the two groups is statistically significant.
In addition, American Indians report higher rates of obesity than the totalpopulation, which can also have negative health consequences.
AAcc cc ee ss ss tt oo HHeeaa ll tt hh CCaa rr eeAAcc cc ee ss ss tt oo HHeeaa ll tt hh CCaa rr eeAmerican Indian adults are less likely to go to a doctor’s office or a clinicwhen they are sick or in need of advice about their health than adults inthe total population. When American Indian adults were asked wherethey go when they are sick or in need of advice about their health, agreater percent said that they go to a hospital outpatient department,hospital emergency room or some other place than adults in the totalpopulation (Hennepin County Community Health Department andBloomington Division of Public Health, 2003).

28
A Look at American Indian Families in Hennepin County Part Two: An In-depth Look at the Community
Adults: Enhancing What We Have Become
Where Adults Go When They Are Sick or for Health Advice, Hennepin County, SHAPE 2002
Source: Hennepin County Community Health Department* Difference between the two groups is statistically significant.
Going to a hospital outpatient department or hospital emergency roomwhen one is sick is more costly than visiting a clinic or public health center.In addition, if families don’t have sufficient income or health insurance topay their medical bills, hospitals and local governments end up coveringthe cost of their care.
Among American Indian adults who needed medical care during thepast 12 months, 25.5 percent reported delaying or not getting the carethey thought they needed, compared with just 13.3 percent of the totalpopulation (Hennepin County Community Health Department andBloomington Division of Public Health, 2003). American Indians are morelikely to delay, or go without, needed medical care than any other raceor ethnic group. In addition, about 1-in-5 American Indian adults (22.4percent) reported that it is extremely difficult for them to pay for theirprescription medications each month, compared with approximately 1-in-20 adults in the total population.
HHeennnneepp ii nn CCoouunn tt yy MMeedd ii cc aa ll CCeenn tt ee rr ((HHCCMMCC))HHeennnneepp ii nn CCoouunn tt yy MMeedd ii cc aa ll CCeenn tt ee rr ((HHCCMMCC))MMeedd ii cc aa ll SS yy ss tt eemmMMeedd ii cc aa ll SS yy ss tt eemm
When faced with health concerns, many members of Hennepin County’sAmerican Indian community use medical services at The HennepinCounty Medical Center (HCMC) Emergency Room, Hospital and Clinics.11
Between November 2002 and October 2003, 6,601 American Indianindividuals were patients with HCMC Medical System providers.
American Indians accounted for 4.8 percent of all inpatient staysbetween November 2002 and October 2003. During this time period, 888American Indian individuals were inpatients at HCMC for a total of 1,172stays. The average length of stay for an American Indian inpatient was 4.5days, compared with 4.9 days for the total inpatient population.
16.8
6.7
3.1 6.5
3.1
85.1
1.6
1.7 6.5
2.7
2.5
63.9
0
20
40
60
80
100
Doctor'soffice clinic,
publichealthclinic,
communityhealth
center*
Hospitaloutpatient
department
Hospitalemergency
room
Urgent carecenter
Some otherkind ofplace
No usualplace
Perc
ent
American Indian Total Population

A Look at American Indian Families in Hennepin County Part Two: An In-depth Look at the Community
29
Health Insurance Coverage for American Indian Patients by Type,by Total American Indian Visits to HCMC Medical System,
November 2002 - October 2003
Source: Hennepin County Medical Center
Inpatients
80.7%
10.7%
8.6%
Approximately two-thirds of all inpatient stays made by American Indianswere paid for by a public health insurance program such as MedicalAssistance (MA), General Assistance Medical Care (GAMC), Medicare,Minnesota Senior Health Option (MNSHO) or MinnesotaCare. A third of allAmerican Indian inpatients had private or other health insurance and 2percent did not have health insurance at all.
Between November 2002 and October 2003, 6,601 American Indianindividuals used outpatient medical services at HCMC and its clinics a totalof 23,411 times. Public health insurance programs paid for 4-out-of-5 ofthese outpatient visits, and 10.7 percent of American Indian outpatientsdid not have any health insurance.
PPuubb ll ii cc HHeeaa ll tt hh CCaa rr ee CCoovvee rr aaggee ff oo rr AAdduu ll tt ssPPuubb ll ii cc HHeeaa ll tt hh CCaa rr ee CCoovvee rr aaggee ff oo rr AAdduu ll tt ssAmerican Indian adults age 21 to 64 make up almost 5 percent of allMedical Assistance (MA), General Assistance Medical Care (GAMC), andRefugee Medical Assistance (RMA) participants. As the MA, GAMC andRMA population ages, American Indians make up less of the population.
Source: Hennepin County Economic Assistance Department
5.7 4.91.3
0
10
20
30
40
50
18 to 20 21 to 64 65 and over
Age
Perc
ent
Percent American Indian
Percent of Total MA, GAMC and RMA Population who are American Indian by Age,
Hennepin County, December 2002
Adults: Enhancing What We Have Become
Outpatients
64.6%
33.1%
2.3%
Public Program Health Insurance Without Health Insurance Other

30
A Look at American Indian Families in Hennepin County Part Two: An In-depth Look at the Community
Adults: Enhancing What We Have Become
AAdduu ll tt CC rr iimmeeAAdduu ll tt CC rr iimmeeOn average, American Indian adults make up about 5.6 percent of allarrests for Part I Offenses and 4.8 percent of all arrests for Part II Offenses.12
Source: Minnesota Bureau of Criminal Apprehension
Source: Hennepin County Adult Detention Center
0
5
10
15
20
25
30
1993
1994
1995
1996
1997
1998
1999
2000
2001
2002
Year
Perc
ent
Part I Offenses Part II Offenses
Percent of Adult Arrests Where the Individual was American Indian by Offense,
Hennepin County, 1993-2002
Percent of Adult Population, Age 18 and Over, Booked in Hennepin County Jail
by Race/Ethnicity, 2000
AAdduu ll tt ss BBooookkeedd ii nn JJ aa ii llAAdduu ll tt ss BBooookkeedd ii nn JJ aa ii llIn proportion to their numbers in the total population, more AmericanIndian adults were booked in the Hennepin County Adult Detention Centerthan adults from any other race or ethnicity in 2000. Being booked in theAdult Detention Center means that an individual has been arrested, buthas not yet been sentenced by the court for this particular offense.Approximately 12 percent of all American Indian adults in HennepinCounty, 1,205 individuals, were booked in 2000.
0.6
11.5 11.8
1.0
3.6
-2468
101214161820
Asian AfricanAmerican
AmericanIndian
White Latino
Perc
ent

A Look at American Indian Families in Hennepin County Part Two: An In-depth Look at the Community
31Adults: Enhancing What We Have Become
AAdduu ll tt PP rroobbaa tt ii oonnAAdduu ll tt PP rroobbaa tt ii oonnOn average, American Indian adults make up 3 percent of the total adultprobation population in Hennepin County. In context, 0.8 percent of alladults age 18 and over in Hennepin County identified themselves asAmerican Indian alone on the 2000 U.S. Census.
Total Number of Adult Probationers on December 31, Hennepin County, 1997-2002
NNuummbbee rr oo ff DDeeaa tt hh ssNNuummbbee rr oo ff DDeeaa tt hh ssAccording to the Minnesota Department of Health, approximately 80American Indians of various ages die each year in Hennepin County.
Source: Hennepin County Community Corrections Department
Source: Minnesota Department of Health
Number of American Indian Deaths by Year and Age, Hennepin County, 1989-2001
0
5,000
10,000
15,000
20,000
25,000
30,000
35,000
1997
1998
1999
2000
2001
2002
Year
Tota
l
Other American Indian
Year
The death rate for American Indians is greatly underestimated becauseAmerican Indians are often misclassified as white or another race ondeath certificates. Nationally in 2000, the death rate for American Indianswas 466.4 per 100,000 (512.8 for men and 421.0 for women). This is lowerthan the 873.1 per 100,000 (874.7 for men and 871.6 for women) deathrate for the U.S. population overall (Miniño, Arias, Kochanek, Murphy &Smith, 2002).
0
20
40
60
80
100
120
1989
1990
1991
1992
1993
1994
1995
1996
1997
1998
1999
2000
2001
Year
Num
ber
of
Death
s
0 to 4 5 to 19 20 to 39 40 to 59 60 plus

A Look at American Indian Families in Hennepin County Part Two: An In-depth Look at the Community
Adults: Enhancing What We Have Become
LL eeaadd ii nngg CCaauu ss ee oo ff DDeeaa tt hhLLeeaadd ii nngg CCaauu ss ee oo ff DDeeaa tt hh
In Hennepin County, the leading causes of death for American Indiansinclude heart disease, cancer and unintended injuries.13
According to Baldridge, “Indian elders suffer poorer overall health thanany comparable population in America…Indians are 4.6 times more likely than whites to die of alcoholism, 4.2 times more likely to die oftuberculosis, 1.6 times more likely to die of diabetes, and .51 times more likely to die of pneumonia” (2001).
Nationally, the five leading causes of death for American Indian eldersage 55 to 64 relate, directly or indirectly, to behavioral health:
Diabetes is closely associated with heart disease, the leading cause ofdeath.Malignant neoplasm (cancer) can be linked, to some extent, to highrates of smoking among American Indian people.Diabetes mellitus is increasing to epidemic proportions amongAmerican Indians.Accidents, with a strong relationship to drinking, are the fourth leadingcause of death.Chronic liver disease and cirrhosis are related to alcohol abuse(Baldridge, 2001).
Leading Causes of Death for American Indiansby Gender, Age-Adjusted Death Rates per 100,000,
Hennepin County, 1990-1999
Age-
Adju
sted
Dea
th R
ate
per
100,0
00
Source: Minnesota Department of HealthPrepared by: Hennepin County Community Health Department
410
145
241273272 255
184 171
9447
7226
0
100
200
300
400
500
AmericanIndian Males
All HennepinCounty Males
AmericanIndian Females
All HennepinCounty Females
Heart Disease Cancer Unintended Injuries
32
DD ii ss cc rr iimmii nnaa tt ii oonnDD ii ss cc rr iimmii nnaa tt ii oonnAmerican Indian adults are more likely to feel discriminated against whendealing with the police than their white counterparts or adults in theoverall population (Hennepin County Community Health Departmentand Bloomington Division of Public Health, 2003).
They are also more likely than their white counterparts and the total populationto attribute discrimination to race, color, ethnicity, or country of origin whenexperiencing discrimination while applying for employment or working onthe job, getting medical care, finding housing, applying for social servicesor public assistance, dealing with the police, or in any other setting.

A Look at American Indian Families in Hennepin County Part Two: An In-depth Look at the Community
33Adults: Enhancing What We Have Become
"How important is it to you to pass along your cultural heritage or the traditions of your ancestors to the next
generation?", Hennepin County, SHAPE 2002
2.4 0.610.6 10.4
72.1
24.8
38.7 40.3
0
20
40
60
80
100
Very Important SomewhatImportant
SomewhatUnimportant
Unimportant
Level of Importance
Perc
ent
American Indian Total Population
* * * *
Source: Hennepin County Community Health Department
*Difference between two groups is statistically significant
PPaa ss ss ii nngg oonn TT rr aadd ii tt ii oonn ss aanndd CCuu ll tt uu rr aa ll VVaa ll uuee ssPPaa ss ss ii nngg oonn TT rr aadd ii tt ii oonn ss aanndd CCuu ll tt uu rr aa ll VVaa ll uuee ssAmerican Indian adults believe that it is very important to pass along theircultural heritage or the traditions of their ancestors to the next generation(Hennepin County Community Health Department and BloomingtonDivision of Public Health, 2003).

A Look at American Indian Families in Hennepin County Part Two: An In-depth Look at the Community
34 Elders: A Time of Reflection, Leadership and Continued Learning
Elders: A Time of Reflection,Elders: A Time of Reflection,Leadership and Continued LearningLeadership and Continued Learning(Self Defined)
Not much data exists about Hennepin County’s American Indian elders.
Some national research has examined living conditions for urbanAmerican Indian elders and American Indian elders in general. “NICOA’s1996 publication The NICOA Report: Health and Long-Term Care for IndianElders reports that urban elders enjoy greater income and somewhatbetter health status than their reservation counterparts … female Indianelders (because they are much less likely to be married than male eldersand three times more likely to be widowed) are at a higher risk of socialisolation and economic hardship with related health consequences asthey age” (Baldridge, 2001).
It would be beneficial for the community and local organizations tounderstand more about American Indian elders as they reflect thestrength of the community, and have many valuable lessons andexperiences to share with younger generations.

35
A Look at American Indian Families in Hennepin County Part Two: An In-depth Look at the Community
Conclusion
Conc l u s i onConc l u s i onAlthough the American Indian community has experienced someimprovements over the past decade, much still needs to be done toaddress the disparate conditions of well-being that many AmericanIndian people experience. Together, with shared energy, resources andunderstanding, the challenges facing American Indian families inHennepin County can be greatly diminished, if not eliminated.
The quality of life American Indians experience is a shared responsibilitybetween individuals, families, communities and stakeholders.Understanding the relationship between the disparities and successesincreases the understanding and desire for shared solutions. All families inHennepin County are directly, or indirectly, affected by the well-being ofAmerican Indians.
American Indians reside and participate in all areas of the county.American Indian children are in schools. American Indian parents dropthere kids off at daycares. American Indian families live in theneighborhoods. American Indian parents want more quality time withtheir families. All families deserve the same level of access andopportunity for well-being and sufficiency in Hennepin County.
The American Indian Families Project is committed to finding strength-based solutions to the challenges facing Hennepin County’s AmericanIndian families.

A Look at American Indian Families in Hennepin County Part Two: An In-depth Look at the Community
36 Question to Consider
Que s t i on s t o Con s i d e rQue s t i on s t o Con s i d e rBBeegg ii nnnn ii nngg LL ii ff ee :: AA HHeeaa ll tt hhyy SS tt aa rr ttBBeegg ii nnnn ii nngg LL ii ff ee :: AA HHeeaa ll tt hhyy SS tt aa rr tt
How are American Indian women preparing for pregnancy and thebirth of a child? If American Indian women are not receiving formal prenatal care froma doctor, are they receiving prenatal care through other means? Do American Indian women encounter barriers when seeking prenatalcare? If so, what are they?How does the community support American Indian women who arepregnant? How do families support them?
YYoouu tt hh :: BBuu ii ll dd ii nngg aa SS tt rr oonngg FFoouunnddaa tt ii oonnYYoouu tt hh :: BBuu ii ll dd ii nngg aa SS tt rr oonngg FFoouunnddaa tt ii oonnHow can the community, non-Indian agencies and other stakeholderswork in partnership to reduce disparities for American Indian childrendetermined to be abused and neglected?Is there an understanding of the American Indian community and itsvalues as they relate to child rearing within non-Indian agencies? Howdoes this understanding, or lack of it, affect the way in which theseagencies work with American Indian families and the larger community?How can the community help non-Indian agencies to better understandAmerican Indians? What happens to American Indian children in out-of-home placementthat do not qualify for ICWA status?What efforts are underway to accurately track truancy rates? What are some of the strategies that could be used to reduce truancyand keep American Indian youth in school?
AAddoo ll ee ss cc eenn cc ee :: PP rr eeppaa rr ii nngg ff oo rr SS uu cc cc ee ss ssAAddoo ll ee ss cc eenn cc ee :: PP rr eeppaa rr ii nngg ff oo rr SS uu cc cc ee ss ssMany American Indian students do not finish high school or do notgraduate within four years. What strategies could be used to engageAmerican Indian students in education and planning for their futuresuccess?How is the educational experience different for American Indian studentsthan students from other races and ethnicities and students in thegeneral population?How can families communicate with American Indian youth about theimportance of a high school education?In what ways can families support and encourage youth working toobtain a high school diploma?What can we learn from Minneapolis and suburban Hennepin CountyAmerican Indian students who are graduating from high school? How can we use this information to help other American Indian studentsobtain a high school diploma?What factors influence the likelihood that American Indian teen girlswill become pregnant? How does the urban Indian community view teen pregnancy? How are teen parents currently supported? What effective preventionopportunities exist?What is the role of tobacco in American Indian cultures? What can the community do to reduce smoking rates amongAmerican Indian teens?What opportunities exist for adolescent American Indians to exploreand learn about themselves, their families and their cultures? Who issupporting them? Who or what is hindering their development?

37
A Look at American Indian Families in Hennepin County Part Two: An In-depth Look at the Community
AAdduu ll tt ss :: EEnnhhaanncc ii nngg WWhhaa tt WWee HHaavvee BBee ccoommeeAAdduu ll tt ss :: EEnnhhaanncc ii nngg WWhhaa tt WWee HHaavvee BBee ccoommeeHow do high unemployment rates within the American Indian community affect families? MFIP? Hennepin County residents overall?How do American Indian families who live in poverty and do notreceive MFIP support themselves? What are the causes of homelessness within the Hennepin CountyAmerican Indian community? How can the community and its partnerswork to reduce homelessness among American Indians? How can American Indian families be better prepared to faceemergency situations? How does access to health care and appropriate medical coverageaffect individual, family and community well-being? Are American Indian families using health care services proactively orreactively?How can access to health care coverage be improved for AmericanIndian families?How can we encourage American Indian families to use preventativehealth care, thereby reducing the risk of disease and sickness, as wellas decreasing the use of high-cost health care? What should be done to improve the mental and physical health ofAmerican Indian families? How can the community and its partnerssupport these efforts? What opportunities and resources exist for American Indian families toaddress their health concerns?What are the primary reasons for incarceration among AmericanIndian adults? How does the incarceration rate for American Indians affect AmericanIndian families? Youth? The community?How are American Indian families passing on traditions and culturalvalues? How are American Indian agencies reflecting and supporting traditionsand cultural values through their service delivery?
EE ll ddee rr ss :: AA TT iimmee oo ff RRee ff ll ee cc tt ii oonn ,, LL eeaaddee rr ss hh ii pp aannddEE ll ddee rr ss :: AA TT iimmee oo ff RRee ff ll ee cc tt ii oonn ,, LL eeaaddee rr ss hh ii pp aannddCCoonn tt ii nnuueedd LL eeaa rr nn ii nnggCCoonn tt ii nnuueedd LL eeaa rr nn ii nngg
How is the American Indian community supporting and engagingAmerican Indian elders? How are American Indian elders supporting American Indian families? What opportunities exist for multi-generational sharing and learning?
What can be done to increase data collection and knowledge ofAmerican Indian Elders?
Question to Consider

A Look at American Indian Families in Hennepin County Part Two: An In-depth Look at the Community
38 Endnotes
E ndno t e sEndno te s1. Life expectancy is defined as the average number of years a newborn ina particular area or population can be expected to live if it experiences the current age-specific mortality rates of that particular areaor population throughout its life. It is not a predictor of how long babiesborn will survive, but it is a useful and easily understood summary measureof the current mortality experience of the overall population.
2. The actual life expectancy rate for American Indians was 73.2 years from1994-1996, however the Indian Health Service Department calculates anadjusted rate to compensate for race miscoding on death certificates.American Indians are frequently miscategorized by race on deathcertificates. The adjusted rate was 71.1 years.
3. Indian Health Service Areas included in this report are Aberdeen, Alaska,Albuquerque, Bemidji, California, Nashville, Navajo, Oklahoma City,Phoenix, Portland and Tucson.
4. ICWA status is dependent on counties contacting tribes and tribes confirming the status of the child. When a child is in a short placement(seven days or less) there might not be enough time for this interactionbetween the county and the tribe to take place before the placementends and, therefore, some children who are ICWA eligible will not beidentified with ICWA status.
5. Still in placement means that as of November 2003 the child was still in anout-of-home placement and therefore, the total number of days cannot be calculated.
6. Under Minn. Stat. Sec. 260C.201, subd. 11, a permanency hearing mustbe held within 12 months of initial placement for all children. For childrenless than 8 years old, Minn. Stat. Sec. 260C.201, subd.11a requires apermanency hearing within 6 months. These requirements are more stringent than ASFA.
7. See A Look at American Indian Families in Hennepin County: Part One.Forty-two percent of American Indian female single parent families withchildren under 18 live in poverty and 32.5 percent of American Indian malesingle parent families with children under 18 live in poverty.
8. The School Support Program is part of the Hennepin County TruancyCollaborative, which consists of the County Attorney’s Office, JuvenileProbation and Children, Family and Adult Services. The goal of theCollaborative is to reduce truancy and educational neglect by providingeffective and timely interventions to children and families with chronicattendance problems in the least intrusive manner possible. The SchoolSupport Program deals with truant children of all ages and their familiesthroughout Hennepin County.
The School Support Program has primary responsibility for providing services to children under the age of 12 and their families with chronicattendance problems. These children come to the attention of CFASD as aresult of a report of maltreatment or educational neglect. Educational neglect is one of the forms of maltreatment covered in the Minnesotastatutes that deal with child protection reporting.

39
A Look at American Indian Families in Hennepin County Part Two: An In-depth Look at the Community
Endnotes
The School Support Program also provides services to older children whoare truant due, in part, to mental health issues. One of the goals of theCollaborative is to divert children, who would be better served in otherways, from Juvenile Court. In most cases, mental health issues are bestdealt with outside of the courtroom.
9. Part I Offenses include murder/non-negligent manslaughter, negligent manslaughter, rape, robbery, aggravated assault, burglary,larceny, motor vehicle theft and arson. Part II Offenses include otherassault, forgery/counterfeiting, fraud, embezzlement, stolen property,vandalism, weapons, prostitution, other sex offenses, narcotics, gambling,family/children, D.U.I., liquor laws, disorderly conduct, vagrancy and other(except traffic).
10. These percents are based on American Indian businesses in Minnesotawith available address data. For this analysis, 418 businesses with addresseswere identified.
11. The following analysis is limited to HCMC Medical Services. AmericanIndians who use other private hospital services are not represented here.
12. Part I Offenses include murder/non-negligent manslaughter, negligent manslaughter, rape, robbery, aggravated assault, burglary,larceny, motor vehicle theft and arson. Part II Offenses include otherassault, forgery/counterfeiting, fraud, embezzlement, stolen property, vandalism, weapons, prostitution, other sex offenses, narcotics, gambling,family/children, D.U.I., liquor laws, disorderly conduct, vagrancy and other(except traffic).
13. Age adjustment is used to compare risks for two or more populationsat one point in time, or one population at two or more points in time. Age-adjusted rates should be viewed as relative indexes rather than actualmeasures of risk. In order to eliminate differences in observed rates thatresult from age differences in population composition, age-adjusted ratesare computed by applying age-specific rates in a population of interestto a standardized age distribution.

A Look at American Indian Families in Hennepin County Part Two: An In-depth Look at the Community
40 Sources
S ou r c e sSou r c e sAmherst H. Wilder Foundation. (2000). Homeless Adults, Children andYouth in Minnesota – Statewide Survey Data Tables. St. Paul, MN:http://www.wilder.org/research/topics/homeless/index.html.
Baldridge, D. (2001). Indian elders: Family traditions in crisis. AmericanBehavioral Scientist, 44, (9), 1515-1527.
Brown, E. F., Limb, G. E., Munoz, R., & Clifford, C. A. (2001). Title IV-B Childand Family Service Plans: An evaluation of specific measures taken bystates to comply with the Indian Child Welfare Act. Seattle, WA: CaseyFamily Programs.
Brzuzy, S., Stromwall, L., Sharp, P., Wilson, R., Segal, E. (2000). Thevulnerability of American Indian women in the new welfare state. Affilia,15, (2), 193-203.
Currie, J., & Neidell, M. (2003). Getting inside the “black box” of HeadStart quality: What matters and what doesn’t? (Working Paper No.w10091). Cambridge, MA: National Bureau of Economic Research (NBER).
Gohdes, D. (1995). Diabetes in North American Indians and AlaskaNatives. In: Diabetes in America (2nd Edition), National Institutes of Health,National Institute of Diabetes and Digestive and Kidney Diseases, NIHPublication No. 95-1468, pp 683-701.
Goodluck, C. T. & Willeto, A. A. A. (2001). Native American kids 2001:Indian children’s well-being indicators data book. Seattle, WA: CaseyFamily Programs and Flagstaff, AZ: Northern Arizona University.
Hennepin County Community Health Department and BloomingtonDivision of Public Health. (2003). SHAPE 2002: Racial and ethnic databook, survey of the health of adults, the population and the environment.Minneapolis, MN.
Kulis, S., Napoli, M., & Marsiglia, F. F. (2002). Ethnic pride, biculturalism, anddrug use norms of urban American Indian adolescents. Social WorkResearch, 26, (2), 101-112.
Miniño, A. M., Arias, E., Kochanek, K. D., Murphy, S. L., & Smith, B. L. (2002).Deaths: Final data for 2000. National Vital Statistics Reports, 50, (15), p. 20& 109.
Minnesota Department of Health. (2001). Minnesota Student Survey. St.Paul, MN.
Minnesota Department of Human Services. (2003). Measuring MinnesotaFamily Investment Program Performance for Racial/Ethnic and ImmigrantGroups, Study Brief #7. St. Paul, MN.
Rolnick, A., & Grunewald, R. (2003). Early childhood development:Economic development with a high public return. Fedgazette:Minneapolis, MN.
Simmons, D., & Trope, J. (1999). P.L. 105-89 Adoption and Safe Families Actof 1997: Issues for tribes and states serving Indian children. Portland, OR:National Indian Child Welfare Association.
The Annie E. Casey Foundation. (2002). Kids count data book: Stateprofiles of child well-being. Baltimore, MD.
U.S. Census Bureau. (2000). Census 2000 data tables. Washington D.C.:http://www.census.gov/main/www/cen2000.html.
U.S. Department of Health and Human Services. (1999). Trends in Indianhealth 1998 – 1999. Washington D.C.

Hennepin County Office of Planning & DevelopmentGovernment Center A-2308300 Sixth Street SouthMinneapolis, MN 55487-0238
Hennepin County Board of CommissionersMike Opat, 1st DistrictMark Stenglein, 2nd DistrictGail Dorfman, 3rd DistrictPeter McLaughlin, 4th DistrictRandy Johnson, 5th District, ChairLinda Koblick, 6th DistrictPenny Steele, 7th District
County AdministrationSandra L. Vargas, County AdministratorRichard P. Johnson, Deputy County Administrator
Office of Planning & DevelopmentCheri Merritt, ManagerPaul Buschmann, Principal Planning Analyst Kelly Clausen, Senior Information WriterNichelle Decora, Office Specialist IIIMisty Lee Heggeness, Principal Planning AnalystJustin Kii Huenemann, American Indian Community CatalystRebeca Mueller, Production


![CODEN [USA]: IAJPBB ISSN: 2349-7750 INNDDOO AAMMEERRIICCAANN JJOOUURRNNAALL …d.researchbib.com/f/1nnJSdpUZhL29gY3OxMv9dqJk5ZwNkAl80Zl... · OD,Syp.Potassium chloride, Nebulization:](https://img.pdfslide.net/doc/110x75/5e87b94e62a0b6562665e4a5/coden-usa-iajpbb-issn-2349-7750-innddoo-aammeerriiccaann-jjoouurrnnaall-d-odsyppotassium.jpg)