Embed Size (px)
Citation preview
A Look At The Unidentified Half of Netflow (With an Additional Tutorial On How to Use The Internet2 Netflow Data Archives)
ESCC/Internet2 Joint Techs WorkshopUniversity of Hawaii, January 20-24, 2008
Joe St Sauver, Ph.D. ([email protected] or [email protected])
Internet2 Security Programs Manager
Internet2 and the University of Oregon
http://www.uoregon.edu/~joe/missing-half/Notes: All opinions expressed in this talk are strictly those of the author. These
slides are provided in detailed format for ease of indexing, for the convenience of those who can't attend today's session in person, and to insure accessibility for both
the hearing impaired and for those for whom English is a secondary language.
2
You Should Know Your Network Traffic• When thinking about network security, an exhortation you'll
commonly hear is to "know your network traffic." After all…-- if you don't know what your normal "baseline" traffic looks like, you're going to be hard pressed to identify suspicious traffic patterns, right?-- you'll need to understand your network traffic patterns if you're ever required to deploy a perimeter firewall, and-- you'll need to measure your network traffic if you want to do network capacity planning
• Just as you need a feel for your local and regional traffic, the I2 community should strive to understand the traffic on the national backbone. New programs such as the Commercial Peering Service and the FCC Rural Health Care initiative may make this all the more important.

3
What Is Netflow?• Netflow is an open (but proprietary) Cisco protocol, but that term
is used commonly to refer to any/all flow based analyses, including network flow data collected from non-Cisco routers, flow data gleaned from passive optical taps, etc.
• Netflow data is normally exported from one or more Netflow-enabled routers to a Netflow collector box (typically a fairly beefy dedicated PC server with lots of CPU and copious disk space)
• As data from the routers is received, it is periodically written to disk on the collector box (I2 writes flow data every five minutes).
• Applications can then be run against those saved Netflow data files to process the flow data into various summary reports.
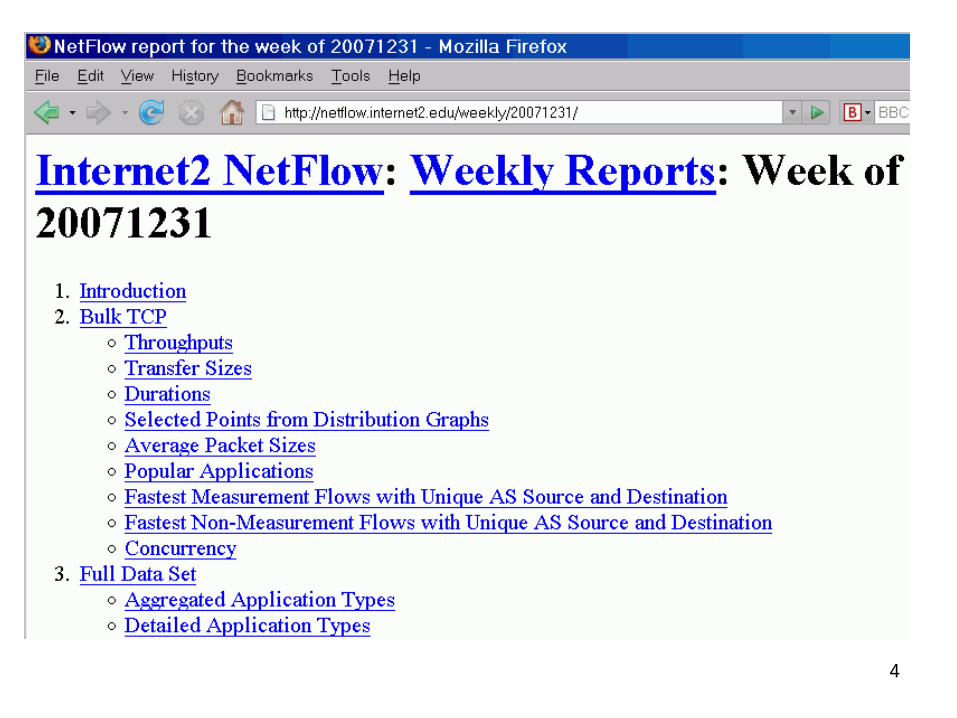
• Many of you may run Netflow locally, but even if you don't, I2 collects flow data for all traffic passing across the Internet2 Network, grinding that data into a weekly summary which is available at http://netflow.internet2.edu/
4

5
And In Fact, That I2 Weekly Netflow Report Is Really What Inspired This Talk…
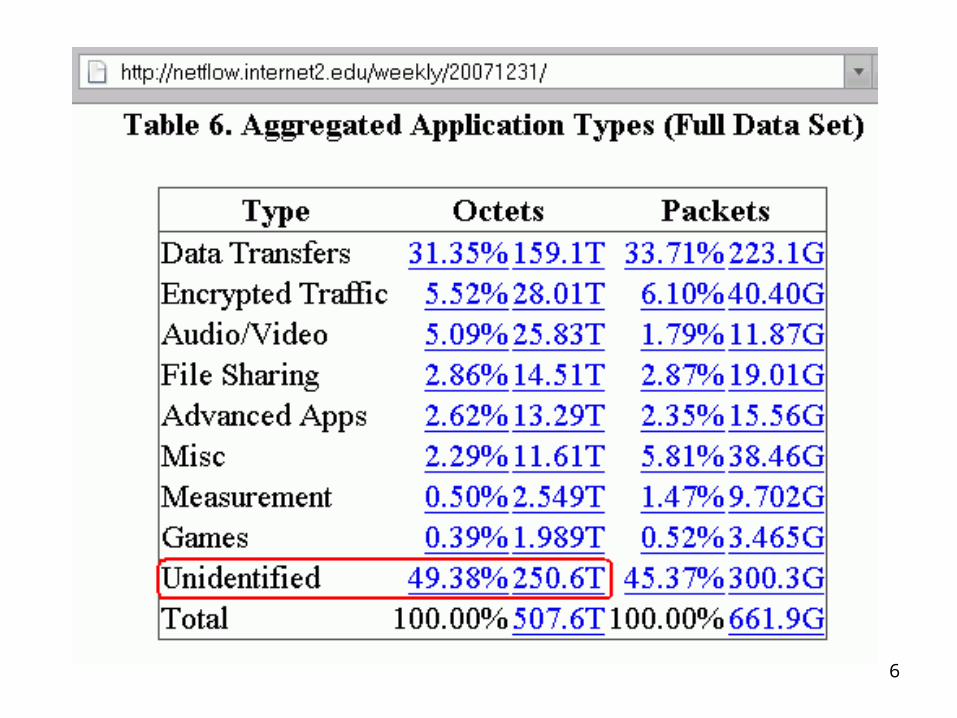
• If you look at a copy of the Internet2 Netflow Weekly Report, you'll see it covers at a wide range of topics, including:
-- what's the throughput of bulk data transfers (transfers >=10MB)?-- what applications are being used on the network?-- is the MTU just 1500, or are jumbo frames being used?-- is all traffic best effort, or are DSCP code points being used to tag traffic for expedited service or for scavenger treatment?
• When categorizing flows, the report does its best to assign flows to applications, but sometimes there are flows which don't fit any known application. Those flows then go into an "unidentified" category, a category which over time has grown to ~50% of all octets as the applications seen on the network have evolved.
6

7
~50% Unidentified Traffic Is NOT a "One-Off" Phenomenon
Report Date % Unidentified Unidentified Octets
20071224 58.34% 268.8T20071217 52.17% 343.8T20071210 47.21% 358.8T20071203 43.31% 295.2T20071126 45.79% 363.9T20071112 48.34% 340.3T20071105 47.51% 379.0T20071029 46.62% 362.1T20071022 45.94% 352.4T20071015 46.99% 368.4T20071008 51.23% 324.6T20071001 53.37% 338.5T20070924 57.60% 443.5T20070917 55.24% 415.2T

8
At The Risk Of Sounding Somewhat Obsessive/Compulsive, Seeing Roughly Half of All Octets "Unidentified" Bothered Me...
• If I'd seen a few percent unidentified, or maybe even ten or twenty percent unidentified, I'd be willing to shrug and forget about that traffic, but seeing roughly half of all traffic end up in a residual "unidentified" category bothered me – what was it?
-- An important bread-and-butter application with non-standard port usage habits?-- Stealthy P2P or other bandwidth intensive apps intentionally trying to hide? -- Attack traffic? (you can always spot security types, can't you?)-- Something else?
• I decided I wanted to try to find out, grinding the data myself in my favorite statistical package, SAS. But would Internet2 Netflow data be routinely available for analysis? Well, it turns out, yes…
9
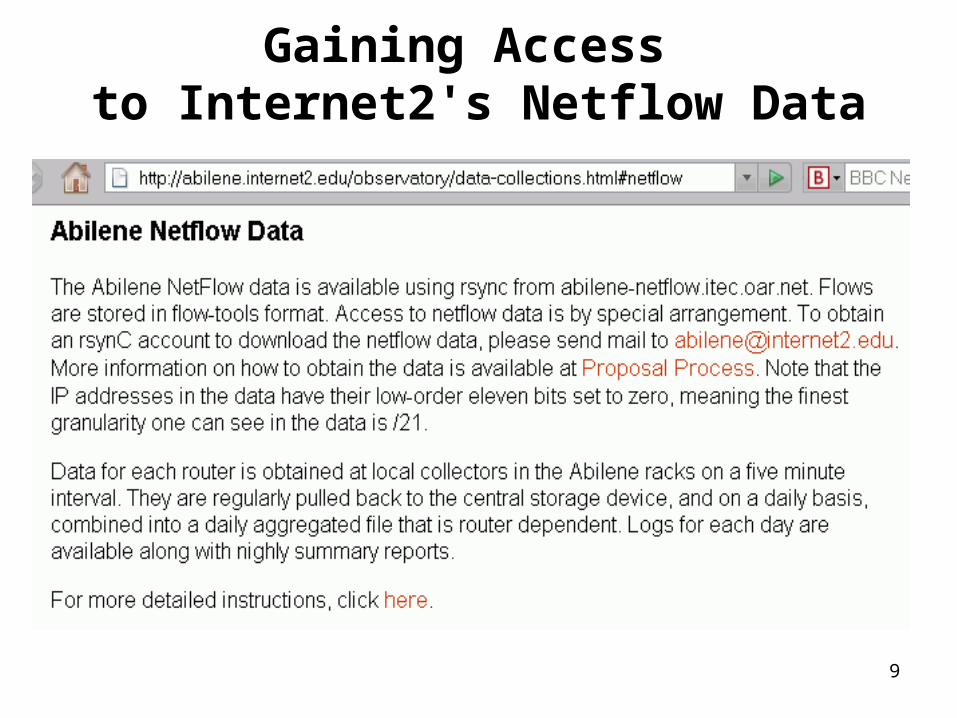
Gaining Access to Internet2's Netflow Data

10
http://abilene.internet2.edu/observatory/proposal-process.html
• "The following information would be useful to the Abilene Observatory Program, and is necessary in the case of obtaining Netflow data. Please submit to [email protected]: -- Give a brief description of the research project, including a title -- List the project leads and participants -- Include URLs if appropriate and available -- Indicate any potential issues with data resulting from the project, including any potential privacy issues.-- Should the project be listed as a participant on the Abilene Observatory web page?-- Submit an id and password to be used with rsync-- Submit a range or a set of individual ip addresses that will be used to access the data (range can be e.g., /28, /30, /32, etc.)-- Indicate any recommendations for additional data sets.
"If Abilene data is used in research papers or articles, please send future citations to be included with the above information. Researchers are encouraged to cite the use of this data in papers and articles. […]"

11
"You've Been Approved!"• Once approved, you'll have a personal username and password* which you can
use to get rsync access to Internet2 flow data in flow-tools format (see http://www.splintered.net/sw/flow-tools/ ). Those records will have basically everything you'd normally see in regular Netflow records:-- src and dest IP addresses (albeit with the last 11 bits zero'd)-- src and dest autonomous system numbers-- src and dest port numbers-- protocol type (tcp, udp, etc.)-- number of packets and number of octets-- flow start and stop times-- tcp flags and TOS bits, input/output interface numbers and next hop IPs, etc.
• An 11 bit mask ==> the finest granularity IP address information available will be aggregated at the /21 level (e.g., netblocks with up to 2048 dotted quads).At that level of anonymization it may be effectively impossible to "pair up" sequential client/server query/response network flows for some busy systems.--------* Because that password will be stored unencrypted on the system you use to rsync data, pick a password used only for that rsync account, chmod the pwd file appropriately, and carefully limit the IP addresses allowed to have rsync access

12
"So Is Flow Data Useful At All If The Lowest 11 Bits of the IPs Are Zero'd?"
• Absolutely! Keep in mind that it is very uncommon to be able to get any netflow data (or any sort of passively collected data) for a national-scale network. Most backbones treat netflow (and other passively collected data) as confidential/business proprietary, and they do not make that data publicly available in any form for any purpose whatsoever, even if the data's been anonymized.
• Internet2, on the other hand, has always viewed support for those studying the network to be an integral part of its role, and that support has been made tangible via things such as sharing data.
• From an analyst's point of view, it would (obviously) be trés commode if flow data were to be completely unanonymized, but that need has to be carefully balanced against the larger need to respect the privacy of Internet2 users. An 11 bit mask is the result.

13
Sampled Netflow• There's another complication: because of the line rates involved,
the netflow data you get from Internet2 is only sampled at a rate of 1:100. That is, you don't get flows for every packet, but flows which result from sampling every one in a hundred packets.If you need to obtain absolute estimates for total traffic, you'll need to scale the totals you receive from sampled netflow accordingly(e.g., scale total octets or total packets by multiplying by 100)
• You may wonder WHY sampled netflow is necessary – why can't the router just export records for all the traffic it sees? The answer is that doing netflow imposes overhead, and if the router is exporting every flow associated with any packet, it may slow down and have trouble keeping up with its primary job of routing packets
• [Aside: Should Internet2 be deploying non-router-based passive flow-monitoring hardware appliances, at least on some links?]

14
No IPv6, Either• In addition to only seeing sampled data rather than full flow data,
don't be disappointed when you learn that you won't currently get to see native IPv6 flow records, even though that traffic is present on the backbone.
• Why is there no native IPv6 flow data? Well, Netflow version 5 (the traditional Netflow format used at most sites, including Internet2), doesn't support IPv6 traffic -- you need to be running the more recent Netflow version 9 if you want to collect data on IPv6 network flows.
• Q. "So what's the IPv6 (protocol 41) traffic I see in the Internet2 weekly summaries, eh?"A. "That's legacy IPv6 over IPv4 traffic, not native IPv6 traffic."
[Aside #2: Should Internet2's Netflow collections be migrated to Netflow Version 9 so as to support native IPv6 Netflow?]

15
"So Are You Going to Look at A Week/Month/Year's Worth of Data or ?"
• We're just going to look at an hour's worth of data collected on Wednesday, 2008-01-16 at 2100 UTC (4PM EST, 3PM CST, 2PM MST, 1PM PST, etc.). I believe that that hour's worth of data is similar to larger data windows, exhibiting the same sort of characteristic "uncategorized" traffic as larger samples.
• True, there may be some traffic which is scheduled to run in the middle of the night in the US, traffic which we might miss by only picking a "prime time" observation point, but that's okay: this isn't meant to be a rigorous and long term analysis, but rather an experiment, an introduction and exploration, perhaps inspiring YOU to do a better/more complete job than I've done.

16
Even An Hour Of Sampled Netflow Data Is A LOT of Data
• Even sampling 1:100, it is easy to underestimate the volumes associated with Netflow data. Consider just our single hour's worth of data from 2008-01-16 2100 UTC:
ATLA: 3.36 million recordsCHIC: 11.9 million recordsHOUS: 1.97 million recordsKANS: 5.08 million recordsLOSA: 2.51 million recordsNEWY: 8.08 million recordsSALT: 3.97 million recordsSTTLng: 3.62 million recordsWASH: 7.18 million records
47.7 million records (all values rounded)

17
Avoiding Overcounting• Because flow data is collected at each node on Abilene, a single
flow, say from Oregon to Washington DC, might show up in the netflow data for five nodes as it travels across the country. Having that data included at each site is great -- if you're just looking at the total traffic for one of those routing nodes. But if you're trying to get a picture of the total traffic entering the I2 Network nationally, you don't want to "overcount" a transcontinental flow simply because it is flowing across multiple backbone nodes.
• Fortunately, I2 routinely corrects for this phenomenon in the Weekly Report, and I2 provides a router node-by-router node mapping showing how interfaces are used, which allows you to identify backbone flows to exclude. For example, to get mapping data for 2008-01-16, an authorized user would rsync:flows/logs/2008/2008-01/2008-01-16/nfilter and/orflows/logs/2008/2008-01/2008-01-16/ifAlias.* deleting flows from backbone interfaces (they'll already have been counted elsewhere)

18
A Flow From LOSA to WASH Should Only Be Counted Once, Not Five Times

19
With Redundant Backbone Flows Deleted…• After removing redundant backbone flows, the size of our
2008-01-16 2100 UTC hour dataset drops substantially to:
ATLA: 1.46 million recordsCHIC: 8.88 million recordsHOUS: 0.34 million recordsKANS: 1.73 million recordsLOSA: 1.51 million recordsNEWY: 6.82 million recordsSALT: 0.70 million recordsSTTLng: 1.67 million recordsWASH: 4.05 million records
27.16 million records (all values rounded)
• That's still a LOT of data, but much less than 47.7 million records
20
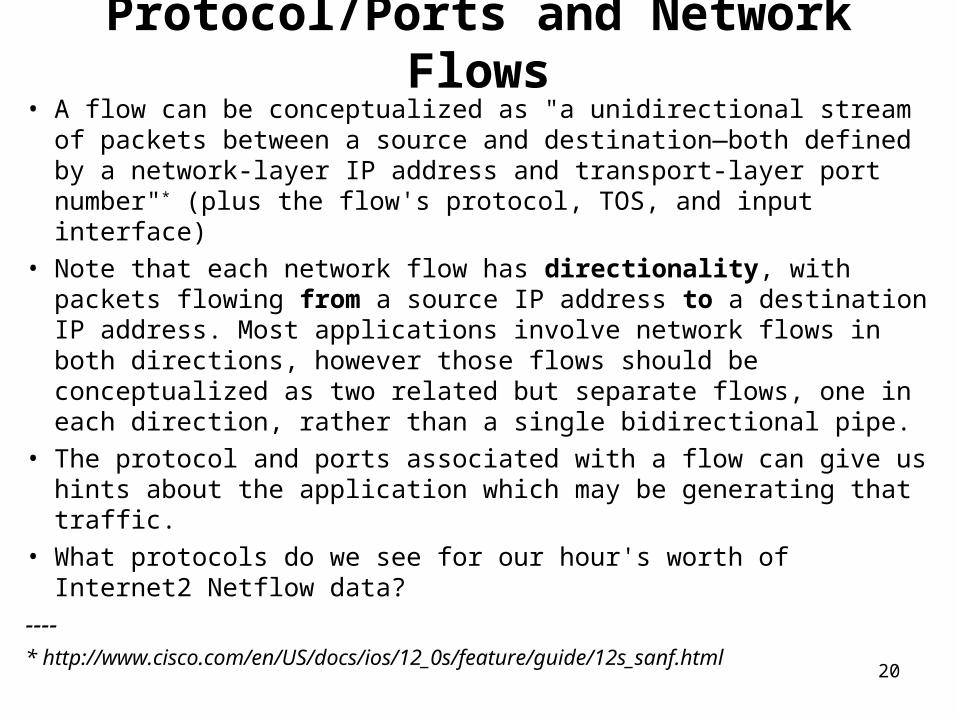
Protocol/Ports and Network Flows• A flow can be conceptualized as "a unidirectional stream of packets
between a source and destination—both defined by a network-layer IP address and transport-layer port number"* (plus the flow's protocol, TOS, and input interface)
• Note that each network flow has directionality, with packets flowing from a source IP address to a destination IP address. Most applications involve network flows in both directions, however those flows should be conceptualized as two related but separate flows, one in each direction, rather than a single bidirectional pipe.
• The protocol and ports associated with a flow can give us hints about the application which may be generating that traffic.
• What protocols do we see for our hour's worth of Internet2 Netflow data?
----* http://www.cisco.com/en/US/docs/ios/12_0s/feature/guide/12s_sanf.html

21
Octets Per Protocol Breakdown
Some quick notes: -- No, you're not expected to read tiny fonts on screen, but if you can, I'm impressed :-) You might find it easier to look at these slides on your laptop while I talk. A couple of quick highlights… -- TCP is still largely the dominant protocol overall at 92.43%, with UDP chugging along at about 5% (we'll focus largely on that TCP traffic for the rest of the this talk) -- You'll notice that there are differences from node-to-node. For example, I found it interesting that GRE is surprisingly high at over 9% at LOSA, and ESP (a secure tunneling protocol) is at roughly 1.7% of octets at ATLA
PROTOCOL Breakdown, Wed 2008-01-16, Hour Beginning 2100 UTC
TOTAL ATLA CHIC HOUS KANS LOSA NEWY SALT STTLng WASHTCP 92.43% 88.34% 91.94% 84.29% 94.00% 82.89% 93.63% 97.45% 93.23% 94.91%UDP 5.13% 9.56% 3.52% 14.71% 5.77% 7.77% 5.71% 2.11% 6.74% 4.85%GRE 2.11% 0.36% 4.42% 0.93% 0.06% 9.16% 0.07% 0.16% 0.01% 0.06%ESP 0.30% 1.72% 0.10% 0.01% 0.14% 0.14% 0.56% 0.27% 0.01% 0.16%ICMP 0.02% 0.02% 0.01% 0.06% 0.03% 0.04% 0.03% 0.01% 0.01% 0.02%Total above 99.99% 100.00% 99.99% 100.00% 100.00% 100.00% 100.00% 100.00% 100.00% 100.00%

22
Enough About Protocols,What About Port Usage?
• While you'd never believe it from looking at actual Netflow data, port numbers are an IANA-assigned number resource.
• In particular, see http://www.iana.org/assignments/port-numbers-- "Well Known Ports are those from 0 through 1023. […] Well Known
ports SHOULD NOT be used without IANA registration." -- "The Registered Ports are those from 1024 through 49151 […]
Registered ports SHOULD NOT be used without IANA registration."-- "The Dynamic and/or Private Ports are those from 49152 through 65535"
• Thus, application programmers should not just casually pick and begin to offer services using port numbers <= 49151 – doing so invites eventual chaos, and can reduce our ability to understand network loads. [The port 465 ("URD" vs. "SMTPS") mess is a nice example of why randomly using unassigned ports is a bad idea.]

23
Top Destination Ports by Unscaled Octets (TCP Only), Wed 2008-01-16, Hour Beginning 2100 UTC (1/10th of 1% or more)
64901 total distinct ports seen
PortIANAAssignment
Unscaled Octets Percent
CummulativeOctets
CummulativePercent
80 HTTP 2.75E+09 5.01 2.75E+09 5.0140000 SafetyNET 1.20E+09 2.19 3.96E+09 7.240003 Unassigned 1.08E+09 1.97 5.04E+09 9.17
22 SSH 9.24E+08 1.68 5.96E+09 10.8525 SMTP 6.47E+08 1.18 6.61E+09 12.03
40001 Unassigned 5.52E+08 1.01 7.16E+09 13.04119 NNTP 5.03E+08 0.92 7.66E+09 13.95
40004 Unassigned 4.56E+08 0.83 8.12E+09 14.7920000 DNP 4.52E+08 0.82 8.57E+09 15.6120001 MicroSAN 4.19E+08 0.76 8.99E+09 16.3740002 Unassigned 3.91E+08 0.71 9.38E+09 17.08
443 HTTPS 3.79E+08 0.69 9.76E+09 17.7740005 Unassigned 3.47E+08 0.63 1.01E+10 18.420002 Commtact HTTP 2.60E+08 0.47 1.04E+10 18.8820003 Commtact HTTPs 1.75E+08 0.32 1.05E+10 19.2
5500 fcp-addr-srvr1 1.75E+08 0.32 1.07E+10 19.5120004 Unassigned 1.62E+08 0.3 1.09E+10 19.8120005 Unassigned 1.46E+08 0.27 1.10E+10 20.08
6881 Unassigned 1.35E+08 0.25 1.12E+10 20.3260011 Dynamic/Private 1.17E+08 0.21 1.13E+10 20.5440006 Unassigned 1.06E+08 0.19 1.14E+10 20.73

24
9001 ETL Service Manager 1.01E+08 0.18 1.15E+10 20.9120008 Unassigned 96390036 0.18 1.16E+10 21.0943536 Unassigned 86984732 0.16 1.17E+10 21.2520007 Unassigned 80879823 0.15 1.18E+10 21.3920006 Unassigned 78360316 0.14 1.18E+10 21.5420009 Unassigned 74820897 0.14 1.19E+10 21.6720010 Unassigned 60268207 0.11 1.20E+10 21.78
5101 Talarian-TCP 58686545 0.11 1.20E+10 21.8940007 Unassigned 56404724 0.1 1.21E+10 21.99
20 FTP 54025330 0.1 1.21E+10 22.09
25
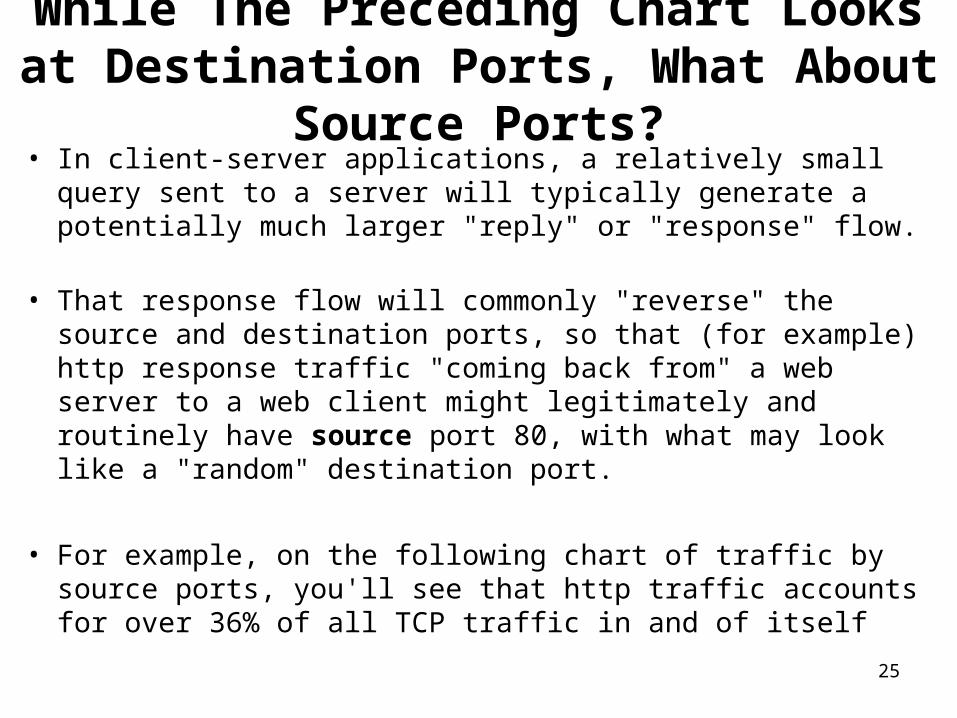
While The Preceding Chart Looks at Destination Ports, What About Source Ports?• In client-server applications, a relatively small query sent to a
server will typically generate a potentially much larger "reply" or "response" flow.
• That response flow will commonly "reverse" the source and destination ports, so that (for example) http response traffic "coming back from" a web server to a web client might legitimately and routinely have source port 80, with what may look like a "random" destination port.
• For example, on the following chart of traffic by source ports, you'll see that http traffic accounts for over 36% of all TCP traffic in and of itself
26
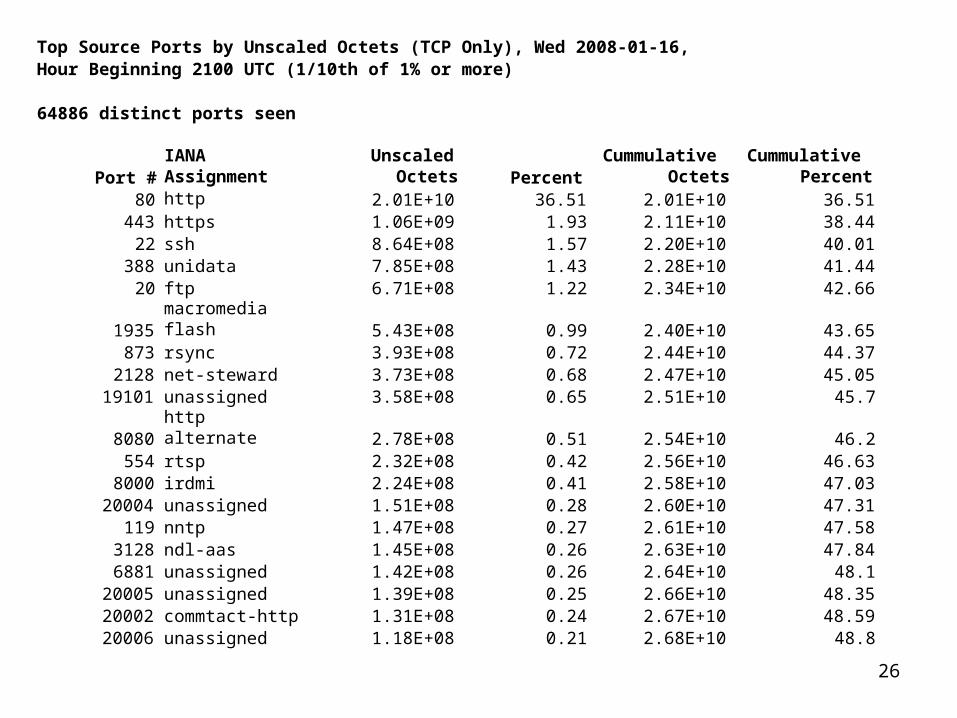
Top Source Ports by Unscaled Octets (TCP Only), Wed 2008-01-16, Hour Beginning 2100 UTC (1/10th of 1% or more)
64886 distinct ports seen
Port #IANA Assignment
UnscaledOctets Percent
CummulativeOctets
CummulativePercent
80 http 2.01E+10 36.51 2.01E+10 36.51443 https 1.06E+09 1.93 2.11E+10 38.44
22 ssh 8.64E+08 1.57 2.20E+10 40.01388 unidata 7.85E+08 1.43 2.28E+10 41.44
20 ftp 6.71E+08 1.22 2.34E+10 42.66
1935macromedia flash 5.43E+08 0.99 2.40E+10 43.65
873 rsync 3.93E+08 0.72 2.44E+10 44.372128 net-steward 3.73E+08 0.68 2.47E+10 45.05
19101 unassigned 3.58E+08 0.65 2.51E+10 45.7
8080http alternate 2.78E+08 0.51 2.54E+10 46.2
554 rtsp 2.32E+08 0.42 2.56E+10 46.638000 irdmi 2.24E+08 0.41 2.58E+10 47.03
20004 unassigned 1.51E+08 0.28 2.60E+10 47.31119 nntp 1.47E+08 0.27 2.61E+10 47.58
3128 ndl-aas 1.45E+08 0.26 2.63E+10 47.846881 unassigned 1.42E+08 0.26 2.64E+10 48.1
20005 unassigned 1.39E+08 0.25 2.66E+10 48.3520002 commtact-http 1.31E+08 0.24 2.67E+10 48.5920006 unassigned 1.18E+08 0.21 2.68E+10 48.8
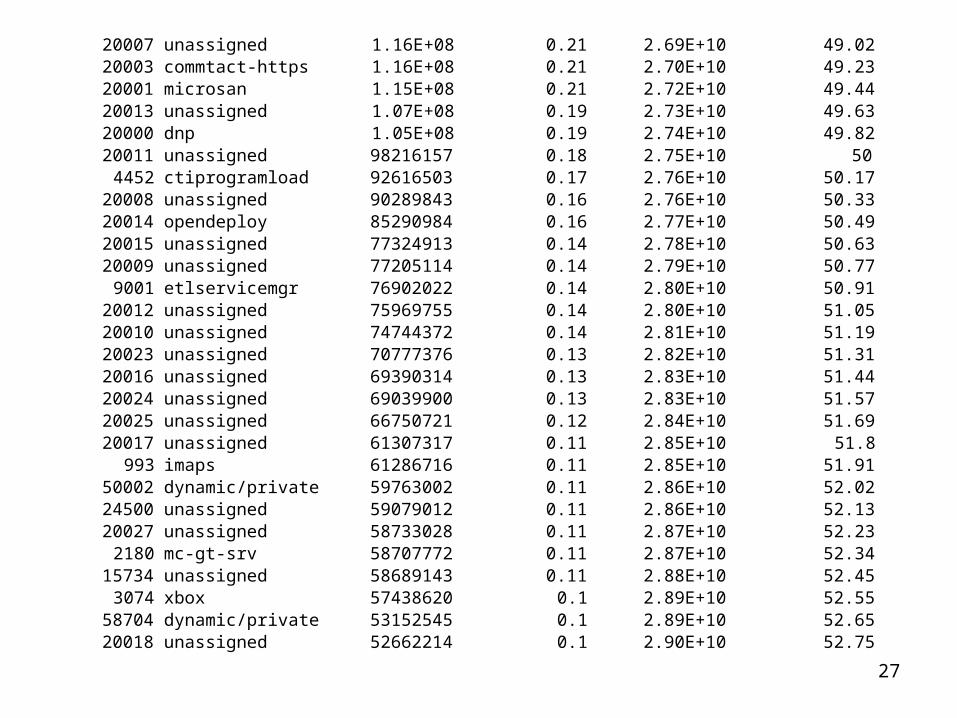
27
20007 unassigned 1.16E+08 0.21 2.69E+10 49.0220003 commtact-https 1.16E+08 0.21 2.70E+10 49.2320001 microsan 1.15E+08 0.21 2.72E+10 49.4420013 unassigned 1.07E+08 0.19 2.73E+10 49.6320000 dnp 1.05E+08 0.19 2.74E+10 49.8220011 unassigned 98216157 0.18 2.75E+10 50
4452 ctiprogramload 92616503 0.17 2.76E+10 50.1720008 unassigned 90289843 0.16 2.76E+10 50.3320014 opendeploy 85290984 0.16 2.77E+10 50.4920015 unassigned 77324913 0.14 2.78E+10 50.6320009 unassigned 77205114 0.14 2.79E+10 50.77
9001 etlservicemgr 76902022 0.14 2.80E+10 50.9120012 unassigned 75969755 0.14 2.80E+10 51.0520010 unassigned 74744372 0.14 2.81E+10 51.1920023 unassigned 70777376 0.13 2.82E+10 51.3120016 unassigned 69390314 0.13 2.83E+10 51.4420024 unassigned 69039900 0.13 2.83E+10 51.5720025 unassigned 66750721 0.12 2.84E+10 51.6920017 unassigned 61307317 0.11 2.85E+10 51.8
993 imaps 61286716 0.11 2.85E+10 51.9150002 dynamic/private 59763002 0.11 2.86E+10 52.0224500 unassigned 59079012 0.11 2.86E+10 52.1320027 unassigned 58733028 0.11 2.87E+10 52.23
2180 mc-gt-srv 58707772 0.11 2.87E+10 52.3415734 unassigned 58689143 0.11 2.88E+10 52.45
3074 xbox 57438620 0.1 2.89E+10 52.5558704 dynamic/private 53152545 0.1 2.89E+10 52.6520018 unassigned 52662214 0.1 2.90E+10 52.75

28
What Are Some of Those Non-Standard Ports Seen?
• Some applications running on dedicated machines may intentionally use non-standard ports, or even a wide "block" or "range" of ports. Choice of those ports may end up happening at, um, "local discretion."
• We know that at least some of these applications using unusual ports are crucial measurement tools or core applications driving a material fraction of the Internet2 Network's traffic.
• For example, one of the top destination ports seen on the table a few slides back is port 5101/tcp. What's that?

29
5101/TCP: Talarian_TCP, Y!M, or ? src_as dst_as srcport dstport prot raw doctets AS668 DREN AS11537 I2 33207 5101 TCP[6] 11,736,000AS7847 NASA-HPCC-ESS AS11537 I2 34272 5101 TCP[6] 7,677,000AS7847 NASA-HPCC-ESS AS11537 I2 46487 5101 TCP[6] 6,921,000AS7847 NASA-HPCC-ESS AS11537 I2 52600 5101 TCP[6] 6,894,000AS7847 NASA-HPCC-ESS AS11537 I2 56799 5101 TCP[6] 6,336,000
• IANA says that 5101/tcp is assigned to "Talarian_TCP"
• If you Google for port 5101/tcp, you'll see web pages such as http://www.cert.org/advisories/CA-2002-16.html which states"Yahoo! Messenger typically listens for peer-to-peer requests on port 5101/TCP […]" – but these flows seemed large for Y!M to me
• Since the destination ASN was Internet2, I inquired (thanks again, as always, Matt!) and learned that these are actually knownnuttcp-related flows (nuttcp is a measurement tool similar to iperf, see http://www.wcisd.hpc.mil/nuttcp/Nuttcp-HOWTO.html )

30
What About LHC Traffic?
• Looking at an earlier snapshot of some Internet2 Netflow traffic, I observed traffic coming from AS3152 (FNAL) to AS7896 (U Nebraska), a well-known LHC site, with destination ports 20001/TCP, 20002/TCP, 20003/TCP, 56133/TCP, etc.
• Given the size and source/destination of those flows, I contacted UNL and was able to confirm that these were indeed likely LHC-related flows involving the application "PhEDEx" (seehttps://lhcatfnal.fnal.gov/shift-operations/sitracker/data-transfer and "PhEDEx High-Throughput Data Transfer Management System" http://www.gridpp.ac.uk/papers/chep06_tuura.pdf for more information about PhEDEx)
• What about the Access Grid, or Globus' GSIFTP, say?

31

32

33
Ports and Intentional Attempts at Obfuscation
Other application programmers view the network environment as an adversarial/hostile place (sometimes for well founded reasons!), and may use non-standard ports in an effort to resist traffic analysis, app identification, and traffic shaping or blocking. For instance:-- Bandwidth intensive P2P applications may employ per-session dynamic port assignment (for example, uTorrent allows you to "randomize port each time uTorrent starts") or encryption (see www.azureuswiki.com/index.php/Message_Stream_Encryption) in an effort to avoid port-based traffic analysis or deep packet inspection, helping those programs to resist traffic identification-- Other applications may resort to tunneling "everything over port 80" in an effort to circumvent restrictive perimeter firewall policies which may have closed everything except for a few ports (e.g., see forum.skype.com/lofiversion/index.php/t15582.html )
34
The Result of Intentional Obfuscation or Random Selection of Port Numbers
• If users or applications randomly choose ports for application use, at the limiting case, traffic would be randomly distributed over more-or-less the entire set of all possible ports, with (potentially) 100/65K=0.00152% of all traffic on each of the 65K ports.
• On the other hand, if users employed the alternative strategy mentioned previously, e.g., repurposing port 80 to carry virtually everything, in the limiting case you'd only see traffic on a small number of ports.
• Either way, attempts at port-based traffic analysis might be rendered difficult at best, if not pointless altogether.
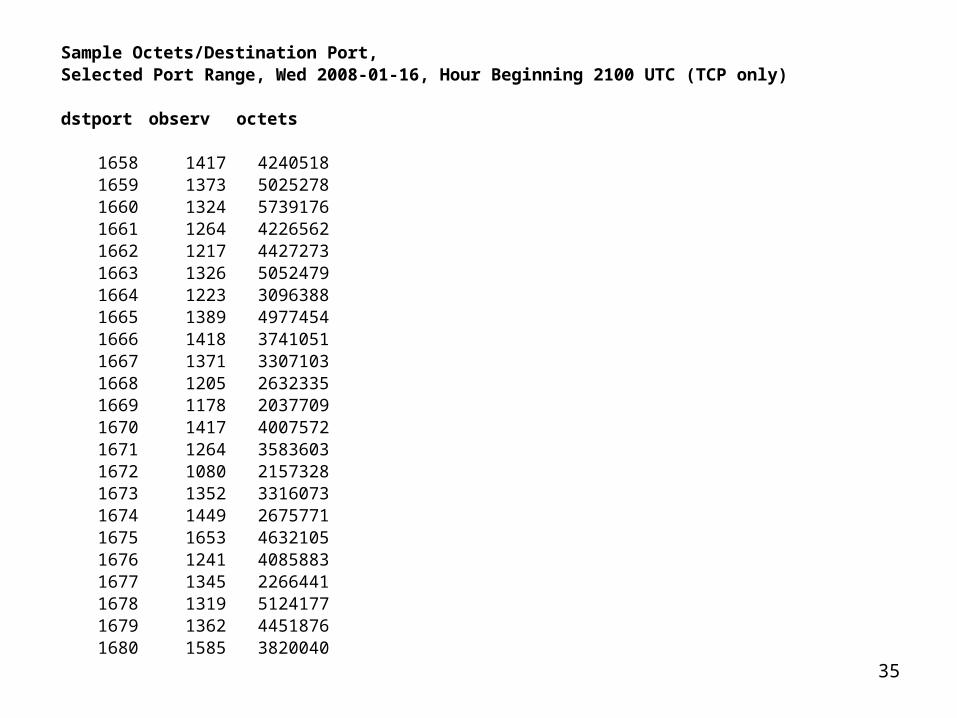
• The following slide shows an example of a range of ports where I believe port numbers are not particularly illuminating, and traffic is mundanely distributed.
35
Sample Octets/Destination Port, Selected Port Range, Wed 2008-01-16, Hour Beginning 2100 UTC (TCP only)
dstport observ octets
1658 1417 42405181659 1373 50252781660 1324 57391761661 1264 42265621662 1217 44272731663 1326 50524791664 1223 30963881665 1389 49774541666 1418 37410511667 1371 33071031668 1205 26323351669 1178 20377091670 1417 40075721671 1264 35836031672 1080 21573281673 1352 33160731674 1449 26757711675 1653 46321051676 1241 40858831677 1345 22664411678 1319 51241771679 1362 44518761680 1585 3820040

36
# of Observations/Port for Selected Ports, 2008-01-16, Hour Beginning 2100 UTC (TCP only)
0
500
1000
1500
2000
16581659166016611662166316641665166616671668166916701671167216731674167516761677167816791680Port #
Number of Ob
s
Unscaled Octets/Port for Selected Ports, 2008-01-16, Hour Beginning 2100 UTC (TCP Only)
0
1000000
2000000
3000000
4000000
5000000
6000000
7000000
16581659166016611662166316641665166616671668166916701671167216731674167516761677167816791680
Port #
Unscaled Octets
37
Application Hinting Associated With Traffic Source and Destination Addresses
• In addition to ports and protocols, the source address and the destination address of each flow may also provide hints as to the type of application associated with a given flow.
• One obvious example would be dst addresses of multicast flows
• In other cases, simply hearing a particular organization's name (such as "Youtube"), can be enough to tell you a lot about the application traffic you're probably seeing (although these sort of associations must be viewed as suggestive rather than conclusive).
• One caution: mapping a /11 masked anonymized source address or destination address to a specific organization is not always possible. For example, a single /21 aggregate may encompass multiple independently assigned smaller blocks, and identifying which of the multiple sites in a /21 "owns" a particular flow may simply not be possible.
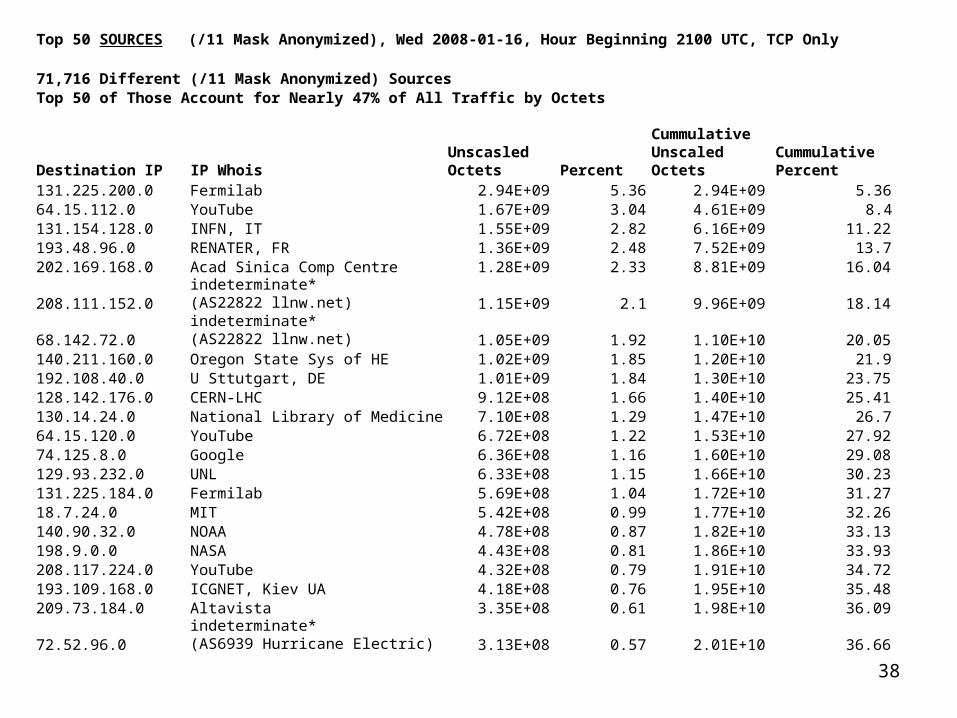
38
Top 50 SOURCES (/11 Mask Anonymized), Wed 2008-01-16, Hour Beginning 2100 UTC, TCP Only
71,716 Different (/11 Mask Anonymized) SourcesTop 50 of Those Account for Nearly 47% of All Traffic by Octets
Destination IP IP WhoisUnscasledOctets Percent
CummulativeUnscaledOctets
CummulativePercent
131.225.200.0 Fermilab 2.94E+09 5.36 2.94E+09 5.3664.15.112.0 YouTube 1.67E+09 3.04 4.61E+09 8.4131.154.128.0 INFN, IT 1.55E+09 2.82 6.16E+09 11.22193.48.96.0 RENATER, FR 1.36E+09 2.48 7.52E+09 13.7202.169.168.0 Acad Sinica Comp Centre 1.28E+09 2.33 8.81E+09 16.04
208.111.152.0indeterminate*(AS22822 llnw.net) 1.15E+09 2.1 9.96E+09 18.14
68.142.72.0indeterminate*(AS22822 llnw.net) 1.05E+09 1.92 1.10E+10 20.05
140.211.160.0 Oregon State Sys of HE 1.02E+09 1.85 1.20E+10 21.9192.108.40.0 U Sttutgart, DE 1.01E+09 1.84 1.30E+10 23.75128.142.176.0 CERN-LHC 9.12E+08 1.66 1.40E+10 25.41130.14.24.0 National Library of Medicine 7.10E+08 1.29 1.47E+10 26.764.15.120.0 YouTube 6.72E+08 1.22 1.53E+10 27.9274.125.8.0 Google 6.36E+08 1.16 1.60E+10 29.08129.93.232.0 UNL 6.33E+08 1.15 1.66E+10 30.23131.225.184.0 Fermilab 5.69E+08 1.04 1.72E+10 31.2718.7.24.0 MIT 5.42E+08 0.99 1.77E+10 32.26140.90.32.0 NOAA 4.78E+08 0.87 1.82E+10 33.13198.9.0.0 NASA 4.43E+08 0.81 1.86E+10 33.93208.117.224.0 YouTube 4.32E+08 0.79 1.91E+10 34.72193.109.168.0 ICGNET, Kiev UA 4.18E+08 0.76 1.95E+10 35.48209.73.184.0 Altavista 3.35E+08 0.61 1.98E+10 36.09
72.52.96.0indeterminate*(AS6939 Hurricane Electric) 3.13E+08 0.57 2.01E+10 36.66

39
198.118.192.0 NASA 3.12E+08 0.57 2.04E+10 37.23128.109.192.0 MCNC 2.86E+08 0.52 2.07E+10 37.75207.46.192.0 Microsoft 2.65E+08 0.48 2.10E+10 38.23193.146.192.0 RedIRIS 2.57E+08 0.47 2.13E+10 38.7
208.111.168.0indeterminate*(AS22822 llnw.net) 2.57E+08 0.47 2.15E+10 39.17
128.117.136.0 NCAR 2.36E+08 0.43 2.18E+10 39.6
205.234.216.0indeterminate*(AS23352 ServerCentral.net) 2.36E+08 0.43 2.20E+10 40.03
64.233.160.0 Google 2.33E+08 0.42 2.22E+10 40.45146.137.96.0 Argonne 2.16E+08 0.39 2.24E+10 40.85
68.142.120.0indeterminate* (AS22822 llnw.net) 2.12E+08 0.39 2.26E+10 41.23
128.30.48.0 MIT 2.11E+08 0.38 2.29E+10 41.62
210.138.96.0indeterminate*AS2497 (IIJ, Japan) 2.09E+08 0.38 2.31E+10 42
165.112.0.0 National Institute of Health 2.08E+08 0.38 2.33E+10 42.37208.65.152.0 YouTube 2.07E+08 0.38 2.35E+10 42.7572.14.200.0 Google 1.94E+08 0.35 2.37E+10 43.1130.246.176.0 Rutherford Appleton Lab, UK 1.92E+08 0.35 2.39E+10 43.4574.125.0.0 Google 1.86E+08 0.34 2.41E+10 43.79128.31.0.0 MIT 1.78E+08 0.32 2.42E+10 44.12156.56.240.0 Indiana U 1.72E+08 0.31 2.44E+10 44.43134.9.32.0 Lawrence Livermore 1.69E+08 0.31 2.46E+10 44.74192.12.208.0 Los Alamos 1.67E+08 0.3 2.47E+10 45.04
72.164.152.0Indeterminate*(EBSCO?) 1.67E+08 0.3 2.49E+10 45.35
152.46.0.0 NCREN 1.61E+08 0.29 2.51E+10 45.64156.26.32.0 Wichita State 1.51E+08 0.27 2.52E+10 45.92198.119.128.0 NASA 1.50E+08 0.27 2.54E+10 46.19131.247.248.0 U South Florida 1.46E+08 0.27 2.55E+10 46.4663.250.192.0 Yahoo Broadcast Services 1.46E+08 0.27 2.57E+10 46.72216.178.40.0 Myspace 1.42E+08 0.26 2.58E+10 46.98

40
Top 50 DESTINATIONS (/11 Mask Anonymized), Wed 2008-01-16, Hour Beginning 2100 UTC, TCP only
104,297 Different (/11 Mask Anonymized) DestinationsTop 50 of Those Account for Over 29% of All Traffic by Octets
Destination IP IP WhoisUnscaled Octets Percent
Cummulative UnscaledOctets
Cummulative Percent
18.7.24.0 MIT 4.32E+09 7.86 4.32E+09 7.86129.93.232.0 UNL 4.10E+09 7.47 8.42E+09 15.33131.225.184.0 Fermilab 9.82E+08 1.79 9.40E+09 17.12144.92.176.0 Wisconsin-Madison 6.73E+08 1.22 1.01E+10 18.35198.32.40.0 Exchange Point Blocks 6.11E+08 1.11 1.07E+10 19.46192.239.80.0 Level 3 4.50E+08 0.82 1.11E+10 20.28131.154.128.0 INFNET1 - INFN CNAF, IT 4.19E+08 0.76 1.16E+10 21.04202.169.168.0 Acad Sinica Comp Centre 2.67E+08 0.49 1.18E+10 21.53152.61.0.0 USGS EROS Data Center 2.27E+08 0.41 1.21E+10 21.9465.55.208.0 Microsoft 2.21E+08 0.4 1.23E+10 22.3472.246.88.0 Akamai 1.96E+08 0.36 1.25E+10 22.7155.101.16.0 U Utah 1.74E+08 0.32 1.26E+10 23.02131.169.96.0 DESY, Hamburg DE 1.56E+08 0.28 1.28E+10 23.3199.8.24.0 Indiana Wesleyan U 1.36E+08 0.25 1.29E+10 23.55128.104.104.0 Wisconsin-Madison 1.36E+08 0.25 1.31E+10 23.8169.154.200.0 NASA 1.35E+08 0.25 1.32E+10 24.04192.67.128.0 indeterminate* 1.27E+08 0.23 1.33E+10 24.27128.255.32.0 U Iowa 1.25E+08 0.23 1.35E+10 24.5128.112.136.0 Princeton 1.24E+08 0.23 1.36E+10 24.7364.233.160.0 Google 1.23E+08 0.22 1.37E+10 24.95134.158.168.0 INP23, FR 1.23E+08 0.22 1.38E+10 25.18168.91.0.0 IVYTech Comm Coll of Indiana 1.23E+08 0.22 1.40E+10 25.4

41
128.174.80.0 U Illinois 1.17E+08 0.21 1.41E+10 25.61155.33.216.0 Northeastern U 1.15E+08 0.21 1.42E+10 25.8264.251.48.0 CT Education Network 1.12E+08 0.2 1.43E+10 26.03216.178.32.0 Myspace 1.08E+08 0.2 1.44E+10 26.22134.174.88.0 Longwood Medical, Mass. 1.07E+08 0.2 1.45E+10 26.42131.154.192.0 INFN, IT 1.02E+08 0.19 1.46E+10 26.6128.138.128.0 U Colorado 93125843 0.17 1.47E+10 26.77129.55.200.0 MIT Lincoln Lab 91922672 0.17 1.48E+10 26.9465.54.240.0 Microsoft 91365153 0.17 1.49E+10 27.11128.211.200.0 Purdue 90054381 0.16 1.50E+10 27.27205.213.104.0 WiscNet 87148797 0.16 1.51E+10 27.43128.128.176.0 Woods Hole 83945856 0.15 1.52E+10 27.58130.14.24.0 National Library of Medicine 83854190 0.15 1.52E+10 27.73131.247.240.0 U South Florida 83028074 0.15 1.53E+10 27.89129.186.184.0 Iowa State 79738187 0.15 1.54E+10 28.03128.211.208.0 Purdue 78492489 0.14 1.55E+10 28.17129.93.248.0 UNL 76757341 0.14 1.56E+10 28.31130.111.72.0 U Maine System 75249085 0.14 1.56E+10 28.45128.102.104.0 NASA 74143515 0.14 1.57E+10 28.59128.112.24.0 Princeton 73159718 0.13 1.58E+10 28.72141.214.16.0 U Mich Medical Center 72761983 0.13 1.58E+10 28.85144.92.128.0 Wisconsin-Madison 70214428 0.13 1.59E+10 28.98128.118.168.0 Penn State 68694824 0.13 1.60E+10 29.1129.55.64.0 MIT Lincoln Lab 67411221 0.12 1.61E+10 29.23193.62.200.0 Hinxton Hall Ltd, UK 64941350 0.12 1.61E+10 29.35
Total: 5.49E+10* known multiple customer SWIPs within this /21
42
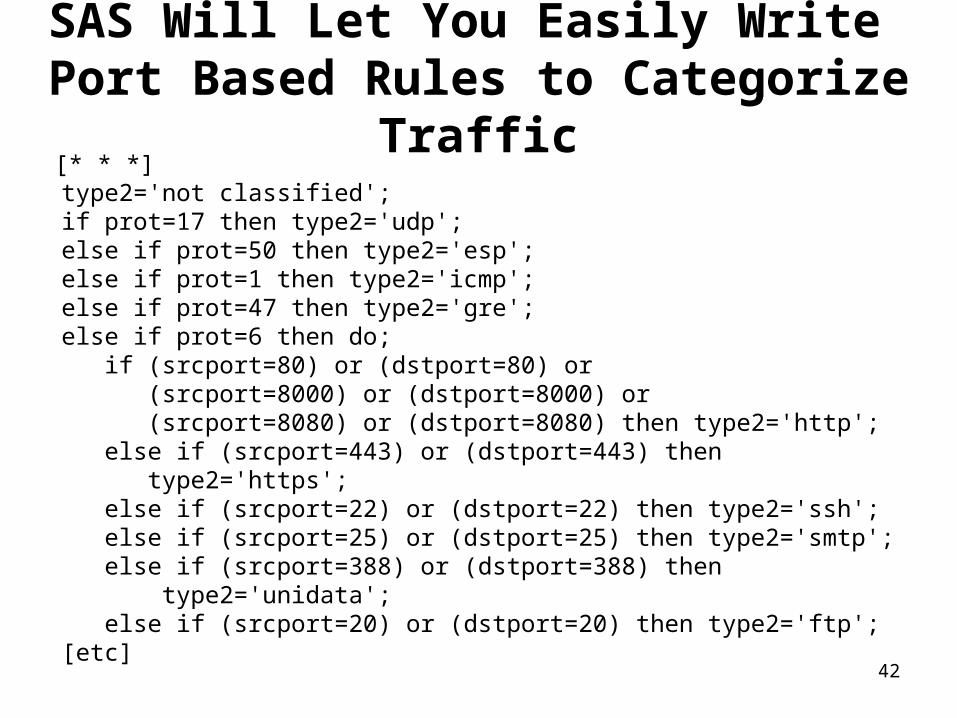
SAS Will Let You Easily Write Port Based Rules to Categorize Traffic
[* * *]type2='not classified';if prot=17 then type2='udp';else if prot=50 then type2='esp';else if prot=1 then type2='icmp';else if prot=47 then type2='gre';else if prot=6 then do; if (srcport=80) or (dstport=80) or (srcport=8000) or (dstport=8000) or (srcport=8080) or (dstport=8080) then type2='http'; else if (srcport=443) or (dstport=443) then type2='https'; else if (srcport=22) or (dstport=22) then type2='ssh'; else if (srcport=25) or (dstport=25) then type2='smtp'; else if (srcport=388) or (dstport=388) then type2='unidata'; else if (srcport=20) or (dstport=20) then type2='ftp';[etc]
43
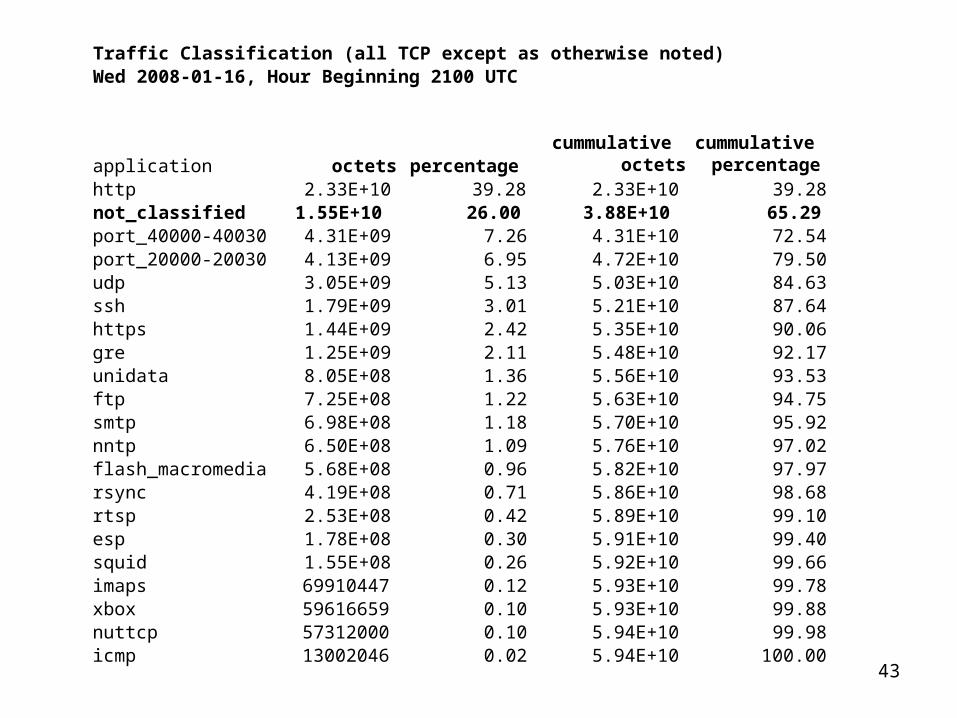
Traffic Classification (all TCP except as otherwise noted)Wed 2008-01-16, Hour Beginning 2100 UTC
application octets percentagecummulative
octetscummulative
percentagehttp 2.33E+10 39.28 2.33E+10 39.28not_classified 1.55E+10 26.00 3.88E+10 65.29port_40000-40030 4.31E+09 7.26 4.31E+10 72.54port_20000-20030 4.13E+09 6.95 4.72E+10 79.50udp 3.05E+09 5.13 5.03E+10 84.63ssh 1.79E+09 3.01 5.21E+10 87.64https 1.44E+09 2.42 5.35E+10 90.06gre 1.25E+09 2.11 5.48E+10 92.17unidata 8.05E+08 1.36 5.56E+10 93.53ftp 7.25E+08 1.22 5.63E+10 94.75smtp 6.98E+08 1.18 5.70E+10 95.92nntp 6.50E+08 1.09 5.76E+10 97.02flash_macromedia 5.68E+08 0.96 5.82E+10 97.97rsync 4.19E+08 0.71 5.86E+10 98.68rtsp 2.53E+08 0.42 5.89E+10 99.10esp 1.78E+08 0.30 5.91E+10 99.40squid 1.55E+08 0.26 5.92E+10 99.66imaps 69910447 0.12 5.93E+10 99.78xbox 59616659 0.10 5.93E+10 99.88nuttcp 57312000 0.10 5.94E+10 99.98icmp 13002046 0.02 5.94E+10 100.00
44
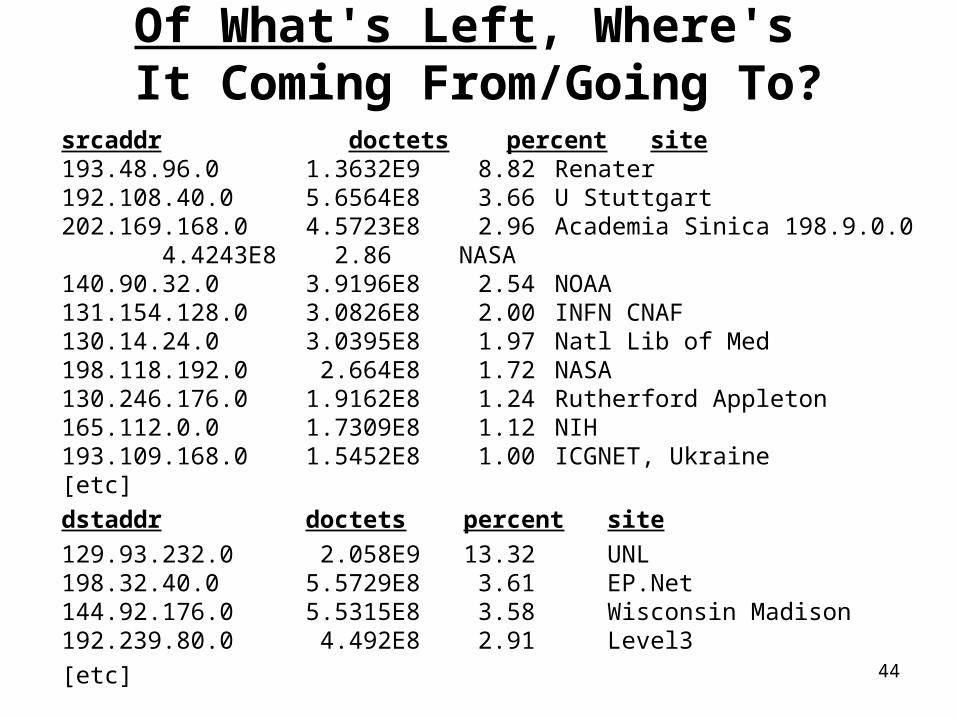
Of What's Left, Where's It Coming From/Going To?
srcaddr doctets percent site193.48.96.0 1.3632E9 8.82 Renater192.108.40.0 5.6564E8 3.66 U Stuttgart 202.169.168.0 4.5723E8 2.96 Academia Sinica 198.9.0.0 4.4243E8 2.86 NASA140.90.32.0 3.9196E8 2.54 NOAA131.154.128.0 3.0826E8 2.00 INFN CNAF 130.14.24.0 3.0395E8 1.97 Natl Lib of Med198.118.192.0 2.664E8 1.72 NASA130.246.176.0 1.9162E8 1.24 Rutherford Appleton165.112.0.0 1.7309E8 1.12 NIH193.109.168.0 1.5452E8 1.00 ICGNET, Ukraine[etc]dstaddr doctets percent site129.93.232.0 2.058E9 13.32 UNL 198.32.40.0 5.5729E8 3.61 EP.Net144.92.176.0 5.5315E8 3.58 Wisconsin Madison192.239.80.0 4.492E8 2.91 Level3[etc]

45
Conclusion• At this point, I hope you have a sense of the sort of analyses you
may be able to do using Internet2 Netflow data, even though I wouldn't begin to claim that I've even come close identifying the "missing half" of I2 Netflow data.
• Maybe some of you here today, or network researchers back at your campuses, will be inspired to give this data a closer look, and begin to explore and work with the Internet2 Netflow data archives.
• For those of you who may be interested, I've also attached a brief tutorial with some notes on the mechanics of working with Internet2 Netflow data, although we won't go over those slides today due to our limited time.
• Thanks for the chance to talk today!

A Brief Tutorial on The Use of Internet2's Netflow Archive

47
Assumptions• You've already applied for, and been approved for access to
Internet2 Netflow data, as previously described earlier in these slides.
• You've retrieve and built flow-tools on a Unix or Linux host, again, as previously mentioned
• You want to do analyses that are easiest/best done using a traditional statistical package such as SAS

48
Browsing Directories With rsync• Data is stored on netflow.internet2.edu and is organized by the nine
Internet2 router nodes:
ATLA, CHIC, HOUS, KANS, LOSA, NEWY, SALT, STTLng, and WASH (note that's STTLng, not STTL)
• To view all available datasets for the KANS node for 2008-01-16: % rsync --password-file ./rsync.passwd -v -n \ [email protected]::flows/data\/KANS/2008/2008-01/2008-01-16/ [note: spaces matter!]
• File collection times may vary by a second or two, so don't be surprised if file naming reflects that jitter.

49
Actually Retrieving Flow Data With rsync• Once you've identified the files you'd like to retrieve, such as all
datasets for 2008-01-16 for a particular hour, such as 2100 UTC (4PM EST, 3PM CST, 2PM MST, 1PM PST, etc.), you can retrieve those files using a command such as:
% rsync --recursive --password-file ./rsync.passwd \-v [email protected]::flows/data/\KANS/2008/2008-01/2008-01-16/ft-v05.2008-01-16.21* \ KANS/ft-v05.2008-01-16 [note: spaces matter!]
50
Exporting Flow-Tools Format FilesTo Comma Separated Variables
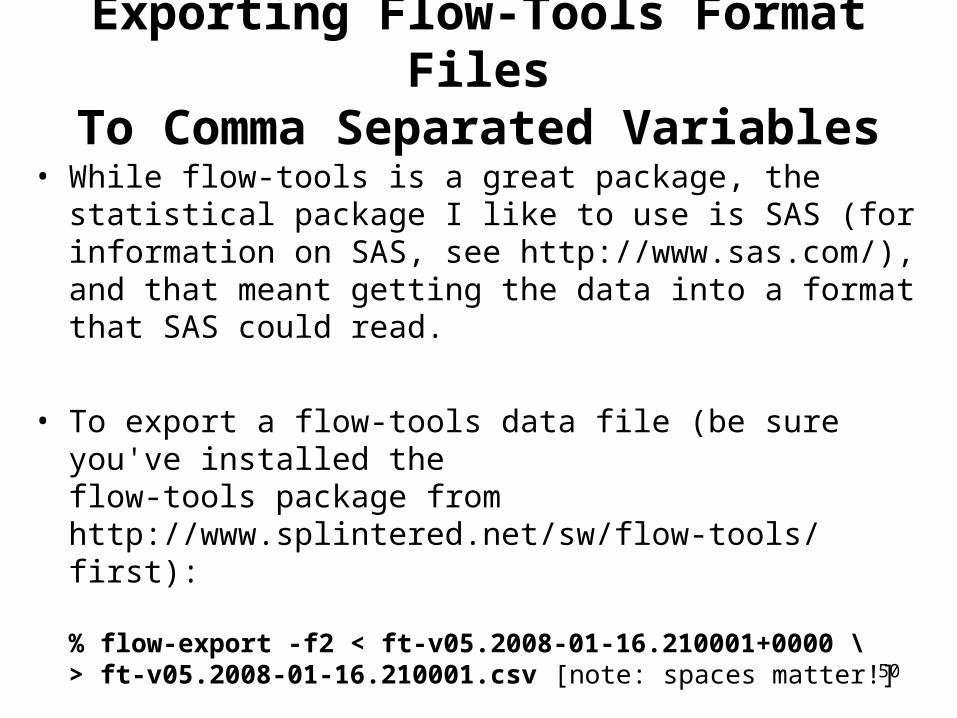
• While flow-tools is a great package, the statistical package I like to use is SAS (for information on SAS, see http://www.sas.com/), and that meant getting the data into a format that SAS could read.
• To export a flow-tools data file (be sure you've installed the flow-tools package from http://www.splintered.net/sw/flow-tools/ first):
% flow-export -f2 < ft-v05.2008-01-16.210001+0000 \> ft-v05.2008-01-16.210001.csv [note: spaces matter!]

51
Sample CSV Export Format Observations
• The contents of the resulting csv data file looks like:
#:unix_secs,unix_nsecs,sysuptime,exaddr,dpkts,doctets,first,last,engine_type,engine_id,srcaddr,dstaddr,nexthop,input,output,srcport,dstport,prot,tos,tcp_flags,src_mask,dst_mask,src_as,dst_as
That header record is actually IN the exported flow-tools file! At least some statistical packages will allow you to skip over that record without reading it; others may read that record but simply disregard its contents.
A sample (real!) export Netflow record look likes:
1200517203,0,3029563200,127.0.0.1,1,40,3029543377,3029543377,0,0,134.197.8.0,204.179.120.0,64.57.28.42,68,26,49371,80,6,0,16,16,24,3851,6932
52
Reading the Exported Data Into SAS• Once the data had been exported into a readily accessible format, it
still needed to be read into SAS.
• For your convenience, I've made the SAS code I used to do that available at http://www.uoregon.edu/~joe/missing-half/sas/(there's not room, time or need to go over all that code here)If you DO decide to use that SAS code, please note that it is provided as-is, with no warranty, and if you choose to use it, you do so at your own risk. Carefully confirm that it does what you want before you attempt to use it.
• Please see http://www.uoregon.edu/~joe/missing-half/sas/readme.txtfor a description of the various SAS files I've provided and how they all "fit together"
53
Weighting Flows and Removing Doubly Counted Flows
• When analyzing flows, each flow record typically represents multiple octets or multiple packets. As part of the process of analyzing netflow data, be sure you weight the flows you're looking at appropriately (this sort of functionality is routinely provied in most stat packages).
• Be sure you also remember to drop "duplicate" observations (flows which might have been recorded at multiple points on the backbone), as discussed on slides 17-18, earlier in these slides.

54
What If I Wanted to Replicate I2's Weekly Netflow Report Classification Process?
• To do that, you need to know what ports have been mapped to a given application. For example, the Internet2 Weekly Report categorizes 80/tcp, 81/tcp and 8080/tcp as http, and 25/tcp, 109/tcp, 110/tcp, 143/tcp, 220/tcp, 465/tcp, 585/tcp, 587/tcp, and 993/tcp as mail.
• Because some of those mappings might be hard to otherwise infer, I obtained a copy of an I2 report describing nfstat, complete with a copy of the actual self-documenting nfstat CWEB* code.
• One of the SAS files I make available includes an approximately equivalent SAS version of the rules incorporated in the original CWEB code, if you'd like to use that as a starting point.
----
* http://www-cs-faculty.stanford.edu/~knuth/cweb.html

55
"Why Do You Say 'An Approximately Equivalent' Mapping?"
• I hedged for a number of reasons, including:
-- the ordering of tests is not exactly the same, and since this is a "sieve" process where first match wins, that can make the ordering of matching rules potentially important
-- some port-to-applications documented in the CWEB program have evolved over time. For example, ports 5500-5503 are associated in the Weekly Report with the peer-to-peer application Hotline, but I believe that that 5500/tcp and some nearby ports are also in common use in conjunction with VNC (e.g., see: http://www.accessgrid.org/agdp/guide/ports/1.03/x149.html )
-- Unlike the weekly report, I split out applications traffic which users both tcp and udp traffic
56
If You Try Working With Internet2 Netflow Data And Run Into A Problem...• Please feel free to drop me a note -- I'd be delighted to help
you out in any way if I can!