Embed Size (px)
Citation preview
International Journal of
Environmental Research
and Public Health
Article
A Machine Learning Approach for Investigating Delirium as aMultifactorial Syndrome
Honoria Ocagli 1 , Daniele Bottigliengo 1, Giulia Lorenzoni 1 , Danila Azzolina 1,2 , Aslihan S. Acar 3 ,Silvia Sorgato 4, Lucia Stivanello 4, Mario Degan 4 and Dario Gregori 1,*
�����������������
Citation: Ocagli, H.; Bottigliengo, D.;
Lorenzoni, G.; Azzolina, D.; Acar,
A.S.; Sorgato, S.; Stivanello, L.; Degan,
M.; Gregori, D. A Machine Learning
Approach for Investigating Delirium
as a Multifactorial Syndrome. Int. J.
Environ. Res. Public Health 2021, 18,
7105. https://doi.org/10.3390/
ijerph18137105
Academic Editors: Francisco
José Tarazona Santabalbina, José Viña,
Sebastià Josep Santaeugènia Gonzàlez
and José Augusto García Navarro
Received: 26 April 2021
Accepted: 14 June 2021
Published: 2 July 2021
Publisher’s Note: MDPI stays neutral
with regard to jurisdictional claims in
published maps and institutional affil-
iations.
Copyright: © 2021 by the authors.
Licensee MDPI, Basel, Switzerland.
This article is an open access article
distributed under the terms and
conditions of the Creative Commons
Attribution (CC BY) license (https://
creativecommons.org/licenses/by/
4.0/).
1 Unit of Biostatistics, Epidemiology and Public Health, Department of Cardiac, Thoracic, Vascular Sciencesand Public Health, University of Padova, Via Loredan 18, 35121 Padova, Italy; [email protected] (H.O.);[email protected] (D.B.); [email protected] (G.L.); [email protected] (D.A.)
2 Department of Medical Science, University of Ferrara, Via Fossato di Mortara 64B, 44121 Ferrara, Italy3 Department of Actuarial Sciences, Hacettepe University, Ankara 06800, Turkey; [email protected] Health Professional Management Service (DPS) of the University Hospital of Padova, 35128 Padova, Italy;
[email protected] (S.S.); [email protected] (L.S.);[email protected] (M.D.)
* Correspondence: [email protected]; Tel.: +39-049-827-5384
Abstract: Delirium is a psycho-organic syndrome common in hospitalized patients, especially theelderly, and is associated with poor clinical outcomes. This study aims to identify the predictorsthat are mostly associated with the risk of delirium episodes using a machine learning technique(MLT). A random forest (RF) algorithm was used to evaluate the association between the subject’scharacteristics and the 4AT (the 4 A’s test) score screening tool for delirium. RF algorithm wasimplemented using information based on demographic characteristics, comorbidities, drugs andprocedures. Of the 78 patients enrolled in the study, 49 (63%) were at risk for delirium, 32 (41%)had at least one episode of delirium during the hospitalization (38% in orthopedics and 31% both ininternal medicine and in the geriatric ward). The model explained 75.8% of the variability of the 4ATscore with a root mean squared error of 3.29. Higher age, the presence of dementia, physical restraint,diabetes and a lower degree are the variables associated with an increase of the 4AT score. Randomforest is a valid method for investigating the patients’ characteristics associated with delirium onsetalso in small case-series. The use of this model may allow for early detection of delirium onset toplan the proper adjustment in healthcare assistance.
Keywords: aging; nursing; delirium; machine learning technique; random forest
1. Introduction
Delirium is a psycho-organic syndrome characterized by an alteration in attention andconsciousness, with disorganized psychic activity, fragmentation of psychic processes thatappear untied and upset [1]. Delirium has a multifactorial etiology, in which internal pre-disposing factors (susceptibility) interact with external precipitating ones [2,3]. In contrastto dementia, delirium is often reversible with early detection and treatment of underlyingcauses [4]. For delirium, there are many risk factors that may change according to thecharacteristics of the patient. In literature, risk factors for delirium were evaluated insystematic reviews according to the type of patients. Risk of delirium is higher in veryold patients [5,6]. Marquetand et al. 2020 [6] in a recent work found that very old patientsrequire only few precipitant factors to develop delirium. Age was a risk factor also forpatients after hip fracture surgery [7], vascular surgery [8], in knee and hip replacementpatients [9]. Other risk factors are as follows: function dependency [7,10], hypertension [8],hearing or visual impairment [7,8], anesthetic use [11], and cognitive impairment [9,10].Older adults following elective surgery frailty and psychotropic medication have poten-tially modifiable prognosis factors [12].
Int. J. Environ. Res. Public Health 2021, 18, 7105. https://doi.org/10.3390/ijerph18137105 https://www.mdpi.com/journal/ijerph
Int. J. Environ. Res. Public Health 2021, 18, 7105 2 of 13
Delirium prevalence in the general population hospitalized is low (1–2%), but increasesfrom 29% to 64% in elderly [13], increasing morbidity, mortality, loss of independence,length of stay, and institutionalization. Delirium prevalence also affects health care costs,which amount to over $164 billion in the United States [14]. In the Italian territory, deliriumprevalence is as follows: 11% in medical wards [15], 20% in the general hospital [5], 23%in general wards [16,17] and up to 37% of patients with subsyndromal delirium [18].Given its pervasive nature and deleterious effects, delirium surveillance is recommendedfor hospitalized patients [19]. Under-detection or misdiagnosis is estimated in 50–75%of delirium cases [20], and 30–40% of reported delirium episodes are preventable [21].In addition, delirium detection is complicated by the characteristics of hospitalized patientswho are often frail elderly and, therefore, more susceptible to delirium onset, especiallyduring hospitalization where the intensification of treatments and diagnostic interventionsbecome potentially precipitant factors [15].
DSM-V criteria are the standard for the diagnosis of delirium in clinical setting.Recently, time-efficient tools have been developed in the clinical setting for deliriumdetection and diagnosis [22]. In literature, there are several tools for facilitating deliriumdetection [22,23], such as the Confusion Assessment Method (CAM) [24], 4AT test [25],and the most recent Nursing DElirium SCreening (Nu-DESC) tool [19]. Both CAM [26–28]and Nu-DESC scales were used to compare the ability of random forest (RF) models inpredicting the risk of delirium episodes. The structure of these tools shows similar domains.Nu-DESC has five domains: (1) disorientation, (2) inadequate behavior, (3) inadequatecommunication, (4) hallucination, and (5) psychomotor delay. CAM consists, instead, offour main themes: (1) acute onset and fluctuating course, (2) inattention, (3) disorganizedthinking, and (4) altered level of consciousness. Bellelli [25], for the first time, used the 4ATscore to assess patients at risk for delirium. Machine learning techniques (MLTs) have beenwidely used in data-driven prediction models, for example in dementia [29], or delirium aswell with performances comparable with traditional logistic regression [26] and includedinto clinical workflow [30].
The study has a twofold goal: (1) to identify, using a machine learning approach,which subject’s characteristics are mostly associated with 4AT score and how they impactits variability and (2) to evaluate delirium presence/absence in older patients during thefirst five days of hospitalization using a standardized tool which is the 4AT instrument.
2. Materials and Methods2.1. Study Design and Inclusion Criteria
This observational study has taken place between August and September 2016 in theOrthopedics, Geriatrics, and General Medicine wards of the University Hospital of Padova.The inclusion criteria for the enrolled patients were as follows; aged above 65 years old,understanding he Italian language and length of stay of at least five days. Patients with apsychiatric illness already diagnosed at admission, with communication problems (such asaphasia, coma status), or with a terminal disease, were excluded from the study.
An experienced nurse explained the purpose of the study and obtained informedconsent from the patient or his next of kin when the participant was unable to give hisconsent. Study participants were evaluated with the 4AT instrument by three trainednursing students. The project was conducted within the framework of thesis preparation ofthe nursing student and it was approved by the internal offices at the University Hospitalof Padova.
2.2. Variables Collected
Each patient was assessed for delirium with the 4AT scale [25] at least 24 h after theadmission and each day till the fifth day of hospitalization. For each patient, the followingvariables were collected in different moments: (i) at hospital admission: socio-demographiccharacteristics such as ward, age, diagnosis, degree of study, comorbidities potentiallyaffecting the delirium onset (dementia, alcoholism, drugs addiction, depression, other
Int. J. Environ. Res. Public Health 2021, 18, 7105 3 of 13
psychiatric diseases, diabetes, cancer, malnutrition); previous admission to hospital, historyof delirium, hearing and visual impairment; (ii) daily variables during the hospitalization:sleep deprivation, hours of caregiver assistance, 4AT score; (iii) each shift (three times perday, morning, afternoon and night): mobility (bed transfer-chair, walking, use of stairs);physical restraint; presence/absence of invasive device (urinary catheter, peripheric venouscatheter, central venous catheter, feeding tube, percutaneous endoscopic gastrostomy);pain, fever, surgery; drugs (affecting central nervous system: anticholinergic, dopaminergic,steroid, opioid, antiepileptic, anti-anxiety, neuroleptics, antidepressants); and antibiotics(quinolone, antifungal voriconazole and cephalosporins).
2.3. Instrument
The 4AT [25] is a short and handy instrument for routine detection of delirium andcognitive impairment by unskilled hospital personnel; on average, it takes less than twominutes to fill it. The total score ranges from 0 to 12 and is structured in 4 domains(alertness, orientation, attention and fluctuation). The compilation of items 1–3 is basedexclusively on the patient’s observation at the time of the evaluation, Item 4 compilation,requires instead the collection of information from multiple sources. A score of 0 suggeststhat delirium and/or cognitive impairment are unlikely but do not exclude them. Ascore of 1–3 is suggestive of cognitive impairment and requires a more detailed cognitiveexamination, whereas a score higher than four suggests for delirium and requires furtherclinical assessment since the tool is not diagnostic. The instrument has a sensitivity of 89.7%and a specificity of 84.1% with a positive likelihood ratio of 5.62 and a negative likelihoodratio of 0.12 in the validation study [31]. However, it has shown a poor specificity, whichranges from 53.7% (95% CI: 48.1–59.2) [32] to 0.91 (0.88–0.94) [33]. The instrument wasvalidated in the elderly population in several languages [34,35], various contexts such asthe emergency department [33], hospice [36], stroke unit [37,38], medical ward [32] andin different cultural backgrounds [39]. The instrument also has some limitations; it is notsuitable for patients with impaired communications and the mere presence of changes inalertness or a fluctuating course of the mental status is sufficient to define the patient atrisk for delirium [35].
2.4. Statistical Analysis
Categorical variables were summarized according to delirium profile groups, withrelative and absolute frequencies. As only categorical variables were considered, theChi-square test was performed. The p-values were also reported for all possible pairwisecomparisons between delirium categories. For these comparisons, the Benjamini-Hochbergadjusted p-values and the unadjusted p-values have been computed [40].
A p-value lower than 0.05 is conventionally considered meaningful.The effective sample size on the observations was computed using Kish [41] formula
as follows: (i) the scores of simple standard deviation (SSD) and the robust to heteroskedas-ticity standard deviation (RSD), were obtained using individuals as clusters; (ii) the ratiobetween RSD and SSD was computed; (iii) the effective sample size was retrieved as theratio between the number of observations in the sample and the ratio computed at theprevious step. Records with missing assessment of delirium were removed.
A logistic regression model was calculated to assess the time effect on the risk ofdeveloping delirium and having delirium during the hospitalization. The variance esti-mates were calculated by considering the Huber–White [42] estimator to account for thecorrelation within repeated measurements. Patients with a score higher than one wereconsidered at risk for delirium.
2.5. Machine Learning Approach
An ML approach was used to evaluate the association between the subject’s character-istics and the 4AT score. MLTs can easily detect non-linear relationships and interactionsand can be used with a low number of subjects, in a case where the standard statistical
Int. J. Environ. Res. Public Health 2021, 18, 7105 4 of 13
approaches may have some limitations [43]. The random Forest algorithm, one of the mostpopular methods in the MLT field [44], was implemented to describe the 4AT score basedon the following set of predictors: age, gender, physical restraint, mobility, dementia, dia-betes, cancer, ward, degree level, previous episodes of delirium and admission to hospital,and addiction (at least one between alcoholism, drugs addiction, depression, and otherpsychiatric diseases); at least one antibiotic; at least one drugs affecting the central nervoussystem, at least one invasive device, at least one among pain and fever, at least one amongvisual and hearing impairment.
The parameters of the algorithm were chosen such that the root mean squared error(RMSE), i.e., the root of the average squared difference between observed and predictedthe 4AT score, was minimized. The RF algorithm was implemented using 10,000 trees.
The database is composed of repeated measurements within-subject; for this reason,the RF algorithm has been forced to use stratified sampling within each subject as indicatedin the literature for cluster correlated data [45].
Variable importance using the permutation method [46] was used to assess the predic-tors that mostly impact the variability of the 4AT score. Partial dependence plots (PDPs)were used to depict how the 4AT score changes given the characteristics of the subjects [47].Briefly, PDPs represent the score values predicted by the model for predictor’s value bymarginalizing over the values of the other variables which were observed in the sample.PDPs are often used to aid the interpretation of an ML model by describing the relationshipbetween a predictor and an outcome.
Analyses were performed using R software 3.6.1 (CRAN: Viena, Austria) [48]. The RFalgorithm was implemented using the randomForestSRC R package (version 2.9.1) (CRAN:Viena, Austria) [49].
3. Results
In the study, 78 patients were enrolled, for a total of 1149 observations entered in themodel and an effective sample size of 95 independent observations computed using theformula from Kish [41]. A total of 49 (63%) patients were at risk for delirium (4AT scorehigher than 1), 32 (41%) patients experienced delirium at least once (4AT score higher than 4)during their stay. In both cases are prevalently present in geriatrics ward, respectively 23(96%) and 14 (58%), and in orthopedics ward, 17 (57%) and 12 (40%) respectively. Patientsat risk for delirium were mainly females were 52 (64%) of the population, with a medium–low education level and an age between 80 and 90 years. A statistical description of thewhole sample according to the 4AT score profile group at baseline assessment is reportedin Table 1.
Table 1. Descriptive statistics of the whole sample according to the 4AT score profile group at baseline assessment.Categorical variables were summarized as relative and absolute frequencies. Pearson Chi-square test was used to assessdifferences across 4AT scale categories.
Variable Variable Level n
Delirium or SevereCognitive
ImpairmentUnlikely
PossibleCognitive
Impairment
PossibleDelirium +/−
CognitiveImpairment
Overall p-ValueUnadjusted Pairwise p-Value Adjusted Pairwise p-Value
PCIvs. D/CI
PCIvs. PD
D/CIvs. PD
PCIvs. D/CI
PCIvs. PD
D/CIvs. PD
(n = 31) (n = 28) (n = 18) (n = 77) *
Ward Medicine 78 16 (52%) 5 (18%) 3 (17%) 24 (31%) <0.001 0.235 <0.001 0.004 0.235 0.003 0.006Geriatric 1 (3%) 16 (57%) 7 (39%) 24 (31%)
Orthopedic 14 (45%) 7 (25%) 8 (44%) 29 (38%)Gender Male 78 12 (39%) 8 (29%) 6 (33%) 26 (34%) 0.71 0.746 0.161 0.305 0.746 0.4575 0.4575
ICDdiagnosis
Circulatorysystem 35 0 (0%) 1 (10%) 0 (0%) 1 (3%) 0.17 0.259 0.135 0.32 0.32 0.32 0.32
Musculoskeletalsystem 14 (93%) 7 (70%) 8 (89%) 29 (85%)
Digestivesystem 0 (0%) 0 (0%) 1 (11%) 1 (3%)
Respiratory 1 (7%) 0 (0%) 0 (0%) 1 (3%)Undefined 0 (0%) 2 (20%) 0 (0%) 2 (6%)
Educationallevel
Bachelor’sdegree 78 2 (6%) 0 (0%) 1 (6%) 3 (4%) 0.24 0.533 0.044 0.262 0.533 0.132 0.393
None 0 (0%) 5 (18%) 2 (11%) 7 (9%)Missing 1 (3%) 0 (0%) 0 (0%) 48 (63%)Primaryschool 23 (74%) 14 (50%) 11(61%) 13 (17%)
Secondaryschool 4 (13%) 7 (24%) 2 (11%) 5 (7%)
Int. J. Environ. Res. Public Health 2021, 18, 7105 5 of 13
Table 1. Cont.
Variable Variable Level n
Delirium or SevereCognitive
ImpairmentUnlikely
PossibleCognitive
Impairment
PossibleDelirium +/−
CognitiveImpairment
Overall p-ValueUnadjusted Pairwise p-Value Adjusted Pairwise p-Value
PCIvs. D/CI
PCIvs. PD
D/CIvs. PD
PCIvs. D/CI
PCIvs. PD
D/CIvs. PD
(n = 31) (n = 28) (n = 18) (n = 77) *
High school 1 (3%) 2 (7%) 2 (11%) 18 (23%)Dementia 78 2 (6%) 8 (29%) 8 (44%) 1 (1%) 0.007 0.181 0.028 0.001 0.181 0.042 0.003Alcohol
use 78 1 (3%) 0 (0%) 0 (0%) 5 (6%) 0.47 0.329 0.454 0.454 0.454
Depression 78 2 (6%) 3 (11%) 0 (0%) 16 (21%) 0.35 0.17 0.586 0.285 0.4275 0.586 0.4275Diabetes 78 7 (23%) 4 (14%) 5 (28%) 29 (38%) 0.52 0.197 0.379 0.601 0.5685 0.5685 0.601Cancer 78 10 (32%) 11 (39%) 8 (44%) 71 (92%) 0.68 0.544 0.645 0.311 0.645 0.645 0.645
Previoushospital
admission78 27 (87%) 27 (96%) 17 (94%) 29 (38%) 0.38 0.696 0.185 0.446 0.696 0.555 0.669
Visual im-pairment 78 13 (42%) 7 (25%) 9 (50%) 29 (38%) 0.19 0.048 0.144 0.464 0.144 0.216 0.464
Hearingimpair-ment
78 8 (26%) 10 (36%) 11 (61%) 14 (18%) 0.047 0.17 0.313 0.024 0.255 0.313 0.072
Antibiotics >1 78 6 (19%) 8 (28%) 0 (0%) 5 (6%) 0.071 0.02 0.45 0.05 0.05 0.45 0.08age
(classes) <70 78 4 (13%) 1 (4%) 0 (0%) 3 (4%) 0.035 0.108 0.127 0.039 0.127 0.127 0.117
>95 1 (3%) 0 (0%) 2 (11%) 5 (6%)71–75 3 (10%) 0 (0%) 2 (11%) 11 (14%)76–80 6 (19%) 4 (14%) 1 (6%) 19 (25%)81–85 8 (26%) 8 (29%) 3 (17%) 21 (27%)86–90 8 (26%) 10 (36%) 3 (17%) 13 (17%)91–95 1 (3%) 5 (18%) 7 (39%)
n: Reports the number of patients in which calculations were made. * One patient had no assessment in the 4AT score at baseline.Abbreviations: PCI: possible cognitive impairment, D/CI: delirium or severe cognitive impairment unlikely, possible cognitive impairment,PD: possible delirium +/− cognitive impairment.
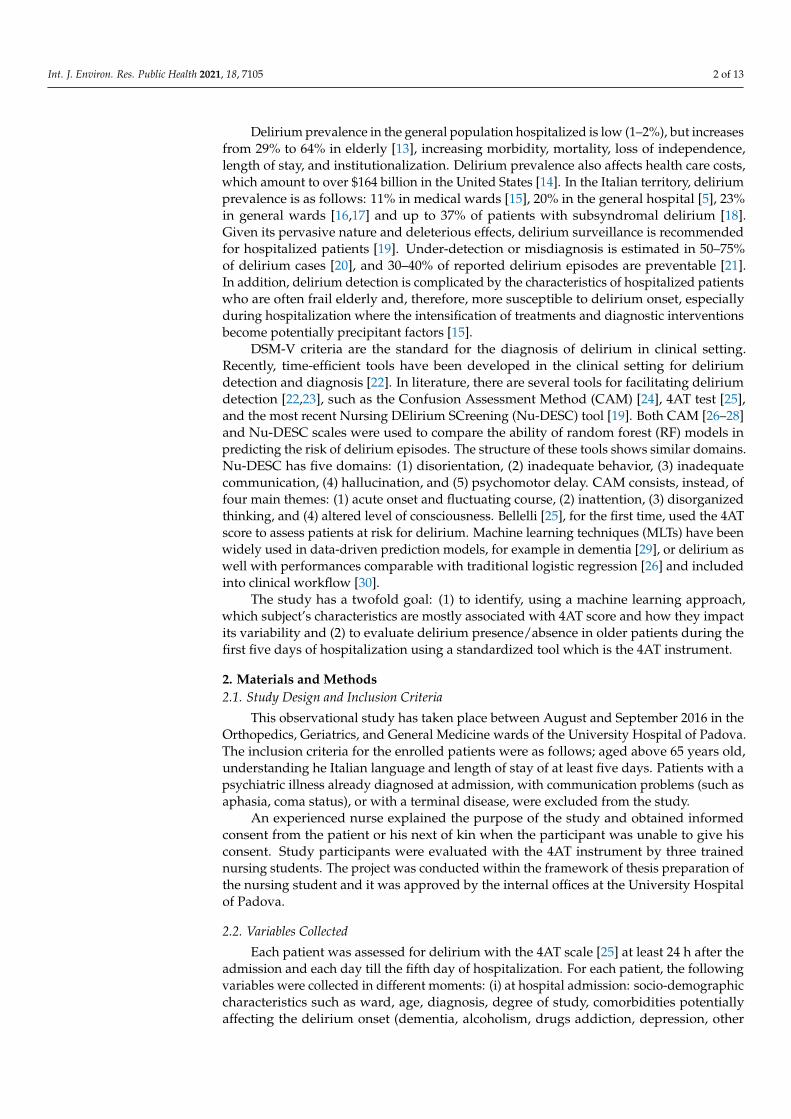
The logistic regression model shows a p-value of 0.09 indicating a non-significanteffect of hospitalization time on the risk of developing delirium or cognitive impairment.The same finding has been identified (p-value 0.08) by considering the possible time effecton the risk of developing delirium during the hospitalization. The prevalence of patientsat risk for delirium for each day varies from 53% to 60% (Figure 1, blue line). Instead,the prevalence of delirium (4AT score higher than 4) for each day varies from 19% to 29%(Figure 1, red line).
Figure 1. Proportions of patients reporting delirium and risk for delirium during the first five daysof hospitalization. The delirium state indicates a 4AT score higher than 4; the delirium or cognitiveimpairment (CI) state indicates a 4AT score higher than 1.
Patients with a 4AT score that suggest delirium or cognitive impairment were preva-lently in geriatrics 7 (39%) and orthopedics 8 (44%) wards (p-value < 0.001), had mainlydementia 8 (44%, p-value 0.007) and were aged between 91–95 years of age 7 (39%, p-value0.035) (Table 1).
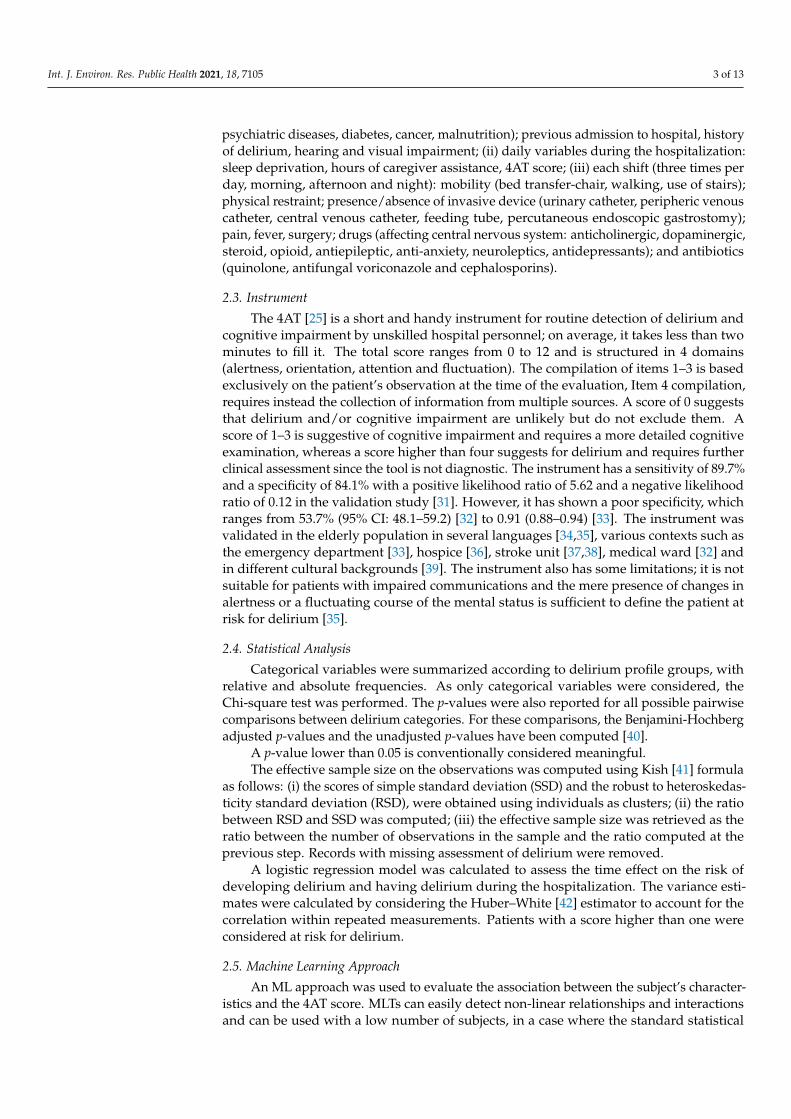
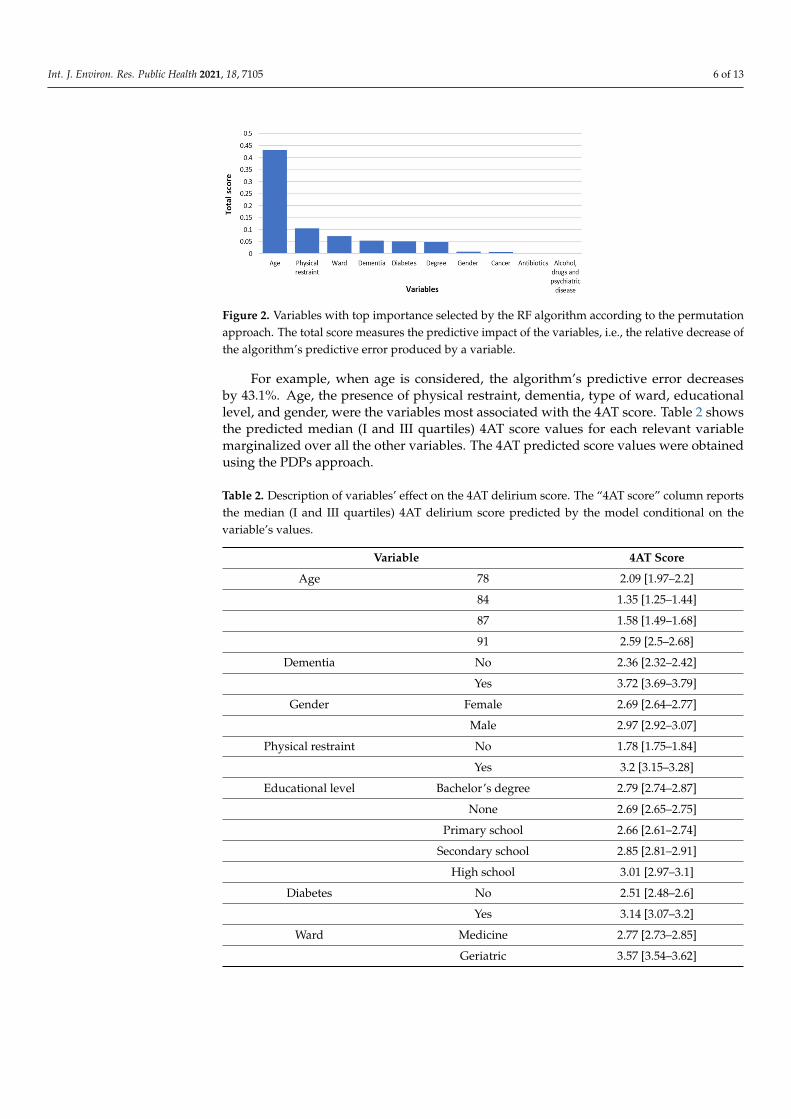
The RF model explained 75.8% of the variability of the 4AT score with an RMSE of 3.29,i.e., the average difference between the observed and predicted 4AT values is 3.29 points.Figure 2 shows the ranking of the predictors according to the importance attributed by thealgorithm measured by the associated relative decrease in the model’s predictive error.
Int. J. Environ. Res. Public Health 2021, 18, 7105 6 of 13
Figure 2. Variables with top importance selected by the RF algorithm according to the permutationapproach. The total score measures the predictive impact of the variables, i.e., the relative decrease ofthe algorithm’s predictive error produced by a variable.
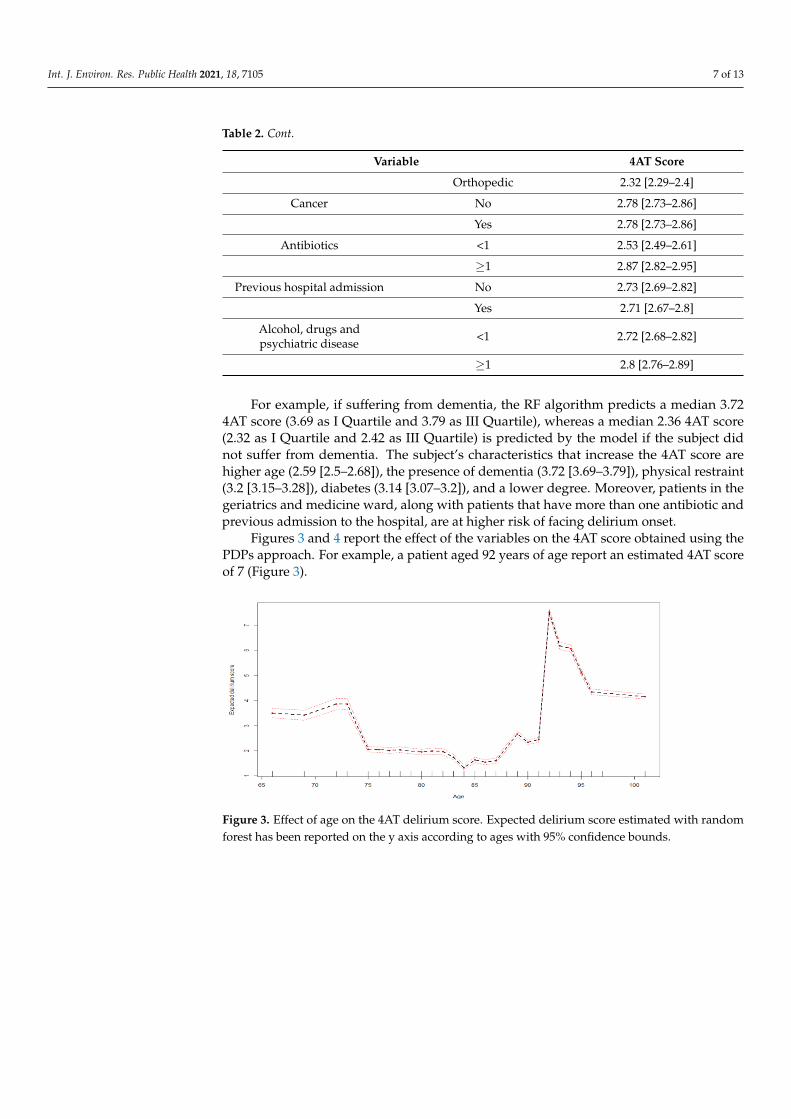
For example, when age is considered, the algorithm’s predictive error decreasesby 43.1%. Age, the presence of physical restraint, dementia, type of ward, educationallevel, and gender, were the variables most associated with the 4AT score. Table 2 showsthe predicted median (I and III quartiles) 4AT score values for each relevant variablemarginalized over all the other variables. The 4AT predicted score values were obtainedusing the PDPs approach.
Table 2. Description of variables’ effect on the 4AT delirium score. The “4AT score” column reportsthe median (I and III quartiles) 4AT delirium score predicted by the model conditional on thevariable’s values.
Variable 4AT Score
Age 78 2.09 [1.97–2.2]
84 1.35 [1.25–1.44]
87 1.58 [1.49–1.68]
91 2.59 [2.5–2.68]
Dementia No 2.36 [2.32–2.42]
Yes 3.72 [3.69–3.79]
Gender Female 2.69 [2.64–2.77]
Male 2.97 [2.92–3.07]
Physical restraint No 1.78 [1.75–1.84]
Yes 3.2 [3.15–3.28]
Educational level Bachelor’s degree 2.79 [2.74–2.87]
None 2.69 [2.65–2.75]
Primary school 2.66 [2.61–2.74]
Secondary school 2.85 [2.81–2.91]
High school 3.01 [2.97–3.1]
Diabetes No 2.51 [2.48–2.6]
Yes 3.14 [3.07–3.2]
Ward Medicine 2.77 [2.73–2.85]
Geriatric 3.57 [3.54–3.62]
Int. J. Environ. Res. Public Health 2021, 18, 7105 7 of 13
Table 2. Cont.
Variable 4AT Score
Orthopedic 2.32 [2.29–2.4]
Cancer No 2.78 [2.73–2.86]
Yes 2.78 [2.73–2.86]
Antibiotics <1 2.53 [2.49–2.61]
≥1 2.87 [2.82–2.95]
Previous hospital admission No 2.73 [2.69–2.82]
Yes 2.71 [2.67–2.8]
Alcohol, drugs andpsychiatric disease <1 2.72 [2.68–2.82]
≥1 2.8 [2.76–2.89]
For example, if suffering from dementia, the RF algorithm predicts a median 3.724AT score (3.69 as I Quartile and 3.79 as III Quartile), whereas a median 2.36 4AT score(2.32 as I Quartile and 2.42 as III Quartile) is predicted by the model if the subject didnot suffer from dementia. The subject’s characteristics that increase the 4AT score arehigher age (2.59 [2.5–2.68]), the presence of dementia (3.72 [3.69–3.79]), physical restraint(3.2 [3.15–3.28]), diabetes (3.14 [3.07–3.2]), and a lower degree. Moreover, patients in thegeriatrics and medicine ward, along with patients that have more than one antibiotic andprevious admission to the hospital, are at higher risk of facing delirium onset.
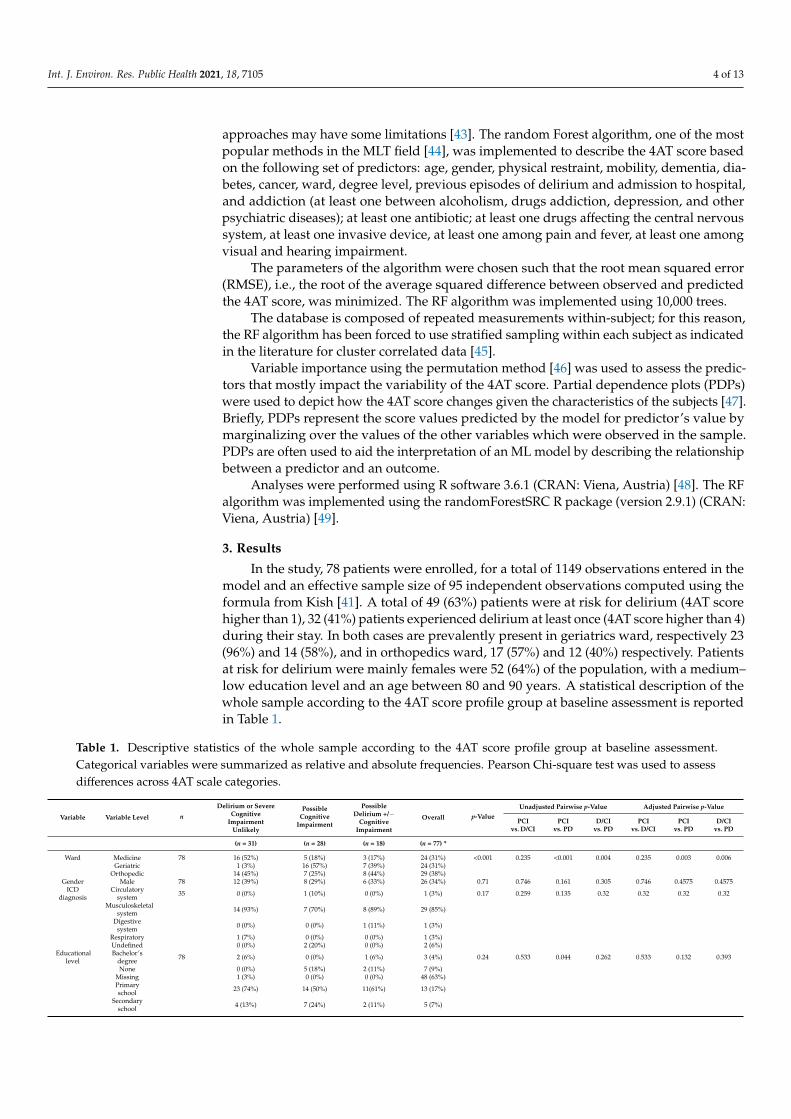
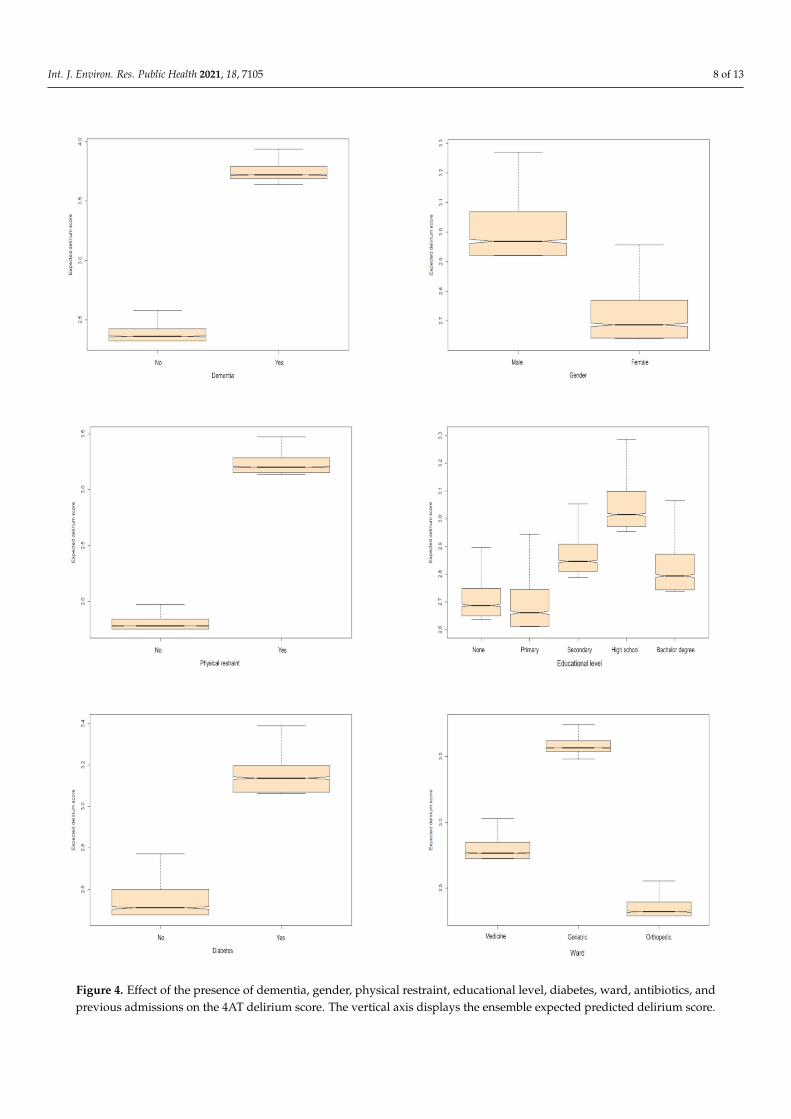
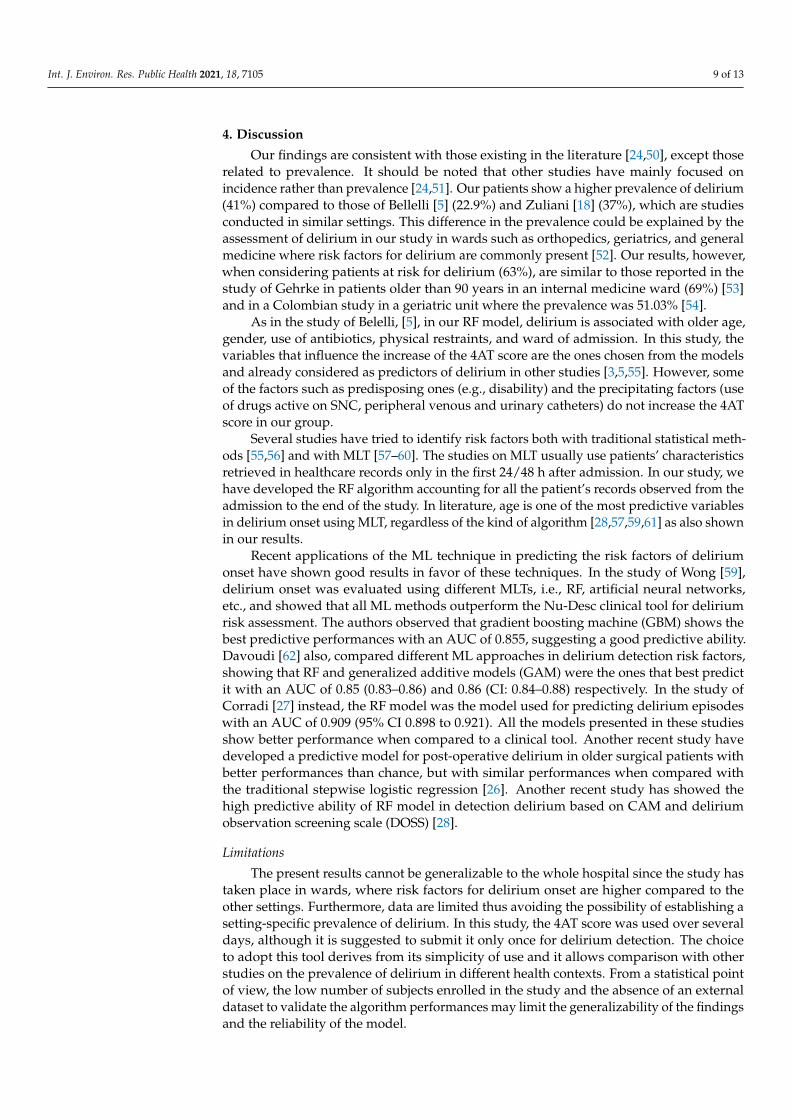
Figures 3 and 4 report the effect of the variables on the 4AT score obtained using thePDPs approach. For example, a patient aged 92 years of age report an estimated 4AT scoreof 7 (Figure 3).
Figure 3. Effect of age on the 4AT delirium score. Expected delirium score estimated with randomforest has been reported on the y axis according to ages with 95% confidence bounds.
Int. J. Environ. Res. Public Health 2021, 18, 7105 8 of 13
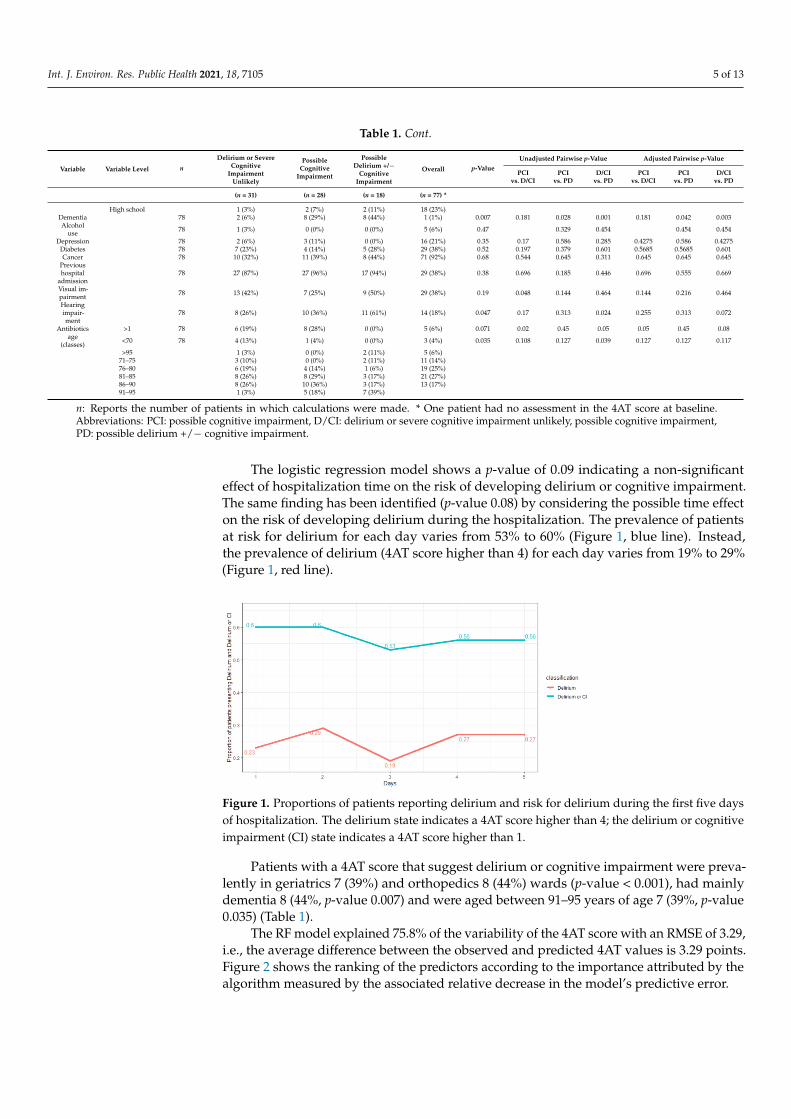
Figure 4. Effect of the presence of dementia, gender, physical restraint, educational level, diabetes, ward, antibiotics, andprevious admissions on the 4AT delirium score. The vertical axis displays the ensemble expected predicted delirium score.
Int. J. Environ. Res. Public Health 2021, 18, 7105 9 of 13
4. Discussion
Our findings are consistent with those existing in the literature [24,50], except thoserelated to prevalence. It should be noted that other studies have mainly focused onincidence rather than prevalence [24,51]. Our patients show a higher prevalence of delirium(41%) compared to those of Bellelli [5] (22.9%) and Zuliani [18] (37%), which are studiesconducted in similar settings. This difference in the prevalence could be explained by theassessment of delirium in our study in wards such as orthopedics, geriatrics, and generalmedicine where risk factors for delirium are commonly present [52]. Our results, however,when considering patients at risk for delirium (63%), are similar to those reported in thestudy of Gehrke in patients older than 90 years in an internal medicine ward (69%) [53]and in a Colombian study in a geriatric unit where the prevalence was 51.03% [54].
As in the study of Belelli, [5], in our RF model, delirium is associated with older age,gender, use of antibiotics, physical restraints, and ward of admission. In this study, thevariables that influence the increase of the 4AT score are the ones chosen from the modelsand already considered as predictors of delirium in other studies [3,5,55]. However, someof the factors such as predisposing ones (e.g., disability) and the precipitating factors (useof drugs active on SNC, peripheral venous and urinary catheters) do not increase the 4ATscore in our group.
Several studies have tried to identify risk factors both with traditional statistical meth-ods [55,56] and with MLT [57–60]. The studies on MLT usually use patients’ characteristicsretrieved in healthcare records only in the first 24/48 h after admission. In our study, wehave developed the RF algorithm accounting for all the patient’s records observed from theadmission to the end of the study. In literature, age is one of the most predictive variablesin delirium onset using MLT, regardless of the kind of algorithm [28,57,59,61] as also shownin our results.
Recent applications of the ML technique in predicting the risk factors of deliriumonset have shown good results in favor of these techniques. In the study of Wong [59],delirium onset was evaluated using different MLTs, i.e., RF, artificial neural networks,etc., and showed that all ML methods outperform the Nu-Desc clinical tool for deliriumrisk assessment. The authors observed that gradient boosting machine (GBM) shows thebest predictive performances with an AUC of 0.855, suggesting a good predictive ability.Davoudi [62] also, compared different ML approaches in delirium detection risk factors,showing that RF and generalized additive models (GAM) were the ones that best predictit with an AUC of 0.85 (0.83–0.86) and 0.86 (CI: 0.84–0.88) respectively. In the study ofCorradi [27] instead, the RF model was the model used for predicting delirium episodeswith an AUC of 0.909 (95% CI 0.898 to 0.921). All the models presented in these studiesshow better performance when compared to a clinical tool. Another recent study havedeveloped a predictive model for post-operative delirium in older surgical patients withbetter performances than chance, but with similar performances when compared withthe traditional stepwise logistic regression [26]. Another recent study has showed thehigh predictive ability of RF model in detection delirium based on CAM and deliriumobservation screening scale (DOSS) [28].
Limitations
The present results cannot be generalizable to the whole hospital since the study hastaken place in wards, where risk factors for delirium onset are higher compared to theother settings. Furthermore, data are limited thus avoiding the possibility of establishing asetting-specific prevalence of delirium. In this study, the 4AT score was used over severaldays, although it is suggested to submit it only once for delirium detection. The choiceto adopt this tool derives from its simplicity of use and it allows comparison with otherstudies on the prevalence of delirium in different health contexts. From a statistical pointof view, the low number of subjects enrolled in the study and the absence of an externaldataset to validate the algorithm performances may limit the generalizability of the findingsand the reliability of the model.
Int. J. Environ. Res. Public Health 2021, 18, 7105 10 of 13
The present results show that MLT can identify complex relationship among data, soin the future it would be interesting to use those techniques to define delirium risk factorsinstead of traditional approaches. Moreover, it would be important to consider deliriumas a “dynamic” condition influenced by different factors that are working in differentmoments as also theorized by Fan et al. [60] and applied in a recent work of our group [61].
5. Conclusions
Early detection of delirium must be a purpose to pursue in wards with a high per-centage of risk factors, to adequately treat them and to avoid side effects. The routineuses of a simple instrument, such as the 4AT scale, could help to increase the awareness ofdelirium among health care workers. Healthcare personnel, especially nurses, thanks totheir strictly engagements with patients, must be trained to easily recognize risk factorsfor delirium. As hypothesized in the recent work of Oberai et al. 2021 [57], nurses requireeducational intervention that include a variety of teaching style. Moreover, our results,following existing literature, shows that to predict correctly delirium is more useful touse predictive models that consider many factors collected routinely. These methods mayalso help in small case-series even if they are thought to be useful for large data sets. MLTcan identify complex relations between variables and are helpful in structuring predictivemodels to personalize healthcare assistance.
Author Contributions: Conceptualization, D.G. and M.D.; methodology, D.G.; formal analysis, D.B.and D.A.; resources, M.D. and L.S.; data curation, D.B.; writing—original draft preparation, H.O.;writing—review and editing, S.S., D.A., G.L., A.S.A.; supervision, D.G. and G.L.; project administra-tion, M.D. and L.S. All authors have read and agreed to the published version of the manuscript.
Funding: This research received no external funding.
Institutional Review Board Statement: Ethical review and approval were waived for this study,since the project was conducted within the framework thesis preparation of the nursing student,and it was approved by the internal offices at the University Hospital of Padova. This study isbased on data collected in the context of the routine clinical practice. Patients, during hospitaladmission, provided their consent for the data treatment for scientific purposes. Patients’ data ofthis retrospective study were completely anonymized before analysis. For this reason, it was notnecessary to have ethical board approval.
Informed Consent Statement: Informed consent was obtained from all subjects involved in the study.
Data Availability Statement: The data presented in this study are available on request from thecorresponding author. The data are not publicly available due to privacy.
Conflicts of Interest: The authors declare no conflict of interest.
References1. American Psychiatric Association. Diagnostic and Statistical Manual of Mental Disorders, 5th ed.; American Psychiatric Association:
Washington, DC, USA, 2013; ISBN 978-0-89042-555-8.2. Bellelli, G.; Brathwaite, J.S.; Mazzola, P. Delirium: A Marker of Vulnerability in Older People. Front. Aging Neurosci. 2021, 13,
626127. [CrossRef] [PubMed]3. Inouye, S.K. Predisposing and Precipitating Factors for Delirium in Hospitalized Older Patients. Dement. Geriatr. Cogn. Disord.
1999, 10, 393–400. [CrossRef] [PubMed]4. Bull, M.J.; Boaz, L.; Jermé, M. Educating Family Caregivers for Older Adults about Delirium: A Systematic Review. Worldviews
Evid. Based Nurs. 2016, 13, 232–240. [CrossRef] [PubMed]5. Bellelli, G.; Morandi, A.; Di Santo, S.G.; Mazzone, A.; Cherubini, A.; Mossello, E.; Bo, M.; Bianchetti, A.; Rozzini, R.; Zanetti,
E.; et al. “Delirium Day”: A Nationwide Point Prevalence Study of Delirium in Older Hospitalized Patients Using an EasyStandardized Diagnostic Tool. BMC Med. 2016, 14, 106. [CrossRef]
6. Marquetand, J.; Bode, L.; Fuchs, S.; Hildenbrand, F.; Ernst, J.; von Kaenel, R.; Boettger, S. Risk Factors for Delirium Are Different inthe Very Old: A Comparative One-Year Prospective Cohort Study of 5831 Patients. Front. Psychiatry 2021, 12, 655087. [CrossRef]
7. Wu, J.; Yin, Y.; Jin, M.; Li, B. The Risk Factors for Postoperative Delirium in Adult Patients after Hip Fracture Surgery: ASystematic Review and Meta-Analysis. Int. J. Geriatr. Psychiatry 2021, 36, 3–14. [CrossRef]
8. Visser, L.; Prent, A.; Banning, L.B.D.; van Leeuwen, B.L.; Zeebregts, C.J.; Pol, R.A. Risk Factors for Delirium after Vascular Surgery:A Systematic Review and Meta-Analysis. Ann. Vasc. Surg. 2021. [CrossRef]
Int. J. Environ. Res. Public Health 2021, 18, 7105 11 of 13
9. Rong, X.; Ding, Z.-C.; Yu, H.; Yao, S.-Y.; Zhou, Z.-K. Risk Factors of Postoperative Delirium in the Knee and Hip ReplacementPatients: A Systematic Review and Meta-Analysis. J. Orthop. Surg. 2021, 16, 76. [CrossRef]
10. Tomlinson, E.J.; Phillips, N.M.; Mohebbi, M.; Hutchinson, A.M. Risk Factors for Incident Delirium in an Acute General MedicalSetting: A Retrospective Case–Control Study. J. Clin. Nurs. 2017, 26, 658–667. [CrossRef]
11. Zhou, S.; Deng, F.; Zhang, J.; Chen, G. Incidence and Risk Factors for Postoperative Delirium after Liver Transplantation: ASystematic Review and Meta-Analysis. Eur. Rev. Med. Pharmacol. Sci. 2021, 25, 3246–3253. [CrossRef]
12. Watt, J.; Tricco, A.C.; Talbot-Hamon, C.; Pham, B.; Rios, P.; Grudniewicz, A.; Wong, C.; Sinclair, D.; Straus, S.E. Identifying OlderAdults at Risk of Delirium Following Elective Surgery: A Systematic Review and Meta-Analysis. J. Gen. Intern. Med. 2018, 33,500–509. [CrossRef]
13. Maldonado, J.R. Delirium in the Acute Care Setting: Characteristics, Diagnosis and Treatment. Crit. Care Clin. 2008, 24,657–722. [CrossRef]
14. Leslie, D.L.; Marcantonio, E.R.; Zhang, Y.; Leo-Summers, L.; Inouye, S.K. One-Year Health Care Costs Associated with Deliriumin the Elderly Population. Arch. Intern. Med. 2008, 168, 27–32. [CrossRef]
15. Fortini, A.; Morettini, A.; Tavernese, G.; Facchini, S.; Tofani, L.; Pazzi, M. Delirium in Elderly Patients Hospitalized in InternalMedicine Wards. Intern. Emerg. Med. 2014, 9, 435–441. [CrossRef]
16. Morandi, A.; Di Santo, S.G.; Cherubini, A.; Mossello, E.; Meagher, D.; Mazzone, A.; Bianchetti, A.; Ferrara, N.; Ferrari, A.; Musicco,M.; et al. Clinical Features Associated with Delirium Motor Subtypes in Older Inpatients: Results of a Multicenter Study. Am. J.Geriatr. Psychiatry 2017, 25, 1064–1071. [CrossRef]
17. Mossello, E.; Tesi, F.; Santo, S.G.D.; Mazzone, A.; Torrini, M.; Cherubini, A.; Bo, M.; Musicco, M.; Bianchetti, A.; Ferrari, A.; et al.Recognition of Delirium Features in Clinical Practice: Data from the “Delirium Day 2015” National Survey. J. Am. Geriatr. Soc.2018, 66, 302–308. [CrossRef]
18. Zuliani, G.; Bonetti, F.; Magon, S.; Prandini, S.; Sioulis, F.; D’Amato, M.; Zampi, E.; Gasperini, B.; Cherubini, A. Subsyn-dromal Delirium and Its Determinants in Elderly Patients Hospitalized for Acute Medical Illness. J. Gerontol. 2013, 68,1296–1302. [CrossRef]
19. Hargrave, A.; Bastiaens, J.; Bourgeois, J.A.; Neuhaus, J.; Josephson, S.A.; Chinn, J.; Lee, M.; Leung, J.; Douglas, V. Validation of aNurse-Based Delirium-Screening Tool for Hospitalized Patients. Psychosomatics 2017, 58, 594–603. [CrossRef]
20. Kean, J.; Ryan, K. Delirium Detection in Clinical Practice and Research: Critique of Current Tools and Suggestions for FutureDevelopment. J. Psychosom. Res. 2008, 65, 255–259. [CrossRef]
21. Hshieh, T.T.; Yue, J.; Oh, E.; Puelle, M.; Dowal, S.; Travison, T.; Inouye, S.K. Effectiveness of Multi-Component Non-PharmacologicDelirium Interventions: A Meta-Analysis. JAMA Intern. Med. 2015, 175, 512–520. [CrossRef]
22. Wong, C.L.; Holroyd-Leduc, J.; Simel, D.L.; Straus, S.E. Does This Patient Have Delirium? Value of Bedside Instruments. JAMA2010, 304, 779–786. [CrossRef] [PubMed]
23. Van Velthuijsen, E.L.; Zwakhalen, S.M.G.; Warnier, R.M.J.; Mulder, W.J.; Verhey, F.R.J.; Kempen, G.I.J.M. Psychometric Propertiesand Feasibility of Instruments for the Detection of Delirium in Older Hospitalized Patients: A Systematic Review. Int. J. Geriatr.Psychiatry 2016, 31, 974–989. [CrossRef] [PubMed]
24. Inouye, S.K.; Westendorp, R.G.J.; Saczynski, J.S. Delirium in Elderly People. Lancet 2014, 383, 911–922. [CrossRef]25. Bellelli, G.; Morandi, A.; Davis, D.H.J.; Mazzola, P.; Turco, R.; Gentile, S.; Ryan, T.; Cash, H.; Guerini, F.; Torpilliesi, T.; et al.
Validation of the 4AT, a New Instrument for Rapid Delirium Screening: A Study in 234 Hospitalised Older People. Age Ageing2014, 43, 496–502. [CrossRef]
26. Racine, A.M.; Tommet, D.; D’Aquila, M.L.; Fong, T.G.; Gou, Y.; Tabloski, P.A.; Metzger, E.D.; Hshieh, T.T.; Schmitt, E.M.;Vasunilashorn, S.M.; et al. Machine Learning to Develop and Internally Validate a Predictive Model for Post-Operative Deliriumin a Prospective, Observational Clinical Cohort Study of Older Surgical Patients. J. Gen. Intern. Med. 2021, 36, 265–273. [CrossRef]
27. Corradi, J.P.; Thompson, S.; Mather, J.F.; Waszynski, C.M.; Dicks, R.S. Prediction of Incident Delirium Using a Random ForestClassifier. J. Med. Syst. 2018, 42, 261. [CrossRef]
28. Netzer, M.; Hackl, W.O.; Schaller, M.; Alber, L.; Marksteiner, J.; Ammenwerth, E. Evaluating Performance and Interpretabilityof Machine Learning Methods for Predicting Delirium in Gerontopsychiatric Patients. Stud. Health Technol. Inform. 2020, 271,121–128. [CrossRef]
29. Ford, E.; Sheppard, J.; Oliver, S.; Rooney, P.; Banerjee, S.; Cassell, J.A. Automated Detection of Patients with Dementia WhoseSymptoms Have Been Identified in Primary Care but Have No Formal Diagnosis: A Retrospective Case–Control Study UsingElectronic Primary Care Records. BMJ Open 2021, 11, e039248. [CrossRef]
30. Jauk, S.; Kramer, D.; Großauer, B.; Rienmüller, S.; Avian, A.; Berghold, A.; Leodolter, W.; Schulz, S. Risk Prediction of Delirium inHospitalized Patients Using Machine Learning: An Implementation and Prospective Evaluation Study. J. Am. Med. Inform. Assoc.2020, 27, 1383–1392. [CrossRef]
31. Hendry, K.; Quinn, T.J.; Evans, J.; Scortichini, V.; Miller, H.; Burns, J.; Cunnington, A.; Stott, D.J. Evaluation of Delirium ScreeningTools in Geriatric Medical Inpatients: A Diagnostic Test Accuracy Study. Age Ageing 2016, 45, 832–837. [CrossRef]
32. O’Sullivan, D.; Brady, N.; Manning, E.; O’Shea, E.; O’Grady, S.; O’Regan, N.; Timmons, S. Validation of the 6-Item CognitiveImpairment Test and the 4AT Test for Combined Delirium and Dementia Screening in Older Emergency Department Attendees.Age Ageing 2018, 47, 61–68. [CrossRef]
Int. J. Environ. Res. Public Health 2021, 18, 7105 12 of 13
33. Gagné, A.-J.; Voyer, P.; Boucher, V.; Nadeau, A.; Carmichael, P.-H.; Pelletier, M.; Gouin, E.; Berthelot, S.; Daoust, R.; Wilchesky, M.;et al. Performance of the French Version of the 4AT for Screening the Elderly for Delirium in the Emergency Department. Can. J.Emerg. Med. 2018, 20, 903–910. [CrossRef]
34. Kuladee, S.; Prachason, T. Development and Validation of the Thai Version of the 4 ‘A’s Test for Delirium Screening in HospitalizedElderly Patients with Acute Medical Illnesses. Neuropsychiatr. Dis. Treat. 2016, 12, 437–443. [CrossRef]
35. Baird, L.; Spiller, J.A. A Quality Improvement Approach to Cognitive Assessment on Hospice Admission: Could We Use the 4ATor Short CAM? BMJ Open Qual. 2017, 6, e000153. [CrossRef]
36. Infante, M.T.; Pardini, M.; Balestrino, M.; Finocchi, C.; Malfatto, L.; Bellelli, G.; Mancardi, G.L.; Gandolfo, C.; Serrati, C. Deliriumin the Acute Phase after Stroke: Comparison between Methods of Detection. Neurol. Sci. 2017, 38, 1101–1104. [CrossRef]
37. Lees, R.; Corbet, S.; Johnston, C.; Moffitt, E.; Shaw, G.; Quinn, T.J. Test Accuracy of Short Screening Tests for Diagnosis of Deliriumor Cognitive Impairment in an Acute Stroke Unit Setting. Stroke 2013, 44, 3078–3083. [CrossRef]
38. De, J.; Wand, A.P.F.; Smerdely, P.I.; Hunt, G.E. Validating the 4A’s Test in Screening for Delirium in a Culturally Diverse GeriatricInpatient Population. Int. J. Geriatr. Psychiatry 2017, 32, 1322–1329. [CrossRef]
39. Benjamini, Y.; Hochberg, Y. Controlling the False Discovery Rate: A Practical and Powerful Approach to Multiple Testing. J. R.Stat. Soc. Ser. B Methodol. 1995, 57, 289–300. [CrossRef]
40. Kish, L. Survey Sampling. Am. Polit. Sci. Rev. 1965, 59, 1025. [CrossRef]41. Long, J.S.; Ervin, L.H. Using Heteroscedasticity Consistent Standard Errors in the Linear Regression Model. Am. Stat. 2000, 54,
217–224.42. Friedman, J.; Hastie, T.; Tibshirani, R. The Elements of Statistical Learning; Springer Series in Statistics; Springer: New York, NY,
USA, 2001; Volume 1.43. Breiman, L. Random Forests. Mach. Learn. 2001, 45, 5–32. [CrossRef]44. Karpievitch, Y.V.; Hill, E.G.; Leclerc, A.P.; Dabney, A.R.; Almeida, J.S. An Introspective Comparison of Random Forest-Based
Classifiers for the Analysis of Cluster-Correlated Data by Way of RF++. PLoS ONE 2009, 4, e7087. [CrossRef]45. Ishwaran, H. Variable Importance in Binary Regression Trees and Forests. Electron. J. Stat. 2007, 1, 519–537. [CrossRef]46. Friedman, J.H. Greedy Function Approximation: A Gradient Boosting Machine. Ann. Stat. 2001, 29, 1189–1232. [CrossRef]47. R Core Team. R: A Language and Environment for Statistical Computing; R Foundation for Statistical Computing: Vienna, Aus-
tria, 2015.48. Ishwaran, H.; Kogalur, U.B.; Kogalur, M.U.B. Package ‘RandomForestSRC’, R package version 2; 2019. Available online: http:
//cran.stat.upd.edu.ph/web/packages/randomForestSRC/randomForestSRC.pdf (accessed on 19 July 2019).49. Siddiqi, N.; Holt, R.; Britton, A.M.; Holmes, J. Interventions for Preventing Delirium in Hospitalised Patients. Cochrane Database
Syst. Rev. 2007. [CrossRef]50. Landreville, P.; Voyer, P.; Carmichael, P.-H. Relationship between Delirium and Behavioral Symptoms of Dementia. Int.
Psychogeriatr. 2013, 25, 635–643. [CrossRef]51. Smith, T.O.; Cooper, A.; Peryer, G.; Griffiths, R.; Fox, C.; Cross, J. Factors Predicting Incidence of Post-Operative Delirium in Older
People Following Hip Fracture Surgery: A Systematic Review and Meta-Analysis: Predictors of Delirium Post-Hip FractureSurgery. Int. J. Geriatr. Psychiatry 2017, 32, 386–396. [CrossRef]
52. Gehrke, S.; Bode, L.; Seiler, A.; Ernst, J.; von Känel, R.; Boettger, S. The Prevalence Rates and Sequelae of Delirium at Age Olderthan 90 Years. Palliat. Support. Care 2020, 1–6. [CrossRef]
53. Peralta-Cuervo, A.F.; Garcia-Cifuentes, E.; Castellanos-Perilla, N.; Chavarro-Carvajal, D.A.; Venegas-Sanabria, L.C.; Cano-Gutiérrez, C.A. Delirium Prevalence in a Colombian Hospital, Association with Geriatric Syndromes and Complications duringHospitalization. Rev. Espanola Geriatr. Gerontol. 2021, 56, 69–74. [CrossRef]
54. van Meenen, L.C.C.; van Meenen, D.M.P.; de Rooij, S.E.; ter Riet, G. Risk Prediction Models for Postoperative Delirium: ASystematic Review and Meta-Analysis. J. Am. Geriatr. Soc. 2014, 62, 2383–2390. [CrossRef]
55. Kim, M.; Park, U.; Kim, H.; Cho, W. DELirium Prediction Based on Hospital Information (Delphi) in General Surgery Patients.Medicine 2016, 95, e3072. [CrossRef] [PubMed]
56. Davoudi, A.; Ebadi, A.; Rashidi, P.; Ozrazgat-Baslanti, T.; Bihorac, A.; Bursian, A.C. Delirium Prediction Using Machine LearningModels on Preoperative Electronic Health Records Data. In Proceedings of the 2017 IEEE 17th International Conference onBioinformatics and Bioengineering (BIBE), Washington, DC, USA, 23–25 October 2017; pp. 568–573. [CrossRef]
57. Wong, A.; Young, A.T.; Liang, A.S.; Gonzales, R.; Douglas, V.C.; Hadley, D. Development and Validation of an Electronic HealthRecord-Based Machine Learning Model to Estimate Delirium Risk in Newly Hospitalized Patients without Known CognitiveImpairment. JAMA Netw. Open 2018, 1, e181018. [CrossRef] [PubMed]
58. Veeranki, S.; Hayn, D.; Eggerth, A.; Jauk, S.; Kramer, D.; Leodolter, W.; Schreier, G. On the Representation of Machine LearningResults for Delirium Prediction in a Hospital Information System in Routine Care. Stud. Health Technol. Inform. 2018, 251,97–100. [PubMed]
59. Veeranki, S.P.K.; Hayn, D.; Kramer, D.; Jauk, S.; Schreier, G. Effect of Nursing Assessment on Predictive Delirium Models inHospitalised Patients. Stud. Health Technol. Inform. 2018, 248, 124–131.

Int. J. Environ. Res. Public Health 2021, 18, 7105 13 of 13
60. Fan, H.; Ji, M.; Huang, J.; Yue, P.; Yang, X.; Wang, C.; Ying, W. Development and Validation of a Dynamic Delirium PredictionRule in Patients Admitted to the Intensive Care Units (DYNAMIC-ICU): A Prospective Cohort Study. Int. J. Nurs. Stud. 2019, 93,64–73. [CrossRef]
61. Ocagli, H.; Azzolina, D.; Soltanmohammadi, R.; Aliyari, R.; Bottigliengo, D.; Acar, A.S.; Stivanello, L.; Degan, M.; Baldi, I.;Lorenzoni, G.; et al. Profiling Delirium Progression in Elderly Patients via Continuous-Time Markov Multi-State TransitionModels. J. Pers. Med. 2021, 11, 445. [CrossRef]
62. Oh, J.; Cho, D.; Park, J.; Na, S.H.; Kim, J.; Heo, J.; Shin, C.S.; Kim, J.-J.; Park, J.Y.; Lee, B. Prediction and Early Detection of Deliriumin the Intensive Care Unit by Using Heart Rate Variability and Machine Learning. Physiol. Meas. 2018, 39, 035004. [CrossRef]