Embed Size (px)
Citation preview
A Measure of National Power
By
Chin-Lung Chang
Assistant Professor
Department of Political Science
Fo-guang University
A Measure of National Power
2
A Measure of National Power Assistant Professor
Department of Political Science
Fo-guang University
Chin-Lung Chang
Abstract
The measurement of national power is a critical issue. One practical reason for this is
that such measurement is an integral part of cross-national analysis. Another is that successful
measurement can assure a more precise account of systemic concepts such as “polarity,”
“balance of power,” and “power transition.” This study adopts a hands-on approach to
compare three power equations. The results demonstrate that Model 2 (=Critical Mass + GNP
+ Military Expenditure) has more theoretical relevance and better strategic implications than
the other two models. I argue that the capacity (comprising intangible factors) of a nation
contributes to its achieving and maintaining the level of productivity and force (i.e., GNP and
military expenditure). Therefore, although Model 2 does not include a capacity index, it
yields a valid measure of national power.
2
A Measure of National Power
3
A Measure of National Power Chin-Lung Chang
Fo-guang University, Taiwan
Power is a fascinating, yet elusive, concept in the study of international relations as well
as in other social sciences. For centuries, scholars have been wrestling with its
conceptualization and measurement. Theory and data are often regarded as separate, but
this is not necessarily true. Sometimes theoretical advances come to a halt for want of
empirical inspiration. At other times, data construction is hampered for lack of theoretical
guidance. This study adopted a hands-on approach to measuring national power.1 Three
tentative power equations will be put to the test to determine their theoretical import and
real-world implications.
Quantification of Power
The measurement of national power is a critical issue.2 One practical reason for this is
that such measurement is an integral part of cross-national analysis. Another is that
successful measurement can assure a more precise account of systemic concepts such as
“polarity,” “balance of power,” and “power transition.” The concept of national power is
difficult to measure, however, for several reasons. First, there is a gap between potential
and actual power. This gap results from intangible factors such as will, capacity, mastery, or
skill, which are difficult to quantify. Second, “power as money” is a misconception because
power, especially in various political forms, is relatively low in fungibility.3 Third, it is not
necessarily true that “more means better.” For developing or poor nations, a large
1 This article drew heavily from the author’s dissertation project: Chin-Lung Chang, Selection of Statecraft:
Issue-specific or Actor-specific? The American Case, 1978-1994 (Ph.D. diss., Michigan State University, 1999),
pp. 85-90, 113-67. 2 Theories of power are not discussed here; for a succinct discussion with extensive bibliography, see David A.
Baldwin, “Power and International Relations,” in Walter Carlsnaes, Thomas Risse, and Beth A. Simmons, ed.,
Handbook of International Relations (London: Sage, 2002), pp. 177-91. 3 David A. Baldwin, “Power Analysis and World Politics: New Trends versus Old Tendencies,” World Politics
31(1979), pp. 161-94.
3
A Measure of National Power
4
population is likely to be a burden rather than an advantage. Fourth, the proposition that
“the bigger is equal to the more powerful” is questionable. The “paradox of unrealized
power” highlights the phenomenon that the weak powers can sometimes defeat or influence
the strong.4
Hart identifies three main approaches to the measurement of power in international
relations: (1) control over resources, (2) control over actors, and (3) control over events and
outcomes.5 He further argues that the third approach is superior to the other two approaches
because of its advantages in explaining interdependence and collective action. Nevertheless,
the third approach has its own predicaments in identifying and ranking decision makers’
preferences.
This study follows the control-over-resources approach. The task of constructing an
aggregate index for national power is concerned with two major issues: (1) the question of
fungibility of power, and (2) whether the relationship between tangible and intangible
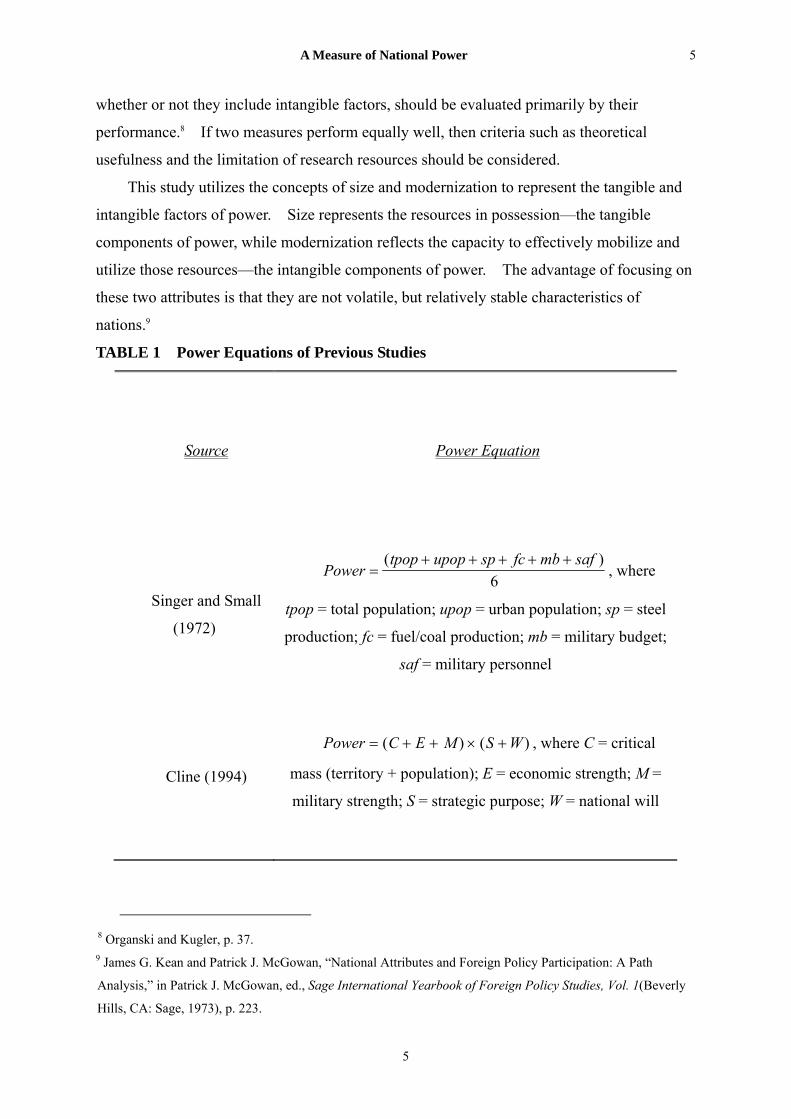
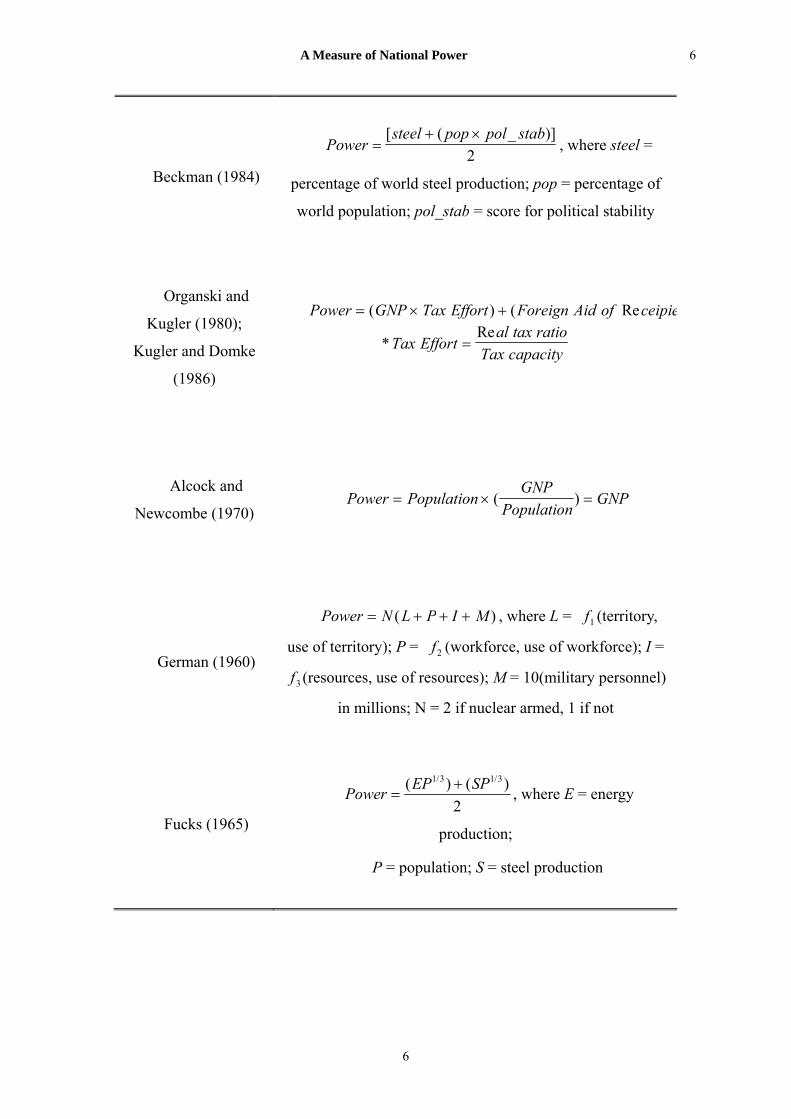
components of power is additive or interactive. Some previous efforts to formulate power
equations are listed in Table 1.6
Power equations need not be complicated. Some studies present gross national product
(GNP) as a good measure of national power, while others argue that energy consumption is a
better overall measure.7 Organski and Kugler suggest that the selection of power measures,
4 Baldwin, p. 163. 5 Jeffrey Hart, “Three Approaches to the Measurement of Power in International Relations,” International
Organization 30(1976), pp. 289-305. 6 Table 1 does not include the details of the formulas. For a full specification of some of the power equations
listed within, see Richard L. Merritt and Dina A. Zinnes, “Alternative Indexes of National Power,” and Charles
S. Taber, “Power Capability Indexes in the Third World,” both in Richard J. Stoll and Michael D. Ward, ed.,
Power in World Politics(Boulder, CO: Lynne Rienner, 1989). The original works includes J. David Singer and
Melvin Small, The Wages of War, 1816-1965: A Statistical Handbook(New York: John Wiley, 1972), Ray S.
Cline, The Power of Nations in the 1990s: A Strategic Assessment(Lanham, MD: University Press of America,
1994), Peter Beckman, World Politics in the Twentieth Century(Englewood Cliffs, NJ: Prentice-Hall, 1984), A.
F. K. Organski and Jacek Kugler, The War Ledger(Chicago: The University of Chicago Press, 1980), Jacek
Kugler and William Domke, “Comparing the Strength of Nations,” Comparative Political Studies 19(1986), pp.
39-69, Norman Z. Alcock and Alan G. Newcombe, “The Perception of National Power,” Journal of Conflict
Resolution 14(1970), pp. 335-43, F. Clifford German, “A Tentative Evaluation of World Power,” Journal of
Conflict Resolution 4(1960), pp. 138-44, and Wilhelm Fucks, Formeln zur Macht: Prognosen űber Vőlker,
Wirtschaft Potentiale(Germany: Verlags-Anstalt, 1965). 7 Organski and Kugler, p. 247.
4
A Measure of National Power
5
whether or not they include intangible factors, should be evaluated primarily by their
performance.8 If two measures perform equally well, then criteria such as theoretical
usefulness and the limitation of research resources should be considered.
This study utilizes the concepts of size and modernization to represent the tangible and
intangible factors of power. Size represents the resources in possession—the tangible
components of power, while modernization reflects the capacity to effectively mobilize and
utilize those resources—the intangible components of power. The advantage of focusing on
these two attributes is that they are not volatile, but relatively stable characteristics of
nations.9
TABLE 1 Power Equations of Previous Studies
Source Power Equation
Singer and Small
(1972)
Powertpop upop sp fc mb saf
=+ + + + +( )
6, where
tpop = total population; upop = urban population; sp = steel
production; fc = fuel/coal production; mb = military budget;
saf = military personnel
Cline (1994)
Power C E M S W= + + × +( ) ( ) , where C = critical
mass (territory + population); E = economic strength; M =
military strength; S = strategic purpose; W = national will
8 Organski and Kugler, p. 37. 9 James G. Kean and Patrick J. McGowan, “National Attributes and Foreign Policy Participation: A Path
Analysis,” in Patrick J. McGowan, ed., Sage International Yearbook of Foreign Policy Studies, Vol. 1(Beverly
Hills, CA: Sage, 1973), p. 223.
5
A Measure of National Power
6
Beckman (1984)
Powersteel pop pol stab
=+ ×[ ( _
2)]
, where steel =
percentage of world steel production; pop = percentage of
world population; pol_stab = score for political stability
Organski and
Kugler (1980);
Kugler and Domke
(1986)
Power GNP Tax Effort Foreign Aid of ceipie= × +( ) ( Re
*Re
Tax Effortal tax ratio
Tax capacity=
Alcock and
Newcombe (1970) Power Population
GNPPopulation
GNP= × =( )
German (1960)
Power N L P I M= + + +( ) , where L = (territory,
use of territory); P = (workforce, use of workforce); I =
(resources, use of resources); M = 10(military personnel)
in millions; N = 2 if nuclear armed, 1 if not
f1
f2
f3
Fucks (1965)
Power EP SP=
+( ) (/ /1 3 1 3
2) , where E = energy
production;
P = population; S = steel production
6
A Measure of National Power
7
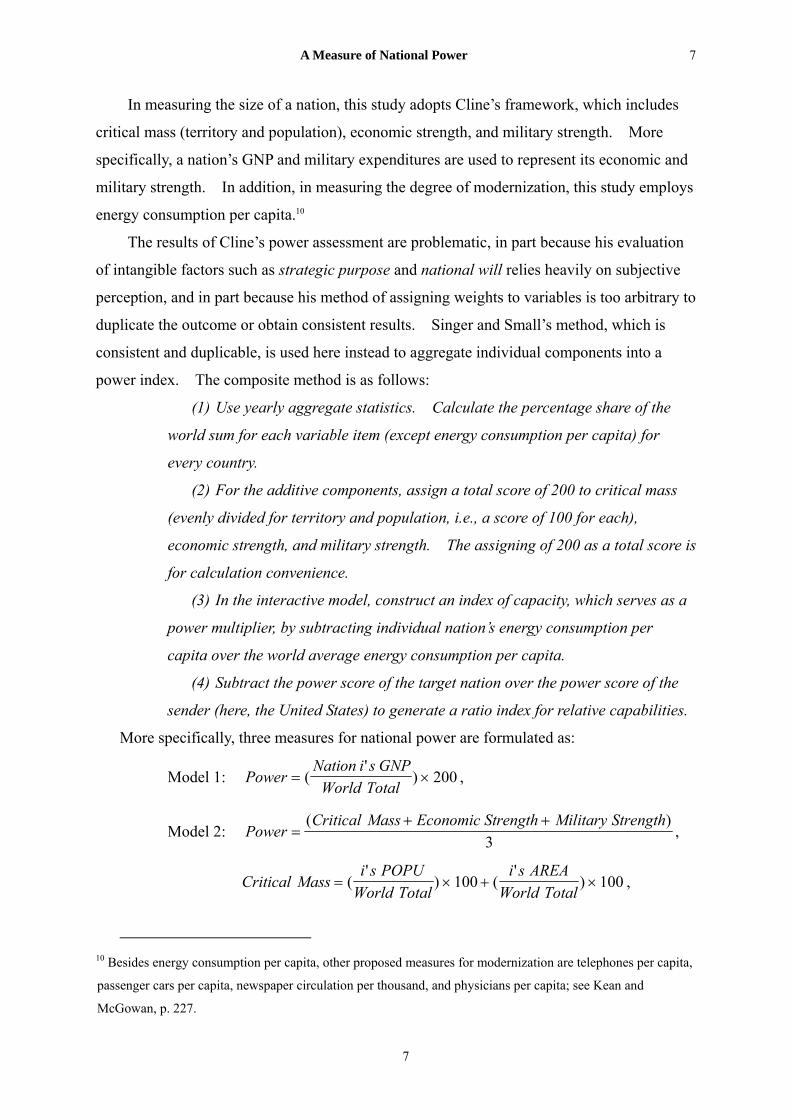
In measuring the size of a nation, this study adopts Cline’s framework, which includes
critical mass (territory and population), economic strength, and military strength. More
specifically, a nation’s GNP and military expenditures are used to represent its economic and
military strength. In addition, in measuring the degree of modernization, this study employs
energy consumption per capita.10
The results of Cline’s power assessment are problematic, in part because his evaluation
of intangible factors such as strategic purpose and national will relies heavily on subjective
perception, and in part because his method of assigning weights to variables is too arbitrary to
duplicate the outcome or obtain consistent results. Singer and Small’s method, which is
consistent and duplicable, is used here instead to aggregate individual components into a
power index. The composite method is as follows:
(1) Use yearly aggregate statistics. Calculate the percentage share of the
world sum for each variable item (except energy consumption per capita) for
every country.
(2) For the additive components, assign a total score of 200 to critical mass
(evenly divided for territory and population, i.e., a score of 100 for each),
economic strength, and military strength. The assigning of 200 as a total score is
for calculation convenience.
(3) In the interactive model, construct an index of capacity, which serves as a
power multiplier, by subtracting individual nation’s energy consumption per
capita over the world average energy consumption per capita.
(4) Subtract the power score of the target nation over the power score of the
sender (here, the United States) to generate a ratio index for relative capabilities.
More specifically, three measures for national power are formulated as:
Model 1: PowerNation i s GNP
World Total= ×(
') 200 ,
Model 2: PowerCritical Mass Economic Strength Military Strength
=+ +( )
3,
Critical Massi s POPU
World Totali s AREA
World Total= × +(
') (
')100 100×
,
10 Besides energy consumption per capita, other proposed measures for modernization are telephones per capita,
passenger cars per capita, newspaper circulation per thousand, and physicians per capita; see Kean and
McGowan, p. 227.
7
A Measure of National Power
8
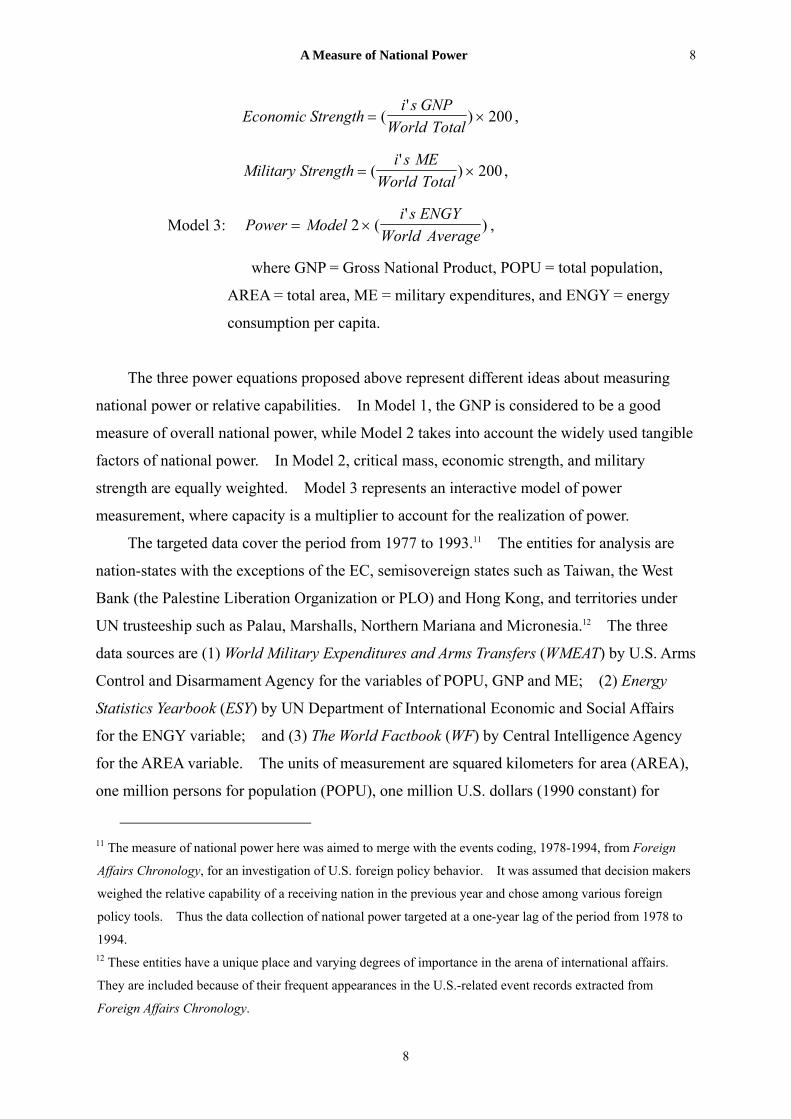
Economic Strengthi s GNP
World Total= ×(
') 200 ,
Military Strengthi s ME
World Total= ×(
') 200 ,
Model 3: Power Modeli s ENGY
World Average= ×2 (
') ,
where GNP = Gross National Product, POPU = total population,
AREA = total area, ME = military expenditures, and ENGY = energy
consumption per capita.
The three power equations proposed above represent different ideas about measuring
national power or relative capabilities. In Model 1, the GNP is considered to be a good
measure of overall national power, while Model 2 takes into account the widely used tangible
factors of national power. In Model 2, critical mass, economic strength, and military
strength are equally weighted. Model 3 represents an interactive model of power
measurement, where capacity is a multiplier to account for the realization of power.
The targeted data cover the period from 1977 to 1993.11 The entities for analysis are
nation-states with the exceptions of the EC, semisovereign states such as Taiwan, the West
Bank (the Palestine Liberation Organization or PLO) and Hong Kong, and territories under
UN trusteeship such as Palau, Marshalls, Northern Mariana and Micronesia.12 The three
data sources are (1) World Military Expenditures and Arms Transfers (WMEAT) by U.S. Arms
Control and Disarmament Agency for the variables of POPU, GNP and ME; (2) Energy
Statistics Yearbook (ESY) by UN Department of International Economic and Social Affairs
for the ENGY variable; and (3) The World Factbook (WF) by Central Intelligence Agency
for the AREA variable. The units of measurement are squared kilometers for area (AREA),
one million persons for population (POPU), one million U.S. dollars (1990 constant) for
11 The measure of national power here was aimed to merge with the events coding, 1978-1994, from Foreign
Affairs Chronology, for an investigation of U.S. foreign policy behavior. It was assumed that decision makers
weighed the relative capability of a receiving nation in the previous year and chose among various foreign
policy tools. Thus the data collection of national power targeted at a one-year lag of the period from 1978 to
1994. 12 These entities have a unique place and varying degrees of importance in the arena of international affairs.
They are included because of their frequent appearances in the U.S.-related event records extracted from
Foreign Affairs Chronology.
8
A Measure of National Power
9
gross national product (GNP) and military expenditures (ME), and kilograms of coal
equivalent per capita for energy consumption per capita (ENGY).13
A Comparison between Cline’s Model and Three Power Models
In empirical applications, it is trivial and inappropriate to apply all three power
equations to the proposed framework or models and then choose to report the one with the
most significant results.14 As mentioned earlier, theoretical significance as well as empirical
performance should serve as yardsticks to evaluate which one of the three power equations is
the most suitable for use. A more realistic approach is to look at how well each equation
mirrors our general perception of the real world. In the following section, the discussion
involves a comparison between three power equations and an assessment of their implications
for real-world settings.
The comparison between different power models will focus on two criteria: the
superpower(s) assumptions and strategic implications. Students of international relations
have long debated the polarity issue in the international system and continue to do so. Any
outcome of power rankings should reflect, at least partially, how well certain worldviews or
assumptions about the international power structure—unipolarity (hegemony), bipolarity
(two superpowers), and multipolarity—match with the empirical footprints from the real
world, portrayed in the collected data. I will compare top-ranked powers to see which
13 For the sake of comparison, all data involving monetary units were converted into U.S. dollars (1990
constant). The U.S. GNP deflator index can be found in the section of “Statistical Notes” in WMEAT. The
applied numbers of the U.S. GNP deflator index are as follows: 1995 = 114.93, 1994 = 112.11, 1993 =
109.05, 1992 = 106.73, 1991 = 103.84, 1990 = 100, 1989 = 95.85, 1988 = 91.70, 1987 = 88.31, 1986 = 85.51,
1985 = 83.27, 1984 = 80.86, 1983 = 77.95, 1982 = 75.05, 1981 = 70.52, 1980 = 64.33, 1979 = 58.96, 1978 =
54.20, 1977 = 50.50, 1976 = 47.75, 1975 = 45.44, 1974 = 41.47, 1973 = 37.89, 1972 = 35.84, 1971 = 34.42,
1970 = 32.75. As an example of a calculation using this index, a pair of airline tickets that cost $500 in 1983
(in 1983 current U.S. dollars) would cost $641 in 1990 (= 500/.7795; in 1990 constant U.S. dollars). 14 All three equations seem to point in the same direction toward the phenomenon of the national power in
question. A correlational analysis revealed that all three power models are strongly correlated to each other.
In descending order, the correlation coefficients are .9176 (Model 2 vs. Model 3), .9131 (Model 1 vs. Model 2),
and .8511 (Model 1 vs. Model 3).
9
A Measure of National Power
10
underlying assumptions best fit the power model in use. Since the superpower assumption
is crucial for my analysis, I will hazard an operational definition of a superpower: A
superpower is a nation so far ahead of others that it takes at least three great powers to form a
coalition to compete with (to tie or surpass) it.
As to the criteria for strategic implications, I will concentrate on only one simple
aspect—attack-strength ratios. Dunnigan explicates the concept of attack-strength ratios as
follows:
The offensive needs three or more times as much combat strength (not just troops
and weapons) in order to overcome a defender at the point of attack. This may vary
with the size of the forces, because at the platoon level the required ratio can be as
high as 10 to 1. At the theater level, where up to a million or more troops are
involved, anything between 1 to 1 and 2 to 1 will often suffice because only a small
part of the terrain in the theater will be fought over at any one time. You also have to
take time into account. The larger the advantages, the less time it will take to win.15
Accordingly, in my strategic analysis, I take the view that an offensive nation requires a
force at least 3 to 5 times as large as that of a defensive nation to conquer it. Given an
all-out war between any two nations, the power ratio will predict if and how the weaker
nation can prevail, by referring to the attack-strength ratio just described. I will make
hypothetical comparisons of paired rivalries such as China vs. Taiwan and South Korea vs.
North Korea to explain the strategic implications. In doing so, I will try to determine which
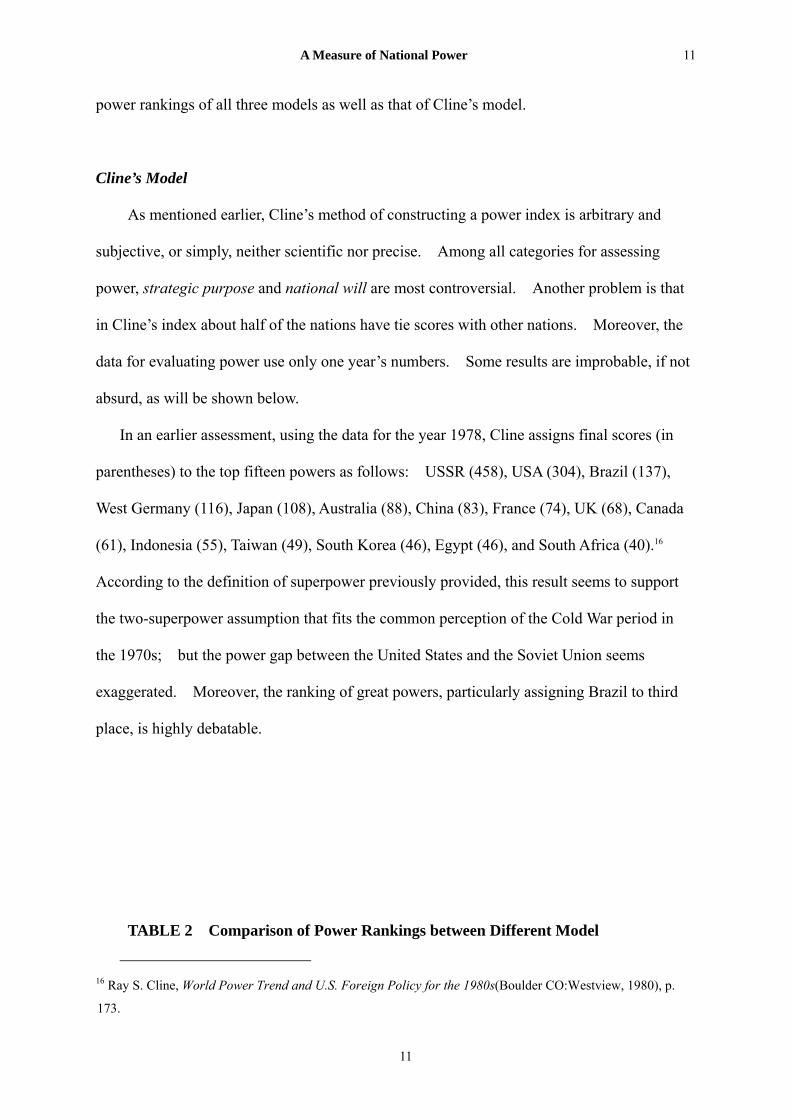
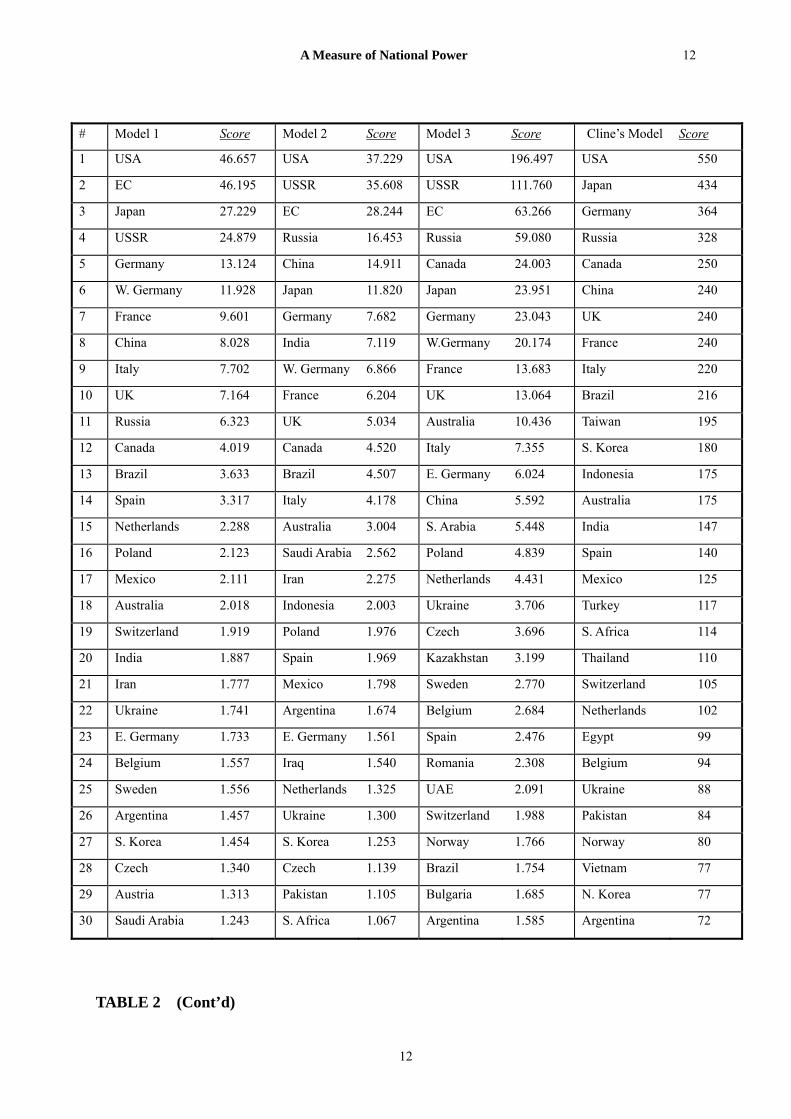
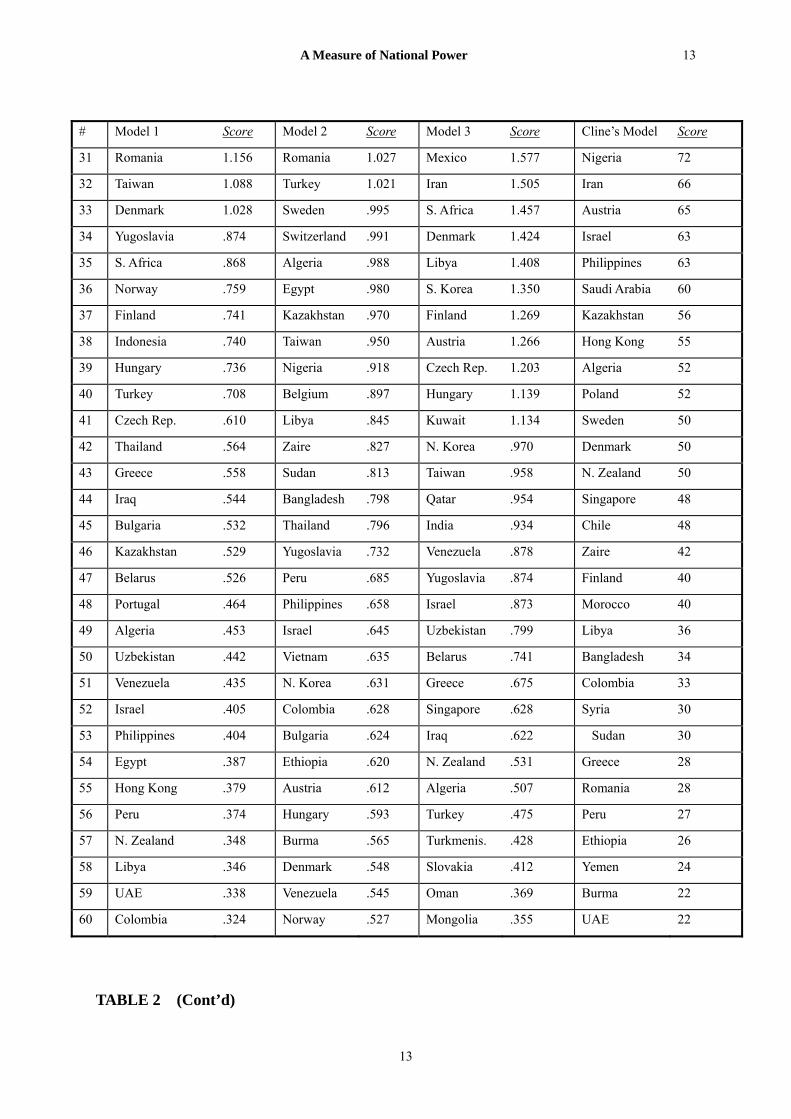
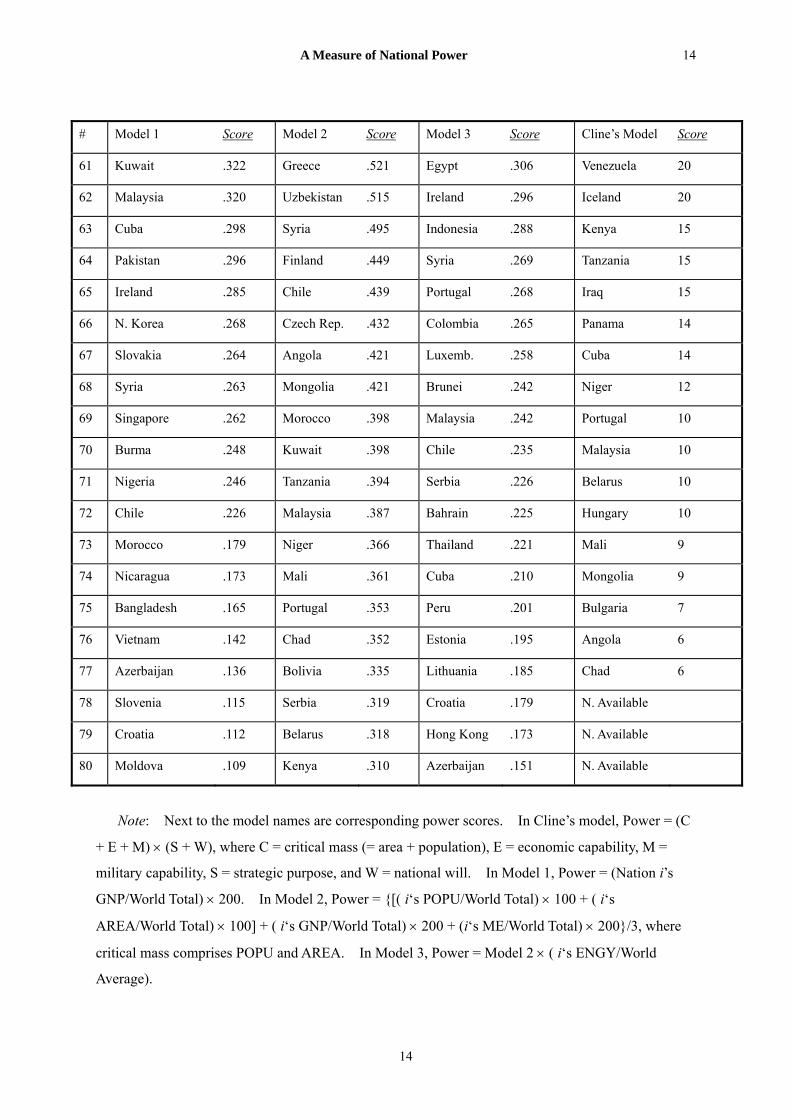
power model is most reasonable. For a more detailed evaluation, Table 2 lists the resulting
15 James F. Dunnigan, How to Make War: A Comprehensive Guide to Modern Warfare for the Post-Cold War
Era(New York: William Morrow, 1993), p. 19.
10
A Measure of National Power
11
power rankings of all three models as well as that of Cline’s model.
Cline’s Model
As mentioned earlier, Cline’s method of constructing a power index is arbitrary and
subjective, or simply, neither scientific nor precise. Among all categories for assessing
power, strategic purpose and national will are most controversial. Another problem is that
in Cline’s index about half of the nations have tie scores with other nations. Moreover, the
data for evaluating power use only one year’s numbers. Some results are improbable, if not
absurd, as will be shown below.
In an earlier assessment, using the data for the year 1978, Cline assigns final scores (in
parentheses) to the top fifteen powers as follows: USSR (458), USA (304), Brazil (137),
West Germany (116), Japan (108), Australia (88), China (83), France (74), UK (68), Canada
(61), Indonesia (55), Taiwan (49), South Korea (46), Egypt (46), and South Africa (40).16
According to the definition of superpower previously provided, this result seems to support
the two-superpower assumption that fits the common perception of the Cold War period in
the 1970s; but the power gap between the United States and the Soviet Union seems
exaggerated. Moreover, the ranking of great powers, particularly assigning Brazil to third
place, is highly debatable.
TABLE 2 Comparison of Power Rankings between Different Model
16 Ray S. Cline, World Power Trend and U.S. Foreign Policy for the 1980s(Boulder CO:Westview, 1980), p.
173.
11
A Measure of National Power
12
# Model 1 Score Model 2 Score Model 3 Score Cline’s Model Score
1 USA 46.657 USA 37.229 USA 196.497 USA 550
2 EC 46.195 USSR 35.608 USSR 111.760 Japan 434
3 Japan 27.229 EC 28.244 EC 63.266 Germany 364
4 USSR 24.879 Russia 16.453 Russia 59.080 Russia 328
5 Germany 13.124 China 14.911 Canada 24.003 Canada 250
6 W. Germany 11.928 Japan 11.820 Japan 23.951 China 240
7 France 9.601 Germany 7.682 Germany 23.043 UK 240
8 China 8.028 India 7.119 W.Germany 20.174 France 240
9 Italy 7.702 W. Germany 6.866 France 13.683 Italy 220
10 UK 7.164 France 6.204 UK 13.064 Brazil 216
11 Russia 6.323 UK 5.034 Australia 10.436 Taiwan 195
12 Canada 4.019 Canada 4.520 Italy 7.355 S. Korea 180
13 Brazil 3.633 Brazil 4.507 E. Germany 6.024 Indonesia 175
14 Spain 3.317 Italy 4.178 China 5.592 Australia 175
15 Netherlands 2.288 Australia 3.004 S. Arabia 5.448 India 147
16 Poland 2.123 Saudi Arabia 2.562 Poland 4.839 Spain 140
17 Mexico 2.111 Iran 2.275 Netherlands 4.431 Mexico 125
18 Australia 2.018 Indonesia 2.003 Ukraine 3.706 Turkey 117
19 Switzerland 1.919 Poland 1.976 Czech 3.696 S. Africa 114
20 India 1.887 Spain 1.969 Kazakhstan 3.199 Thailand 110
21 Iran 1.777 Mexico 1.798 Sweden 2.770 Switzerland 105
22 Ukraine 1.741 Argentina 1.674 Belgium 2.684 Netherlands 102
23 E. Germany 1.733 E. Germany 1.561 Spain 2.476 Egypt 99
24 Belgium 1.557 Iraq 1.540 Romania 2.308 Belgium 94
25 Sweden 1.556 Netherlands 1.325 UAE 2.091 Ukraine 88
26 Argentina 1.457 Ukraine 1.300 Switzerland 1.988 Pakistan 84
27 S. Korea 1.454 S. Korea 1.253 Norway 1.766 Norway 80
28 Czech 1.340 Czech 1.139 Brazil 1.754 Vietnam 77
29 Austria 1.313 Pakistan 1.105 Bulgaria 1.685 N. Korea 77
30 Saudi Arabia 1.243 S. Africa 1.067 Argentina 1.585 Argentina 72
TABLE 2 (Cont’d)
12
A Measure of National Power
13
# Model 1 Score Model 2 Score Model 3 Score Cline’s Model Score
31 Romania 1.156 Romania 1.027 Mexico 1.577 Nigeria 72
32 Taiwan 1.088 Turkey 1.021 Iran 1.505 Iran 66
33 Denmark 1.028 Sweden .995 S. Africa 1.457 Austria 65
34 Yugoslavia .874 Switzerland .991 Denmark 1.424 Israel 63
35 S. Africa .868 Algeria .988 Libya 1.408 Philippines 63
36 Norway .759 Egypt .980 S. Korea 1.350 Saudi Arabia 60
37 Finland .741 Kazakhstan .970 Finland 1.269 Kazakhstan 56
38 Indonesia .740 Taiwan .950 Austria 1.266 Hong Kong 55
39 Hungary .736 Nigeria .918 Czech Rep. 1.203 Algeria 52
40 Turkey .708 Belgium .897 Hungary 1.139 Poland 52
41 Czech Rep. .610 Libya .845 Kuwait 1.134 Sweden 50
42 Thailand .564 Zaire .827 N. Korea .970 Denmark 50
43 Greece .558 Sudan .813 Taiwan .958 N. Zealand 50
44 Iraq .544 Bangladesh .798 Qatar .954 Singapore 48
45 Bulgaria .532 Thailand .796 India .934 Chile 48
46 Kazakhstan .529 Yugoslavia .732 Venezuela .878 Zaire 42
47 Belarus .526 Peru .685 Yugoslavia .874 Finland 40
48 Portugal .464 Philippines .658 Israel .873 Morocco 40
49 Algeria .453 Israel .645 Uzbekistan .799 Libya 36
50 Uzbekistan .442 Vietnam .635 Belarus .741 Bangladesh 34
51 Venezuela .435 N. Korea .631 Greece .675 Colombia 33
52 Israel .405 Colombia .628 Singapore .628 Syria 30
53 Philippines .404 Bulgaria .624 Iraq .622 Sudan 30
54 Egypt .387 Ethiopia .620 N. Zealand .531 Greece 28
55 Hong Kong .379 Austria .612 Algeria .507 Romania 28
56 Peru .374 Hungary .593 Turkey .475 Peru 27
57 N. Zealand .348 Burma .565 Turkmenis. .428 Ethiopia 26
58 Libya .346 Denmark .548 Slovakia .412 Yemen 24
59 UAE .338 Venezuela .545 Oman .369 Burma 22
60 Colombia .324 Norway .527 Mongolia .355 UAE 22
TABLE 2 (Cont’d)
13
A Measure of National Power
14
# Model 1 Score Model 2 Score Model 3 Score Cline’s Model Score
61 Kuwait .322 Greece .521 Egypt .306 Venezuela 20
62 Malaysia .320 Uzbekistan .515 Ireland .296 Iceland 20
63 Cuba .298 Syria .495 Indonesia .288 Kenya 15
64 Pakistan .296 Finland .449 Syria .269 Tanzania 15
65 Ireland .285 Chile .439 Portugal .268 Iraq 15
66 N. Korea .268 Czech Rep. .432 Colombia .265 Panama 14
67 Slovakia .264 Angola .421 Luxemb. .258 Cuba 14
68 Syria .263 Mongolia .421 Brunei .242 Niger 12
69 Singapore .262 Morocco .398 Malaysia .242 Portugal 10
70 Burma .248 Kuwait .398 Chile .235 Malaysia 10
71 Nigeria .246 Tanzania .394 Serbia .226 Belarus 10
72 Chile .226 Malaysia .387 Bahrain .225 Hungary 10
73 Morocco .179 Niger .366 Thailand .221 Mali 9
74 Nicaragua .173 Mali .361 Cuba .210 Mongolia 9
75 Bangladesh .165 Portugal .353 Peru .201 Bulgaria 7
76 Vietnam .142 Chad .352 Estonia .195 Angola 6
77 Azerbaijan .136 Bolivia .335 Lithuania .185 Chad 6
78 Slovenia .115 Serbia .319 Croatia .179 N. Available
79 Croatia .112 Belarus .318 Hong Kong .173 N. Available
80 Moldova .109 Kenya .310 Azerbaijan .151 N. Available
Note: Next to the model names are corresponding power scores. In Cline’s model, Power = (C
+ E + M) × (S + W), where C = critical mass (= area + population), E = economic capability, M =
military capability, S = strategic purpose, and W = national will. In Model 1, Power = (Nation i’s
GNP/World Total) × 200. In Model 2, Power = {[( i‘s POPU/World Total) × 100 + ( i‘s
AREA/World Total) × 100] + ( i‘s GNP/World Total) × 200 + (i‘s ME/World Total) × 200}/3, where
critical mass comprises POPU and AREA. In Model 3, Power = Model 2 × ( i‘s ENGY/World
Average).
14
A Measure of National Power
15
As can be seen in Table 2, Cline’s latest assessment of the current state of the post-Cold
War era seems to support the multipolar assumption, in which the United States is merely the
strongest among great powers. This is the opposite of what is generally perceived. In
addition, the ranking of Canada ahead of China seems to be overstated. To say the least,
Canada’s population would be at a great disadvantage if engaged in an all-out conflict with
China. In both editions of power assessment, Cline appears to be in favor of, and have a
high rank to, Taiwan and South Korea. If this ranking reflected reality, we would not have
seen these two countries in turmoil, time and again, as a result of the troop movements or
military exercises of China or North Korea. In the cases of Taiwan and South Korea,
Cline’s assessment is a comfort to optimists but a nightmare to realists or pessimists. All
things considered, Cline’s model falls far short of meeting scientific standards or surviving a
reality check.
Three Power Models
As illustrated in Table 2, in the power structure of the late 1970s and 1980s, both Model
1 and Model 3 present the United States as the sole superpower, while Model 2 presents the
United States and the USSR as the two contending superpowers among all nations. In
Model 1, Russia falls far behind Japan, Germany, France, China, Italy and Britain in the
post-Cold War era. This is probably misleading because Russia did not decline as fast as
implied; it is still a great nation with resources and force. If GNP were the sole source of
national power as in Model 1, North Korea (score = .27) would not dare to invade South
Korea (= 1.45), and South Korea would not need the presence of American troops.17
Model 3 equals Model 2 times a capacity index based on energy consumption per capita.
It tends to enlarge the power gap between great powers and a single superpower. Notably,
in Model 3, the United States has a power score eight times as high as that of Japan, while
China drops to the bottom of great powers, even behind East Germany. Moreover, United
Arab Emirates ranks at the twenty-fifth place from the top, ahead of Brazil, Argentina,
Mexico, and Iran. These assessments are far too contrary to our general perceptions about
the real world; therefore, they should be rejected as unrealistic. In addition, there are
certain biases associated with the variable of energy consumption per capita. Some have
suggested, for example, that nations of higher latitude tend to have more energy consumption
17 The presence of American troops in South Korea is perhaps better explained by the logic of balance of power.
15
A Measure of National Power
16
per capita.18
In my view, Model 2 provides a more realistic representation of the international system
than does Model 1 or Model 3. As shown in Table 2, the Cold War period was dominated
by two superpowers: the United States and the USSR. Neither had an advantage over its
counterpart, and this is why bloc- or coalition-forming was important and played an
indispensable part in the Cold-War standoff. Both superpowers saw China as a worthy
partner or a formidable adversary, depending on which camp it leaned toward. Since the
post-Cold War era, Russia has not been in free-fall; it is still the number two nation in the
world, followed closely by China and Japan. From the strategic point of view, there are no
obviously unreasonable rankings in Model 2. According to Model 2, aggression by North
Korea is not unlikely, and Taiwan should not take lightly the threat of China’s using force.
In short, among the three power equations, Model 2 is superior to Model 1 and Model 3
because it yields a more precise picture of the real world as it is generally perceived.
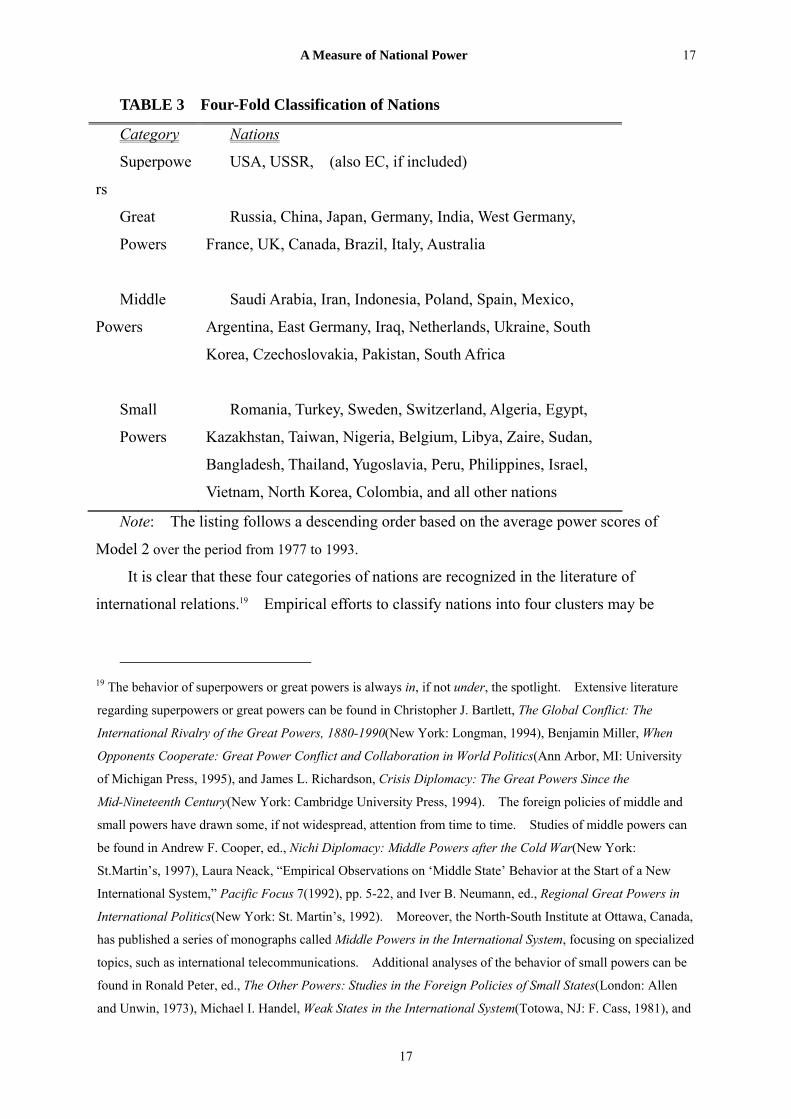
Additionally, the power ranking of Model 2 in Table 2 can be used to classify nations
into four groups: superpower(s), great powers, middle (regional/intermediate) powers, and
small powers. I selected Australia’s rank as the cutoff point between great and middle
powers, and South Africa’s rank as the cutoff point between middle and small powers. The
threshold distinguishing between great and middle powers is based upon the reasoning that
Australia and nations ranked above it have the physical conditions, or at least the potential, to
become great powers. On the other hand, the distinction between middle and small powers
is rather subjective. Some might prefer a more extensive list of middle powers that would
include Turkey, Egypt, Kazakhstan, or Libya as well. The four-fold classification of nations
based upon Model 2 is presented in Table 3.
18 The results of a correlational analysis between energy consumption per capita and the average temperature of
the coldest month in the year (r = -.3918, p = .000, n = 178) are in support of this proposition. The temperature
data is extracted from Reader’s Digest Book of Facts (1987), pp. 132-49. In addition, a one-way ANOVA
analysis suggests a borderline relationship (p = .055) between the membership of the Organization of Petroleum
Exporting Countries (OPEC) and energy consumption per capita.
16
A Measure of National Power
17
TABLE 3 Four-Fold Classification of Nations
Category Nations
Superpowe
rs
USA, USSR, (also EC, if included)
Great
Powers
Russia, China, Japan, Germany, India, West Germany,
France, UK, Canada, Brazil, Italy, Australia
Middle
Powers
Saudi Arabia, Iran, Indonesia, Poland, Spain, Mexico,
Argentina, East Germany, Iraq, Netherlands, Ukraine, South
Korea, Czechoslovakia, Pakistan, South Africa
Small
Powers
Romania, Turkey, Sweden, Switzerland, Algeria, Egypt,
Kazakhstan, Taiwan, Nigeria, Belgium, Libya, Zaire, Sudan,
Bangladesh, Thailand, Yugoslavia, Peru, Philippines, Israel,
Vietnam, North Korea, Colombia, and all other nations
Note: The listing follows a descending order based on the average power scores of
Model 2 over the period from 1977 to 1993.
It is clear that these four categories of nations are recognized in the literature of
international relations.19 Empirical efforts to classify nations into four clusters may be
19 The behavior of superpowers or great powers is always in, if not under, the spotlight. Extensive literature
regarding superpowers or great powers can be found in Christopher J. Bartlett, The Global Conflict: The
International Rivalry of the Great Powers, 1880-1990(New York: Longman, 1994), Benjamin Miller, When
Opponents Cooperate: Great Power Conflict and Collaboration in World Politics(Ann Arbor, MI: University
of Michigan Press, 1995), and James L. Richardson, Crisis Diplomacy: The Great Powers Since the
Mid-Nineteenth Century(New York: Cambridge University Press, 1994). The foreign policies of middle and
small powers have drawn some, if not widespread, attention from time to time. Studies of middle powers can
be found in Andrew F. Cooper, ed., Nichi Diplomacy: Middle Powers after the Cold War(New York:
St.Martin’s, 1997), Laura Neack, “Empirical Observations on ‘Middle State’ Behavior at the Start of a New
International System,” Pacific Focus 7(1992), pp. 5-22, and Iver B. Neumann, ed., Regional Great Powers in
International Politics(New York: St. Martin’s, 1992). Moreover, the North-South Institute at Ottawa, Canada,
has published a series of monographs called Middle Powers in the International System, focusing on specialized
topics, such as international telecommunications. Additional analyses of the behavior of small powers can be
found in Ronald Peter, ed., The Other Powers: Studies in the Foreign Policies of Small States(London: Allen
and Unwin, 1973), Michael I. Handel, Weak States in the International System(Totowa, NJ: F. Cass, 1981), and
17
A Measure of National Power
18
conducive to theory testing or building. For example, given available cross-sectional data,
one can make contrasts between the foreign policy patterns in different clusters of nations to
test existing theories or to generate new propositions. This system of classifying nations
into four groups may have an advantage over the original relative capability scores because of
its simplicity and comprehensibility in interpretation. For instance, by using this
classification, one can investigate and interpret the orientation of U.S. foreign policy toward
different clusters of nations. One can discuss the American behavior toward “small states,”
instead of the American behavior toward “nations which are one hundredth or less as strong.”
The relative capability index at the ratio level sometimes sounds awkward in interpretation,
although it allows for a more precise illustration or comparison of national power in terms of
numbers.
Power Transitions of Top Fifteen Nations
Another method for making comparisons between three power equations is to look into
the power transitions of top-ranked nations over a number of years. To illustrate the change
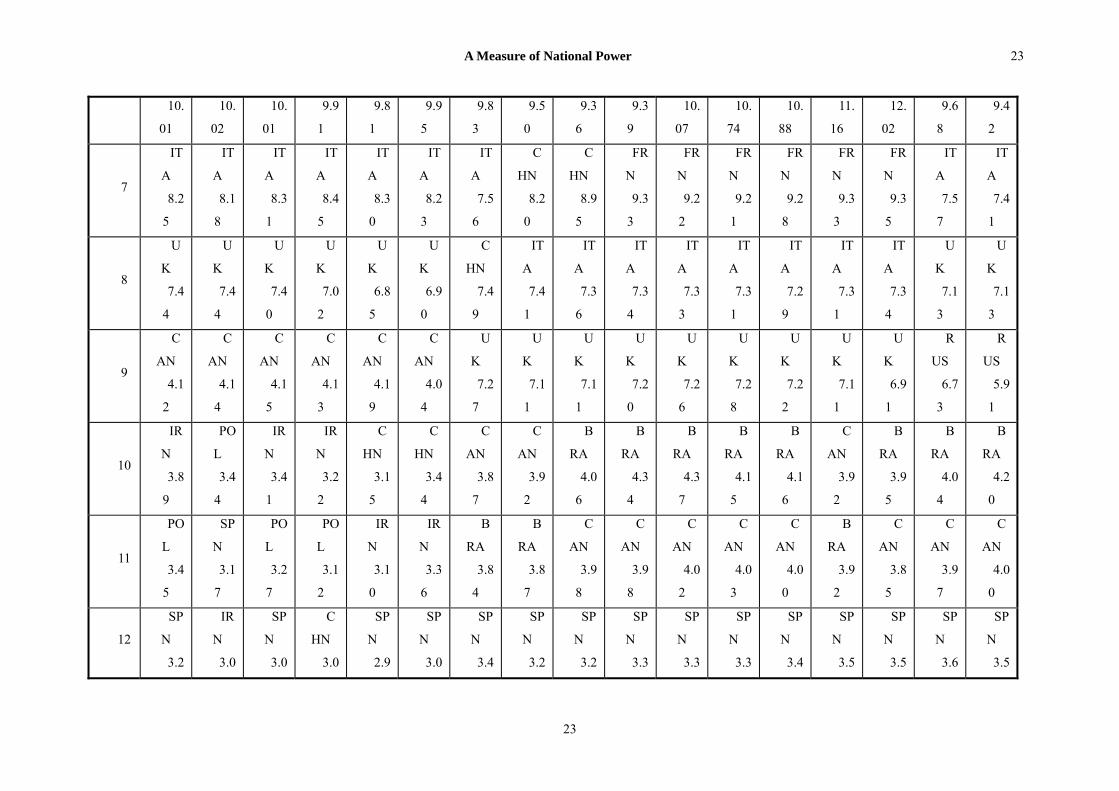
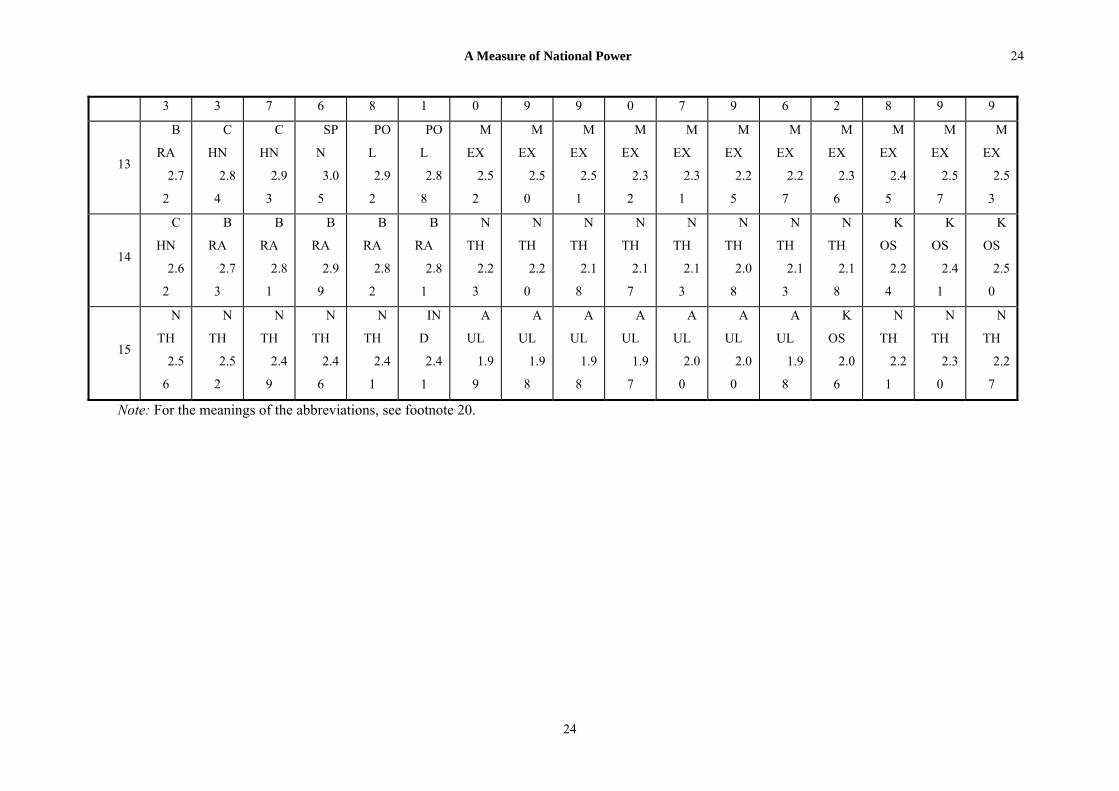
of power over time, I list the power rankings and scores of the top 15 nations (including the
EC) from 1977 to 1993 in Tables 4-6.20
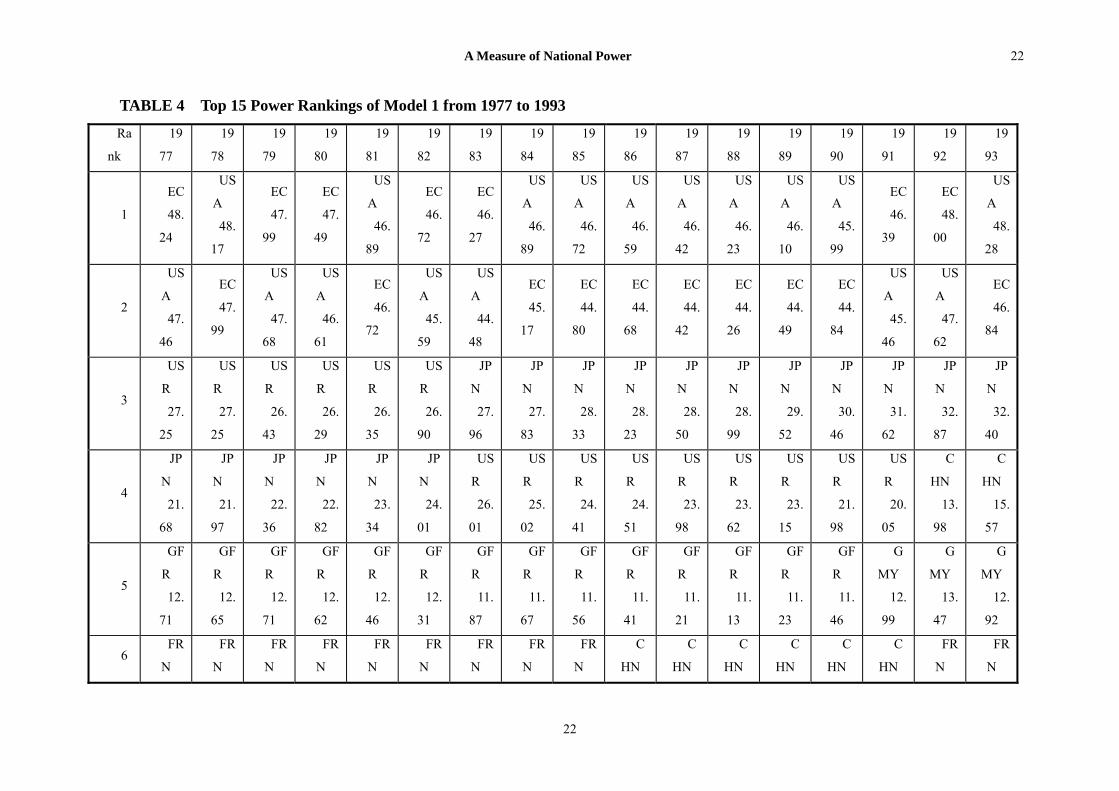
Power Transitions of Model 1
In Table 4, using Model 1, the EC and the United States exchange the first and second
places. This seems to imply that member nations of the EC are more on an equal footing
with the United States when they act as a collective entity than when they act as individual
nations. This is perhaps more true in economic disputes. The United States experienced
its lowest percentage (22.24%) of the total world production in 1983, and its highest (24.14%)
Efraim Inbar and Gabriel Sheffer, ed., The National Security of Small States in a Changing World(Portland,
OR: Frank Cass, 1997). 20 In Tables 4-6, abbreviations of nation names are as follows: ARG = Argentina, AUL = Australia, BRA =
Brazil, CAN = Canada, CHN = China, CZE = Czechoslovakia, EC = European Community, FRN = France,
GDR = East Germany, GFR = West Germany, GMY = Germany, IND = India, INS = Indonesia, IRN = Iran,
ITA = Italy, JPN = Japan, KOS = South Korea, KUW = Kuwait, NTH = The Netherlands, POL = Poland, RUS
= Russia, SAU = Saudi Arabia, SPN = Spain, SWD = Sweden, UAE = The United Arab Emirates, UK = the
United Kingdom/Great Britain, UKR = Ukraine, USA = The United States, and USR = The USSR/Soviet
Union.
18
A Measure of National Power
19
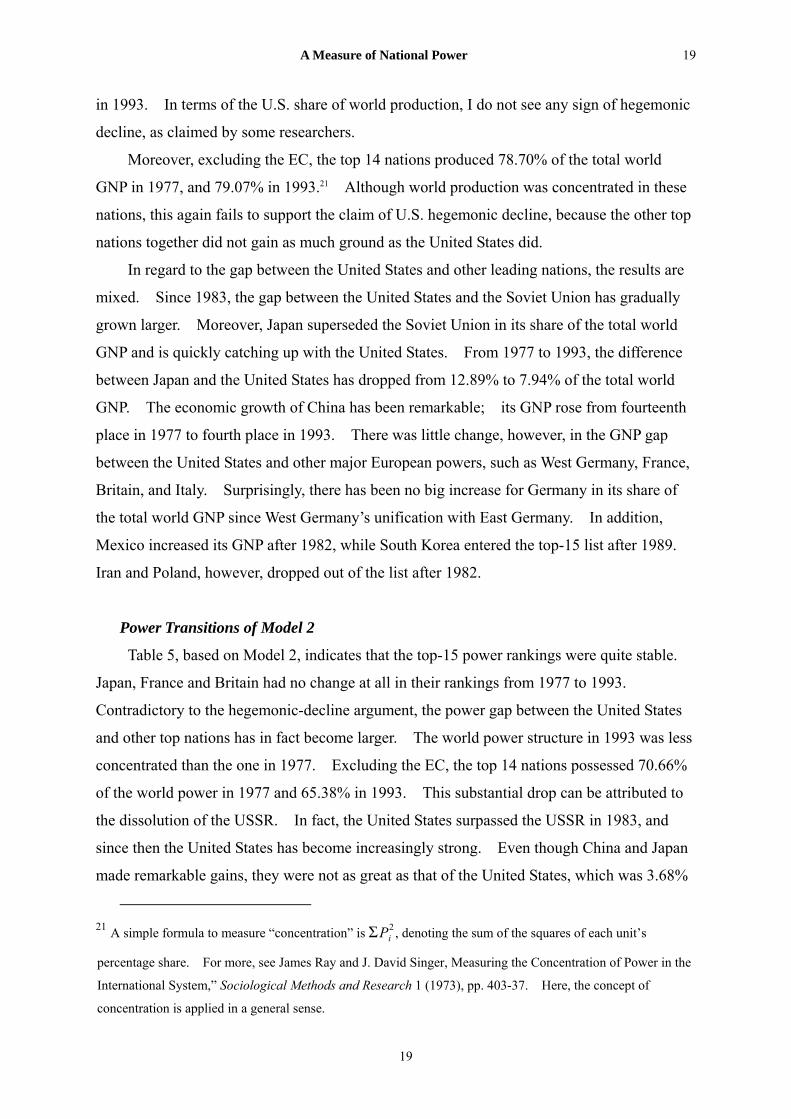
in 1993. In terms of the U.S. share of world production, I do not see any sign of hegemonic
decline, as claimed by some researchers.
Moreover, excluding the EC, the top 14 nations produced 78.70% of the total world
GNP in 1977, and 79.07% in 1993.21 Although world production was concentrated in these
nations, this again fails to support the claim of U.S. hegemonic decline, because the other top
nations together did not gain as much ground as the United States did.
In regard to the gap between the United States and other leading nations, the results are
mixed. Since 1983, the gap between the United States and the Soviet Union has gradually
grown larger. Moreover, Japan superseded the Soviet Union in its share of the total world
GNP and is quickly catching up with the United States. From 1977 to 1993, the difference
between Japan and the United States has dropped from 12.89% to 7.94% of the total world
GNP. The economic growth of China has been remarkable; its GNP rose from fourteenth
place in 1977 to fourth place in 1993. There was little change, however, in the GNP gap
between the United States and other major European powers, such as West Germany, France,
Britain, and Italy. Surprisingly, there has been no big increase for Germany in its share of
the total world GNP since West Germany’s unification with East Germany. In addition,
Mexico increased its GNP after 1982, while South Korea entered the top-15 list after 1989.
Iran and Poland, however, dropped out of the list after 1982.
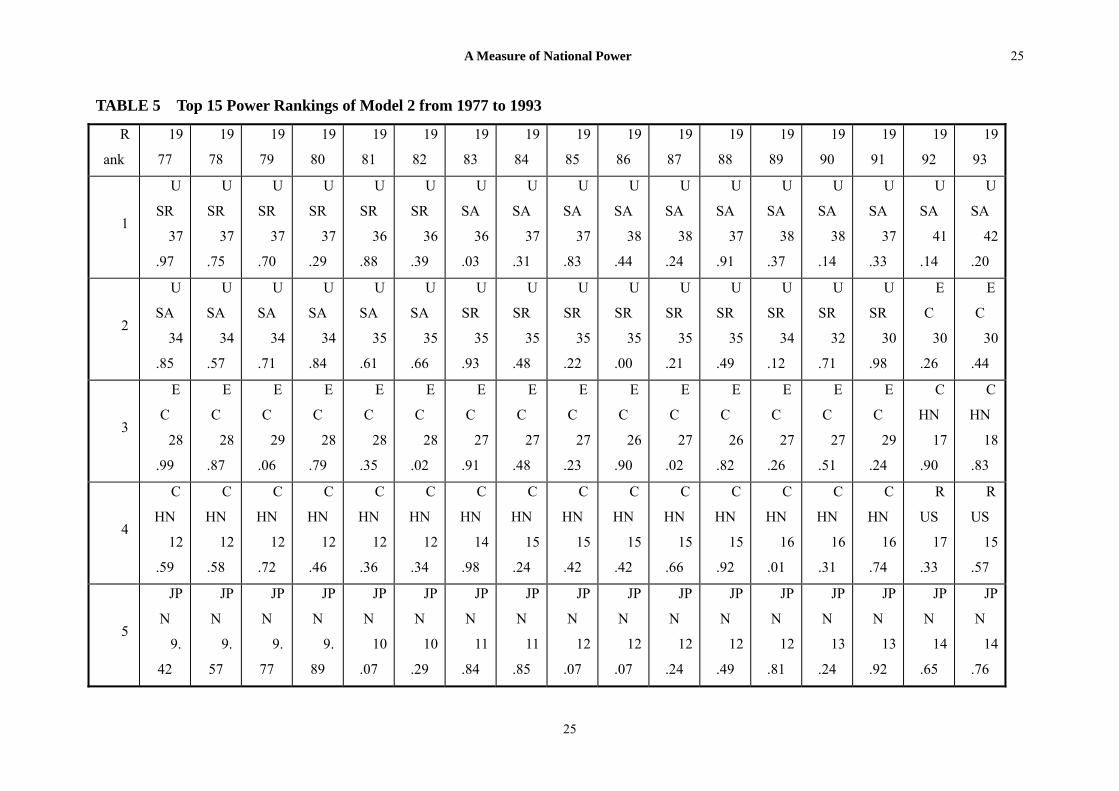
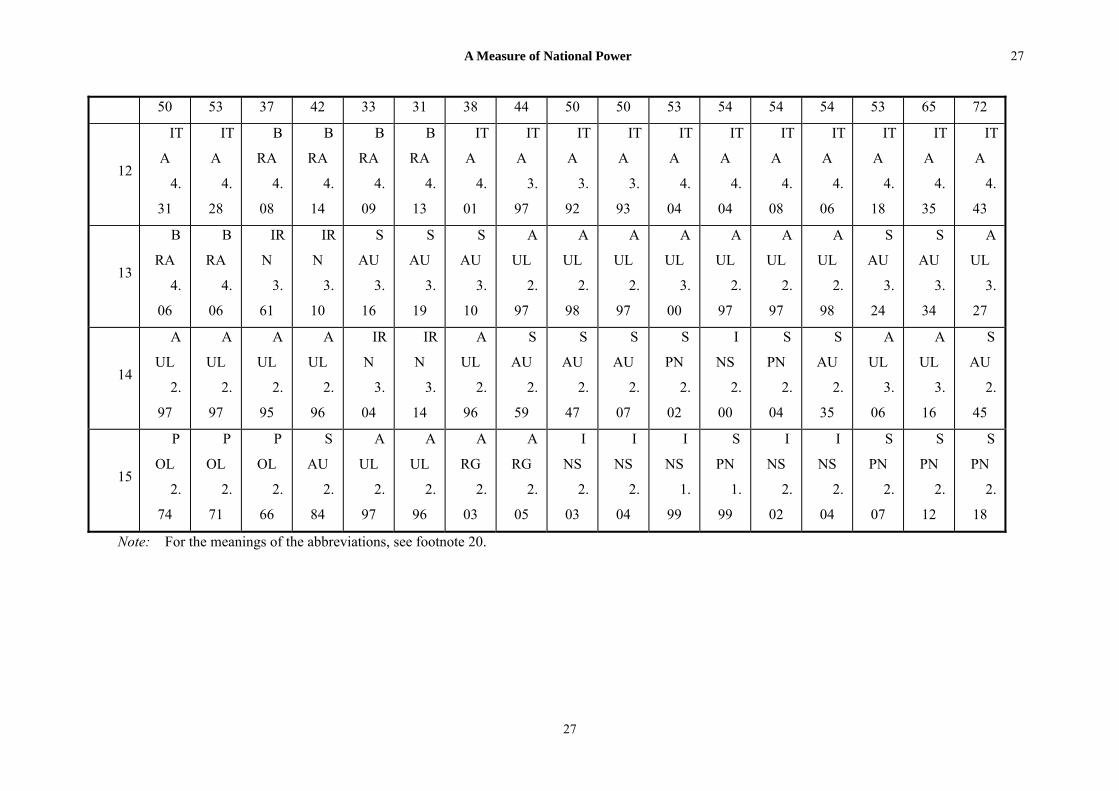
Power Transitions of Model 2
Table 5, based on Model 2, indicates that the top-15 power rankings were quite stable.
Japan, France and Britain had no change at all in their rankings from 1977 to 1993.
Contradictory to the hegemonic-decline argument, the power gap between the United States
and other top nations has in fact become larger. The world power structure in 1993 was less
concentrated than the one in 1977. Excluding the EC, the top 14 nations possessed 70.66%
of the world power in 1977 and 65.38% in 1993. This substantial drop can be attributed to
the dissolution of the USSR. In fact, the United States surpassed the USSR in 1983, and
since then the United States has become increasingly strong. Even though China and Japan
made remarkable gains, they were not as great as that of the United States, which was 3.68%
21 A simple formula to measure “concentration” is ΣP , denoting the sum of the squares of each unit’s
percentage share. For more, see James Ray and J. David Singer, Measuring the Concentration of Power in the
International System,” Sociological Methods and Research 1 (1973), pp. 403-37. Here, the concept of
concentration is applied in a general sense.
i2
19
A Measure of National Power
20
of total world power. Recall that in Model 1, the EC is presented as being as powerful as
the United States in terms of economic strength. But adding other elements to the power
equation, as in Model 2, the EC was 25% less powerful in total strength than the United
States. Since 1992, the United States has been the only remaining superpower and is
considered to be “the greatest nation on earth.” Model 2 clearly provides a more realistic
description and much richer interpretations of national power than Model 1 does.
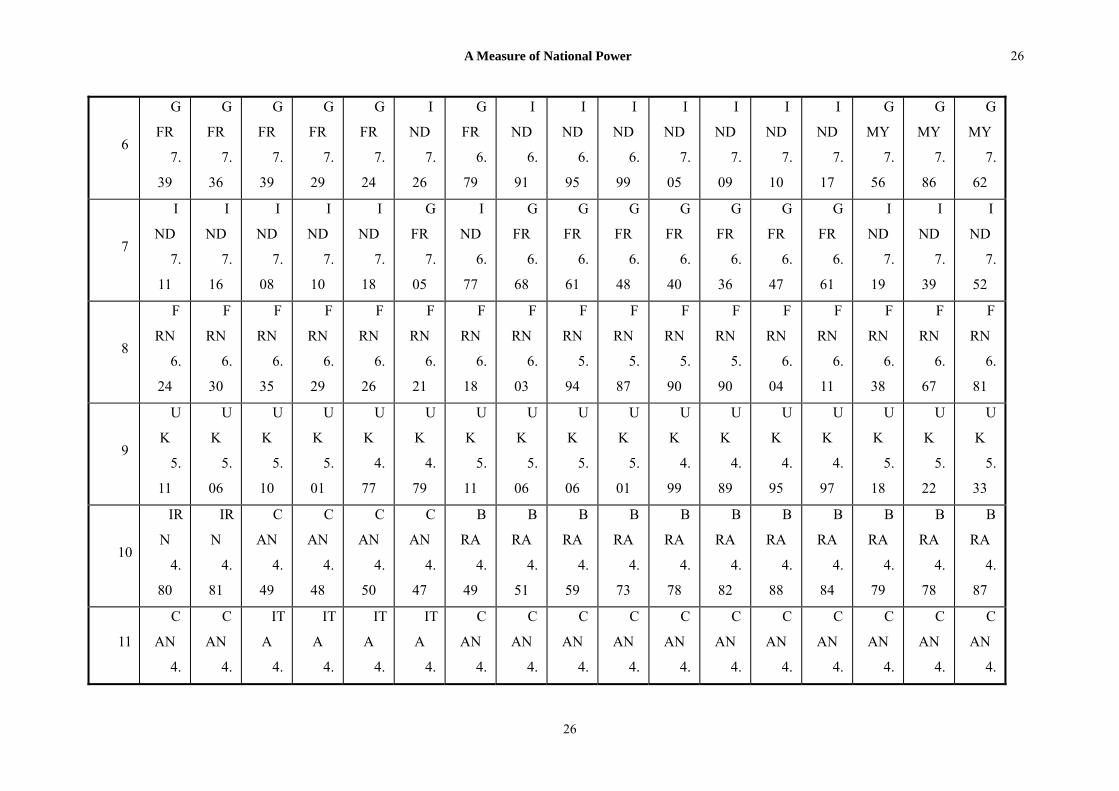
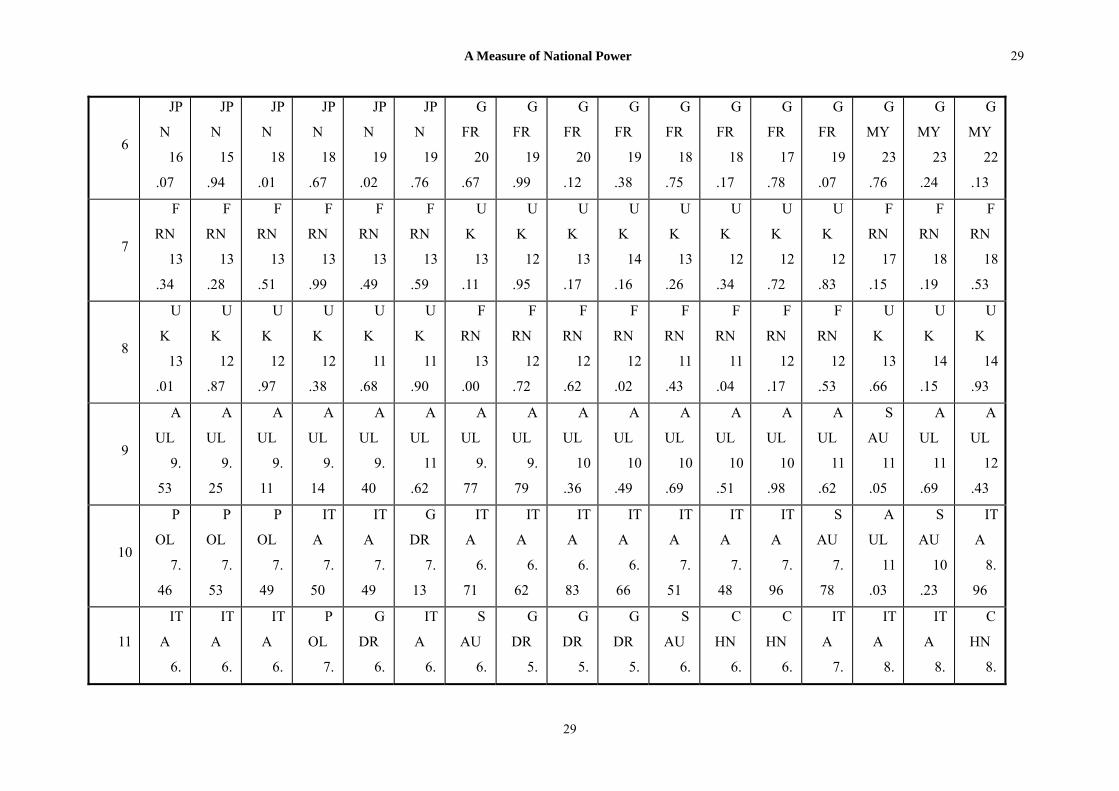
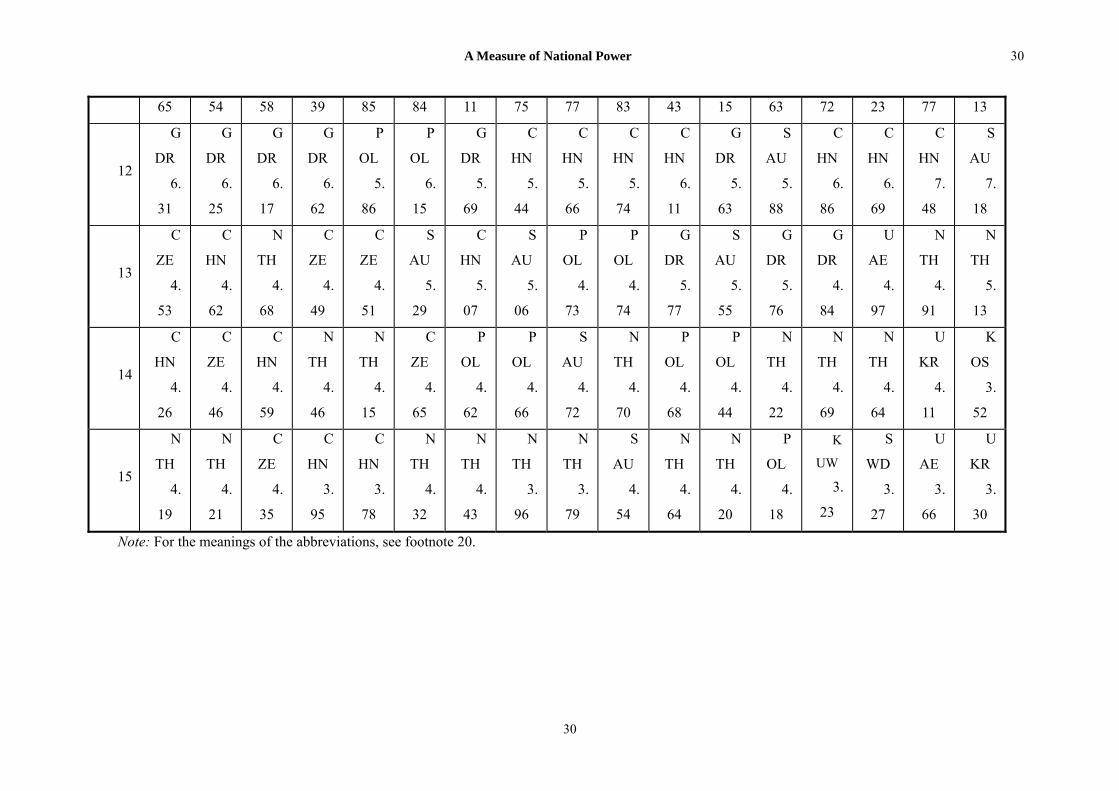
Power Transitions of Model 3
Table 6 presents some exaggerated effects of using the capacity index constructed by
energy consumption per capita as a multiplier of Model 2. These results present the United
States as about ten times stronger than Japan, and more than twenty times stronger than China.
Moreover, Kuwait is presented as the fifteenth most powerful nation in 1990, and the United
Arab Emirates as the thirteenth most powerful nation in 1991 and the fifteenth in 1992.
These assessments seem to be so unrealistic as to rule out Model 3 as a proper presentation of
power rankings.
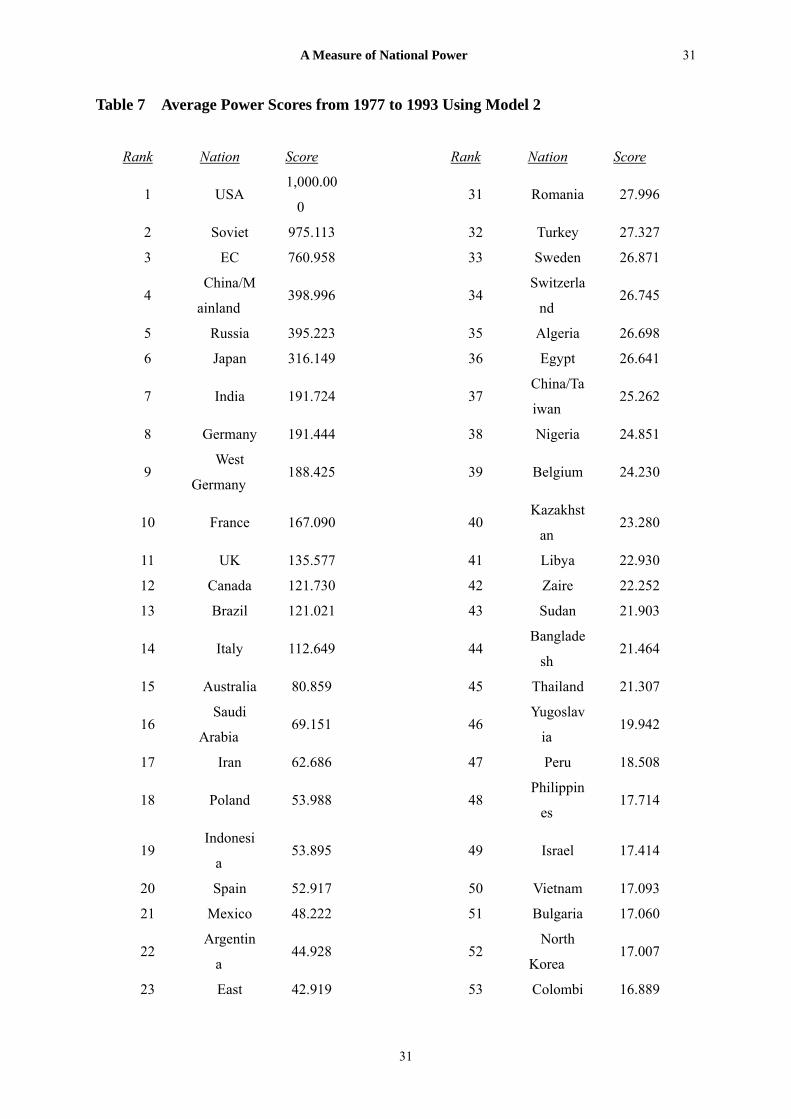
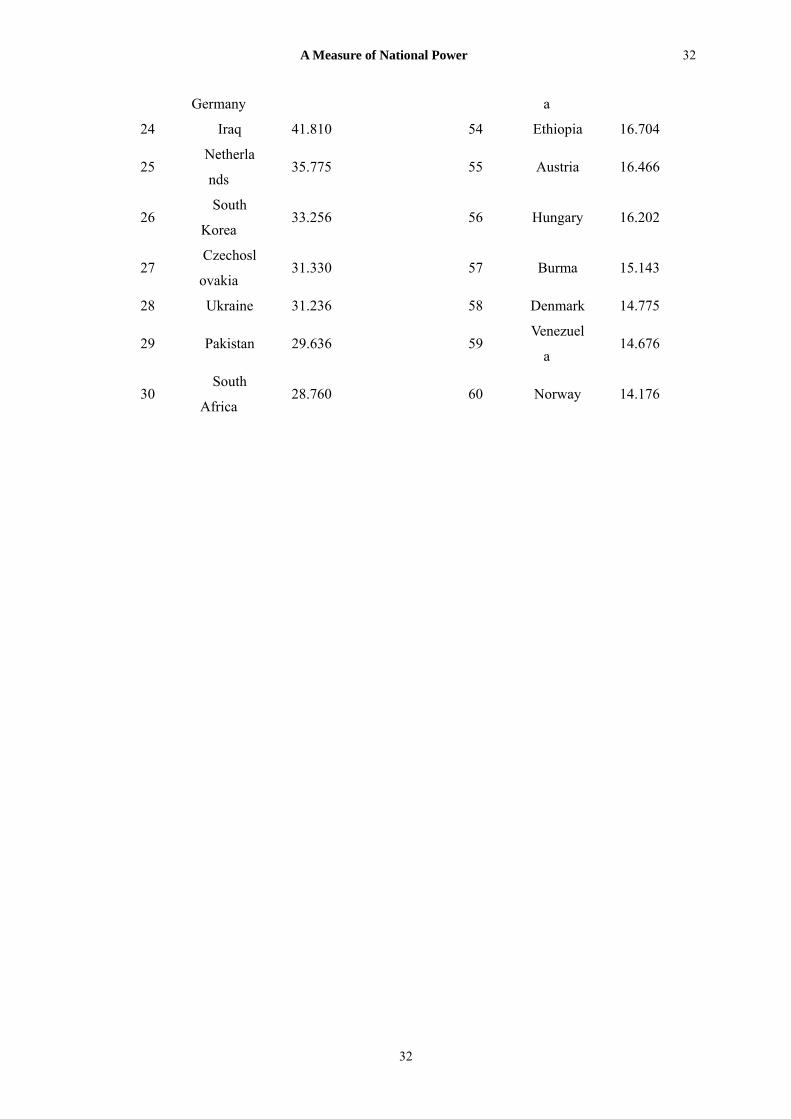
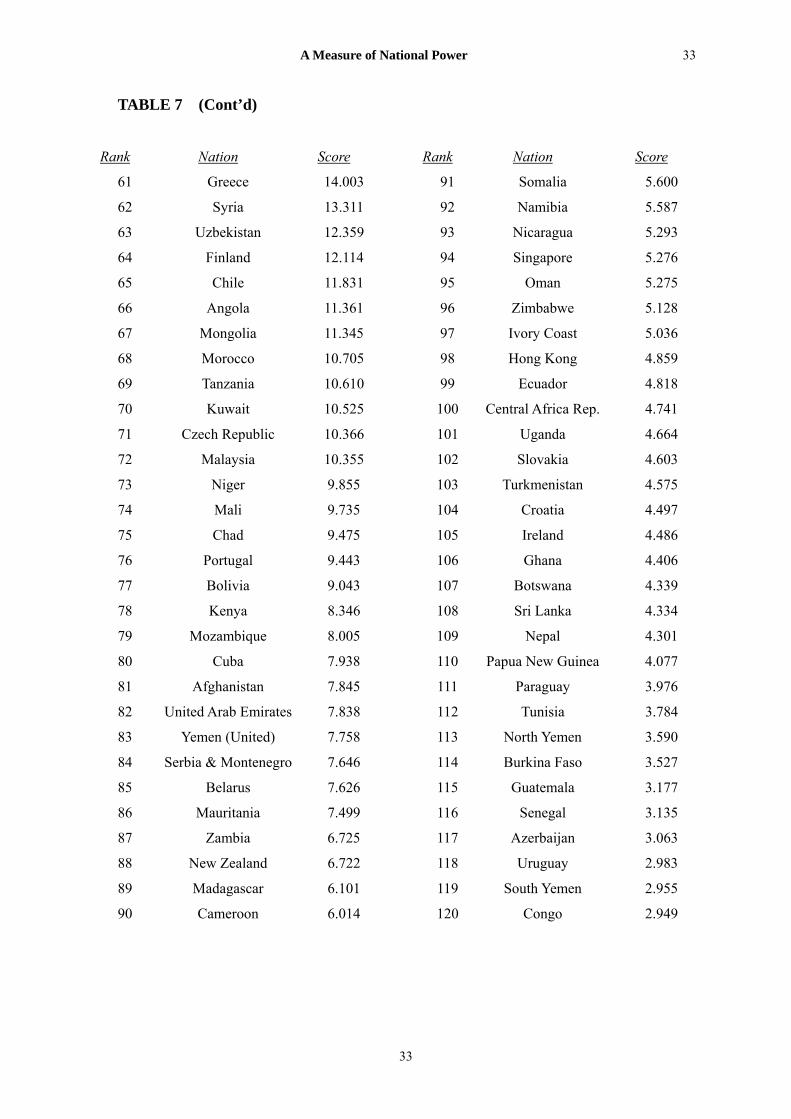
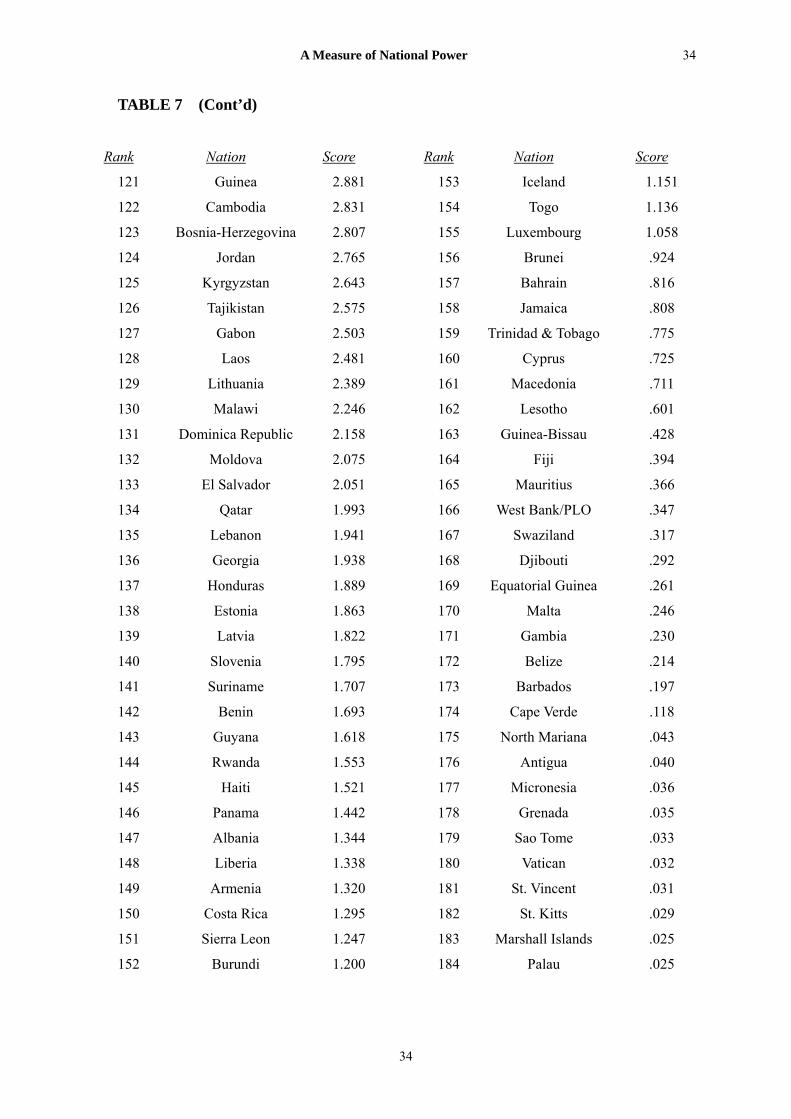
To promote future studies on assessing national power, Table 7 lists the results of the
relative capability index for all the entities included in this project, using the mean values of
Model 2 from 1977 to 1993. To make the table readable, the scale is enlarged by 1,000
times, by assigning a base score of 1,000 to the United States.
CONCLUSION
My exposition shows that Model 2 works better in terms of theoretical relevance and
strategic implications than does Model 1 or Model 3. Economic strength is only one
ingredient of power. The power ranking in Mode1 1 is biased in favor of those nations with
strong economies and against those nations who have weak economies but have other
strengths. The variable of energy consumption per capita tends to be related to the latitude
of a nation and to whether or not it has oil resources. In Model 3, the capacity index based
on energy consumption per capita yields some exaggerated and unreasonable results that
contradict common sense and do not correspond to the real-world context. In contrast,
Model 2 provides insight for interpreting the power structure before and after the end of Cold
War, and has realistic strategic implications. Given this excellent performance by Model 2,
I speculate that the capacity of a nation has already contributed to its achieving and
20
A Measure of National Power
21
21
maintaining its levels of productivity (i.e., GNP) and force (i.e., military expenditure). That
is to say, the process of maintaining high productivity or large armed forces involves the
intangible factors that show how capable a nation is of mobilizing resources and realizing its
potential power. For this reason, even without including a capacity index, Model 2 is
sufficient to provide a valid measure of national power.
In some sense, power, like beauty, is in the eye of the beholder. In reality,
experimentation with one-on-one, all-out conflicts between nations, as the acid test for power
equations, is virtually impossible (and indeed, unthinkable). Therefore, some would argue
that the quest for a truthful representation of national power is doomed to be futile. As
demonstrated above, however, through interpretive filters—criteria such as theoretical import
and strategic implications—I was able to evaluate the explanatory efficacy of different power
equations. The next step is to apply Model 2 to cross-national studies or power-related
analyses to assess its empirical performance. Perhaps after doing that, one can determine
whether or not Model 2 is truly useful, and possibly have a better grasp of the nature of power.
A Measure of National Power
22
TABLE 4 Top 15 Power Rankings of Model 1 from 1977 to 1993
Ra
nk
19
77
19
78
19
79
19
80
19
81
19
82
19
83
19
84
19
85
19
86
19
87
19
88
19
89
19
90
19
91
19
92
19
93
1
EC
48.
24
US
A
48.
17
EC
47.
99
EC
47.
49
US
A
46.
89
EC
46.
72
EC
46.
27
US
A
46.
89
US
A
46.
72
US
A
46.
59
US
A
46.
42
US
A
46.
23
US
A
46.
10
US
A
45.
99
EC
46.
39
EC
48.
00
US
A
48.
28
2
US
A
47.
46
EC
47.
99
US
A
47.
68
US
A
46.
61
EC
46.
72
US
A
45.
59
US
A
44.
48
EC
45.
17
EC
44.
80
EC
44.
68
EC
44.
42
EC
44.
26
EC
44.
49
EC
44.
84
US
A
45.
46
US
A
47.
62
EC
46.
84
3
US
R
27.
25
US
R
27.
25
US
R
26.
43
US
R
26.
29
US
R
26.
35
US
R
26.
90
JP
N
27.
96
JP
N
27.
83
JP
N
28.
33
JP
N
28.
23
JP
N
28.
50
JP
N
28.
99
JP
N
29.
52
JP
N
30.
46
JP
N
31.
62
JP
N
32.
87
JP
N
32.
40
4
JP
N
21.
68
JP
N
21.
97
JP
N
22.
36
JP
N
22.
82
JP
N
23.
34
JP
N
24.
01
US
R
26.
01
US
R
25.
02
US
R
24.
41
US
R
24.
51
US
R
23.
98
US
R
23.
62
US
R
23.
15
US
R
21.
98
US
R
20.
05
C
HN
13.
98
C
HN
15.
57
5
GF
R
12.
71
GF
R
12.
65
GF
R
12.
71
GF
R
12.
62
GF
R
12.
46
GF
R
12.
31
GF
R
11.
87
GF
R
11.
67
GF
R
11.
56
GF
R
11.
41
GF
R
11.
21
GF
R
11.
13
GF
R
11.
23
GF
R
11.
46
G
MY
12.
99
G
MY
13.
47
G
MY
12.
92
6 FR
N
FR
N
FR
N
FR
N
FR
N
FR
N
FR
N
FR
N
FR
N
C
HN
C
HN
C
HN
C
HN
C
HN
C
HN
FR
N
FR
N
22
A Measure of National Power
23
10.
01
10.
02
10.
01
9.9
1
9.8
1
9.9
5
9.8
3
9.5
0
9.3
6
9.3
9
10.
07
10.
74
10.
88
11.
16
12.
02
9.6
8
9.4
2
7
IT
A
8.2
5
IT
A
8.1
8
IT
A
8.3
1
IT
A
8.4
5
IT
A
8.3
0
IT
A
8.2
3
IT
A
7.5
6
C
HN
8.2
0
C
HN
8.9
5
FR
N
9.3
3
FR
N
9.2
2
FR
N
9.2
1
FR
N
9.2
8
FR
N
9.3
3
FR
N
9.3
5
IT
A
7.5
7
IT
A
7.4
1
8
U
K
7.4
4
U
K
7.4
4
U
K
7.4
0
U
K
7.0
2
U
K
6.8
5
U
K
6.9
0
C
HN
7.4
9
IT
A
7.4
1
IT
A
7.3
6
IT
A
7.3
4
IT
A
7.3
3
IT
A
7.3
1
IT
A
7.2
9
IT
A
7.3
1
IT
A
7.3
4
U
K
7.1
3
U
K
7.1
3
9
C
AN
4.1
2
C
AN
4.1
4
C
AN
4.1
5
C
AN
4.1
3
C
AN
4.1
9
C
AN
4.0
4
U
K
7.2
7
U
K
7.1
1
U
K
7.1
1
U
K
7.2
0
U
K
7.2
6
U
K
7.2
8
U
K
7.2
2
U
K
7.1
1
U
K
6.9
1
R
US
6.7
3
R
US
5.9
1
10
IR
N
3.8
9
PO
L
3.4
4
IR
N
3.4
1
IR
N
3.2
2
C
HN
3.1
5
C
HN
3.4
4
C
AN
3.8
7
C
AN
3.9
2
B
RA
4.0
6
B
RA
4.3
4
B
RA
4.3
7
B
RA
4.1
5
B
RA
4.1
6
C
AN
3.9
2
B
RA
3.9
5
B
RA
4.0
4
B
RA
4.2
0
11
PO
L
3.4
5
SP
N
3.1
7
PO
L
3.2
7
PO
L
3.1
2
IR
N
3.1
0
IR
N
3.3
6
B
RA
3.8
4
B
RA
3.8
7
C
AN
3.9
8
C
AN
3.9
8
C
AN
4.0
2
C
AN
4.0
3
C
AN
4.0
0
B
RA
3.9
2
C
AN
3.8
5
C
AN
3.9
7
C
AN
4.0
0
12
SP
N
3.2
IR
N
3.0
SP
N
3.0
C
HN
3.0
SP
N
2.9
SP
N
3.0
SP
N
3.4
SP
N
3.2
SP
N
3.2
SP
N
3.3
SP
N
3.3
SP
N
3.3
SP
N
3.4
SP
N
3.5
SP
N
3.5
SP
N
3.6
SP
N
3.5
23
A Measure of National Power
24
3 3 7 6 8 1 0 9 9 0 7 9 6 2 8 9 9
13
B
RA
2.7
2
C
HN
2.8
4
C
HN
2.9
3
SP
N
3.0
5
PO
L
2.9
2
PO
L
2.8
8
M
EX
2.5
2
M
EX
2.5
0
M
EX
2.5
1
M
EX
2.3
2
M
EX
2.3
1
M
EX
2.2
5
M
EX
2.2
7
M
EX
2.3
6
M
EX
2.4
5
M
EX
2.5
7
M
EX
2.5
3
14
C
HN
2.6
2
B
RA
2.7
3
B
RA
2.8
1
B
RA
2.9
9
B
RA
2.8
2
B
RA
2.8
1
N
TH
2.2
3
N
TH
2.2
0
N
TH
2.1
8
N
TH
2.1
7
N
TH
2.1
3
N
TH
2.0
8
N
TH
2.1
3
N
TH
2.1
8
K
OS
2.2
4
K
OS
2.4
1
K
OS
2.5
0
15
N
TH
2.5
6
N
TH
2.5
2
N
TH
2.4
9
N
TH
2.4
6
N
TH
2.4
1
IN
D
2.4
1
A
UL
1.9
9
A
UL
1.9
8
A
UL
1.9
8
A
UL
1.9
7
A
UL
2.0
0
A
UL
2.0
0
A
UL
1.9
8
K
OS
2.0
6
N
TH
2.2
1
N
TH
2.3
0
N
TH
2.2
7
Note: For the meanings of the abbreviations, see footnote 20.
24
A Measure of National Power
25
TABLE 5 Top 15 Power Rankings of Model 2 from 1977 to 1993
R
ank
19
77
19
78
19
79
19
80
19
81
19
82
19
83
19
84
19
85
19
86
19
87
19
88
19
89
19
90
19
91
19
92
19
93
1
U
SR
37
.97
U
SR
37
.75
U
SR
37
.70
U
SR
37
.29
U
SR
36
.88
U
SR
36
.39
U
SA
36
.03
U
SA
37
.31
U
SA
37
.83
U
SA
38
.44
U
SA
38
.24
U
SA
37
.91
U
SA
38
.37
U
SA
38
.14
U
SA
37
.33
U
SA
41
.14
U
SA
42
.20
2
U
SA
34
.85
U
SA
34
.57
U
SA
34
.71
U
SA
34
.84
U
SA
35
.61
U
SA
35
.66
U
SR
35
.93
U
SR
35
.48
U
SR
35
.22
U
SR
35
.00
U
SR
35
.21
U
SR
35
.49
U
SR
34
.12
U
SR
32
.71
U
SR
30
.98
E
C
30
.26
E
C
30
.44
3
E
C
28
.99
E
C
28
.87
E
C
29
.06
E
C
28
.79
E
C
28
.35
E
C
28
.02
E
C
27
.91
E
C
27
.48
E
C
27
.23
E
C
26
.90
E
C
27
.02
E
C
26
.82
E
C
27
.26
E
C
27
.51
E
C
29
.24
C
HN
17
.90
C
HN
18
.83
4
C
HN
12
.59
C
HN
12
.58
C
HN
12
.72
C
HN
12
.46
C
HN
12
.36
C
HN
12
.34
C
HN
14
.98
C
HN
15
.24
C
HN
15
.42
C
HN
15
.42
C
HN
15
.66
C
HN
15
.92
C
HN
16
.01
C
HN
16
.31
C
HN
16
.74
R
US
17
.33
R
US
15
.57
5
JP
N
9.
42
JP
N
9.
57
JP
N
9.
77
JP
N
9.
89
JP
N
10
.07
JP
N
10
.29
JP
N
11
.84
JP
N
11
.85
JP
N
12
.07
JP
N
12
.07
JP
N
12
.24
JP
N
12
.49
JP
N
12
.81
JP
N
13
.24
JP
N
13
.92
JP
N
14
.65
JP
N
14
.76
25
A Measure of National Power
26
6
G
FR
7.
39
G
FR
7.
36
G
FR
7.
39
G
FR
7.
29
G
FR
7.
24
I
ND
7.
26
G
FR
6.
79
I
ND
6.
91
I
ND
6.
95
I
ND
6.
99
I
ND
7.
05
I
ND
7.
09
I
ND
7.
10
I
ND
7.
17
G
MY
7.
56
G
MY
7.
86
G
MY
7.
62
7
I
ND
7.
11
I
ND
7.
16
I
ND
7.
08
I
ND
7.
10
I
ND
7.
18
G
FR
7.
05
I
ND
6.
77
G
FR
6.
68
G
FR
6.
61
G
FR
6.
48
G
FR
6.
40
G
FR
6.
36
G
FR
6.
47
G
FR
6.
61
I
ND
7.
19
I
ND
7.
39
I
ND
7.
52
8
F
RN
6.
24
F
RN
6.
30
F
RN
6.
35
F
RN
6.
29
F
RN
6.
26
F
RN
6.
21
F
RN
6.
18
F
RN
6.
03
F
RN
5.
94
F
RN
5.
87
F
RN
5.
90
F
RN
5.
90
F
RN
6.
04
F
RN
6.
11
F
RN
6.
38
F
RN
6.
67
F
RN
6.
81
9
U
K
5.
11
U
K
5.
06
U
K
5.
10
U
K
5.
01
U
K
4.
77
U
K
4.
79
U
K
5.
11
U
K
5.
06
U
K
5.
06
U
K
5.
01
U
K
4.
99
U
K
4.
89
U
K
4.
95
U
K
4.
97
U
K
5.
18
U
K
5.
22
U
K
5.
33
10
IR
N
4.
80
IR
N
4.
81
C
AN
4.
49
C
AN
4.
48
C
AN
4.
50
C
AN
4.
47
B
RA
4.
49
B
RA
4.
51
B
RA
4.
59
B
RA
4.
73
B
RA
4.
78
B
RA
4.
82
B
RA
4.
88
B
RA
4.
84
B
RA
4.
79
B
RA
4.
78
B
RA
4.
87
11
C
AN
4.
C
AN
4.
IT
A
4.
IT
A
4.
IT
A
4.
IT
A
4.
C
AN
4.
C
AN
4.
C
AN
4.
C
AN
4.
C
AN
4.
C
AN
4.
C
AN
4.
C
AN
4.
C
AN
4.
C
AN
4.
C
AN
4.
26
A Measure of National Power
27
50 53 37 42 33 31 38 44 50 50 53 54 54 54 53 65 72
12
IT
A
4.
31
IT
A
4.
28
B
RA
4.
08
B
RA
4.
14
B
RA
4.
09
B
RA
4.
13
IT
A
4.
01
IT
A
3.
97
IT
A
3.
92
IT
A
3.
93
IT
A
4.
04
IT
A
4.
04
IT
A
4.
08
IT
A
4.
06
IT
A
4.
18
IT
A
4.
35
IT
A
4.
43
13
B
RA
4.
06
B
RA
4.
06
IR
N
3.
61
IR
N
3.
10
S
AU
3.
16
S
AU
3.
19
S
AU
3.
10
A
UL
2.
97
A
UL
2.
98
A
UL
2.
97
A
UL
3.
00
A
UL
2.
97
A
UL
2.
97
A
UL
2.
98
S
AU
3.
24
S
AU
3.
34
A
UL
3.
27
14
A
UL
2.
97
A
UL
2.
97
A
UL
2.
95
A
UL
2.
96
IR
N
3.
04
IR
N
3.
14
A
UL
2.
96
S
AU
2.
59
S
AU
2.
47
S
AU
2.
07
S
PN
2.
02
I
NS
2.
00
S
PN
2.
04
S
AU
2.
35
A
UL
3.
06
A
UL
3.
16
S
AU
2.
45
15
P
OL
2.
74
P
OL
2.
71
P
OL
2.
66
S
AU
2.
84
A
UL
2.
97
A
UL
2.
96
A
RG
2.
03
A
RG
2.
05
I
NS
2.
03
I
NS
2.
04
I
NS
1.
99
S
PN
1.
99
I
NS
2.
02
I
NS
2.
04
S
PN
2.
07
S
PN
2.
12
S
PN
2.
18
Note: For the meanings of the abbreviations, see footnote 20.
27

A Measure of National Power
28
TABLE 6 Top 15 Power Rankings of Model 3 from 1977 to 1993
R
ank
19
77
19
78
19
79
19
80
19
81
19
82
19
83
19
84
19
85
19
86
19
87
19
88
19
89
19
90
19
91
19
92
19
93
1
U
SA
19
7.6
U
SA
19
5.2
U
SA
19
5.3
U
SA
18
5.5
U
SA
19
1.9
U
SA
18
4.3
U
SA
18
4.2
U
SA
19
2.2
U
SA
19
1.6
U
SA
19
2.4
U
SA
19
0.0
U
SA
19
3.8
U
SA
19
8.6
U
SA
19
6.6
U
SA
20
0.9
U
SA
22
1.6
U
SA
22
8.9
2
U
SR
10
2.3
U
SR
10
2.1
U
SR
10
3.8
U
SR
10
6.7
U
SR
11
1.8
U
SR
11
5.0
U
SR
11
6.5
U
SR
11
4.1
U
SR
11
4.4
U
SR
11
7.9
U
SR
12
1.6
U
SR
12
4.8
U
SR
11
4.1
U
SR
11
3.3
U
SR
97
.96
E
C
75
.47
E
C
75
.85
3
E
C
61
.10
E
C
61
.22
E
C
62
.49
E
C
63
.14
E
C
61
.65
E
C
61
.04
E
C
61
.25
E
C
59
.49
E
C
59
.77
E
C
60
.55
E
C
59
.62
E
C
57
.85
E
C
59
.77
E
C
62
.12
E
C
73
.17
R
US
63
.98
R
US
54
.18
4
C
AN
23
.29
C
AN
23
.29
C
AN
24
.00
C
AN
23
.45
C
AN
23
.93
C
AN
23
.77
C
AN
22
.97
JP
N
24
.23
JP
N
23
.75
JP
N
23
.07
JP
N
23
.83
JP
N
25
.00
JP
N
26
.39
JP
N
28
.44
JP
N
32
.61
JP
N
34
.79
JP
N
35
.51
5
G
FR
20
.91
G
FR
21
.55
G
FR
21
.94
G
FR
21
.37
G
FR
21
.48
G
FR
21
.27
JP
N
22
.10
C
AN
23
.36
C
AN
23
.61
C
AN
23
.02
C
AN
23
.37
C
AN
24
.42
C
AN
25
.33
C
AN
24
.10
C
AN
24
.76
C
AN
25
.57
C
AN
25
.80
28
A Measure of National Power
29
6
JP
N
16
.07
JP
N
15
.94
JP
N
18
.01
JP
N
18
.67
JP
N
19
.02
JP
N
19
.76
G
FR
20
.67
G
FR
19
.99
G
FR
20
.12
G
FR
19
.38
G
FR
18
.75
G
FR
18
.17
G
FR
17
.78
G
FR
19
.07
G
MY
23
.76
G
MY
23
.24
G
MY
22
.13
7
F
RN
13
.34
F
RN
13
.28
F
RN
13
.51
F
RN
13
.99
F
RN
13
.49
F
RN
13
.59
U
K
13
.11
U
K
12
.95
U
K
13
.17
U
K
14
.16
U
K
13
.26
U
K
12
.34
U
K
12
.72
U
K
12
.83
F
RN
17
.15
F
RN
18
.19
F
RN
18
.53
8
U
K
13
.01
U
K
12
.87
U
K
12
.97
U
K
12
.38
U
K
11
.68
U
K
11
.90
F
RN
13
.00
F
RN
12
.72
F
RN
12
.62
F
RN
12
.02
F
RN
11
.43
F
RN
11
.04
F
RN
12
.17
F
RN
12
.53
U
K
13
.66
U
K
14
.15
U
K
14
.93
9
A
UL
9.
53
A
UL
9.
25
A
UL
9.
11
A
UL
9.
14
A
UL
9.
40
A
UL
11
.62
A
UL
9.
77
A
UL
9.
79
A
UL
10
.36
A
UL
10
.49
A
UL
10
.69
A
UL
10
.51
A
UL
10
.98
A
UL
11
.62
S
AU
11
.05
A
UL
11
.69
A
UL
12
.43
10
P
OL
7.
46
P
OL
7.
53
P
OL
7.
49
IT
A
7.
50
IT
A
7.
49
G
DR
7.
13
IT
A
6.
71
IT
A
6.
62
IT
A
6.
83
IT
A
6.
66
IT
A
7.
51
IT
A
7.
48
IT
A
7.
96
S
AU
7.
78
A
UL
11
.03
S
AU
10
.23
IT
A
8.
96
11
IT
A
6.
IT
A
6.
IT
A
6.
P
OL
7.
G
DR
6.
IT
A
6.
S
AU
6.
G
DR
5.
G
DR
5.
G
DR
5.
S
AU
6.
C
HN
6.
C
HN
6.
IT
A
7.
IT
A
8.
IT
A
8.
C
HN
8.
29
A Measure of National Power
30
30
65 54 58 39 85 84 11 75 77 83 43 15 63 72 23 77 13
12
G
DR
6.
31
G
DR
6.
25
G
DR
6.
17
G
DR
6.
62
P
OL
5.
86
P
OL
6.
15
G
DR
5.
69
C
HN
5.
44
C
HN
5.
66
C
HN
5.
74
C
HN
6.
11
G
DR
5.
63
S
AU
5.
88
C
HN
6.
86
C
HN
6.
69
C
HN
7.
48
S
AU
7.
18
13
C
ZE
4.
53
C
HN
4.
62
N
TH
4.
68
C
ZE
4.
49
C
ZE
4.
51
S
AU
5.
29
C
HN
5.
07
S
AU
5.
06
P
OL
4.
73
P
OL
4.
74
G
DR
5.
77
S
AU
5.
55
G
DR
5.
76
G
DR
4.
84
U
AE
4.
97
N
TH
4.
91
N
TH
5.
13
14
C
HN
4.
26
C
ZE
4.
46
C
HN
4.
59
N
TH
4.
46
N
TH
4.
15
C
ZE
4.
65
P
OL
4.
62
P
OL
4.
66
S
AU
4.
72
N
TH
4.
70
P
OL
4.
68
P
OL
4.
44
N
TH
4.
22
N
TH
4.
69
N
TH
4.
64
U
KR
4.
11
K
OS
3.
52
15
N
TH
4.
19
N
TH
4.
21
C
ZE
4.
35
C
HN
3.
95
C
HN
3.
78
N
TH
4.
32
N
TH
4.
43
N
TH
3.
96
N
TH
3.
79
S
AU
4.
54
N
TH
4.
64
N
TH
4.
20
P
OL
4.
18
K
UW
3.
23
S
WD
3.
27
U
AE
3.
66
U
KR
3.
30
Note: For the meanings of the abbreviations, see footnote 20.
A Measure of National Power
31
Table 7 Average Power Scores from 1977 to 1993 Using Model 2
Rank Nation Score Rank Nation Score
1 USA 1,000.00
0 31 Romania 27.996
2 Soviet 975.113 32 Turkey 27.327
3 EC 760.958 33 Sweden 26.871
4 China/M
ainland 398.996 34
Switzerla
nd 26.745
5 Russia 395.223 35 Algeria 26.698
6 Japan 316.149 36 Egypt 26.641
7 India 191.724 37 China/Ta
iwan 25.262
8 Germany 191.444 38 Nigeria 24.851
9 West
Germany 188.425 39 Belgium 24.230
10 France 167.090 40 Kazakhst
an 23.280
11 UK 135.577 41 Libya 22.930
12 Canada 121.730 42 Zaire 22.252
13 Brazil 121.021 43 Sudan 21.903
14 Italy 112.649 44 Banglade
sh 21.464
15 Australia 80.859 45 Thailand 21.307
16 Saudi
Arabia 69.151 46
Yugoslav
ia 19.942
17 Iran 62.686 47 Peru 18.508
18 Poland 53.988 48 Philippin
es 17.714
19 Indonesi
a 53.895 49 Israel 17.414
20 Spain 52.917 50 Vietnam 17.093
21 Mexico 48.222 51 Bulgaria 17.060
22 Argentin
a 44.928 52
North
Korea 17.007
23 East 42.919 53 Colombi 16.889
31
A Measure of National Power
32
Germany a
24 Iraq 41.810 54 Ethiopia 16.704
25 Netherla
nds 35.775 55 Austria 16.466
26 South
Korea 33.256 56 Hungary 16.202
27 Czechosl
ovakia 31.330 57 Burma 15.143
28 Ukraine 31.236 58 Denmark 14.775
29 Pakistan 29.636 59 Venezuel
a 14.676
30 South
Africa 28.760 60 Norway 14.176
32
A Measure of National Power
33
TABLE 7 (Cont’d)
Rank Nation Score Rank Nation Score
61 Greece 14.003 91 Somalia 5.600
62 Syria 13.311 92 Namibia 5.587
63 Uzbekistan 12.359 93 Nicaragua 5.293
64 Finland 12.114 94 Singapore 5.276
65 Chile 11.831 95 Oman 5.275
66 Angola 11.361 96 Zimbabwe 5.128
67 Mongolia 11.345 97 Ivory Coast 5.036
68 Morocco 10.705 98 Hong Kong 4.859
69 Tanzania 10.610 99 Ecuador 4.818
70 Kuwait 10.525 100 Central Africa Rep. 4.741
71 Czech Republic 10.366 101 Uganda 4.664
72 Malaysia 10.355 102 Slovakia 4.603
73 Niger 9.855 103 Turkmenistan 4.575
74 Mali 9.735 104 Croatia 4.497
75 Chad 9.475 105 Ireland 4.486
76 Portugal 9.443 106 Ghana 4.406
77 Bolivia 9.043 107 Botswana 4.339
78 Kenya 8.346 108 Sri Lanka 4.334
79 Mozambique 8.005 109 Nepal 4.301
80 Cuba 7.938 110 Papua New Guinea 4.077
81 Afghanistan 7.845 111 Paraguay 3.976
82 United Arab Emirates 7.838 112 Tunisia 3.784
83 Yemen (United) 7.758 113 North Yemen 3.590
84 Serbia & Montenegro 7.646 114 Burkina Faso 3.527
85 Belarus 7.626 115 Guatemala 3.177
86 Mauritania 7.499 116 Senegal 3.135
87 Zambia 6.725 117 Azerbaijan 3.063
88 New Zealand 6.722 118 Uruguay 2.983
89 Madagascar 6.101 119 South Yemen 2.955
90 Cameroon 6.014 120 Congo 2.949
33
A Measure of National Power
34
TABLE 7 (Cont’d)
Rank Nation Score Rank Nation Score
121 Guinea 2.881 153 Iceland 1.151
122 Cambodia 2.831 154 Togo 1.136
123 Bosnia-Herzegovina 2.807 155 Luxembourg 1.058
124 Jordan 2.765 156 Brunei .924
125 Kyrgyzstan 2.643 157 Bahrain .816
126 Tajikistan 2.575 158 Jamaica .808
127 Gabon 2.503 159 Trinidad & Tobago .775
128 Laos 2.481 160 Cyprus .725
129 Lithuania 2.389 161 Macedonia .711
130 Malawi 2.246 162 Lesotho .601
131 Dominica Republic 2.158 163 Guinea-Bissau .428
132 Moldova 2.075 164 Fiji .394
133 El Salvador 2.051 165 Mauritius .366
134 Qatar 1.993 166 West Bank/PLO .347
135 Lebanon 1.941 167 Swaziland .317
136 Georgia 1.938 168 Djibouti .292
137 Honduras 1.889 169 Equatorial Guinea .261
138 Estonia 1.863 170 Malta .246
139 Latvia 1.822 171 Gambia .230
140 Slovenia 1.795 172 Belize .214
141 Suriname 1.707 173 Barbados .197
142 Benin 1.693 174 Cape Verde .118
143 Guyana 1.618 175 North Mariana .043
144 Rwanda 1.553 176 Antigua .040
145 Haiti 1.521 177 Micronesia .036
146 Panama 1.442 178 Grenada .035
147 Albania 1.344 179 Sao Tome .033
148 Liberia 1.338 180 Vatican .032
149 Armenia 1.320 181 St. Vincent .031
150 Costa Rica 1.295 182 St. Kitts .029
151 Sierra Leon 1.247 183 Marshall Islands .025
152 Burundi 1.200 184 Palau .025
34