Embed Size (px)
Citation preview
A MECHANICAL ANALYZER FOR
THE PREDICTION OF EARTHQUAKE STRESSES
M. A. BIOT
REPRINTEDFROM
BULLETINOFTEESEISMOL~G-ICALSOCIETY OF AMERICA
VOLUME31 : NUMBERS : A~~&1941
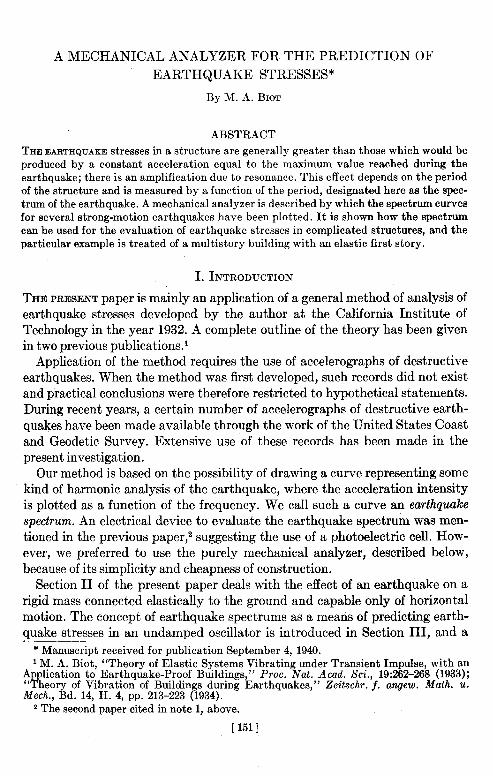
A MECHANICAL ANALYZER FOR THE PREDICTION OF
EARTHQUAKE STRESSES*
By M. A. BIOT
ABSTRACT
THE EARTHQUAKE stresses in a structure are generally greater than those which would be produced by a constant acceleration equal to the maximum value reached during the earthquake; there is an amplification due to resonance. This effect depends on the period of the structure and is measured by a function of the period, designated here as the spec- trum of the earthquake. A mechanical analyzer is described by which the spectrum curves for several strong-motion earthquakes have been plotted. It is shown how the spectrum can be used for the evaluation of earthquake stresses in complicated structures, and the particular example is treated of a multistory building with an elastic first story.
I. INTRODUCTION
THE PRESENT paper is mainly an application of a general method of analysis of earthquake stresses developed by the author at the California Institute of Technology in the year 1932. A complete outline of the theory has been given in two previous publications.’
Application of the method requires the use of accelerographs of destructive earthquakes. When the method was first developed, such records did not exist and practical conclusions were therefore restricted to hypothetical statements. During recent years, a certain number of accelerographs of destructive earth- quakes have been made available through the work of the United States Coast and Geodetic Survey. Extensive use of these records has been made in the present investigation.
Our method is based on the possibility of drawing a curve representing some kind of harmonic analysis of the earthquake, where the acceleration intensity is plotted as a function of the frequency. We call such a curve an earthquake spectrum. An electrical device to evaluate the earthquake spectrum was men- tioned in the previous paper,2 suggesting the use of a photoelectric cell. HOW- ever, we preferred to use the purely mechanical analyzer, described below, because of its simplicity and cheapness of construction.
Section II of the present paper deals with the effect of an earthquake on a rigid mass connected elastically to the ground and capable only of horizontal motion. The concept of earthquake spectrums as a means of predicting earth- quake stresses in an undamped oscillator is introduced in Section III, and a
* Manuscript received for publication September 4, 1940. 1 M. A. Biot, “Theory of Elastic Systems Vibrating under Transient Impulse, with an
Application to Earthquake-Proof Buildings,” Proc. Nut. Acad. Sci., 19:262-268 (1933); “Theory of Vibration of Buildings during Earthquakes,” Zeitschr. f. ungew. Math. U. Med., Bd. 14, H. 4, pp. 213-223 (1934).
2 The second paper cited in note 1, above.
[ I511
152 BULLETIN OF THE SEISMOLOGICAL SOCIETY OF AMERICA
mechanical analyzer for the evaluation of the spectrum is described. In Section IV are shown and discussed spectrum curves obtained with the analyzer from the acceleration records of various destructive earthquakes. Sections V and VI show how spectrum curves can be used to predict earthquake stresses in com- plex structures such as a building with an elastic first floor and the San Francisco-Oa.kland Bay Bridge. The former problem has also been solved in the previous work,3 but the results are presented here in a more applicable form. Applications of the concept of earthquake spectrum, using the author’s ana- lytical method, have also been made by R. R. Martel and M. P. White in an unpublished report,4 and experimental work along similar lines has been car- ried out by L. S. Jacobsen.
The use of a spectrum for the prediction of earthquake stresses has also been emphasized by H. Benioff. 5
The present work was carried out at Columbia University. Results were the subject of discussions with Professor R. R. Martel, to whom the author is indebted for valuable suggestions in the preparation of the manuscript.
The author also wishes to acknowledge the cooperative help of the United States Coast and Geodetic Survey, which supplied copies of the earthquake records andthe data for their interpretation.
II. EFFECT OF AN EARTHQUAKE ON A SIMPLE OSCILLATOR
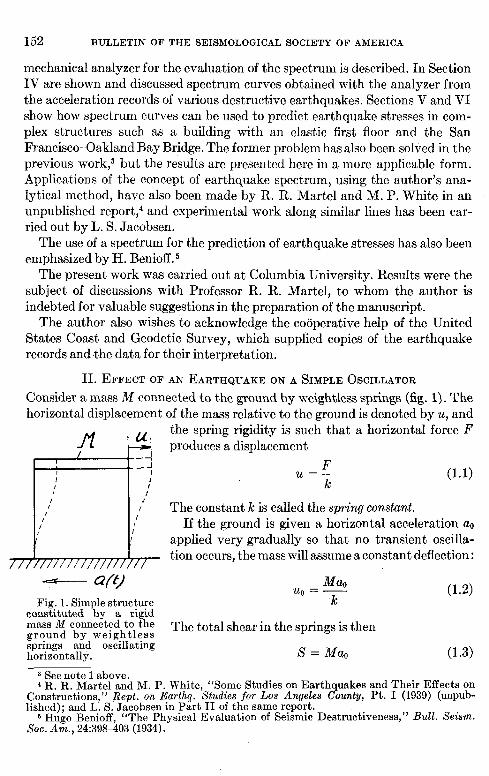
Consider a mass M connected to the ground by weightless springs (fig. 1). The
horizontal displacement of the mass relative to the ground is denoted by u, and
M 3 the spring rigidity is such that a horizontal force F
I I! produces a displacement
F I I u=-
k 0.1)
: : I1 ,I
/’ I The constant 7G is called the spring constant.
I/ : If the ground is given a horizontal acceleration uo
/ I I applied very gradually so that no transient oscilla-
////I/////////////// tion occurs, the mass will assume a constant deflection:
- a/v Ma0 uo = - (1.2)
Fig. 1. Simple structure k constituted by a rigid mass IM connected to the ground by weightless
The total shear in the springs is then
springs and oscillating horizontally. S = Mao (1.3)
3 See note 1 above. * R. R. Martel and M. P. White, “Some Studies on Earthquakes and Their Effects on
Constructions,” Rept. on Earthq. Studies for Los Angeles County, Pt. I (1939) (unpub- lished); and L. S. Jacobsen in Part II of the same report.
6 Hugo Benioff, “The Physical Evaluation of Seismic Destructiveness,” Bull. Seism. Sot. Am., 24:398-403 (1934).
A MECHANICAL ANALYZER FOR EARTHQUAKE STRESSES 153
During an earthquake the horizontal acceleration is a function a(t) of the time t. Denoting by v the displacement of the ground and neglecting the damp- ing, the equation of motion of the mass M is
M$2(u+v)+ku=0 (1.4)
The displacements u and v are taken positive to the right while the acceleration is taken positive to the left; hence 5 = -a(t), and equation (1.4) may be written
Mii + ku = Mu(t) (1.5)
The latter equation shows that the relative displacement u obeys the differen- tial equation of motion of a simple oscillator under the force Mu(t) = F(t). The earthquake is taken to start at the instant t = 0; the mass M being initially at rest, the relative displacement u as a function of time is given by the well- known solution6
or
u=&L’F’(B)sin J$(t-0)&I (1.6)
T UC-- s 2?r 0
’ u(0) sin; (t - 0) d0 (1.7)
where T = 21r d-- M
-C’ is the natural period of the oscillator.
The total shear in the springs is
S=&=M.$ J’ 0
’ u(0) sing (t - e) de
The quantity : 2?r
s r 0 t a(O) sin: (t - 0) do
(1.8)
(1.9)
is a function of time which gives the complete stress history of the oscillator; i.e., if the integration is performed with respect to 0 between the limits 0 and t, and repeated for all values of t, we obtain a function of time which according to (1.8) will give the value of the total shear X at every instant t. We are espe- cially interested in the maximum value of this function because it will give us the maximum shear produced by the earthquake in the elastic system. Denot- ing by A the maximum value of expression (1.9), the maximum shear is
S=MA (1.10) 6 Th. v. Karman and M. A. Biot, Mathematical Methods in Engineering (New York,
McGraw-Hill Book Co., 1940).
154 BULLETIN OFTHE SEISMOLOGICAL SOCIETYOFAMERICA
Comparing with (1.3), we may say that, as far as the maximum shear is con- cerned, the effect of the earthquake is equivalent to that of a constant acceler- ation A applied gradually so that only a statical deflection is produced without the occurrence of any transient oscillation.
Of course for a given earthquake the value of A depends on the parameter 2lr
appearing in expression (1.9) ; i.e., on the natural period T of the oscillator. r We refer to this quantity A as the equivalent acceleration of the earthquake for the period T.
III. EARTHQUAKE SPECTRUM MEASURED WITH ANALYZER
It will be noticed that the equivalent acceleration for a particular earthquake depends only on the period of the oscillator. We may therefore evaluate this equivalent acceleration for various oscillator periods and consider it to be a characteristic function A(T) of the period. We call this function the ac- celeration spectrum of the earthquake.
The engineering significance of this concept lies in the fact that, once the spectrum is known, it is possible to write immediately the value of the maxi- mum shear produced by the earthquake on an arbitrary simple oscillator. To obtain the shear produced by an earthquake in such a structure of period T we multiply the mass of the structure by the ordinate of the spectrum for the par- ticular value T of the abscissa. Furthermore, it is possible to extend the useful- ness of the spectrum to structures much more complicated than the one degree of freedom oscillator considered above. In fact, it will be shown in Section V, by treating the particular example of a building with an elastic first story, how the acceleration spectrum may be used to determine the maximum stresses produced by the earthquake in any complex structure.
It is relatively tedious to evaluate the spectrum by analytical methods, as this would involve the calculation of the integral (1.9) from a graphically given accelerogram a(t) and for a great number of values of both T and t. Fortunately there are simple experimental methods by which this can be done. In the pre- vious paper we suggested the use of an electrical analyzer. An accelerogram record moving in front of a photoelectric cell would transform the accelerations into voltage fluctuations which in turn would act on a system with variable tuning. However, in view of the uncertainties still attached to the now avail- able earthquake records, it occurred to us that perhaps a less accurate but simpler analyzer, using purely mechanical devices and direct reading of the original records by eye, might prove satisfactory for engineering purposes.
The principle of the analyzer which we are now going to describe is based on the properties of a torsional pendulum the point of suspension of which is given an angular oscillation with an amplitude following the earthquake accelera- tions. We denote by a the angular displacement of the pendulum mass, and by
A MECHANICAL ANALYZER FOR EARTHQUAKE STRESSES 155
I its moment of inertia. This mass is suspended by a wire of torsional spring constant c to a pivot which itself is given an arbitrary angular displacement so(t) function of time. The equation of motion of this pendulum is
Iii + c(a - a,) = 0
or
lti + Ca = cao(t) (2.1)
This equation is mathematically identical with (1.5), and therefore if the pen- dulum is initially at rest we can apply to it the solution (1.6). We find
ca0 (0) sin
or
2?r
s
t Q=--
T o a0 (13) sin’s (t - e> de
The quantity T’= 27r J
f is the natural torsional frequency of the pendulum c
when the pivot is held fixed. Comparison of this expression with (1.8) shows that if co(t) is proportional to the acceleration a(t) of an earthquake (a = Zao) the maximum amplitude am of the torsional pendulum will be a measure of the equivalent accelerator A of the earthquake for the period T(A = la,). Hence the acceleration spectrum can be plotted by using a pendulum which can be easily tuned through a required range of periods.
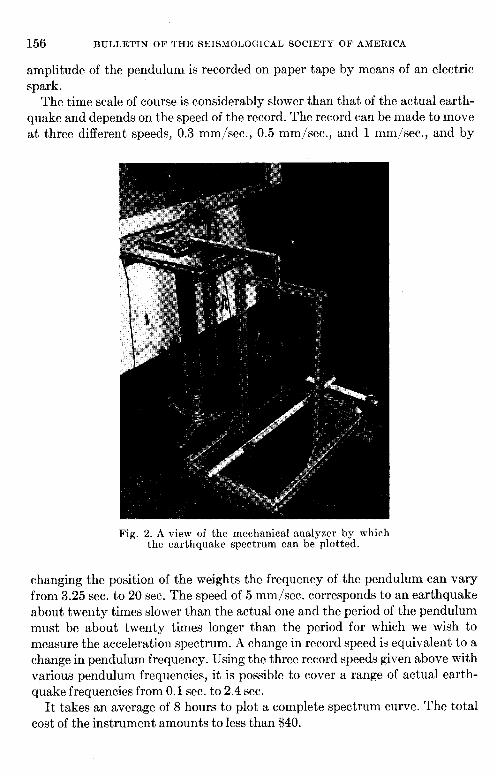
An apparatus based on this principle is shown in figure 2. The pendulum consists of a magnesium T bar carrying two movable weights and suspended horizontally to a pivot through a piano wire. The natural frequency can be varied by moving the weights along the bar, thus changing the moment of inertia of the pendulum. Magnesium has been selected for the bar in order to obtain a low residual moment of inertia and cover thereby a wider range of frequencies with a calibration curve frequency-weight position close to a straight line. The pivot mounted on ball bearings is rigidly connected to a horizontal arm terminated by a pointer. The earthquake accelerogram lies underneath this arm on a carriage which moves horizontally at low speed in the direction of the time axis. It is then possible to follow by eye the accelerogram curve with the end point of the arm and thereby give the pivot of the pendulum an angular motion proportional to the earthquake acceleration. This procedure is improved by having the record pass under a bridge made of a strip lying close to the paper. The edge of the strip is perpendicular to the time axis of the accelerograph and what the eye actually follows with the pointer is the inter- section of the accelerogram record with the edge of the bridge. The maximum
156 BULLETIN OF THE SEISMOLOGICAL SOCIETY OF AMERICA
amplitude of the pendulum is recorded on paper tape by means of an electric spark.
The time scale of course is considerably slower than that of the actual earth- quake and depends on the speed of the record. The record can be made to move at three different speeds, 0.3 mm/set., 0.5 mm/set., and 1 mm/set., and by
Fig. 2. A view of the mechanical analyzer by which the earthquake spectrum can be plotted.
changing the position of the weights the frequency of the pendulum can vary from 3.25 sec. to 20 sec. The speed of 5 mm/set. corresponds to an earthquake about twenty times slower than the actual one and the period of the pendulum must be about twenty times longer than the period for which we wish to measure the acceleration spectrum. A change in record speed is equivalent to a change in pendulum frequency. Using the three record speeds given above with various pendulum frequencies, it is possible to cover a range of actual earth- quake frequencies from 0.1 sec. to 2.4 sec.
It takes an average of 8 hours to plot a complete spectrum curve. The total cost of the instrument amounts to less than $40.
A MECHANICAL ANALYZER FOR EARTHQUAKE STRESSES 157
IV. SPECTRUM CURVES OF VARIOUS EARTHQUAKES
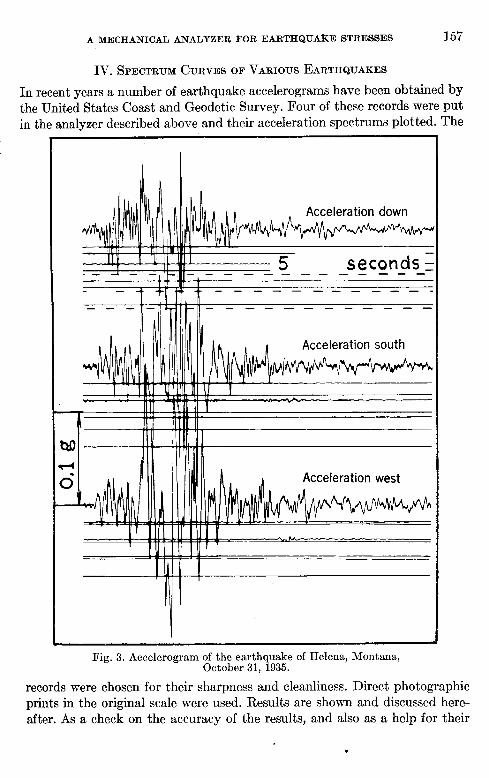
In recent years a number of earthquake accelerograms have been obtained by the United States Coast and Geodetic Survey. Four of these records were put in the analyzer described above and their acceleration spectrums plotted. The
Acceleration down
I 5 seconds I -----
--_---------
Acceleration south
dew\-
Acceleration west
Fig. 3. Accelerogram of the earthquake of Helena, Montana, October 31, 1935.
records were chosen for their sharpness and cleanliness. Direct photographic prints in the original scale were used. Results are shown and discussed here- after. As a check on the accuracy of the results, and also as a help for their
158 BULLETIN OF THE SEISMOLOGICAL SOCIETY OF AMERICA
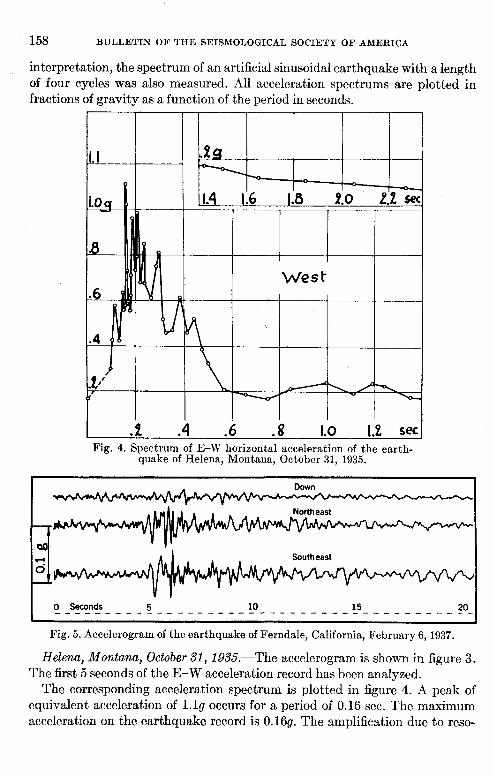
interpretation, the spectrum of an artificial sinusoidal earthquake with a length of four cycles was also measured. All acceleration spectrums are plotted in fractions of gravity as a function of the period in seconds.
I .f .4 .6 .8 I.0 Fig. 4. Spectrum of E-W horizontal acceleration of the earth-
:e of Helena, Montana, October 31, 1935.
DOW
-I Northeast
Southeast
o Seconds 5 10 15 20 --_-----_-------_-----------------_______ I
Fig. 5. Accelerogram of the earthquake of Ferndale, California, February 6, 1937.
Helena, Montana, October 31,1935.-The accelerogram is shown in figure 3. The first 5 seconds of the E-W acceleration record has been analyzed.
The corresponding acceleration spectrum is plotted in figure 4. A peak of equivalent acceleration of l.lg occurs for a period of 0.16 sec. The maximum acceleration on the earthquake record is 0.16g. The amplification due to reso-
A MECHANICAL ANALYZER FOR EARTHQUAKE STRESSES 159
nance is therefore 6.9. The epicentral distance for this shock is estimated to be from 3 to 5 miles.
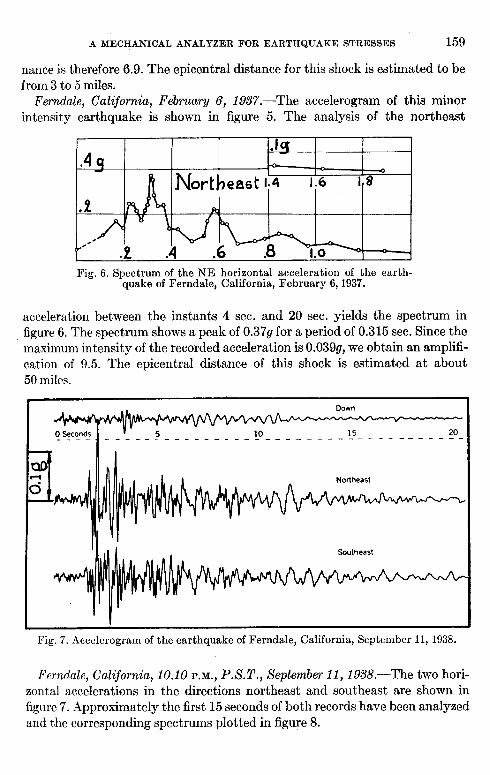
Ferndale, California, February 6, 19S7.-The accelerogram of this minor intensity earthquake is shown in figure 5. The analysis of the northeast
Fig. 6. Spectrum of the NE horizontal acceleration of the earth- quake of Ferndale, California, February 6,1937.
acceleration between the instants 4 sec. and 20 sec. yields the spectrum in figure 6. The spectrum shows a peak of 0.379 for a period of 0.315 sec. Since the maximum intensity of the recorded acceleration is O.O39g, we obtain an amplifi- cation of 9.5. The epicentral distance of this shock is estimated at about 50 miles.
Northeast
Southeast
Fig. 7. A4ccelerogram of the earthquake of Ferndale, California, September 11, 1938.
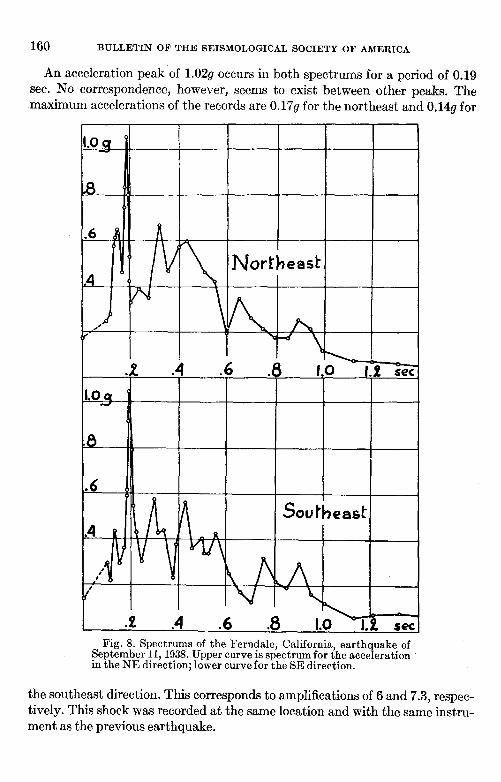
Ferndale, California, 10.10 P.M., P.S.T., September 11, I$.%?.-The two hori- zontal accelerations in the directions northeast and southeast are shown in figure 7. Approximately the first 15 seconds of both records have been analyzed and the corresponding spectrums plotted in figure 8.
.Z .4 .6 .8 Lo&! set :
160 BULLETIN OF THE SEISMOLOGICAL SOCIETY OF AMERICA
An acceleration peak of 1.029 occurs in both spectrums for a period of 0.19 sec. No correspondence, however, seems to exist between other peaks. The maximum accelerations of the records are 0.17g for the northeast and 0.149 for
Fig. 8. Spectrums of the Ferndale, California, earthquake of September l&1938. Upper curve is spectrum for the acceleration in the NE direction; lower curve for the SE direction.
the southeast direction. This corresponds to amplifications of 6 and 7.3, respec- tively. This shock was recorded at the same location and with the same instru- ment as the previous earthquake.
A MECHANICAL ANALYZER FOR EARTHQUAKE STRESSES 161
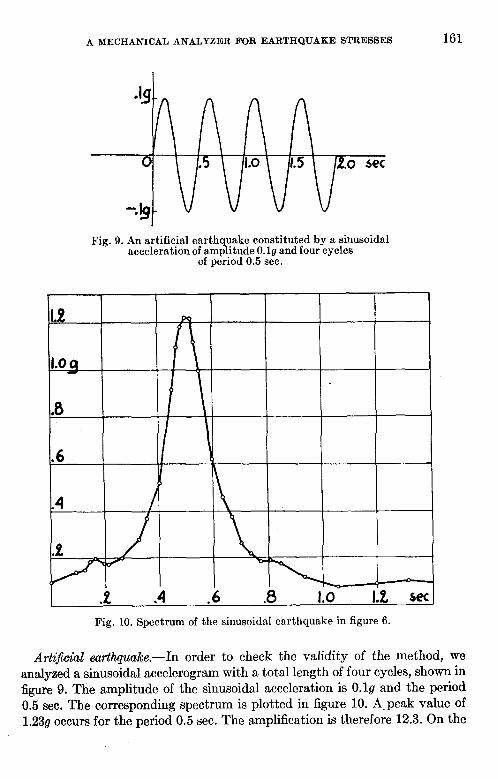
Fig. 9. An artificial earthquake constituted by a sinusoidal acceleration of amplitude O.lg and four cycles
of period 0.5 sec.
Fig. 10. Spectrum of the sinusoidal earthquake in figure 6.
Artificial earthquake.--In order to check the validity of the method, we analyzed a sinusoidal accelerogram with a total length of four cycles, shown in figure 9. The amplitude of the sinusoidal acceleration is O.lg and the period 0.5 sec. The corresponding spectrum is plotted in figure 10. A.peak value of 1.238 occurs for the period 0.5 sec. The amplification is therefore 12.3. On the
162 BULLETIN OF THE SEISMOLOGICAL SOCIETY OF AMERICA
other hand, it is possible to calculate the amplificat,ion. A sinusoidal accelera-
tion of unit amplitude sin F introduced in expression 1.9 gives
2?r
s
t 27r 2a0 1 2at t 23rt sin-(t-@sin---cZdB=-sin----cos-
To T T 2T TT
The maximum values of this function occur very closely at the points t = g y
T3T ’ 2 ‘***
etc. After 4 cycles t = 4T and the value of this maximum is b =
12.5, which is very close to the experimental value found above. We conclude that the damping of the analyzer has a negligible effect even in the case of relatively sharp peaks.
Remarks.-One of the most striking features of these spectrum curves is their great number of sharp peaks in the region of shorter periods. This would seem to lead to the conclusion that earthquakes contain a great number of individual periods. It might be advanced that these special features are due to the characteristics of the recording instrument itself or of the building in which it is located. The instrument being highly damped (amplitude ratio l/10), and its period being 0.1 second, it cannot produce any of the sharp peaks appearing in the spectrums described above. The motion of the building undoubtedly exerts an influence on the recording instrument in its basement, since the ground on which the building rests is elastic. This effect, however, does not seem to be a major one, judging from the two Ferndale records of 1937 and 1938 obtained in the same building and having a quite different distribution of peaks in their respective spectrums. Comparing the spectrums for the 1938 Ferndale earthquake in the northeast and southeast directions, we notice that the individual peaks do not correspond and seem to have little significance. The spectrum envelope, on the other hand, is of the same magnitude for both curves, and therefore should constitute the basic information for the prediction of earthquake stresses. On the other hand, the existence of individual sharp peaks could explain the rather large variations in the destructiveness of earth- quakes on similar structures at the same location, since a slight difference in natural frequency of a structure might correspond to large differences in the equivalent acceleration. Another important feature is the high value of the equivalent acceleration for the shorter periods. The Helena and 1938 Ferndale earthquakes show equivalent acceleration of the order of gravity for periods around 0.2 sec. This would indicate that for structures of equal strength the earthquake is more destructive on those of periods around 0.2 to 0.5 sec., which corresponds to buildings of small to medium heights. From observation of the effect of actual earthquakes on buildings, a magnitude of the equivalent ac- celeration of the order of gravity does not seem possible, but it must be kept in
A MECHANICAL ANALYZER FOR EARTHQUAKE STRESSES 163
mind that the spectrum curves given above correspond to negligible damping. In fact it must be expected that when the amplitude of the stress reaches the yield point in some part of the structure, plastic deformation and dry friction will produce by hysteresis a dissipation of energy which will counteract any further increase in stress. Assuming, for instance, that this type of damping sets in as soon as the equivalent acceleration is greater than 0.2g, the stresses will be considerably less than those produced in a completely undamped structure.
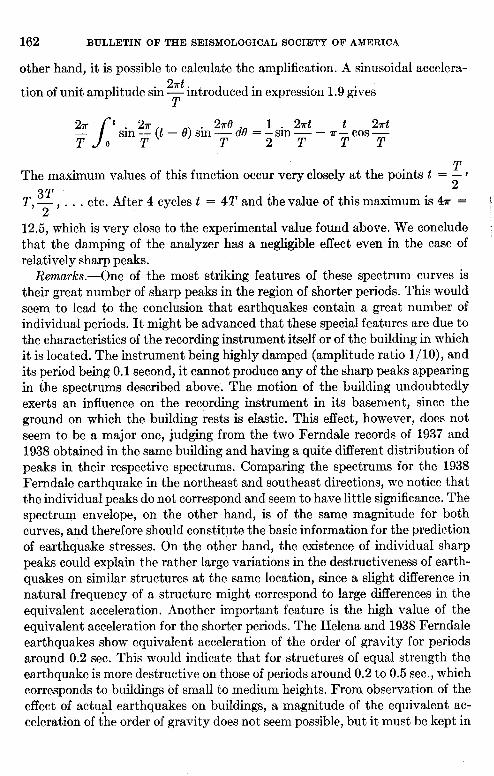
Fig. 11. Standard spectrum proposed to represent those in figure 4 and figure 8 with special reference to design.
The damping considered here sets in only at large amplitudes of vibration and therefore can be observed only during earthquakes. Another type of damping is due to the dissipation of the energy by radiation in the elastic soil support- ing the structure. The importance of this type of damping was the object of a theoretical investigation by K. Sezawa and K. Kanai.? These remarks point to the importance of the damping as a factor in reducing earthquake stresses.
It was suggested in the previous paper that for design purposes standard
spectrums should be established, giving the equivalent acceleration as a func- tion of the frequency. These standard curves would be the envelopes of a collection of earthquake spectrums and could be made to depend on the nature and magnitude of the damping and on the location. Although the previously analyzed data do not lead to final results regarding such standard curves, we may nevertheless reasonably conclude that the spectrum will generally be a function decreasing with the period for values of the latter greater than about
’ “Some New Problems of Forced Vibrations of a Structure,” Bull. Earthq. Res. Inst. (Tokyo), 12:845 (1934); “Decay in the Seismic Vibrations of a Simple or Tall Structure by Dissipation of Their Energy into the Ground,” ibid., 13:68 (1938).
164 BULLETIN OFTHE SEISMOLOGICAL SOCIETY OF AMERICA
0.2 sec. A standard curve for earthquakes of the Helena and Ferndale types mentioned above for values T > 0.2 sec. could very well be the simple hyperbola
A = F and for TC0.2 sec., A = g(4T + 0.2), where T is the period in
seconds and g the acceleration of gravity. This standard spectrum is plotted in figure 11. Whether this.function would fit other earthquakes can only be decided by further investigations.
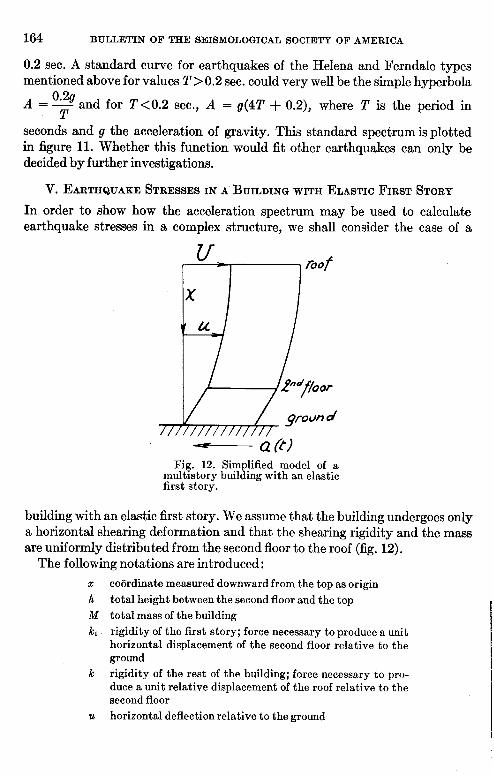
V. EARTHQUAKE STRESSES IN A BUILDING WITH ELASTIC FIRST STORY
In order to show how the acceleration spectrum may be used to calculate
earthquake stresses in a complex structure, we shall consider the case of a
- a@) Fig. 12. Simplified model of a
multistory building with an elastic first story.
building with an elastic first story. We assume that the building undergoes only a horizontal shearing deformation and that the shearing rigidity and the mass are uniformly distributed from the second floor to the roof (fig. 12).
The following notations are introduced :
X coiirdinate measured downward from the top as origin
h total height between the second floor and the top
M total mass of the building
kl rigidity of the first story; force necessary to produce a unit horizontal displacement of the second floor relative to the ground
k rigidity of the rest of the building; force necessary to pro- duce a unit relative displacement of the roof relative to the second floor
u horizontal deflection relative to the ground
A MECHANICAL ANALYZER FOR EARTHQUAKE STRESSES 165
The method here presented implies knowledge of the natural modes of oscilla- tion of the structure. The equation for the free oscillation of the building is
hkd”” = J!f CPU 8X2 h at2
with the boundary conditions
(4.1)
au 0 _= ax
atx=O
hkz= -kIu atx=h
The deflection curve of each mode is found to be
z&(x) = ui co9 hi; (4.2)
where Ui represents an arbitrary roof amplitude of the 9 mode and X is the itb root of the equation
XtanX =1 (4.3)
The parameter kJlc is the ratio of the elasticity of the first story to that of the rest of the building. We shall call it the elasticity ratio.
The natural periods of the building are
(4.4)
The quantity 4 M c is the fundamental period of the building for an in6nitely
rigid first story.
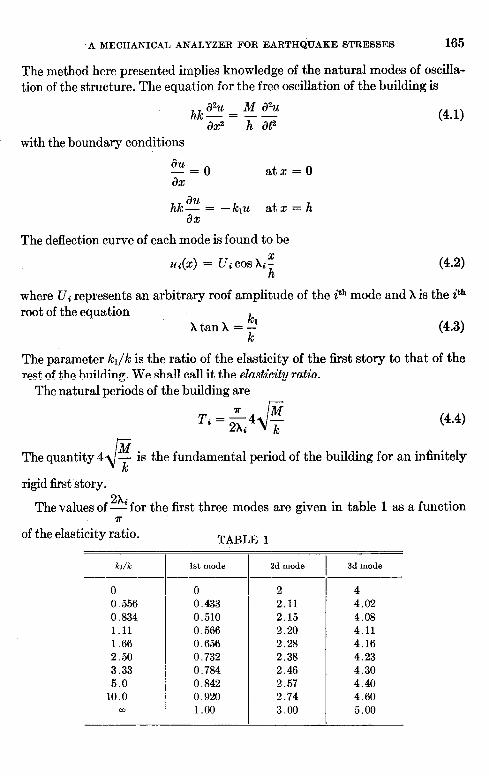
The values of 3 for the first three modes are given in table 1 as a function n-
of the elasticity ratio.
k&C _____-
0 0.556 0.834 1.11 1.66 2.50 3.33 5.0
10.0 co
-_
-
TABLE 1
1st mode -
0 0.433 0.510 0.566 0.656 0.732 0.784 0.842 0.920 1.00
2d mode 3d mode
2 4 2.11 4.02 2.15 4.08 2.20 4.11 2.28 4.16 2.38 4.23 2.46 4.30 2.57 4.40 2.74 4.60 3.00 5.00
166 BULLETIN OF THE SEISMOLOGICAL SOCIETY OF AMERICA
We shall now use the results just given to derive the forced oscillations and the stresses produced by the earthquake. It is well known that any motion can be considered as a superposition of oscillations of each mode. Each of these modes behaves like a simple oscillator and their motions are independent of each other. We may therefore apply to each mode separately the treatment used above for the case of a o,ne degree of freedom system.
Let us imagine that by some complicated restraining mechanism the build- ing is only allowed to deflect in a shape identical with that of the first mode (i = 1). The whole building then becomes a one degree of freedom system. Suppose now that a unit horizontal acceleration is gradually applied to the ground so slowly that no oscillations are produced; what will be the deflection of the building? The answer to this question is easily obtained by using the energy method. The effect of a unit acceleration is the same as if a uniformly distributed horizontal force equal to M/h per unit length were applied gradu- ally to the building. The work done by this force is
1M h
s
1M h -- 2h o
uldx =--4Ju1 cos * dx 2h s 0 h
On the other hand, the elastic potential energy is
1 M
s
h 1 M
s
h
-f&2- u12 dx = - w?- U12 cos2 Lx dx 2 h o 2 h 0 h
(4.5)
(4.6)
with w1 = f . The latter expression is really that of the kinetic energy in the 1
fundamental mode of vibration at the instant of zero deflection, but we know that this kinetic energy is equal to the potential energy at the instant of maxi- mum deflection. Expressions (4.5) and (4.6) must be equal, hence
s h
cosXxdx = w2U 11 s
hcos2kxdx 0 h 0 h
(4.7)
which is an equation for the roof deflection U1 of the fundamental mode due to a unit constant acceleration. We find
(4.8)
The distribution of the total shearing force along the height is given by the expression
kh!!!!! = -_Lux sin? dx
11 h
(4.9)
A MECHANICAL ANALYZER FOR EARTHQUAKE STRESSES 167
Its maximum value occurs for x = h and is constant t,hroughout the first story,
hence the maximum total shear is
with
(4.10)
(4.11)
’ Comparing with expression (1.3), we see that in a building with distributed mass and elasticity the fundamental mode picks up only a fraction Cl of the shear which would be produced in a one degree of freedom system of the same
Icl mass. This coefficient Cl is a function only of the elasticity ratio - .
k The action of an earthquake on the first mode of the building can now be
deduced as in the case of a simple oscillator. The maximum shear generated in the lower mode will be
x1 = ClMA(T1) (4.12)
where A(!?,) is the value of the equivalent acceleration for the fundamental period T1 of the building.
In the same way the maximum shear in each of the higher modes is
xi = CiMA(Ti) (4.13)
where Ti is the period of the particular mode considered. The value of the CO-
efficient Ci for the higher modes is
Ci = +21”:i$Q (4.14)
Comparing with the expression (4.11) for C1, we notice that the factor sin Xi in the numerator occurs with the first power instead of the square. This corre- sponds to the fact that for the higher mode the maximum stress occurs for
sin 2 = 1 and not foa x = h. h
The coefficients Ci for the three lower modes are tabulated in table 2 as functions of the elasticity ratio.
It appears from the values in tables 1 and 2 that the effect of an elastic first story may be considered as twofold. According to table 2, the distribution of stress among the various modes will be modified. This effect, however, is of little practical significance since the values of C1 show that the fundamental mode will generally carry the greatest part of the shear in all cases. Hence, from the designer’s viewpoint, the effect of an elastic first story is essentially
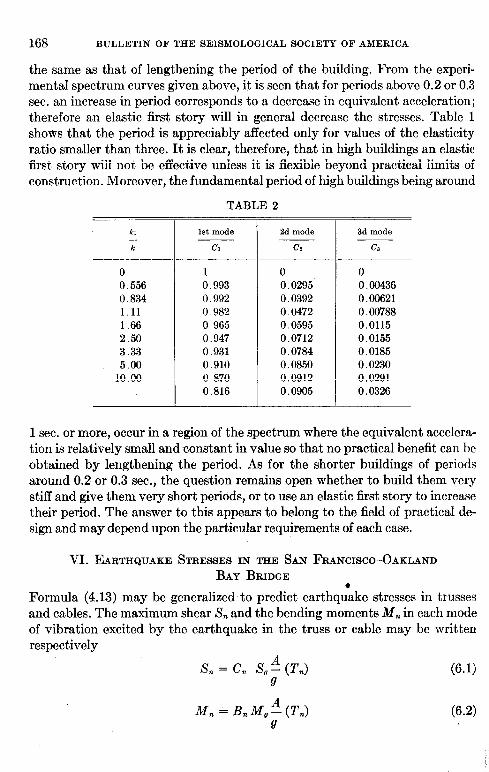
168 BULLETIN OF THE SEISMOLOGICAL SOCIETY OF AMERICA
the same as that of lengthening the period of the building. From the experi-
mental spectrum curves given above, it is seen that for periods above 0.2 or 0.3
sec. an increase in period corresponds to a decrease in equivalent acceleration;
therefore an elastic first story will in general decrease the stresses. Table 1
shotis that the period is appreciably affected only for values of the elasticity
ratio smaller than three. It is clear, therefore, that in high buildings an elastic
first story will not be effective unless it is flexible beyond practical limits of
construction. Moreover, the fundamental period of high buildings being around
TABLE 2
0 0.556 0.834 1.11 1.66 2.50 3.33 5.00
10.00
-
.-
1st mode Cl
----
1 0.993 0.992 0.982 0.965 0.947 0.931 0.910 0.870 0.816
-
2d mode
Ca
3d mode
c3
0 0 0.0295 0.00436 0.0392 0.00621 0.0472 0.00788 0.0595 0.0115 0.0712 0.0155 0.0784 0.0185 0.0850 0.0230 0.0912 0.0291 0.0905 0.0326
1 sec. or more, occur in a region of the spectrum where the equivalent accelera-
tion is relatively small and constant in value so that no practical benefit can be
obt,ained by lengthening the period. As for the shorter buildings of periods
around 0.2 or 0.3 sec., the question remains open whether to build them very
stiff and give them very short periods, or to use an elastic first story to increase
their period. The answer to this appears to belong to the field of practical de-
sign and may depend upon the particular requirements of each case.
VI. EARTHQUAKE STRESSES IN THE SAN FRANCISCO-OAKLAND
BAY BRIDGE
Formula (4.13) may be generalized to predict earthqlake stresses in trusses
and cables. The maximum shear S, and the bending moments M, in each mode
of vibration excited by the earthquake in the truss or cable may be written
respectively
S, = C, S,! (T,) (6.1) 9
(6.2)
A MECHANICAL ANALYZER FOR EARTHQUAKE STRESSES 169
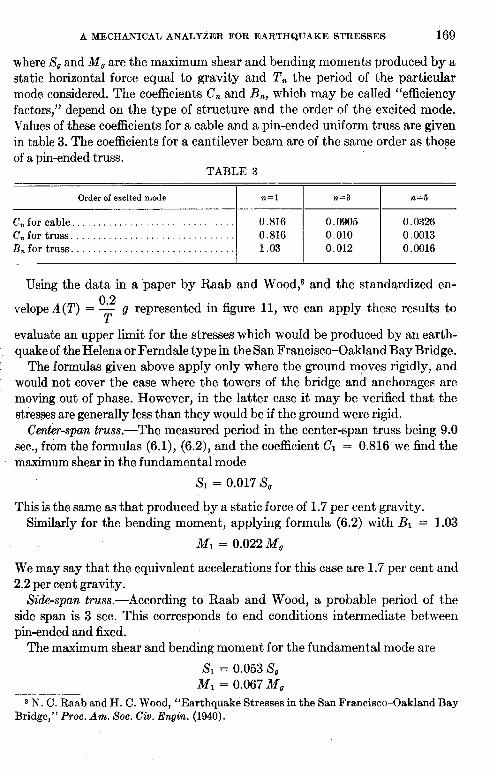
where S, and M, are the maximum shear and bending moments produced by a static horizontal force equal to gravity and T, the period of the particular mode considered. The coefficients C, and B,, which may be called “efficiency factors,” depend on the type of structure and the order of the excited mode. Values of these coefficients for a cable and a pin-ended uniform truss are given in table 3. The coefficients for a cantilever beam are of the same order as those of a pin-ended truss.
TABLE 3
Order of excited mode n=l n=3 n=5
C,forcsble............................... 0.816 0.0905 0.0326 C,fortruss............................... 0.816 0.010 0.0013 B,fortruss............................... 1.03 0.012 0.0916
Using the data in a paper by Raab and Wood,8 and the standardized en-
velope A(!!‘) = y g represented in figure 11, we can apply these results to
evaluate an upper limit for the stresses which would be produced by an earth- quake of the Helena or Ferndale type in the San Francisco-Oakland Bay Bridge.
The formulas given above apply only where the ground moves rigidly, and would not cover the case where the towers of the bridge and anchorages are moving out of phase. However, in the latter case it may be verified that the stresses are generally less than they would be if the ground were rigid.
Center-span truss.-The measured period in the center-span truss being 9.0 sec., from the formulas (6.1), (6.2), and the coefficient Cl = 0.816 we find the maximum shear in the fundamental mode
s1 = 0.017 s,
This is the same as that produced by a static force of 1.7 per cent gravity. Similarly for the bending moment, applying formula (6.2) with B1 = 1.03
Ml = 0.022 M,
We may say that the equivalent accelerations for this case are 1.7 per cent and 2.2 per cent gravity.
Side-span truss.-According to Raab and Wood, a probable period of the side span is 3 sec. This corresponds to end conditions intermediate between pin-ended and fixed.
The maximum shear and bending moment for the fundamental mode are
x1 = 0.053 s, Ml = 0.067 M,
8 N. C. Raab and H. C. Wood, “Earthquake Stresses in the San Francisco-Oakland Bay Bridge,” Proc. Am. Sot. Ciu. Engin. (1940).
170 BULLETIN OF THE SEISMOLOGICAL SOCIETY OF AMERICA
The equivalent accelerations for the shear force and bending moments are respectively 5.3 per cent and 6.7 per cent gravity.
Cables.-The periods for the center-span and side-span cables are respec- tively 5.9 and 3.1 sec. Hence the corresponding maximum shear stresses for the fundamental mode of these cables are
& = 0.027 S, x1 = 0.053 s,
The equivalent accelerations are 2.7 per cent and 5.3 per cent gravity. Higher modes.-The stresses in the higher modes are smaller than in the
fundamental. Take, for instance, the case of the side-span truss. The excited symmetric mode next to the fundamental will have a period around 0.3 sec. Using the coefficients C3 = 0.010 and Ba = 0.012 of table 3, we find the shear and the bending moment.
s3 = 0.0066 s, MI = 0.008 M,
These stresses are negligible as compared to those in the fundamental mode. A similar conclusion holds for the cables.
Remarks.-We have calculated the stresses which the Helena and Ferndale earthquakes would produce in the San Francisco-Oakland Bay Bridge and found that a stress corresponding to a static force of 6.7 per cent gravity could be produced in the side-span truss. The peak acceleration of the earthquakes considered is about k7 per cent gravity. Since stronger earthquakes with a peak intensity of 30 to 40 per cent gravity are not improbable, it seems that we should have to consider side-span stresses corresponding to an equivalent acceleration of about 10 to 12 per cent gravity. We must remember, however, that the effect of the damping has been neglected. This effect for large stresses can be quite considerable, owing to the friction at the expansion joints, local plastic deformations, and the dissipation of energy by radiation in the ground through the foundation and the anchorage.
VII. CONCLUSIONS
From the viewpoint of the designer the basic information regarding the dynam- ic effect of earthquakes on undamped structures can be condensed in a simple curve, which we call an earthquake spectrum. If the spectrum of a given earth- quake is known, an upper limit for the stresses produced by that earthquake in any structure may be readily evaluated if we know the natural periods and modes of oscillation of the structure. A number of strong-motion records have been analyzed and their spectrums measured by means of a mechanical ana- lyzer. Results for the Helena, 1935, and Ferndale, 1938, earthquakes show that for periods around 0.2 sec. the equivalent acceleration can be as high as
A MECHANICAL ANALYZER FOR EARTHQUAKE STRESSES 171
gravity. In other words, during those earthquakes an undamped structure of 0.2-sec. period would undergo a horizontal shear equal to its own weight. Observations of the effect of actual earthquakes indicate that for most struc- tures such high stresses are not reached and this points out the importance of the damping or other causes of stress reduction. Considerable hysteresis damp- ing will set in as soon as the yield point in some part of the building is reached. The equivalent acceleration falls rapidly for increasing periods, so that increas- ing the period of a structure increases its resistance to earthquakes. The effect of an elastic first story in a building is found to be mainly the same as that of lengthening the period. Consequently the earthquake stresses will be reduced, but the effect will only be appreciable in short buildings of periods around 0.2 to 0.5 sec. When we possess a collection of earthquake spectrums at a given lo- cation, it is suggested that a simplified envelope should be used as a standard spectrum for the purpose of design in that region, Further investigation is needed to establish such reliable spectrum envelopes and correct them for the influence of the damping and other causes of stress reduction.
.
COLUMBIA UNIVERSITY,
NEW YORK, N. Y.